




Abstract
Vowels provide the acoustic foundation of communication through speech and song, but little is known about how the brain orchestrates their production. Positron emission tomography was used to study regional cerebral blood flow (rCBF) during sustained production of the vowel /a/. Acoustic and blood flow data from 13, normal, right-handed, native speakers of American English were analyzed to identify CBF patterns that predicted the stability of the first and second formants of this vowel. Formants are bands of resonance frequencies that provide vowel identity and contribute to voice quality. The results indicated that formant stability was directly associated with blood flow increases and decreases in both left- and right-sided brain regions. Secondary brain regions (those associated with the regions predicting formant stability) were more likely to have an indirect negative relationship with first formant variability, but an indirect positive relationship with second formant variability. These results are not definitive maps of vowel production, but they do suggest that the level of motor control necessary to produce stable vowels is reflected in the complexity of an underlying neural system. These results also extend a systems approach to functional image analysis, previously applied to normal and ataxic speech rate that is solely based on identifying patterns of brain activity associated with specific performance measures. Understanding the complex relationships between multiple brain regions and the acoustic characteristics of vocal stability may provide insight into the pathophysiology of the dysarthrias, vocal disorders, and other speech changes in neurological and psychiatric disorders.
Introduction
Human vocalization is the foundation of communication through speech and song (Kreiman and Sidtis, 2011). Phonation begins with a periodic source of sound produced by the vibration of the vocal folds as air is expelled from the lungs. The result is a harmonically complex sound with a pitch that is associated with the fundamental frequency (F0) of the vocal fold vibration. This sound passes through the throat, oral, and nasal cavities of the vocal tract where the resonance characteristics of the anatomic structures reinforce the acoustic energy in certain frequency bands. The frequency spectrum of this signal imparts a quality to the sound; the frequencies of the spectral peaks, especially at the first several resonance frequencies, provides an acoustic–auditory pattern that can be identified as a vowel. The acoustic energies at these resonance frequencies are referred to as formants, which can be changed by altering the shape of the vocal tract, thereby changing the identity of the vowel (Hillenbrand et al., 2006; Klatt, 1982).
Whereas the F0 of a vocalization, perceived as its pitch, is determined by the vibratory frequency of the vocal folds, the frequencies of the formants are largely determined by the shape of the vocal tract. The first two formants (F1, F2) play a significant role in vowel identity, and they generally reflect the height and position of the tongue and the position and shape of the lips during phonation (Kent and Read, 1992). During speech, the movement of the articulators creates a dynamic system with changes in articulator gestures leading to transitions in formant frequencies as the utterance enters and exits relatively steady-state vowel segments.
Vowels have a central role in speech production as they provide intervals of periodic sound amidst the briefer segments of silence and noise that combine to convey spoken language. For models of speech production, vowels play a significant role as islands of relative stability for motor speech planning. The articulatory gesture necessary to produce a formant pattern for a target vowel can be thought of as providing a set of reference values roughly analogous to an equilibrium point, an orosensory goal, or an acoustic target in various speech production and motor control models (Latash, 2010; Lindblom et al., 1979; Perkell, 1980). Further, changes in vocal tract constriction shift formant values into acoustic regions that act as cues for speech perception (Browman and Goldstein, 1992; Story and Bunton, 2010). A speaker's response to manipulations of the acoustic properties of auditory feedback during vowel production further demonstrates the dynamic relationship between control of the vocal tract and the production of what is perceived as the appropriate target vocalization. Speakers will adjust their vocalization to compensate for alterations in the formant frequencies (Houde and Jordan, 1998; Purcell and Munhall, 2006) or F0 (Elman, 1981; Jones and Munhall, 2000; Larson et al., 2007) of the acoustic feedback provided to them during speech production.
In speech motor planning, vowels appear to be central to a process that involves specifying articulatory targets and the use of feed-forward and feed-back information that embodies a dynamic state representation or internal model of the status and goals of the speech system (Houde and Nagarajan, 2011).
Another dimension of the capabilities of the vocal control system is demonstrated during singing. Experienced singers have the ability to manipulate their vocal resonance frequencies as a function of the F0 required to produce the pitch required by a musical score. In a study of soprano singers, the resonance frequencies for the first and second formants did not vary significantly with F0 at low frequencies, consistent with a speaking mode. However, when the sung F0 exceeded the first resonance frequency typical in the speaking mode, the first resonance frequency increased with F0 to a value slightly above that of the F0 (Joliveau et al., 2004) by increasing mouth opening (Sundberg and Skoog, 1997). This has the potential for enhancing loudness without increased effort, but at the expense of decreased vowel intelligibility (Sundberg, 1975, 1977; Sundberg and Skoog, 1997; Titze, 1988). The tuning for the second resonance frequency appears to be smaller than that for the first resonance frequency (Joliveau et al., 2004). A similar pattern was observed in professional male singers, with a further difference observed in classical and nonclassical singing styles (Sundberg et al., 2011).
Thus, whereas for speaking, there is a mode of vocal control that likely optimizes vowel intelligibility, singing demonstrates a wider range of control of F0 and formant frequencies in a situation in which vowel intelligibility can be sacrificed for melodic line and vocal projection (Hollien et al., 2000). These abilities provide further evidence of a degree of independence in the control of the formant frequencies. Enhanced control of vocal tract resonances can also be found in the singer's formant, a concentration of acoustic energy in the range between 2 and 3 kHz, which allows a trained singer to be better heard in the presence of an orchestra (Bartholomew, 1934; Schutte and Miller, 1985; Sundberg, 1973, 1974, 2001).
In spite of the importance of vowels in spoken communication, and the ability to control formant frequencies during singing, little is known about the neural systems responsible for the control of their acoustic features. The perceived pitch in speech prosody and in musical notes has been associated with the right cerebral hemisphere (Sidtis and Feldmann, 1990; Sidtis and Van Lancker Sidtis, 2003; Sidtis and Volpe, 1988; Van Lancker and Sidtis, 1992; Zatorre et al., 1992), especially when the acoustic signals are complex (Sidtis, 1980). In contrast, disruption of formant production yielding abnormal vowels during speech does not appear to be associated with a specific neurological syndrome, but disordered vowels are a feature of many forms of dysarthria (Darley et al., 1969; Duffy, 2013).
Functional imaging data have not yet provided a clear picture of the neurological control of vowel production. Positron emission tomographic (PET) studies demonstrated a bilateral pattern of regional cerebral blood flow (rCBF) during sustained vowel production when compared with a quiet condition (Sidtis et al., 1999). Similarly, a functional magnetic resonance imaging (fMRI) activation study found 28 activated regions, 15 on the left, 13 on the right, including cortex, basal ganglia, thalamus, and cerebellum, when compared to a resting baseline condition (Sörös et al., 2006). When vowel production was grouped together with consonant–vowel syllable production for a baseline comparison using fMRI, Ghosh and coworkers (2008) found a large number of bilateral cortical and subcortical activations. However, when vowels alone were contrasted with consonant–vowel syllables, whole brain analyses revealed no significant activations. Using both diffusion tensor probabilistic tractography and fMRI functional connectivity, Simonyan and associates (2009) found that the laryngeal motor cortices had bilateral structural organization, but while there was bilateral activity during vowel production, this activity was greater on the left-side. Finally, an fMRI study that examined the vocal and brain responses to experimentally altered F1 feedback found that in the F1 shifted condition, bilateral responses in the superior temporal regions were associated with responses in the right frontal areas (Tourville et al., 2008).
The present study was undertaken to extend a performance-based functional connectivity approach recently applied to mapping CBF patterns predicting speech rate (Sidtis, 2012a,b) to vocal stability during sustained vowel production. This approach first determines if there is a linear combination of brain regions in which activity (i.e., blood flow) predicts performance. The second step examines the relationships between predictor regions and other brain regions in the data set. While not directly linked to the behavioral measure, these secondary associated regions suggest an expanded network that reflects a broader system in which the primary predictors operate. While fluent speech is a temporally dynamic complex process, understanding the neurological system involved in maintaining stability in the vocal characteristics of vowel production is an important step in understanding the neurology of vocal communication. Sustained vowel production is routinely used as part of the clinical examination of voice and speech. The evidence from speech and singing demonstrates that the lower formants can be controlled with a high degree of independence, suggesting that there are differences in the neurological systems that control the vocal and articulatory gestures that produce these acoustic features.
Materials and Methods
Participant population
H2 15O PET data from 13 right-handed, native speakers of English were used in this study. The group consisted of eight females and five males with a mean (±standard deviation) age of 43±11 years. They had been screened to exclude confounding neurologic, psychiatric, or medical disorders, as well as current medication or recreational drug use. This group was originally studied as part of a larger project using PET to investigate several genotypes of spinocerebellar ataxia and they have been described previously (Sidtis et al., 1999, 2003). All subjects provided informed consent to the protocol according to standards established by the Declaration of Helsinki and approved by the Institutional Review Board of the University of Minnesota Medical School.
Behavioral task
Subjects were instructed to take a breath then produce the vowel /a/ in a steady fashion on that breath. They were asked to repeat this as necessary until asked to stop after 60 sec. The vowel productions were started 15 sec before the H2 15O reached the brain, based on the delay between injection and brain detection during an initial test injection. The onset of the behavioral task with respect to the injection time was modified as necessary during the scanning sequence to maintain the temporal relationship between vowel productions and scan acquisition (i.e., initiating vowel productions 15 sec before PET data acquisition). Each subject was scanned four times while producing sustained /a/ vowels (Sidtis et al., 1999).
The vowel productions were recorded during scanning for subsequent analyses. For each scan, an average of 11.5±4.1 sec during the steady portions of each vowel production was analyzed using PRAAT (Boersma and Weenink, 2009). There was an average of 6.9±5.3 productions during each scan. Frequency values for each acoustic measure were obtained every 6.25 msec for each vocal production and means and standard deviations were determined for each production. The performance measure of stability was the average coefficients of variation (COV: standard deviation/mean), calculated as a percentage: For each scan and subject, grand means (the average COVs for all of the productions during that scan) were calculated. Thus, a single average COV was derived as representative of the vowel productions for each scan, for each subject.
PET image acquisition
There are important differences between PET and fMRI estimates of CBF that should be noted. With fMRI, the blood-oxygen-level dependent (BOLD) signal is continuously energized by repeated magnetic pulsations. BOLD responses are estimated several seconds following stimulation using a hypothetical hemodynamic response curve. Because of movement artifact, overt speech typically ends before the acquisition of the temporally delayed signal of interest. Using a slow-bolus injection of labeled compound (e.g., H2 15O) with PET (Dhawan et al., 1986), there is a 30 sec window of maximum sensitivity during uptake of the isotope in brain (Silbersweig et al., 1993). PET data acquisition occurs while the behavior under study is being performed. Performance typically begins 15 sec before brain uptake and continues through the uptake period (e.g., Sidtis et al., 1999, 2003, 2006, 2010). As this is a single injection technique and not a continuous perfusion, continued task performance following brain uptake does not further enhance the signal (Silbersweig et al., 1993). These scans characterize average brain activity over a longer period and do not require fitting with a hemodynamic response curve.
Image data analysis
As previously described (Sidtis et al., 1999, 2003, 2006, 2010), a set of 22 regions of interest (11 left–right pairs) were extracted from each image. These regions represented areas that exhibited a change in blood flow during one or more speech-related tasks performed by the same group of normal subjects who were studied using a single-task block design over three scanning sessions. The tasks were: syllable repetition, sustained vowel production, and repetitive lip closure. A library of ROIs was generated. The ROIs were larger than the area of response while still maintaining gross anatomic boundaries. This strategy acknowledges individual differences in brain anatomy avoiding the requirement that all subjects respond with a common set of voxels (Sidtis, 2007, 2012a,b). A threshold was applied to each region so that voxels corresponding to the highest 25% of values in the brain volume were included in the calculation of the mean for each region for each subject. Thresholding effectively reduces the size of the ROI without failing to capture the area of highest blood flow on an individual basis. All ROI values were normalized for global effects by multiplying each regional value by the ratio of the highest global value in the data set divided by the global value for the scan from which the region was extracted (Sidtis et al., 2003, 2006, 2010).
In the first step of the performance-based connectivity analysis (Sidtis, 2012a,b), the set of 22 normalized regions of interest were used as independent measures in separate step-wise multiple linear regression procedures (SPSS, 1997) to predict the COV for F1 and F2. While ROIs are not completely independent, the step-wise procedure adds and rejects regions in an iterative process to identify the best linear combination to predict the dependent measure, in this case, the COV for F1 and F2. Regions included in the regression solutions are considered primary predictors of the dependent behavioral measure. This is depicted in the top portion of Figure 1.
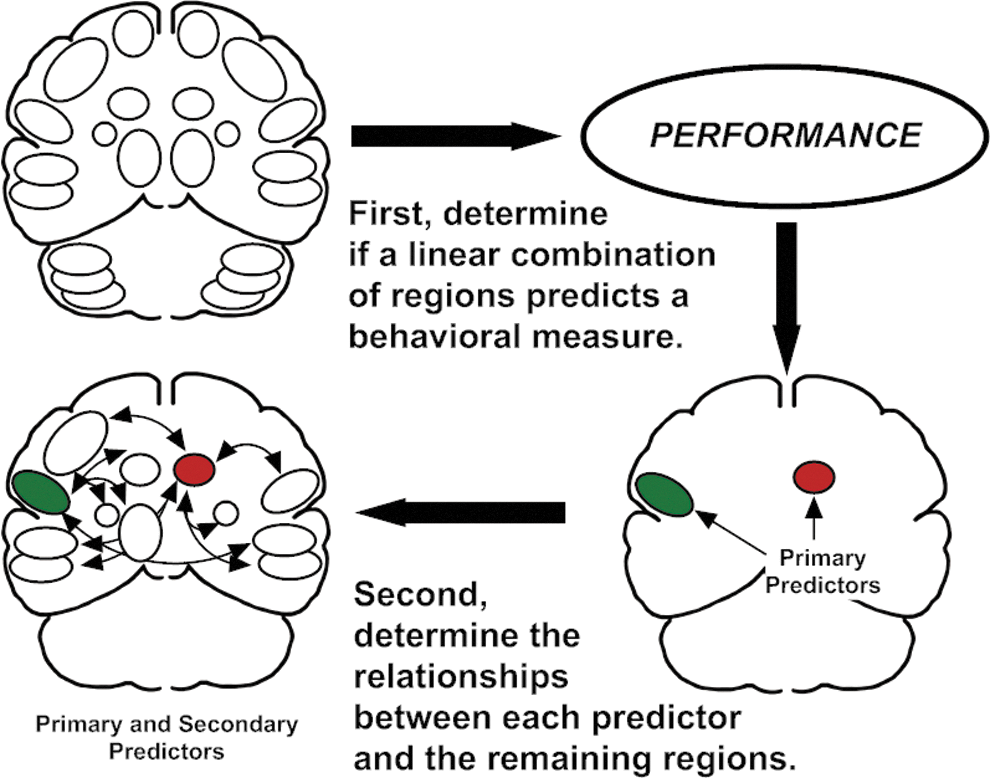
Schematic description of performance-based connectivity analysis. The first stage determines if there is a linear combination of regional blood flow values that predicts a specific behavior measured during functional brain imaging (top row). Regions that meet this requirement are called primary predictors (red and green regions, bottom right). In this example, the primary predictors are the right caudate nucleus (red), which was shown to have a negative relationship with speech rate, and the left inferior frontal region (green), which was shown to have a positive relationship with speech rate (Sidtis et al., 2003, 2006, 2010). The second stage examines the relationships between the predictor regions and the remaining regions using partial correlations, controlling for the influence of the region contralateral to the predictor (Sidtis, 2012a).
In the second step, the relationship between each primary predictor region and the remaining regions was determined using a partial correlation technique, controlling for the influence of the homologous region contralateral to the primary predictor. The partial correlation technique was used to increase the specificity of the relationships between primary and secondary regions as eight of the nine primary regions were significantly correlated with their homologous region in the opposite hemisphere (the putamen was the exception) with an average correlation coefficient of r=0.54. This procedure is depicted in the bottom portion of Figure 1. As multiple regions were examined, a modest filter was adopted to only report correlations with a significance level of less than 0.025. An extremely conservative correction such as the Bonferroni was viewed as inappropriate (Rothman, 1990) as this stage of the analysis is exploratory rather than confirmatory or hypothesis testing. The actual probability values for the partial correlations are presented in Table 2 allowing a more or less conservative judgment of the reliability of the results to be applied. This follows the recommendation for transparent reporting rather than correction for multiple comparisons in analyses such as the one described in this article (Schulz and Grimes, 2005). Neither the linear regression nor the partial correlation stages depend on the presence of a significant activation as no contrasts between imaging conditions are involved.
Results
Acoustic analysis
The initial analyses examined gender differences in the mean values of F1 and F2 frequencies and their COVs. These results are presented in Table 1. The frequency values for females were significantly higher than those for males for F2 [t(49)=−5.2; p<0.001], but not for F1. However, a mixed-design ANOVA (formant by gender) indicated that the COVs did not significantly differ between F1 and F2, nor did formant significantly interact with gender. The COVs for F1 and F2 were not significantly correlated. The data for males and females were combined for subsequent analyses of vocal stability using COV.
First and Second Format Descriptors
The first row contains the group means of the values for each vowel production. The productions for each subject were averaged for each of the subject's four scans. These were used as the dependent variable in the multiple linear regression analyses. These subjects by scan values were then averaged to produce the group means in this table. The second row contains the group means of the standard deviations of the measurements made within each vowel production averaged for each subject and each scan. The third row contains the group means of the between-subjects standard deviations for the mean F1 and F2 values. The fourth row contains the mean COV calculated for each subject and each scan.
COVs, coefficients of variation.
First formant (F1)
A linear combination of five regions predicted F1 COV (the putamen and mid-portion of the cerebellum on the left, and the inferior frontal region, the caudate, and the superior cerebellum on the right) [F(5,45)=17.71; p<0.001]. The relationship between blood flow and F1 variability was negative for the putamen and mid portion of the cerebellum on the left, and for the right inferior frontal region. It was positive for the caudate and superior portion of the cerebellum on the right side. These relationships are depicted in the top portion of Figure 2, with positive relationships between blood flow and variability depicted in green and negative relationships depicted in red. The standardized regression weights for these regions are provided beneath the region name in Figure 2 and are listed in square brackets in Table 2.
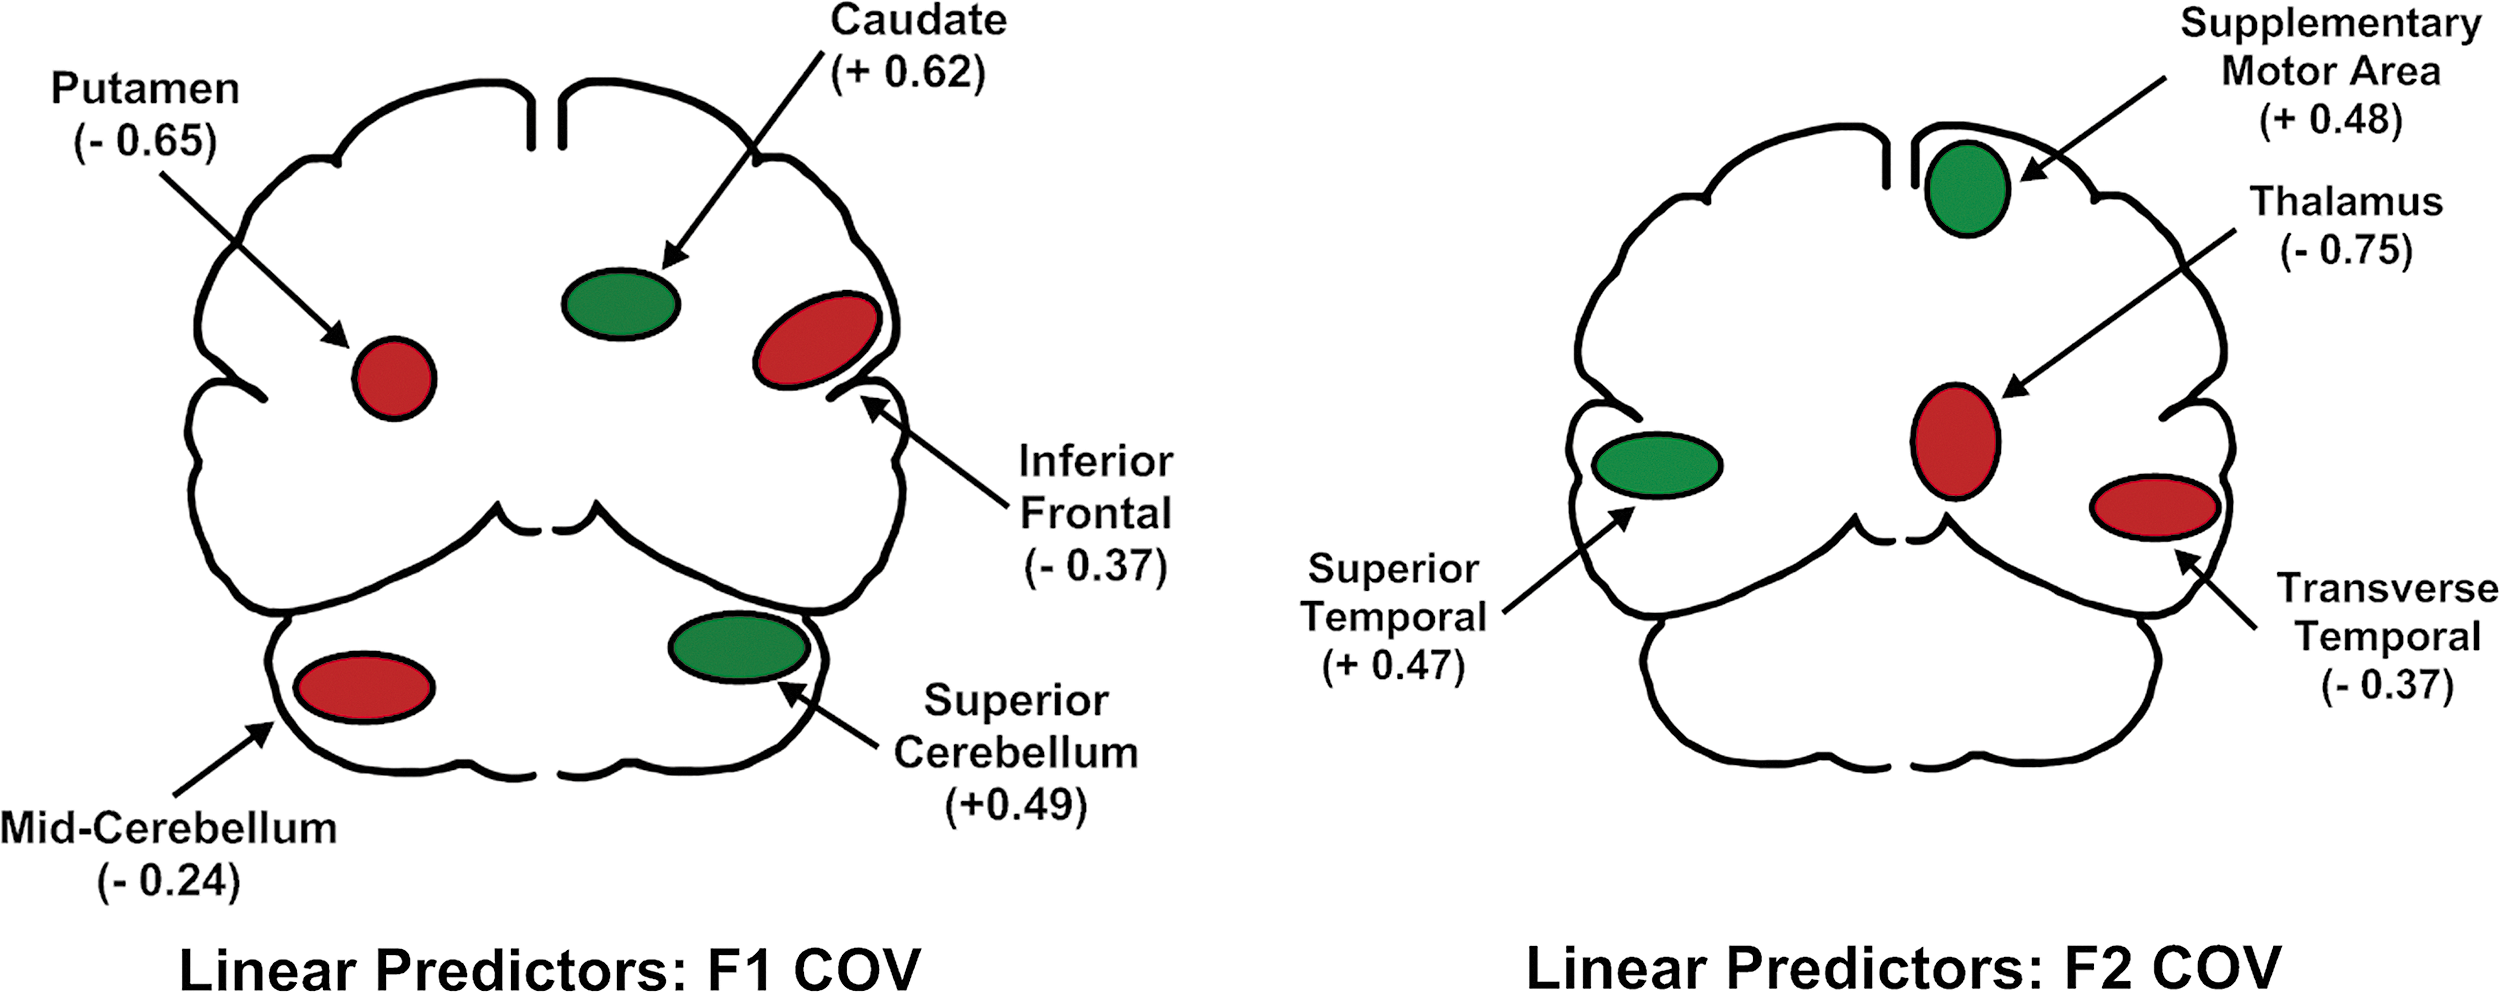
Results of the first stage of the performance-based functional connectivity analysis. The upper figure depicts the primary predictors of stability in the center frequencies of the first formant (F1). The lower figure depicts the primary predictors of stability in the center frequencies of the second formant (F2) during the sustained production of /a/. Green indicates a positive relationship between regional cerebral blood flow and variability. Red indicates a negative relationship.
List of the Primary Regions that Predict Variability in F1 and F2 During Sustained Production of the Vowel /a/ and Their Correlated Secondary Associated Regions
Variability is characterized as coefficients of variation for the first (F1) and second (F2) formant frequency values. The standardized regression coefficients for the primary predictor regions are presented in square brackets and the partial correlations for the secondary associated regions are presented in parentheses. Asterisks indicate p-values for the partial correlations (* p< 0.025; ** p≤ 0.01; *** p≤ 0.001).
In the second stage of the analysis, a series of partial correlations was used to examine the relationship between each primary predictor region and the remaining regions, controlling for the relationship between the primary predictor and its homologous region in the opposite hemisphere. These connections are depicted in Figure 3. Of the 25 relationships between primary predictors and secondary associated regions, 16 reflected a negative relationship with F1 variability whereas nine reflected a positive relationship. For the 18 supratentorial (cerebrum) secondary relationships with variability, 13 were negative and 5 were positive, 8 were on the left side whereas 10 were on the right side. The seven cerebellar regions were more equally divided between positive (four) and negative (three) relationships and left (four) and right (three) sides. The partial correlation coefficients for these regions are listed in parentheses in Table 2.
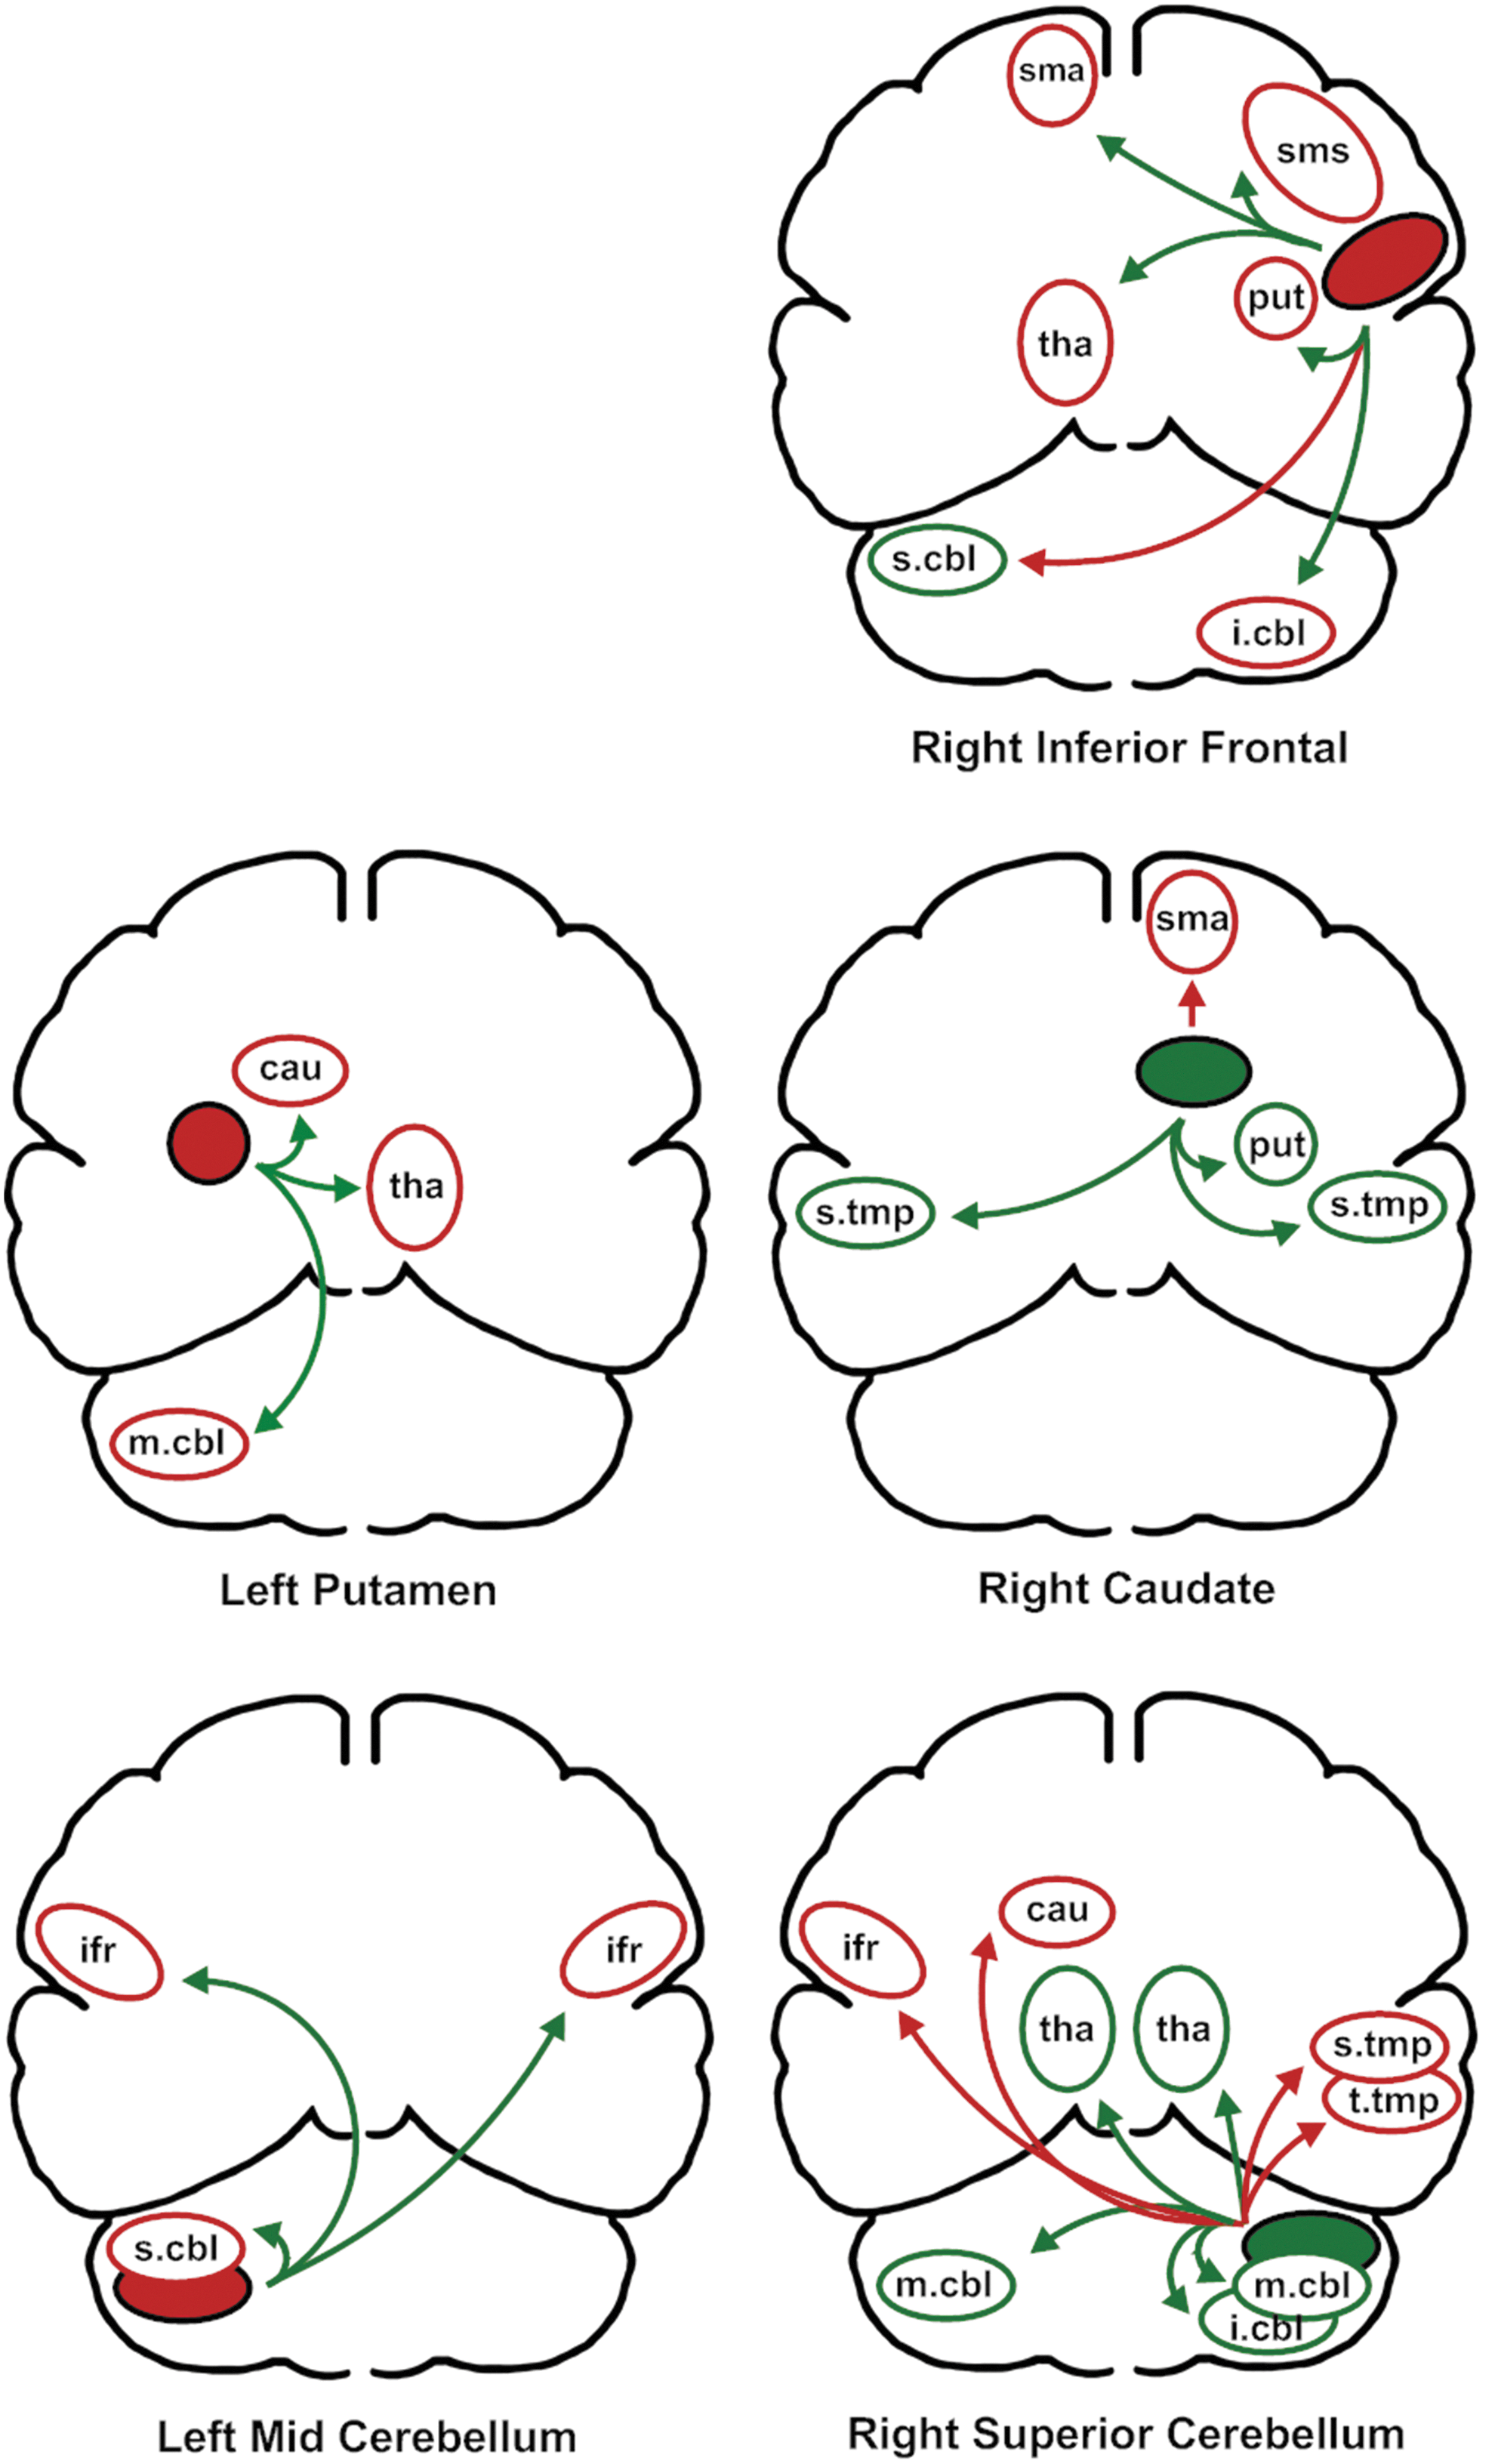
The relationships between primary predictors of first formant variability and the secondary associated areas. As in Figure 2, the solid color represents the relationship between the primary predictor and F1 variability. The color of the arrows represents the direction of the partial correlation with the primary predictor. Green represents a positive correlation and red represents a negative correlation. Using the relationship between the primary predictor and variability, and the direction of the partial correlation with the primary predictor, the direction of the relationship between the secondary associated area and F1 variability in indicated by the color of the region's outline (green is positive, red in negative). Brain regions are as follows: sma, supplementary motor area; sms, sensory motor strip; ifr, inferior frontal region; s.tmp, superior temporal region; t.tmp, transverse temporal region; cbl, cerebellum, with superior (s.cbl), middle (m.cbl), inferior regions (i.cbl); tha, thalamus; cau, head of the caudate nucleus; put, putamen.
Second formant (F2)
A linear combination of four regions predicted F2 COV (left side: superior temporal; right side: transverse temporal, supplementary motor, and thalamus regions) [F(4,46)=13.83; p<0.001]. The relationships between blood flow and F2 variability were positive for the left superior temporal region and right supplementary motor area and negative for the thalamus and transverse temporal regions on the right. The standardized regression weights for these regions are provided as in the F1 results.
Of the 24 relationships between primary predictors and secondary associated regions, presented in Figure 4, 18 reflected a negative relationship with F2 variability whereas six reflected a positive relationship. For the 17 supratentorial secondary relationships with variability, 5 were negative and 12 were positive, 7 were on the left side whereas 10 were on the right side. The cerebellar regions had a predominantly positive relationship with variability six of the seven regions) with no clear left (three) versus right (four) difference. The partial correlation coefficients for these regions are listed in parentheses in Table 2.
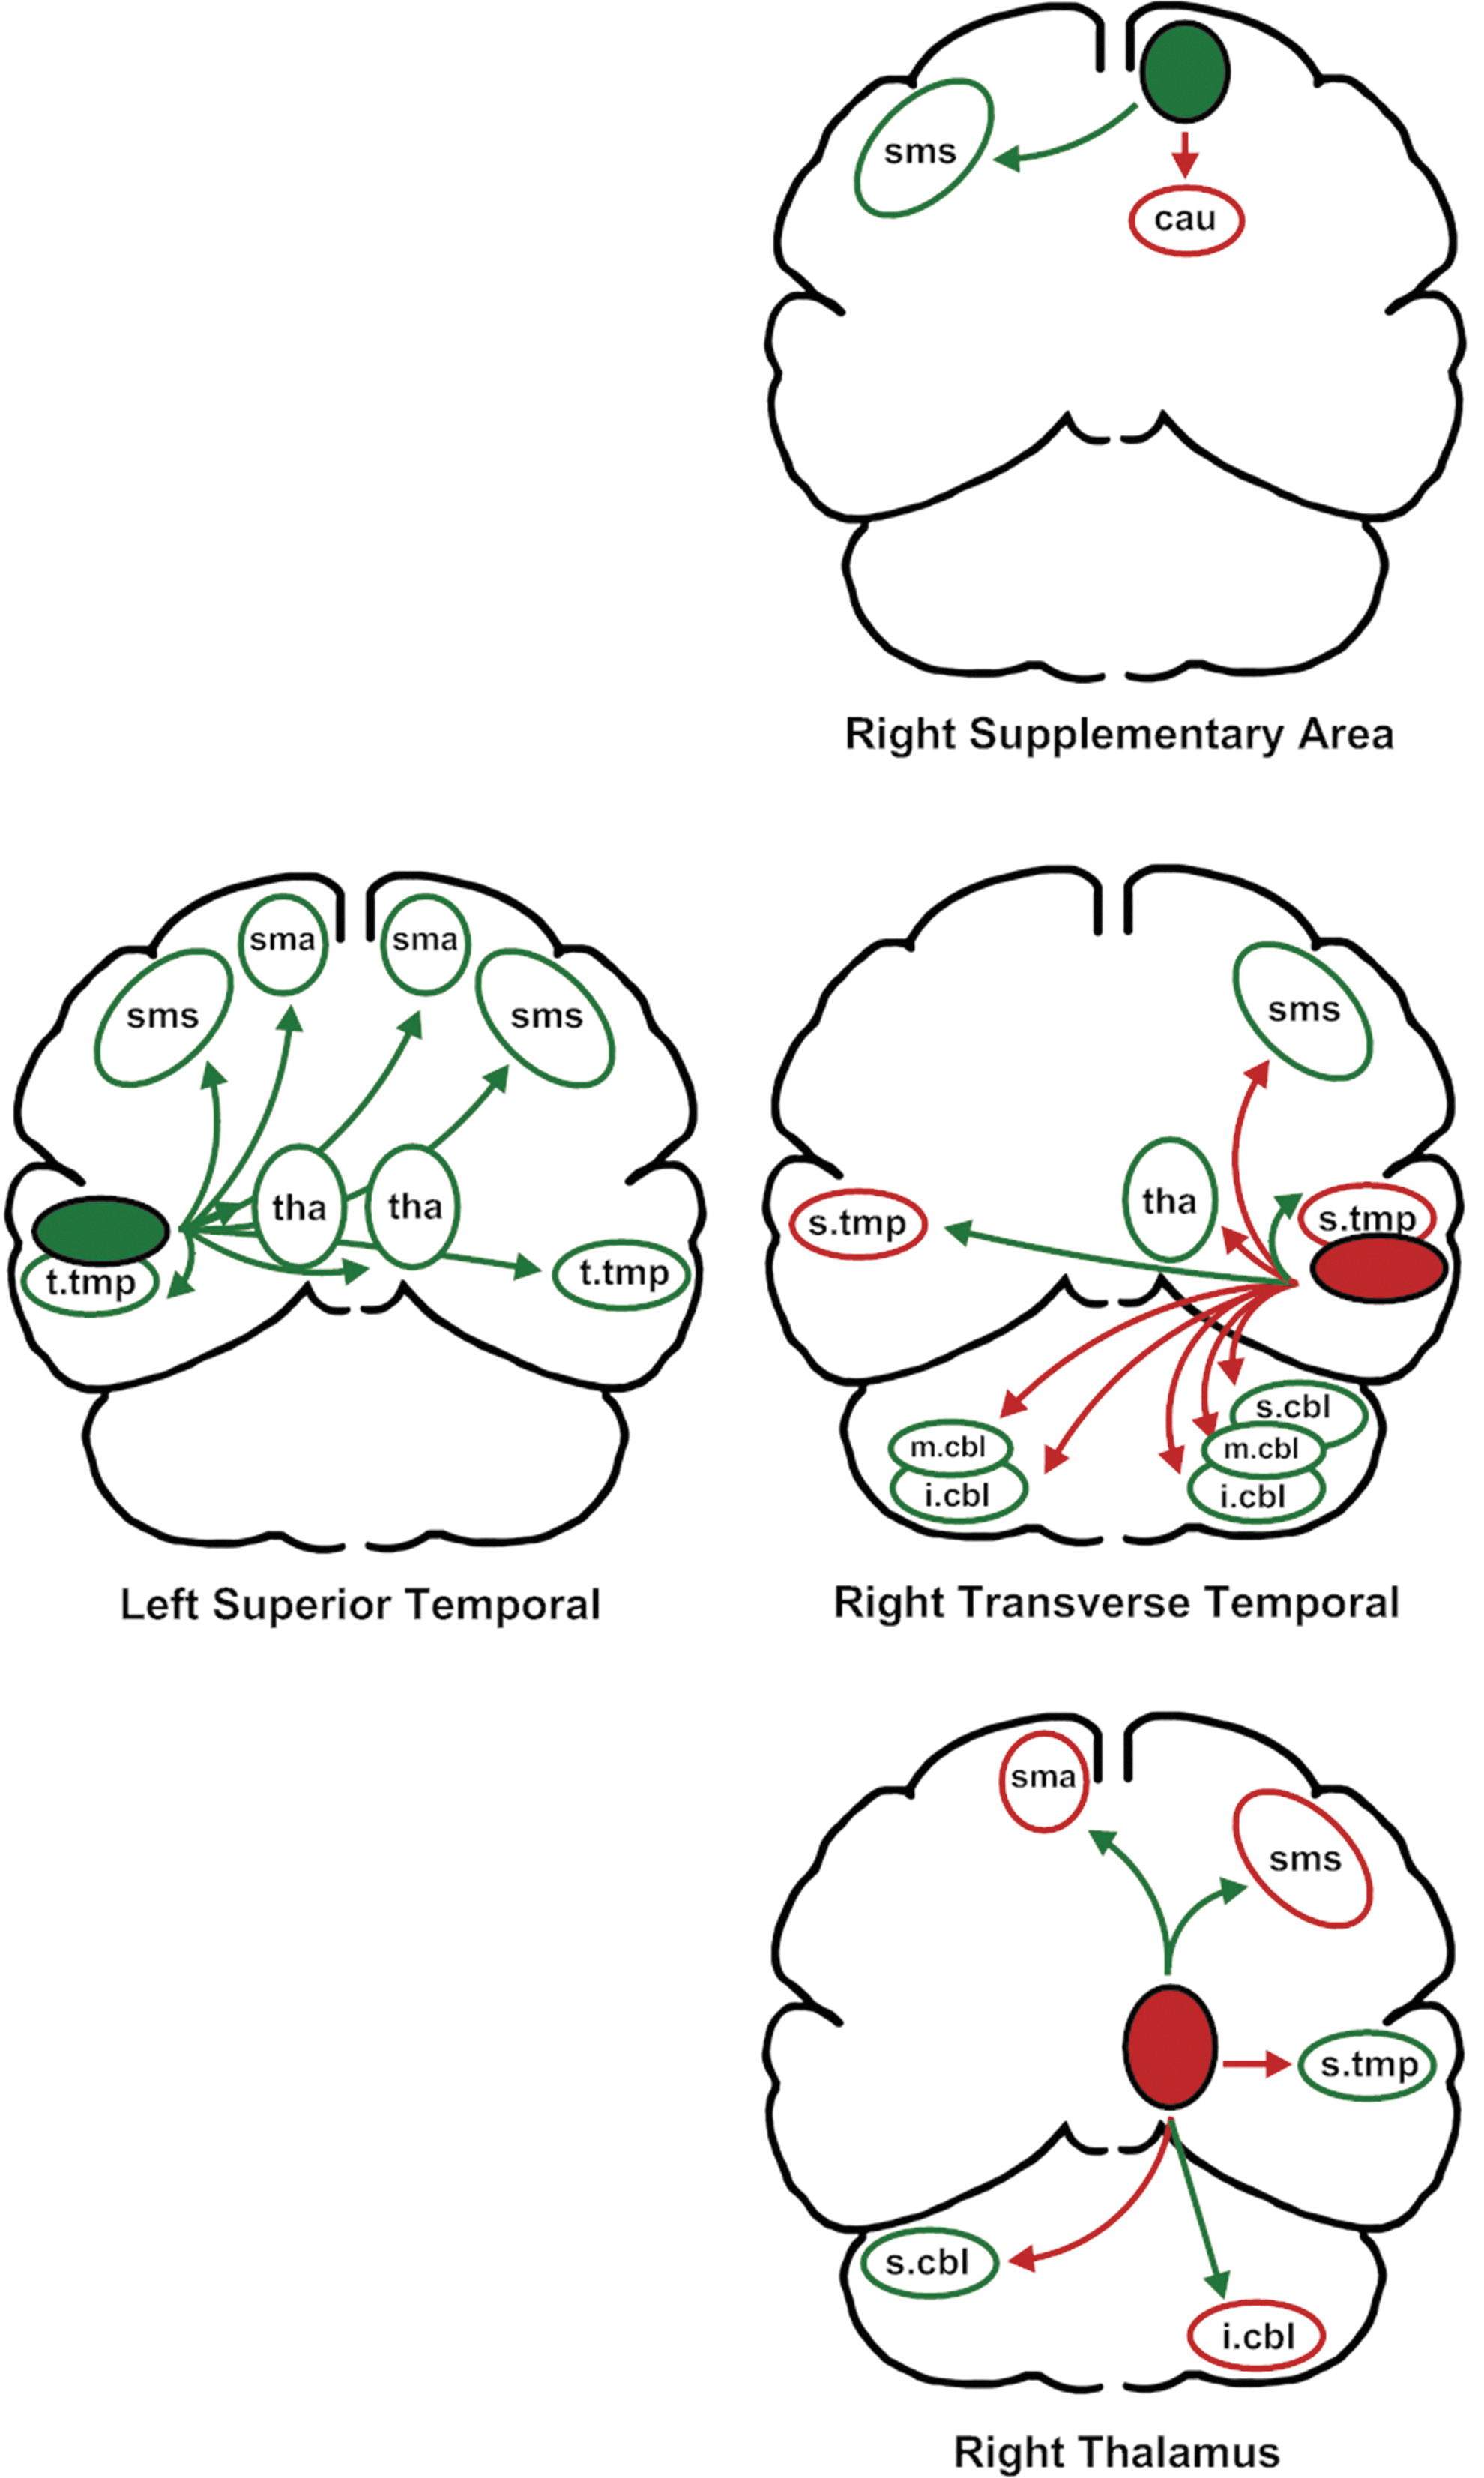
The relationships between primary predictors of second formant variability and the secondary associated areas. The color code and regions are as described for Figure 3.
For the primary predictors, the relationships between variability and regional blood flow were balanced with four positive and five negative relationships with F1 and F2 COV. For the secondary associated areas, however, there were a greater number of negative (16) than positive (9) associations with F1 variability. The opposite was true for F2 variability, with a greater number of positive (18) than negative (6) associations.
Discussion
The present results demonstrate a complex pattern of bilateral blood flow with a combination of increased and decreased brain activity associated with stability of the acoustic features of sustained production of the vowel /a/. These results are consistent with other observations about the relationships between brain regions and speech that have come from lesion, electrophysiological, and imaging studies.
With respect to speech production, they have previously used the current performance-based approach to identify brain regions that predict syllable repetition rates in normal, ataxic, and Parkinsonian speakers (Sidtis et al., 2003, 2006, 2010, 2011b). A linear combination of increased blood flow in the left inferior frontal region and decreased blood flow in the head of the right caudate nucleus predicted speech syllable repetition rates in these groups. These primary predictors had secondary associations with frontal (sensory motor strip), temporal (superior and transverse temporal), and striatal (caudate and putamen) regions and with the thalamus. As in the present results, there were left and right-sided regions with positive and negative relationships (Sidtis, 2012a,b).
In contrast to syllable repetition, the right inferior frontal region was a primary predictor of F1 stability during vowel production. Secondary associated frontal regions for F1 stability included the supplementary motor area, bilaterally, the right sensory motor strip, and the left inferior frontal region. The right supplementary motor area was a primary predictor for F2 stability. Secondary associated frontal regions for F2 stability included the sensory motor strip, bilaterally, and the left supplementary motor area. The inferior frontal regions are reported to have a reciprocal relationship with the laryngeal motor cortex (Simonyan and Horwitz, 2011; Simonyan et al., 2009). In an fMRI study of speaking and singing, Riecker and colleagues (2000) found a small area of activation in the left insula during automatic speech (repetition of the months of the year) and a comparable area on the right when a nonlyrical tune (Eine kleine Nachtmusik) was repeatedly sung. Sörös and associates (2006) also found bilateral insula activation when vowel production was compared to a baseline. Tourville and coworkers (2008) found activation in the left insula and inferior frontal region when the F1 shifted condition was contrasted with a baseline.
Striatal structures also played a different role in vowel production compared with syllable repetition. The right caudate had a positive primary relationship with F1 variability whereas the left putamen had a negative relationship. The left caudate and right putamen were secondary related regions. For F2 variability, neither the caudate nor the putamen were primary predictors and only the right caudate was identified as a secondary related region. Sörös and associates (2006) found bilateral putamen activation in the vowel versus baseline comparison while Tourville and colleagues (2008) found activation in the left putamen when the F1 shifted condition was contrasted with a baseline. As it does with other cortical motor regions, the putamen is believed to receive output from the laryngeal motor cortex during speech (Simonyan and Horwitz, 2011; Simonyan et al., 2009).
Neither the superior nor transverse temporal regions were primary predictors of F1 variability, but CBF increases in the left superior temporal region were associated with increased variability in F2. Both temporal regions had secondary associated relationships with F1 and F2 variability. Previously, positive and negative associations with speech rate were found for the right and left transverse temporal regions, respectively (Sidtis, 2012a,b). A similar association between rate and left transverse temporal region CBF was found in a group of spinocerebellar ataxic subjects (Sidtis et al., 2006). The negative association between left transverse temporal CBF and repetition rate and right transverse temporal CBF and F1 and F2 variability may be related to the phenomenon of auditory suppression, a reduction of auditory cortical activity during vocal production (Aliu et al., 2008; Creutzfeldt et al., 1989; Curio et al., 2000; Heinks-Maldonado et al., 2005; Houde et al., 2002; Müller-Preuss and Ploog, 1981). Sörös and associates (2006) reported left transverse temporal activation in the vowel versus baseline condition but Tourville and coworkers (2008) did not in the F1 shift versus baseline condition.
The thalamus has also been identified as playing a role in speech production. The thalamus was not a primary predictor of F1 variability, but it was identified as a secondary associated region, bilaterally. The right and left thalamus did have primary and secondary roles in F2 variability. Stimulation of the dominant thalamus produces slowed speech (e.g., Mateer, 1978; Schaltenbrand, 1975) whereas bilateral thalamic ablation can result in pathologically rapid speech (Canter and Van Lancker, 1985). Performance-based functional connectivity analysis similarly identified a relationship between syllable rate and left thalamic blood flow in normal speakers (Sidtis, 2012a,b). In addition to altering speech rate, thalamic stimulation can also depress respiration (Ojemann and Van Buren, 1967), and has produced anarthria (Ojemann and Ward, 1971). Sörös and associates (2006) reported bilateral thalamic activations in a contrast between vowel production and baseline. Tourville and colleagues (2008) reported activations in different thalamic regions on the left and right sides in the F1 shift versus baseline condition. The thalamus also has bilateral functional connections to the laryngeal motor cortex during speech (Simonyan and Horwitz, 2011; Simonyan et al., 2009).
The cerebellum is believed to process sensory information to contribute coordination, precision, and timing to motor control. With respect to speech, cerebellar damage has a major effect on tasks that require coordination and sequencing, such as diadochokinetic repetition (Sidtis et al., 2011a). Cerebellar damage can also affect the quality of vocal production (Ackermann et al., 2007; Sidtis et al., 2011a). In a study of hereditary spinocerebellar ataxic subjects, the inferior region of the right cerebellum was positively associated with repetition rate (Sidtis et al., 2006). The laterality of this finding was consistent with the results of lesion studies (Ackermann et al., 1992; Amarenco et al., 1993; Urban et al., 2001, 2003). Loucks and associates (2007) also reported right cerebellar activation during vocalization. Sörös and coworkers (2006) and Tourville and colleagues (2008) both reported bilateral cerebellar activation in their speech contrasts. In the present study, the left mid and right superior regions of the cerebellum were primary predictors of F1 variability, with negative and positive relationships, respectively. None of the cerebellar regions were primary predictors of F2 variability, but each of the cerebellar regions was secondarily associated with F1 and F2 variability.
The relative bilaterality of the regions identified as playing a role in the stability of sustained vowel production reflects the neurology of speaking and singing. The success of melodic intonation therapy to improve expressive language in some individuals with expressive aphasia (Albert et al., 1973; Norton et al., 2009), and the significant improvement in intelligibility in sung versus spoken text in dysarthria (impaired speech) (Kempler and Van Lancker, 2002; Sidtis et al., 2012) suggest that the right hemisphere's role in vocal motor control can be used to overcome damage to the left hemisphere speech system in some situations. Similarly, the ability of some individuals who stutter to sing fluently and the use of chorus speech as a therapeutic tool for fluency disorders (Alm, 2004; Van Riper, 1982) further demonstrate the overlap and complementarity of neurological systems for the control of vocalization through speaking and singing, and the potential for one system to compensate for deficiencies in the other. Vowels have been identified as a link between singing and speech, and the bilaterality of the brain regions implicated in the stability of vowel production suggest how this linkage is neurologically embodied. The mechanism of bilateral control is not straightforward, however, as there are also clear asymmetries in the effects on speech following unilateral brain damage in right-handed individuals.
Based on clinical observations, it is not surprising that any of the brain regions discussed thus far are involved in speech production. However, the activity of several of these regions may reflect a function that is much more general and warrants some speculation. The superior temporal region, for example, appears to be polysensory (Bruce et al., 1981), and has been implicated in a wide range of behaviors, including reading (Simos et al., 2000), intelligible speech perception (Scott et al., 2000), recognition of facial and vocal expressions of fear and disgust (Phillips et al., 1998), spatial neglect (Karnath, 2001), auditory hallucinations in schizophrenia (Barta et al., 1990), and autism (Bigler et al., 2007). One way to account for the multitude of skills is the possibility that the superior temporal region is involved in a function that is utilized in a wide range of behaviors. One candidate is the so-called imitation system in humans (Iacoboni et al., 1999, 2001). The imitation system extended the mirror neuron system identified by cell recording in monkeys to humans. The mirror neuron system acknowledged the importance of the superior temporal region, but did not formally include it because this area was felt to not have motor properties (Rizzolatti and Craighero, 2004). However, in the human imitation, which is generally based on fMRI activation data, the superior temporal region plays a key role (Iacoboni et al., 2001; Molenberghs et al., 2010). In this system, the superior temporal region is believed to provide an internal visual representation of biological motion that is available to the mirror neuron system (Iacoboni et al., 2001). Consistent with this, the superior temporal region activity was found to be greater when subjects observed predictive goal-directed visual movements compared with nonpredictive movement (Schultz et al., 2004).
It appears likely, however, that the superior temporal region together with the inferior frontal region and several other areas serve a broader functional ability: Maintaining an internal representation of behavior, whether it has been observed, performed, or anticipated. Further, visual information is not a necessary component. They previously studied baseline resting-state results obtained from a single group of normal subjects who participated in four different PET sessions. Each session alternated the same resting condition (eyes covered, quiet, no movement) with a task, repeating each four times. Different tasks were performed at separate sessions: finger opposition, syllable repetition, sustained vowel production, and repetitive lip closure, performed with eyes closed (Sidtis et al., 2004). The sessions were conducted on different days; otherwise all other factors were constant.
For several regions, CBF values during rest were highly correlated with CBF values during task performance. In particular, across the four sessions, the average correlation between rest and task CBF was 0.90 in the left and right superior temporal regions. Similar high correlations were found for the inferior frontal region (average r=0.87) and the mid region of the cerebellum (average r=0.86). The caudate showed a different effect. Although there were significant effects of the task employed at each session, there were no differences between task and rest CBF values for the caudate. It was suggested that the results of this study reflected the effects of set, a psychological concept describing a state of readiness for a specific event or behavior. These results go beyond mirroring or imitation as there was no actual behavior occurring in the rest state and there was no visual information in either the task or rest conditions. From a neurophysiological perspective, the phenomenon of set can be viewed as evidence of an internal model of the expected event or behavior, established and maintained in the nervous system.
The relationship between the left superior temporal region and its secondary associated areas (Fig. 4) is unlike the other connectivity patterns in this study: the secondary associated areas are all mirror-image bilateral and the correlations between the left superior temporal region and its secondary related areas are all positive. The role of the superior temporal region in maintaining an internal model to facilitate speech and vocal-motor control during vowel production is speculative, but any internal model of a complex behavior is likely to engage multiple brain regions. In producing a stable vowel, motor control must be exerted over multiple systems: respiration, glottal function, laryngeal shape, and articulator positions. While an internal model of a specific behavior cannot be directly observed, these and other results suggest that such a model could be maintained by activity in a system that involves superior temporal, inferior frontal, striatal and cerebellar regions.
In summary, sets of relationships among brain regions associated with key indices of acoustic stability during the sustained production of the vowel /a/ have been mapped. While right cerebral hemisphere regions appear to play a greater primary role in stability than left cerebral regions, secondary associated regions are more equally distributed across the cerebral and cerebellar hemispheres. Brain areas associated with acoustic stability are not simply activated, but reflect a pattern of positive and negative relationships with variability. These results by no means represent a definitive brain map of vowel production, nor do they identify previously unrecognized brain regions. Further development is clearly needed as some regions demonstrate both positive and negative relationships with variability, depending on the primary region with which they are associated. However, the present results do advance an approach that incorporates behavior as an essential part of the characterization of brain-behavior relationships during speech. The identification of the secondary associated regions represents an extension of the original performance-based analysis to begin to identify a broader neural systems context in which specialized regions operate. Some of this context will likely represent task-specific activity, some a more general level of functional support. Understanding the relationship between specialized regions and the broader system in which they operate will provide a more accurate understanding of complex brain systems involved in the relationship between brain and behavior in normal function as well as in neurological and psychiatric disease. For example, symptoms in Parkinson's disease likely represent both regional and global changes in brain activity (Sidtis et al., 2012). The performance-based approach decomposes behavior rather than images, in a physiologically justified way (i.e., formant frequencies can be voluntarily manipulated by a speaker/singer in a relatively independent manner). Finally, the results support the notion that a neurophysiological system controlling a complex behavior will actually perform like a control system, with the ability to both facilitate and inhibit variability to more accurately execute a complex coordinated movement pattern. This control system may well incorporate an internal representation of the intended vocalization that engages multiple brain areas.
Footnotes
Acknowledgments
This work was supported by a grant from the NIDCD RO1 DC007658. The comments of Diana Sidtis improved this article. The assistance of Amy Alken in conducting the acoustic analyses is gratefully acknowledged.
Author Disclosure Statement
The only support for this work was from the NIH and there are no conflicts.