
Abstract
Functional connectivity of the resting-state networks of the brain is thought to be mediated by very-low-frequency fluctuations (VLFFs <0.1 Hz) in neuronal activity. However, vasomotor waves and cardiorespiratory pulsations influence indirect measures of brain function, such as the functional magnetic resonance imaging blood-oxygen-level-dependent (BOLD) signal. How strongly physiological oscillations correlate with spontaneous BOLD signals is not known, partially due to differences in the data-sampling rates of different methods. Recent ultrafast inverse imaging sequences, including magnetic resonance encephalography (MREG), enable critical sampling of these signals. In this study, we describe a multimodal concept, referred to as Hepta-scan, which incorporates synchronous MREG with scalp electroencephalography, near-infrared spectroscopy, noninvasive blood pressure, and anesthesia monitoring. Our preliminary results support the idea that, in the absence of aliased cardiorespiratory signals, VLFFs in the BOLD signal are affected by vasomotor and electrophysiological sources. Further, MREG signals showed a high correlation coefficient between the ventromedial default mode network (DMNvmpf) and electrophysiological signals, especially in the VLF range. Also, oxy- and deoxyhemoglobin and vasomotor waves were found to correlate with DMNvmpf. Intriguingly, usage of shorter time windows in these correlation measurements produced significantly (p<0.05) higher positive and negative correlation coefficients, suggesting temporal nonstationary behavior between the measurements. Focus on the VLF range strongly increased correlation strength.
Introduction
Professor Jim Hyde originally suggested to Bharat Biswal that “there should be something in the spontaneous, resting state blood oxygen level-dependent (BOLD) signal” in addition to mere activation responses. Along with their coworkers, Biswal and Hyde later demonstrated that spontaneously occurring functional connectivity does exist in the form of very-low-frequency fluctuations (VLFFs) in the BOLD signal. These fluctuations were thought to mediate information between homologous brain regions across the hemispheres (Biswal et al., 1995).
Functional connectivity magnetic resonance imaging (fcMRI) has become an increasingly popular source of new information on brain pathology (Greicius et al., 2008). Despite the wide use of fcMRI, neurophysiological sources of spontaneous brain activity fluctuations are still relatively unknown. Low-frequency fluctuations are present in all primary sensory regions (Cordes et al., 1999). Independent component analysis (ICA) can effectively delineate functional units known as intrinsic or resting-state networks (i/RSNs) that cover the brain (Beckmann et al., 2005; Calhoun et al., 2001; Kiviniemi et al., 2009; Smith et al., 2009). Dual regression of the fcMRI data enables the detection of RSN data from a single subject for accurate correlation analytics (Abou Elseoud et al., 2014; Filippini et al., 2009).
Simultaneous electroencephalography (EEG)–fMRI studies have sparked widespread interest, because they allow good temporal and spatial resolution. It has been shown that the EEG signal correlates with the BOLD signal (for recent reviews, c.f. Huster et al., 2012; Laufs, 2012). These correlations have also been investigated in RSNs at wide range of frequencies from baseline direct current (DC) to 50 Hz (Hiltunen et al., 2014; Jann et al., 2010; Laufs et al., 2003; Mantini et al., 2007; Sadaghiani et al., 2010). It is clear that the BOLD signal reflects electrophysiological activity at least to some extent. However, the accuracy of correlation measurements is limited by a marked difference in the sampling rates of the EEG and conventional BOLD signal.
Near-infrared spectroscopy (NIRS) time-domain signals also have a good temporal correlation with functional brain networks (Mesquita et al., 2010; Sasai et al., 2012; Zhang et al., 2010). It has been suggested that VLFFs, detected simultaneously by both NIRS and fMRI, arise from the propagation of endogenous global blood flow and oxygenation fluctuations through cerebral vasculature, rather than from local variations in neuronal activation or localized cerebral blood flow changes (Tong, 2012; Tong and Frederick, 2010). Most of these studies have been carried out by region-of-interest-based or general linear model (GLM) analysis of whole-brain BOLD data. In this study we compare NIRS, as well as all the other physiological data, with ICA-based dual-regressed data.
An early hypothesis concerning the origin of VLFFs in the BOLD signal pointed out vasomotor waves as a contributing factor. Vasomotor waves are slow, minute-scale general fluctuations of blood vessel wall tone that modulate blood perfusion pressure from microvasculature to global blood pressure (BP). By measuring the speed of heart pulsation propagation in the blood vessels, one is able to noninvasively monitor the vasomotor waves of BP (Gesche et al., 2012; Gribbin et al., 1976; Myllylä et al., 2011a; Sorvoja, 2006). To the best of our knowledge, a direct time-domain correlation between vasomotor waves and VLFFs of BOLD signals has never been reported previously. Kannurpatti and Biswal have demonstrated a BP-drop-induced increase in VLF vasomotor (Mayer waves=0.03–0.05 Hz) (Miakawa et al., 1984) waves, which strongly affected the lowest frequencies of the BOLD signal in an anesthetized rat (Kannurpatti et al., 2008). Due to an absence of fMRI-compatible noninvasive BP (NIBP) measurement equipment, direct correlations between BOLD signals and vasomotor waves have not been conducted until now.
Nyquist theorem states that in order to avoid aliasing one should sample the physiological signals critically, that is, more than two times faster than the physiological signal. Cardiorespiratory noise ranged between respiration=0.3 Hz and heart rate=1 Hz (+harmonics) and unavoidably aliases the classical BOLD signal sampled at 0.5 Hz. Aliasing makes a definite separation of fluctuation sources a highly demanding task from a single scan (Kiviniemi et al., 2005). Further, changes in respiration and heart rate variability have been shown to alter the BOLD signal (Birn et al., 2008; Chang et al., 2013; Wise et al., 2004). Nonetheless, recent technological advances in ultrahigh temporal resolution fMRI, such as inverse imaging (Lin et al., 2012), magnetic resonance encephalography (MREG) (Assländer et al., 2013), and generalized inverse imaging (Boyacioglu and Barth, 2013a), enable critical sampling of brain data without spurious aliasing. In this article we utilize MREG with 10 Hz sampling frequency, which allows critical sampling and thus also separation of cardiorespiratory noise making correlations on events occurring in the 0–5 Hz range more accurate.
Physiological signals affect and counteract on each other. For example, heart rate is affected by normal breathing due to coupling and interaction between the cardiac and respiratory systems (Indic et al., 2008). Neural events lock to heartbeats before stimulus onset and predict the detection of a faint visual grating in two multifunctional RSNs (Park et al., 2014). Cardiac variability has also recently been shown to have a connection with the RSN dynamics as well (Chang et al., 2013). Synchronous multimodal measurement is the only way to obtain precise assessment of the complex dynamics and interactions between physiological variables and brain activity.
In the present study, we investigated the feasibility of a highly multimodal imaging environment—Hepta-scan—that combines MREG, EEG, NIRS, and NIBP with other basic physiological measurements (e.g., SpO2, respCO2, and electrocardiogram [ECG]) provided by a standard anesthesia monitor (Myllylä, 2014). ICA with dual regression was used to separate RSNs from the data. We measured intermodality correlations between EEG, NIBP, NIRS, and MREG in both full band (FB; 0–5 Hz) and VLF (0.009–0.08 Hz). In addition, we investigated differences in correlations between full (10 min) and short (2 min) time windows in order to assess the temporal stationary of intermodal connectivity.
Materials and Methods
Subjects
Concurrent Hepta-scan (fMRI, NIRS, EEG, NIBP, and anesthesia monitor) resting-state studies were performed in 11 healthy volunteers (3 women, 27.2±7.5 years old). The study protocol was approved by the ethics committee of Oulu University Hospital. Written informed consent was obtained from each subject individually prior to scanning, in accordance with the Helsinki declaration. During the 10-min MREG resting-state study, subjects were instructed to lie quietly in the scanner with their eyes open fixating a cross on the screen and thinking nothing particular.
Magnetic resonance imaging
Our MR system is Siemens 3T SKYRA with a 32-channel head coil. We utilize MREG sequence obtained from Freiburg University via collaboration with Jürgen Hennig group (Lee et al., 2013; Zahneisen et al., 2012). MREG is a three-dimensional (3D) spiral, single-shot sequence that undersamples 3D k-space trajectory for faster imaging (Assländer et al., 2013). It samples the brain at 10-Hz frequency (TR=100 msec, TE=1.4 msec, and flip angle=25°) and offers thus about 20–25×faster scanning than conventional fMRI. Three-dimensional MPRAGE (TR=1900 msec, TE=2.49 msec, flip angle=9°, FOV=240, and slice thickness=0.9) images were used to register the MREG data into 4-mm MNI space. Respiratory belt and fingertip peripheral SpO2 data were also being saved from the scanner.
Near-infrared spectroscopy
NIRS measurement device for fMRI environment has been developed since 2008 in cooperation between the Oulu Functional Neuroimaging (OFNI) group (
Electroencephalography
EEG was recorded with 32-channel, MR-compatible BrainAmp system (Brain Products, Gilching, Germany) using Ag/AgCl electrodes placed according to the international 10–20 system. Also ECG was recorded. Electrode impedances were <5 kΩ, sampling rate 5 kHz, and band pass from DC to 250 Hz. Signal quality was tested outside the scanner room by recording 30 sec eyes open and eyes closed. Skin potential was removed by stick abrasion technique to allow DC-potential measurement (Vanhatalo et al., 2003).
Noninvasive BP measurement
Vasomotor waves of arterial BP were measured by an NIBP device that was also developed by OEM laboratory and the OFNI group. The completely MRI-compatible measurement method is described more precisely in the following reference (Myllylä et al., 2011a). Cardiovascular pulses induce tiny movements of the skin, especially near the arteries. In this measurement method, these skin movements are sensed from skin surface continuously and simultaneously by two sensors, one placed over the aortic valve on sternum and another carotid artery. Pulse transit time (PTT) between the sensors is calculated, giving the transition time between the starting time of each pressure pulse (opening of the aortic valve) and the ensuing diameter change of the carotid. Further, pulse wave velocity (PWV) is the speed of a pressure pulse propagating along the arterial wall and can be calculated from PTT once the distance between the sensors has been determined. Since PWV depends on the pressure in the aorta (the higher the pressure, the greater the velocity), diastolic pressure in the aorta can be determined by PWV. Moreover, BP changes due to vasomotor waves are reflected also as changes in PWV. Sampling frequency of the raw acceleration signals was 10 kHz. Highest peaks were identified by searching for the maximum value of each time interval between heartbeats. Next, delays between the corresponding peaks of two accelerometers were calculated. The method, for finding heart peaks and validating the acceleration response followed by determination of the PTT and PWV values, was done with Matlab and is presented more precisely in the reference (Myllylä et al., 2012). So far, comparisons between NIBP and invasive BP (IBP) responses have been indicating a good correspondence (Fig. 1).
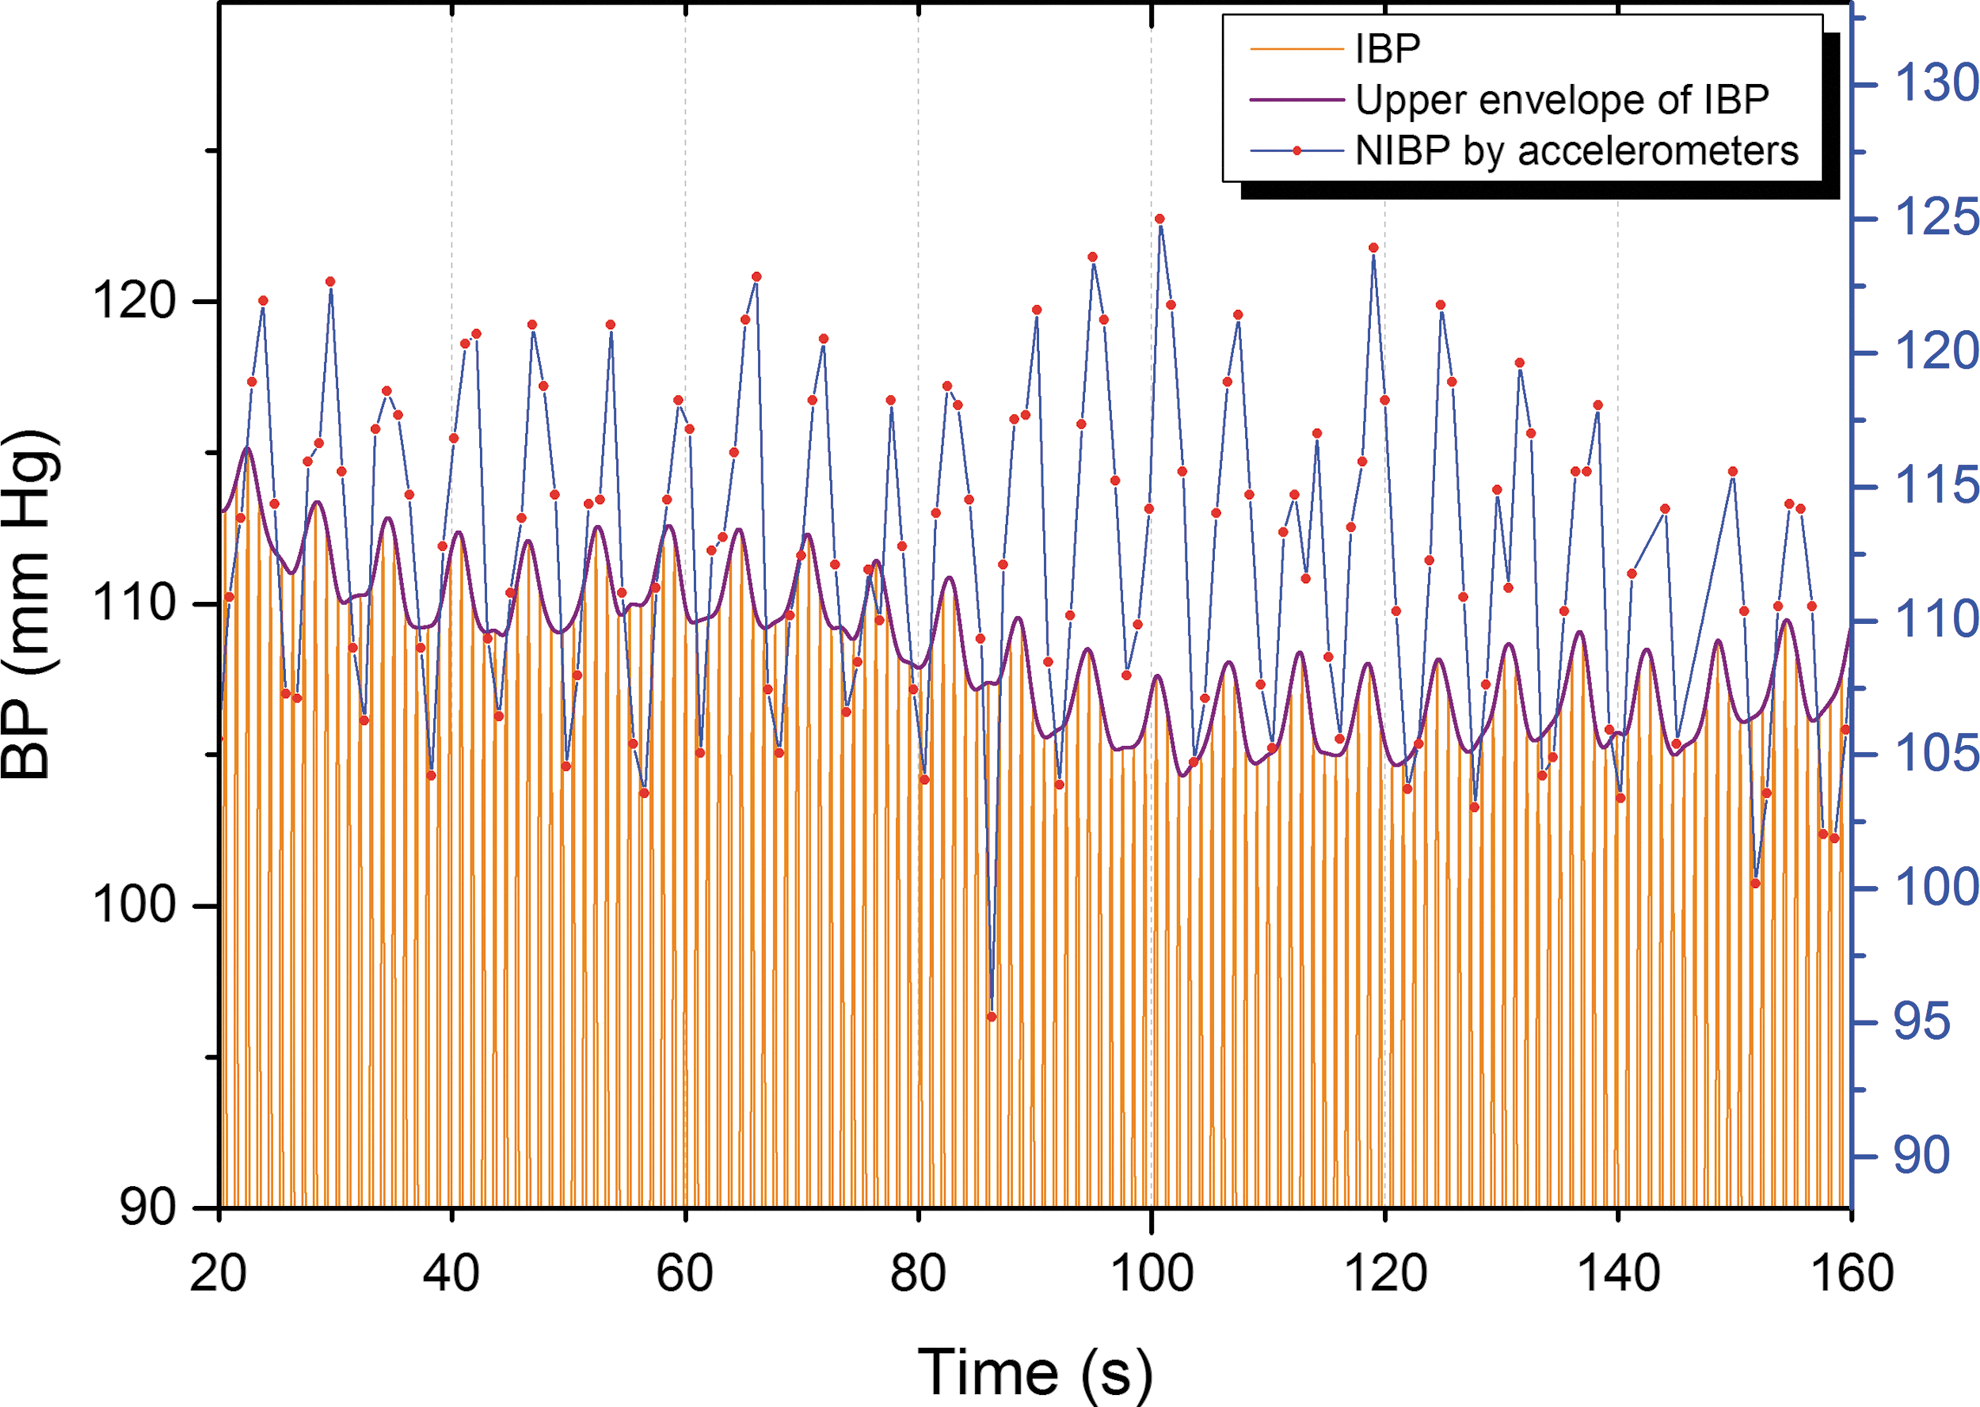
Simultaneous measurement of BP by the developed NIBP method and by an anesthesia monitoring device measuring IBP. Blue line represents noninvasive NIBP measured by our device, orange lines invasive BP, and purple line its upper envelope. The sampling rate of NIBP measurement was 1 kHz and that of the anesthesia monitoring device was 300 Hz. IBP, invasive blood pressure; NIBP, noninvasive blood pressure.
Anesthesia monitor
SpO2, respCO2, ECG, and cuff-based NIBP were registered using 3T MRI-compatible anesthesia monitor (GE Datex-Ohmeda™; Aestiva/5 MRI). The cuff-based NIBP was used for calibrating the continuous NIBP before and after scanning. Continuous measurement of SpO2, respCO2, and ECG data was optically transferred to a monitoring computer during the actual measurements via special server for time trends. In a monitoring computer the Datex-Ohmeda S/5 Collect software collects and saves the data with a sampling rate of 300 Hz. In this study these data are used for verification purposes.
Timing
To enable accurate analysis between different signals, they were synced with each other. The 3T SKYRA MR-scanner optical timing pulse mediates millisecond-level trigger for synchronization of data gathering for NIRS, NIBP, and EEG. BrainAmp SyncBox was used to verify that MR scanner and EEG amplifier are clocked by. Anesthesia monitor signal timings are facilitated from the scanner artifact reflected in the ECG leads.
Analysis of MREG data
MREG data are being preprocessed with FSL pipeline. One hundred eighty time points were removed from the beginning for minimizing T1-relaxation effects. Head motion was corrected with FSL 5.01 MCFLIRT software (Jenkinson et al., 2002). The movement of the subjects was almost exclusively due to respiration-related z-direction head movement. The mean relative motion was 0.05±0.001 mm and did not exceed 0.07 mm in any subject.
Brain extraction was carried after MCFLIRT with optimization of the deforming smooth surface model, as implemented in FSL 5.01 BET software (Smith, 2002) using threshold parameters f=0.3 and g=0; and for 3D MPRAGE volumes, using parameters f=0.25 and g=0.22 with neck and bias field correction option. Spatial smoothing was done with fslmaths 5-mm FWHM Gaussian kernel. Three-dimensional MPRAGE images were used to register the MREG data into MNI space in 4-mm resolution prior to group ICA as a standard procedure in MELODIC.
To separate RSNs we calculated group probabilistic ICA (PICA) as implemented in MELODIC (Beckmann and Smith, 2004) for MREG data. Group PICA was used to separate noise sources from RSN sources with previous criteria (Kiviniemi et al., 2003, 2009). Model order was chosen to be 70 as an initial step. We detected 23 motion- and cerebrospinal-fluid-pulsation-related independent components (ICs) and 47 were considered to be RSNs. In this proof-of-concept study, we decided to select only the dominant DMNvmpf component beneath frontal NIRS sensors for further correlation analyses.
The set of spatial maps from the group-average analysis was used to generate subject-specific versions of the spatial maps, and associated timeseries, using dual regression (Beckmann et al., 2009; Filippini et al., 2009). We use all the ICs in dual regression because the components are not totally independent and have some overlapping variance. This can be taken account by using all the components in dual regression where the fsl_glm function “multiple regression” divides the overlapping variance to partial regression coefficients and uses these in calculation of subject-specific components. The dual-regression-derived time signal was used since the time domain signal can be analyzed as such without any further need of corrections for auto-correlation effects (Boyacioglu et al., 2013b). The set of subject-specific dual-regressed timeseries, one per group-level DMNvmpf spatial map, were used in our correlation analysis.
Analysis of NIRS data
The method for converting raw NIRS time courses into time courses representing temporal changes of the Hb and HbO concentration is based on modified Beer–Lambert law, which is described earlier by Boas et al. (2001), Cope (1991), and Strangman et al. (2003). Hb and HbO were determined by measuring the changes in optical density at two wavelengths (660 and 830 nm) and using the known extinction coefficients. All these calculations were done in Matlab (vR2012b; The Math Work, Natick, MA).
Analysis of EEG data
EEG recordings were processed using the same procedure as in Hiltunen et al. (2014) with offline postprocessing using the Brain Vision Analyzer (Version 2.0; Brain Products). The ballistocardiographic (BCG) and gradient artifacts due to static and dynamic magnetic fields during MRI data acquisition were corrected using the average artifact subtraction method (Allen et al., 1998, 2000). At this point it was verified that there were neither visually identifiable gradient nor BCG artifacts left in the data. To get maximally temporally ICs that are comparable to MREG RSNs, the ICA was calculated also to EEG data. This approach also reduces the volume-conduction-caused problem of signal mixing in scalp potential recordings. ICA was done in Matlab with EEGLAB (v9.0.0.2b) (Delorme and Makeig, 2004) using Infomax algorithm (Bell and Sejnowski, 1995) with sub-Gaussian source detection. Maximum number (32) of ICs was used and the resulting components were downsampled to match the MREG sampling frequency of 10 Hz by getting an average value of each of 100-msec periods.
Analysis of NIBP data
In general, the higher the pressure in the aorta is, the greater is the PWV of blood flow. Because there is a relationship between PWV and BP, PWV is a widely used index of arterial distensibility. Having acquired PTT values, it is possible to calculate PWV, provided that the distance between the sensors is known. However, also the diameter of the vessel, thickness of the vessel wall, and the density of blood have an effect on PWV. To take this into account, we used a mathematical expression for estimating BP from PWV, described in the following references (Myllylä, 2014; Myllylä et al., 2011a). During artifacts, for example, caused by expectoration, swallowing, and others, the BP is interpolated between successful measurements.
Analysis of anesthesia monitor data
For anesthesia monitor data (SpO2, respCO2, and ECG), fast Fourier transform (FFT) was done to get the power spectrums of signals. From power spectrums we determined each individual's respiration and cardiac frequency bands to avoid those in our VLF analysis.
Intermodality correlations
All the data were first downsampled to 10 Hz to correspond with the sampling rate of MREG. Downsampled time signals were detrended by fitting a line and removing it. Zero-lag correlations between all different modality FB signals were calculated with Pearson correlation coefficients and absolute values were averaged between subjects. We compared all combinations of correlation between MREG, EEG ICs, NIRS (Hb and HbO), and NIBP signals. For EEG we selected the highest correlation coefficient giving IC from each subject and separately for FB and VLF. All these analyses were done in Matlab.
Because BOLD signal is dominated by low-frequency fluctuations, we wanted to observe also the very-low-frequency (VLF) band (0.009–0.08 Hz). The reason why we took the frequency band 0.009–0.08 Hz instead of maybe more typically used 0.01–0.1 Hz band was that some of the 11 subjects had a very low respiratory rate (∼0.1 Hz) as determined by anesthesia monitoring and we wanted to avoid it in our VLF results. To get VLF time courses of all signals we FFT band pass filtered them in OriginPro (v9.1) and calculated average correlations in the same way as in FB measures.
To analyze time domain stability we calculated average correlation coefficients separately using the full measurement length of 10 min (i.e., 6000 time points) and by using 2-min (i.e., 1200 time points) sliding window with 50% overlap in both FB and VLF range. ICA studies with sliding windows shows that relatively short time windows down to 1.8 min still enable RSN depiction (Kiviniemi et al., 2011; Remes et al., 2013), even though full VLF cycles cannot be measured based on Nyquist theorem. The sliding window method produced nine equally long (2 min) time windows that were compared separately and each subject's highest 2-min absolute value was chosen to calculate average correlations. The correlation between the order number of the 2-min time window versus number of maximal correlation hits was calculated by linear fitting in Origin Pro (v9.1). For statistical testing one-tailed paired t-tests were calculated from intermodality average correlations in 10-min versus 2-min time windows and FB versus VLF.
Results
Technical line-up
The technical line-up of our Hepta-scan system is illustrated in Figure 2. With Hepta-scan we can simultaneously measure with high sampling rate seven key physiological variables (MREG, EEG, NIRS, NIBP, SpO2, respCO2, and ECG) known to affect brain hemodynamics. The 3T SKYRA MR-scanner optical timing pulse mediates trigger for synchronization of data gathering for NIRS, NIBP, and EEG. EEG received also a secondary timing pulse from the scanner via the Brain product SyncBox device. Anesthesia monitor signal timing is facilitated from the scanner artifact reflected in the ECG leads. Monitoring data of all patients are optically transferred from the MR-rooms Faraday cage via wave tube near the scanner switch board. Measured example signals from one subject are presented in Figure 3b.
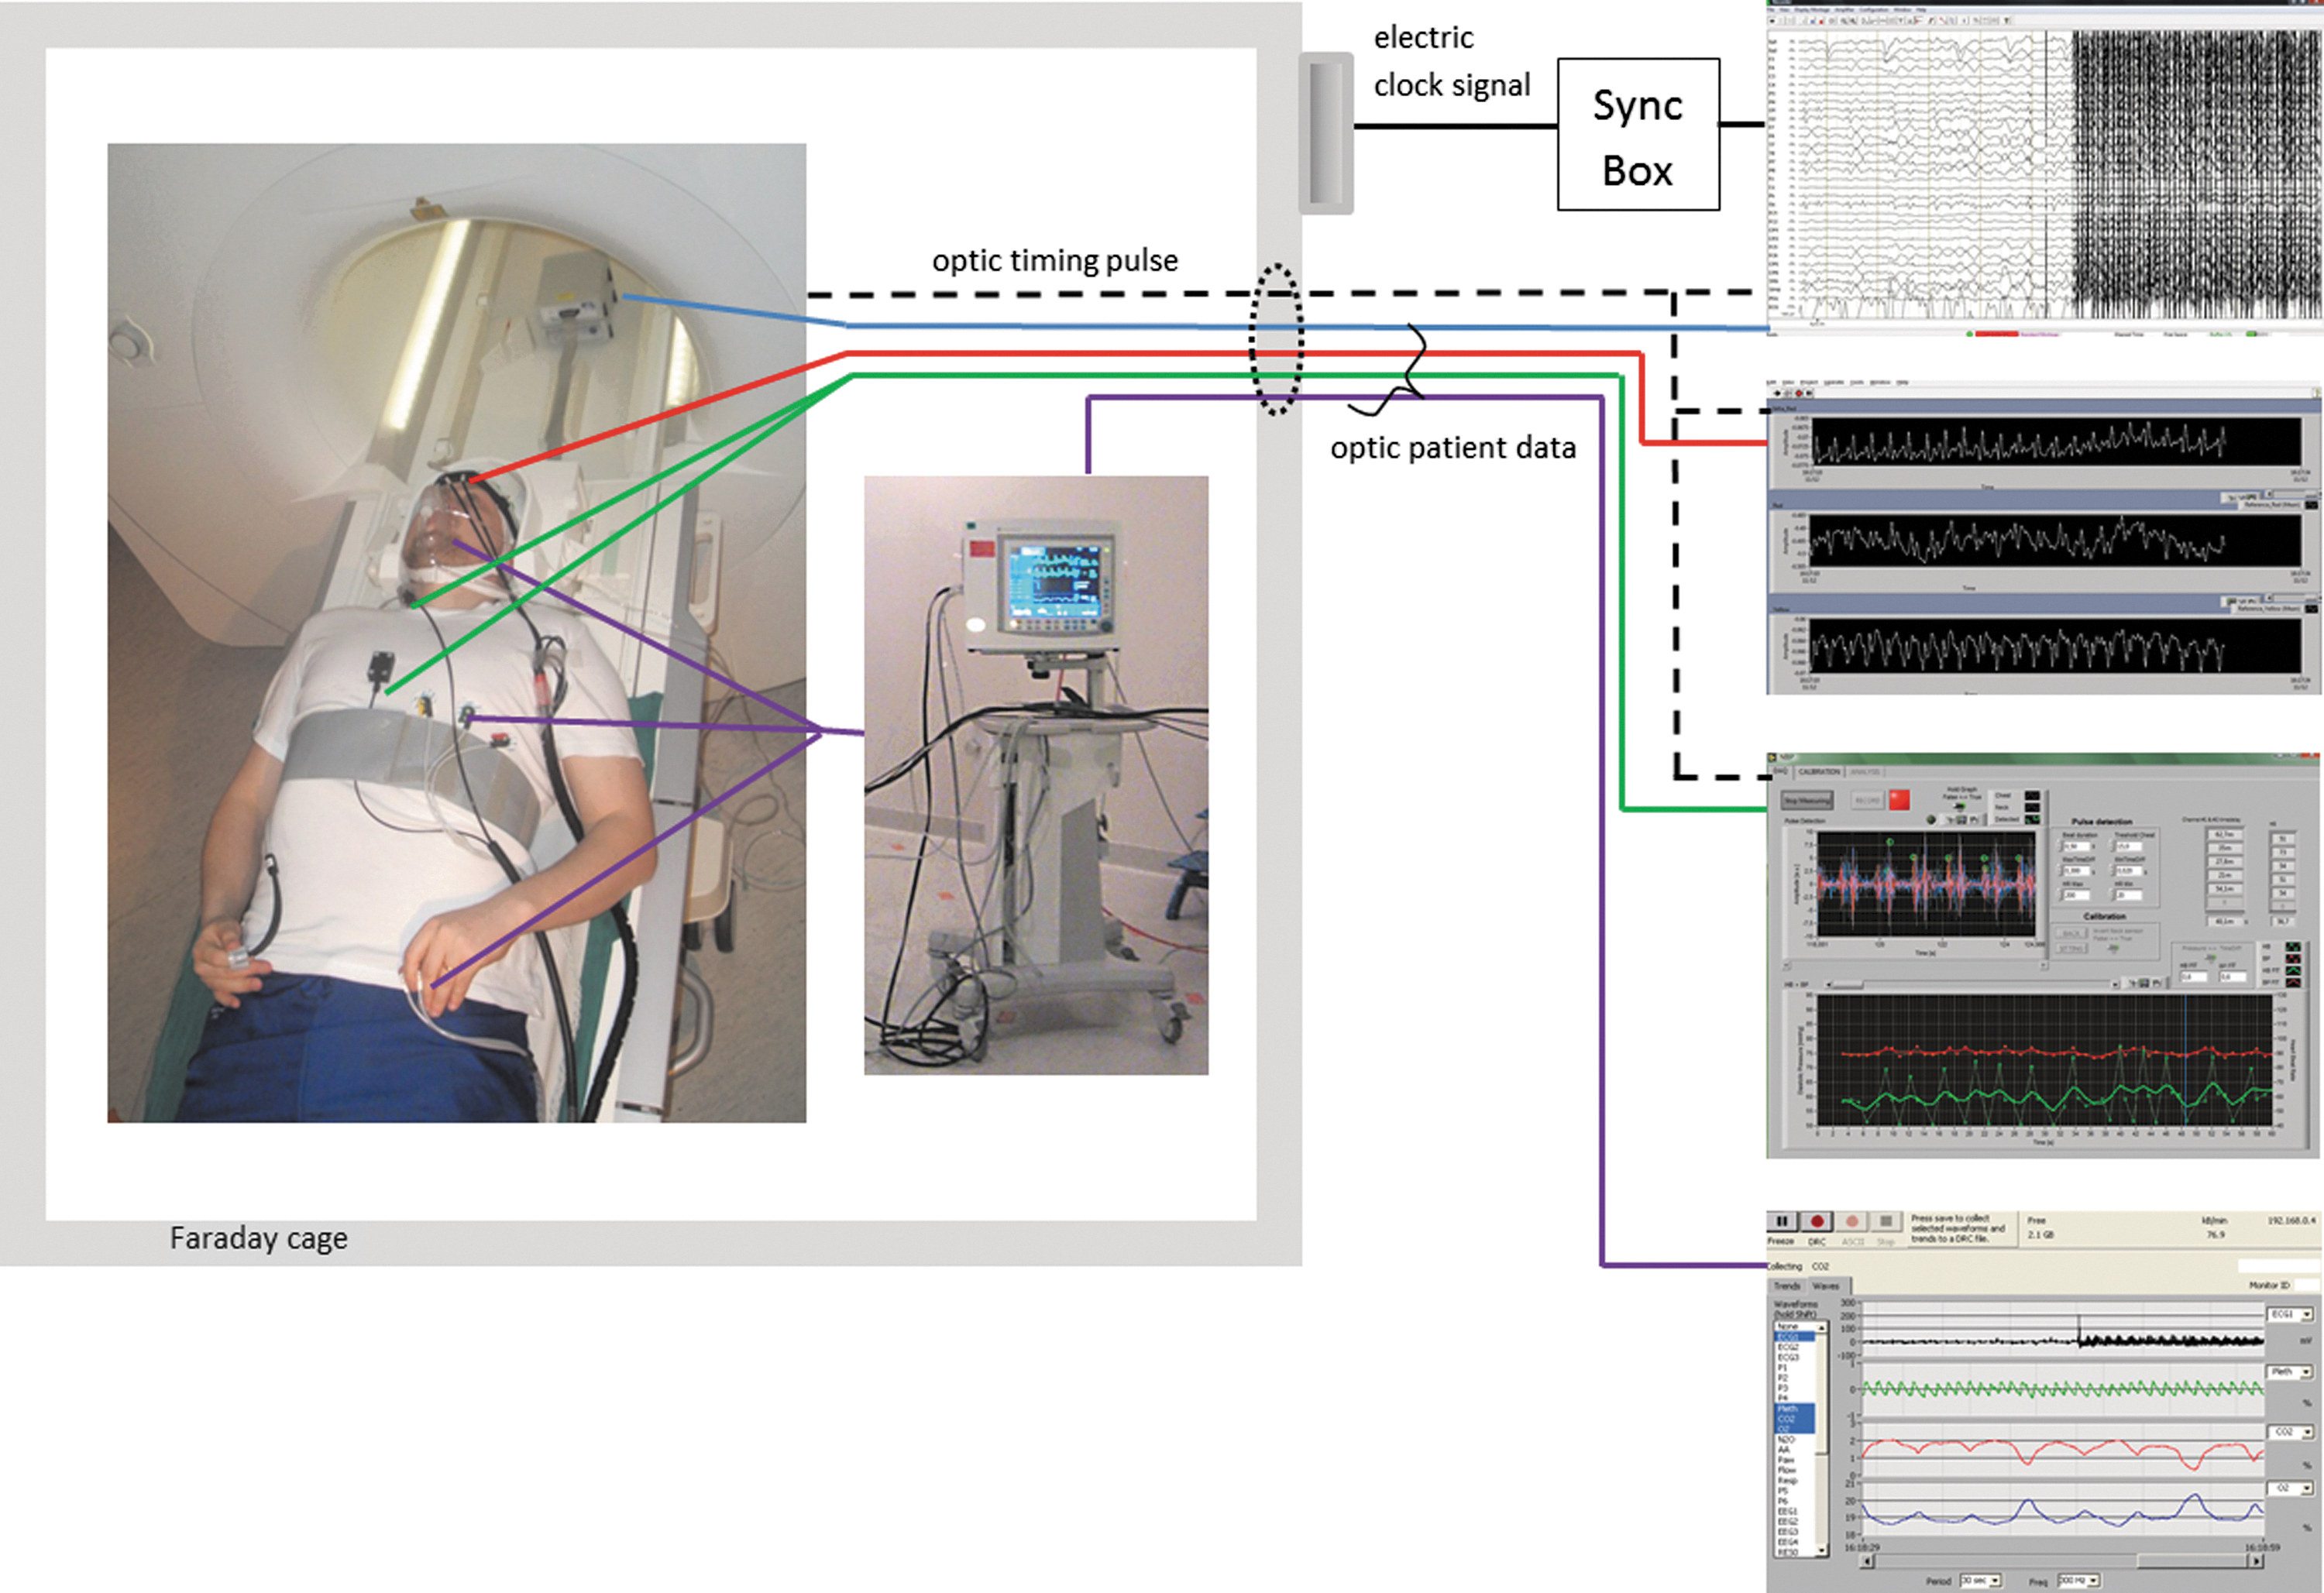
Demonstration of the measurement setup. Electrode placements and used anesthesia monitor are presented on the left side of the figure inside Faraday cage where subject is lying in the MR room. All signals are transferred optically outside the room via wave tube. Color codes for the signals: EEG, blue; NIRS, red; NIBP, green; anesthesia monitor data, violet; timing pulse, black dashed line. Additionally, respiration from belt and fingertip SpO2 were measured by scanner itself. Scanner timing pulse triggered EEG, NIRS, and NIBP. EEG was also synced with the scanner's clock signal via SyncBox device. On the right side the raw signals from each measurement device are shown. The starting point of the measurement can be clearly seen from the beginning of scanning artifact in the EEG signal. EEG, electroencephalography; NIRS, near-infrared spectroscopy.
Example data from a single subject's
Correlations to MREG DMNvmpf
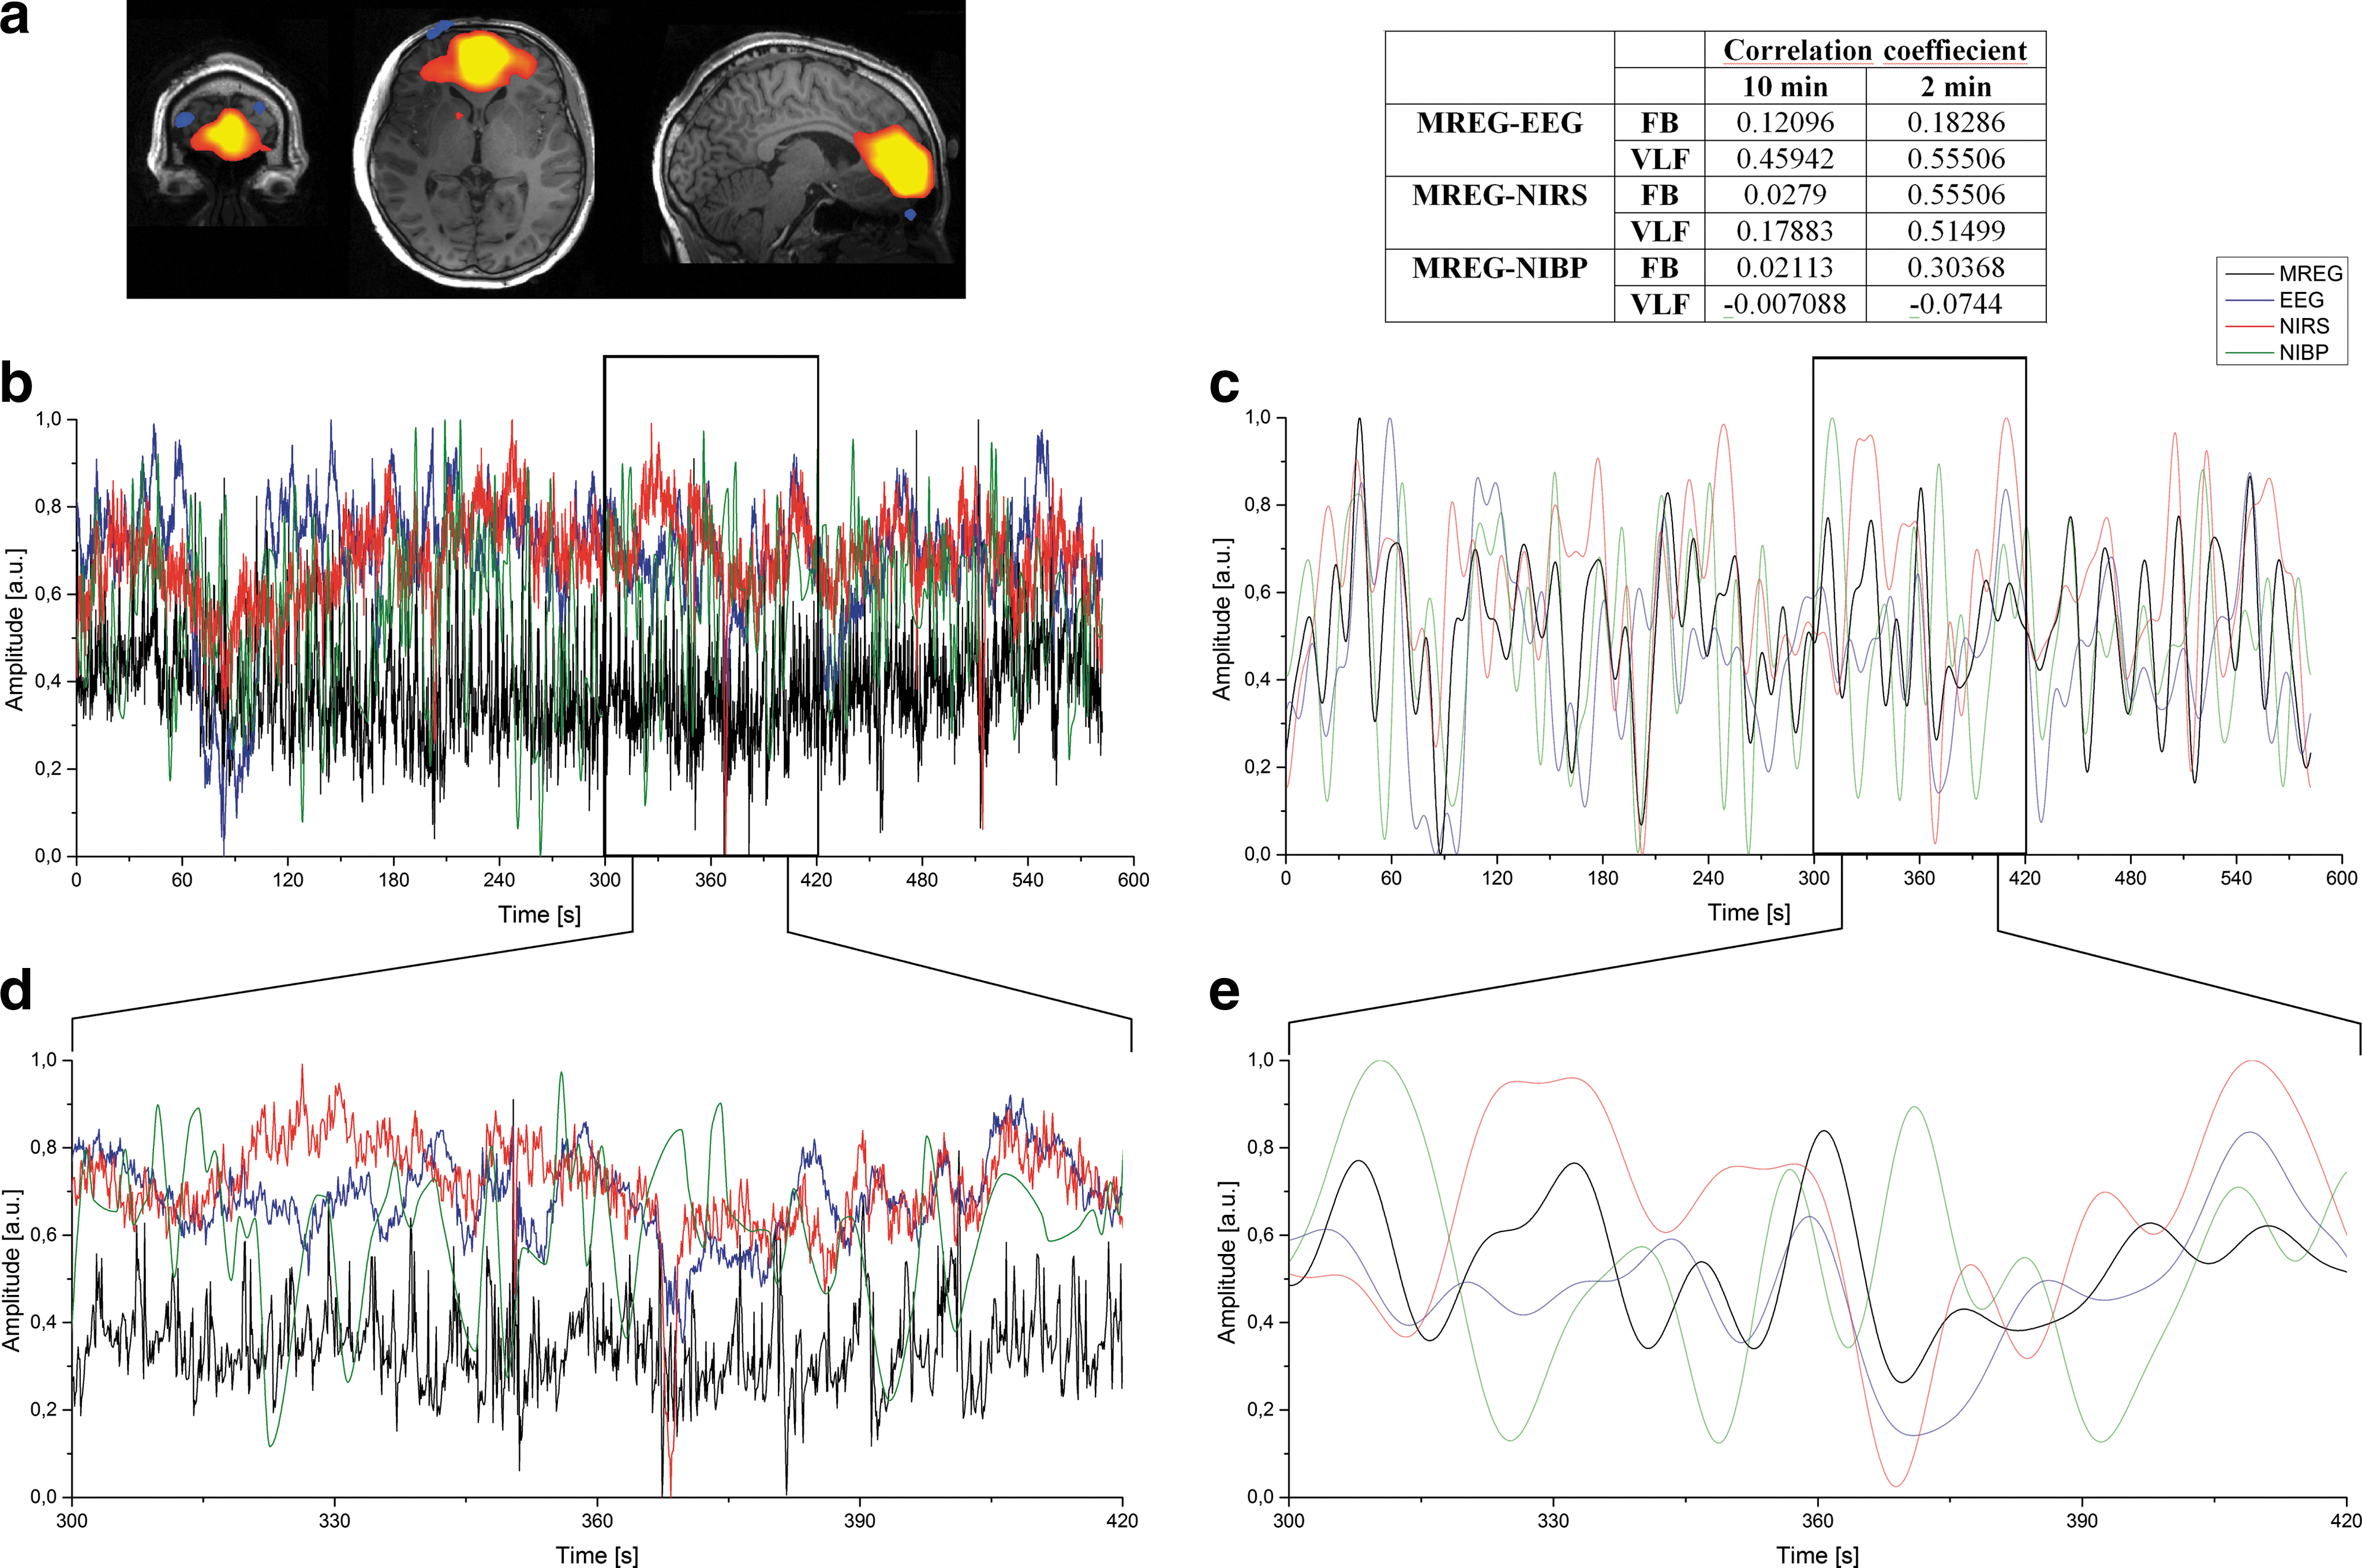
Correlations were calculated between the selected MREG IC component (DMNvmpf) time course and other modalities (EEG IC, NIRS, and NIBP). MREG DMNvmpf z-statistic map is represented in Figure 3a. Correlations were calculated with two different time window lengths (10 min and 2 min) and both with two different frequency bands (FB and VLF). Examples of compared 10-min FB signals from one subject are presented in Figure 3b and corresponding VLF signals in Figure 3c. Figure 3d and e presents the enlarged sections (2 min) of the original signals indicated by the black block in Figure 3b and c. Table in Figure 3 shows one subject's individual correlation coefficients between signals illustrated in Figure 3b–e.
Average correlations and corresponding standard deviations (SDs) between selected EEG IC and DMNvmpf were 0.25 (0.06), NIRS-Hb and DMNvmpf 0.14 (0.14), NIRS-HbO and DMNvmpf 0.12 (0.11), and NIBP and DMNvmpf 0.11 (0.11) in 10-min measurement using the full frequency band (Fig. 4). The same respective correlations and SDs were 0.30 (0.06), 0.24 (0.17), 0.18 (0.13), and 0.11 (0.08) in the VLF band. All aforementioned 10-min correlations were significantly (p<0.05) lower than highest 2-min ones. Mean correlation and statistical results are presented in Table 1.
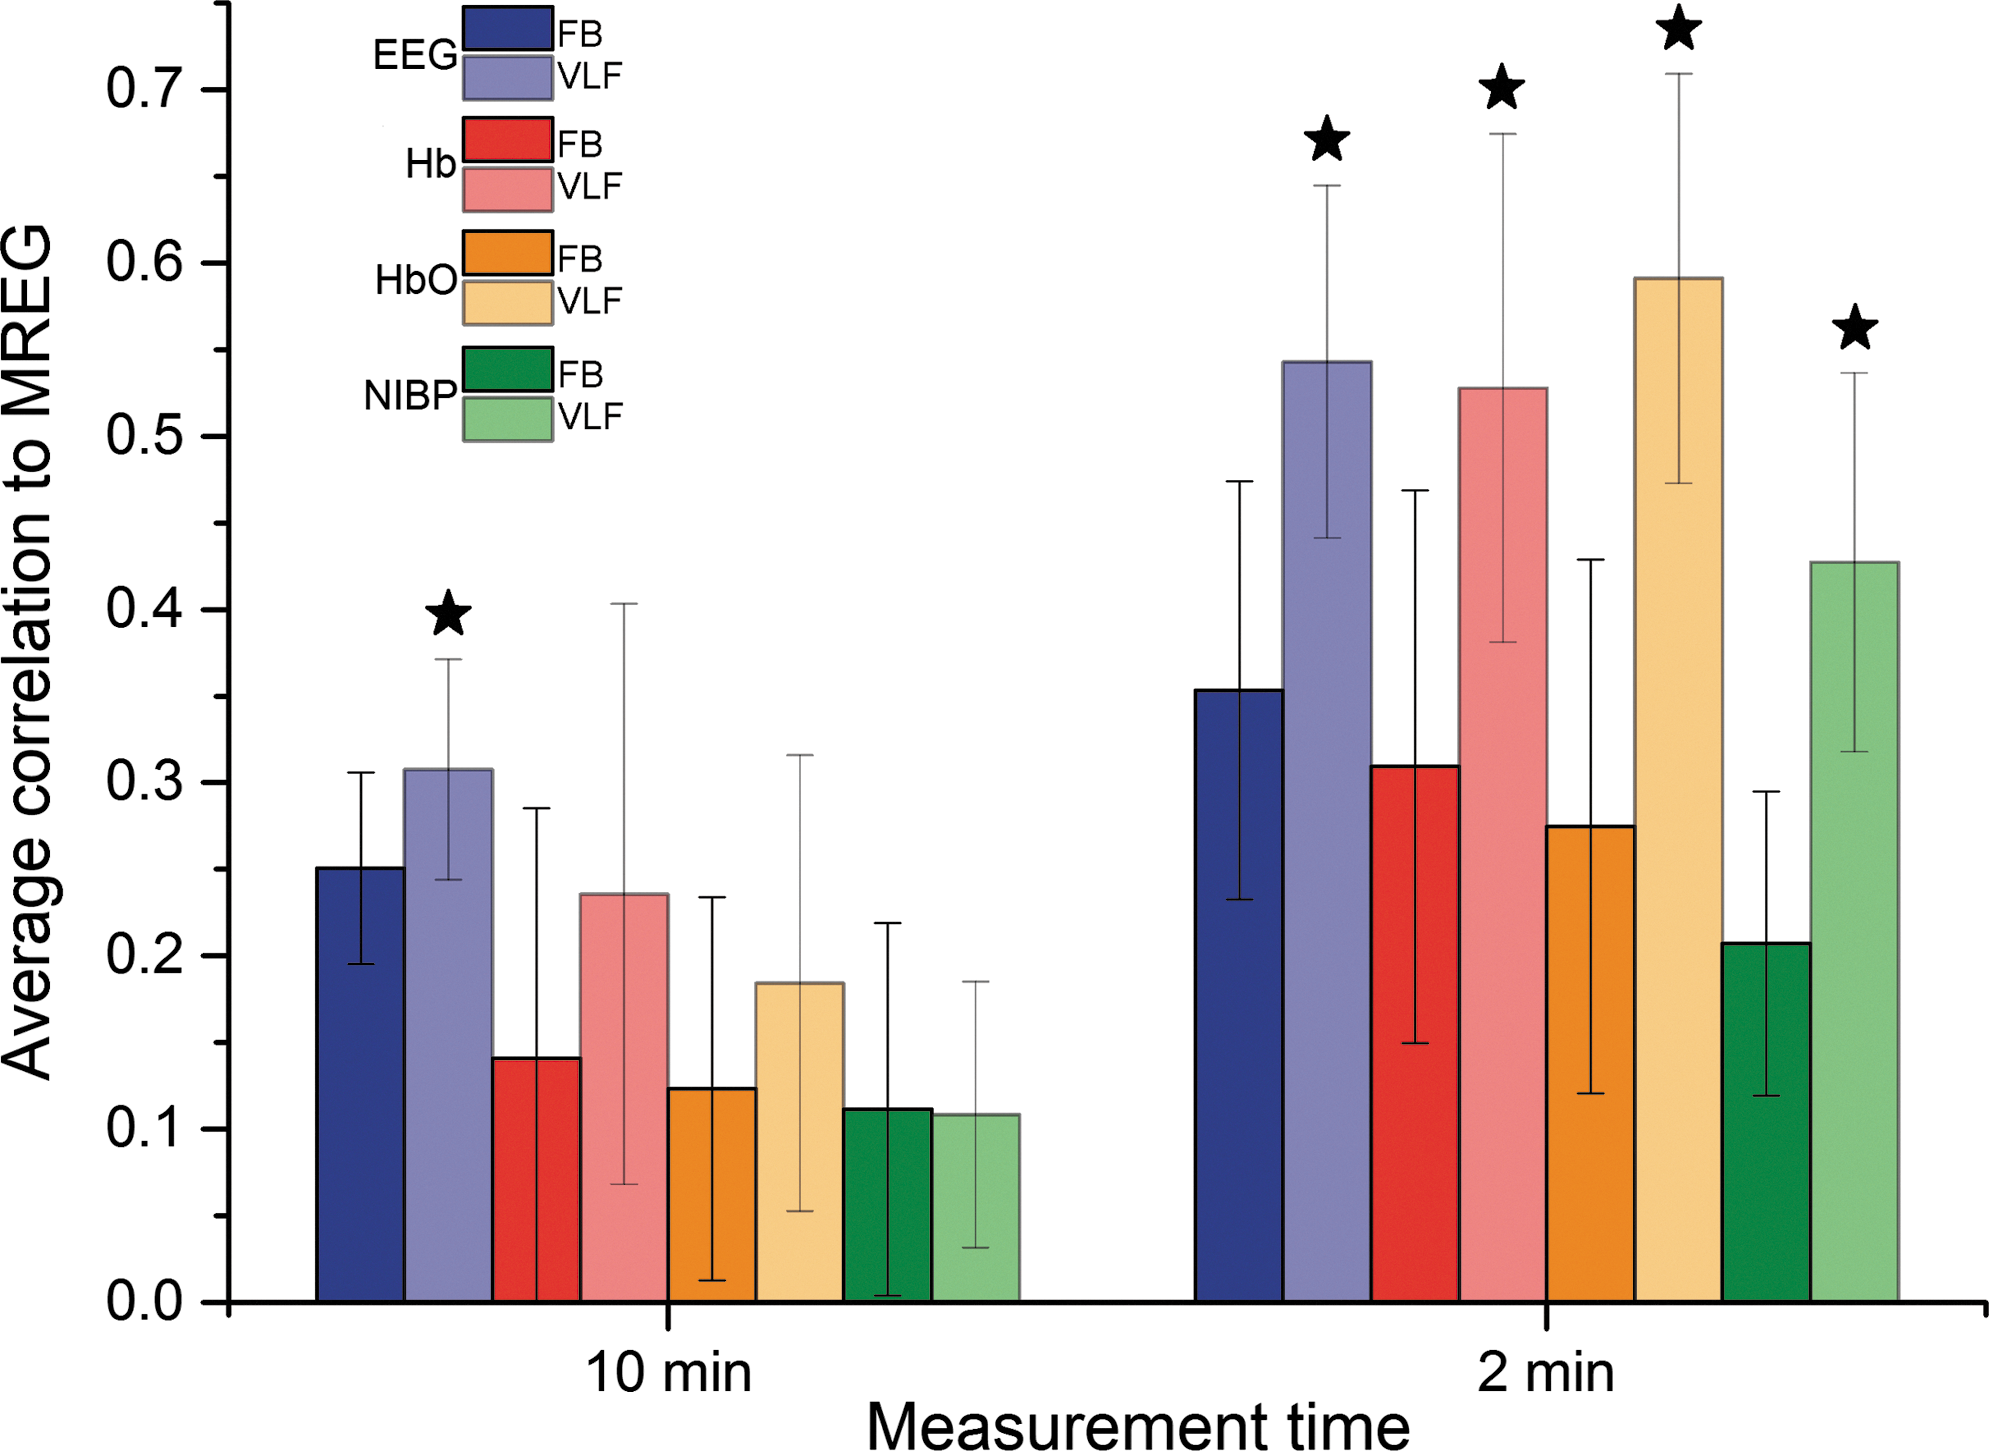
Average correlations and their SD bars between MREG DMNvmpf and EEG IC (blue), DMNvmpf and NIRS-Hb (red), DMNvmpf and NIRS-HbO (orange), and DMNvmpf and NIBP (green) both on whole 10-min measurement (left) and on highest 2-min time window (right) and both on FB and on a VLF band. VLF bars are lighter on color. All VLF correlations that are significantly higher than corresponding FB correlations are marked with a star. All 2-min correlations are significantly higher than corresponding 10-min ones. HbO, oxyhemoglobin; SD, standard deviation.
Correlation Coefficients Between Different Modalities
Average correlation coefficient values between different signals and their SD. Also, t-test p values are presented in the rightmost columns.
EEG, electroencephalography; FB, full band; Hb, deoxyhemoglobin; HbO, oxyhemoglobin; MREG, magnetic resonance encephalography; NIBP, noninvasive blood pressure; SD, standard deviation.
In Figure 4 we have presented absolute values for average correlations between different modalities and DMNvmpf signal. To further demonstrate the temporal variability of the intermodality correlations, we also present highest positive and lowest negative 2-min time window average correlations in Figure 5. Table in Figure 5 shows the mean correlations: highest positive correlations range from 0.35 to 0.09 while lowest negative correlations range from −0.18 to −0.09 on FB. On VLF the highest positive correlations range between 0.54 and 0.35 and the lowest negative correlations range from −0.04 to −0.41. The only significant (p<0.05) difference between highest positive average correlation coefficients and absolute values of lowest negative correlation coefficients were found in DMNvmpf versus EEG IC correlations (FB and VLF). There was no significant correlation between the order number of the 2-min time window versus number of maximal correlation hits in either VLF data (F=3.09836, p=0.12176) or FB (F=1.3527, p=0.28292).
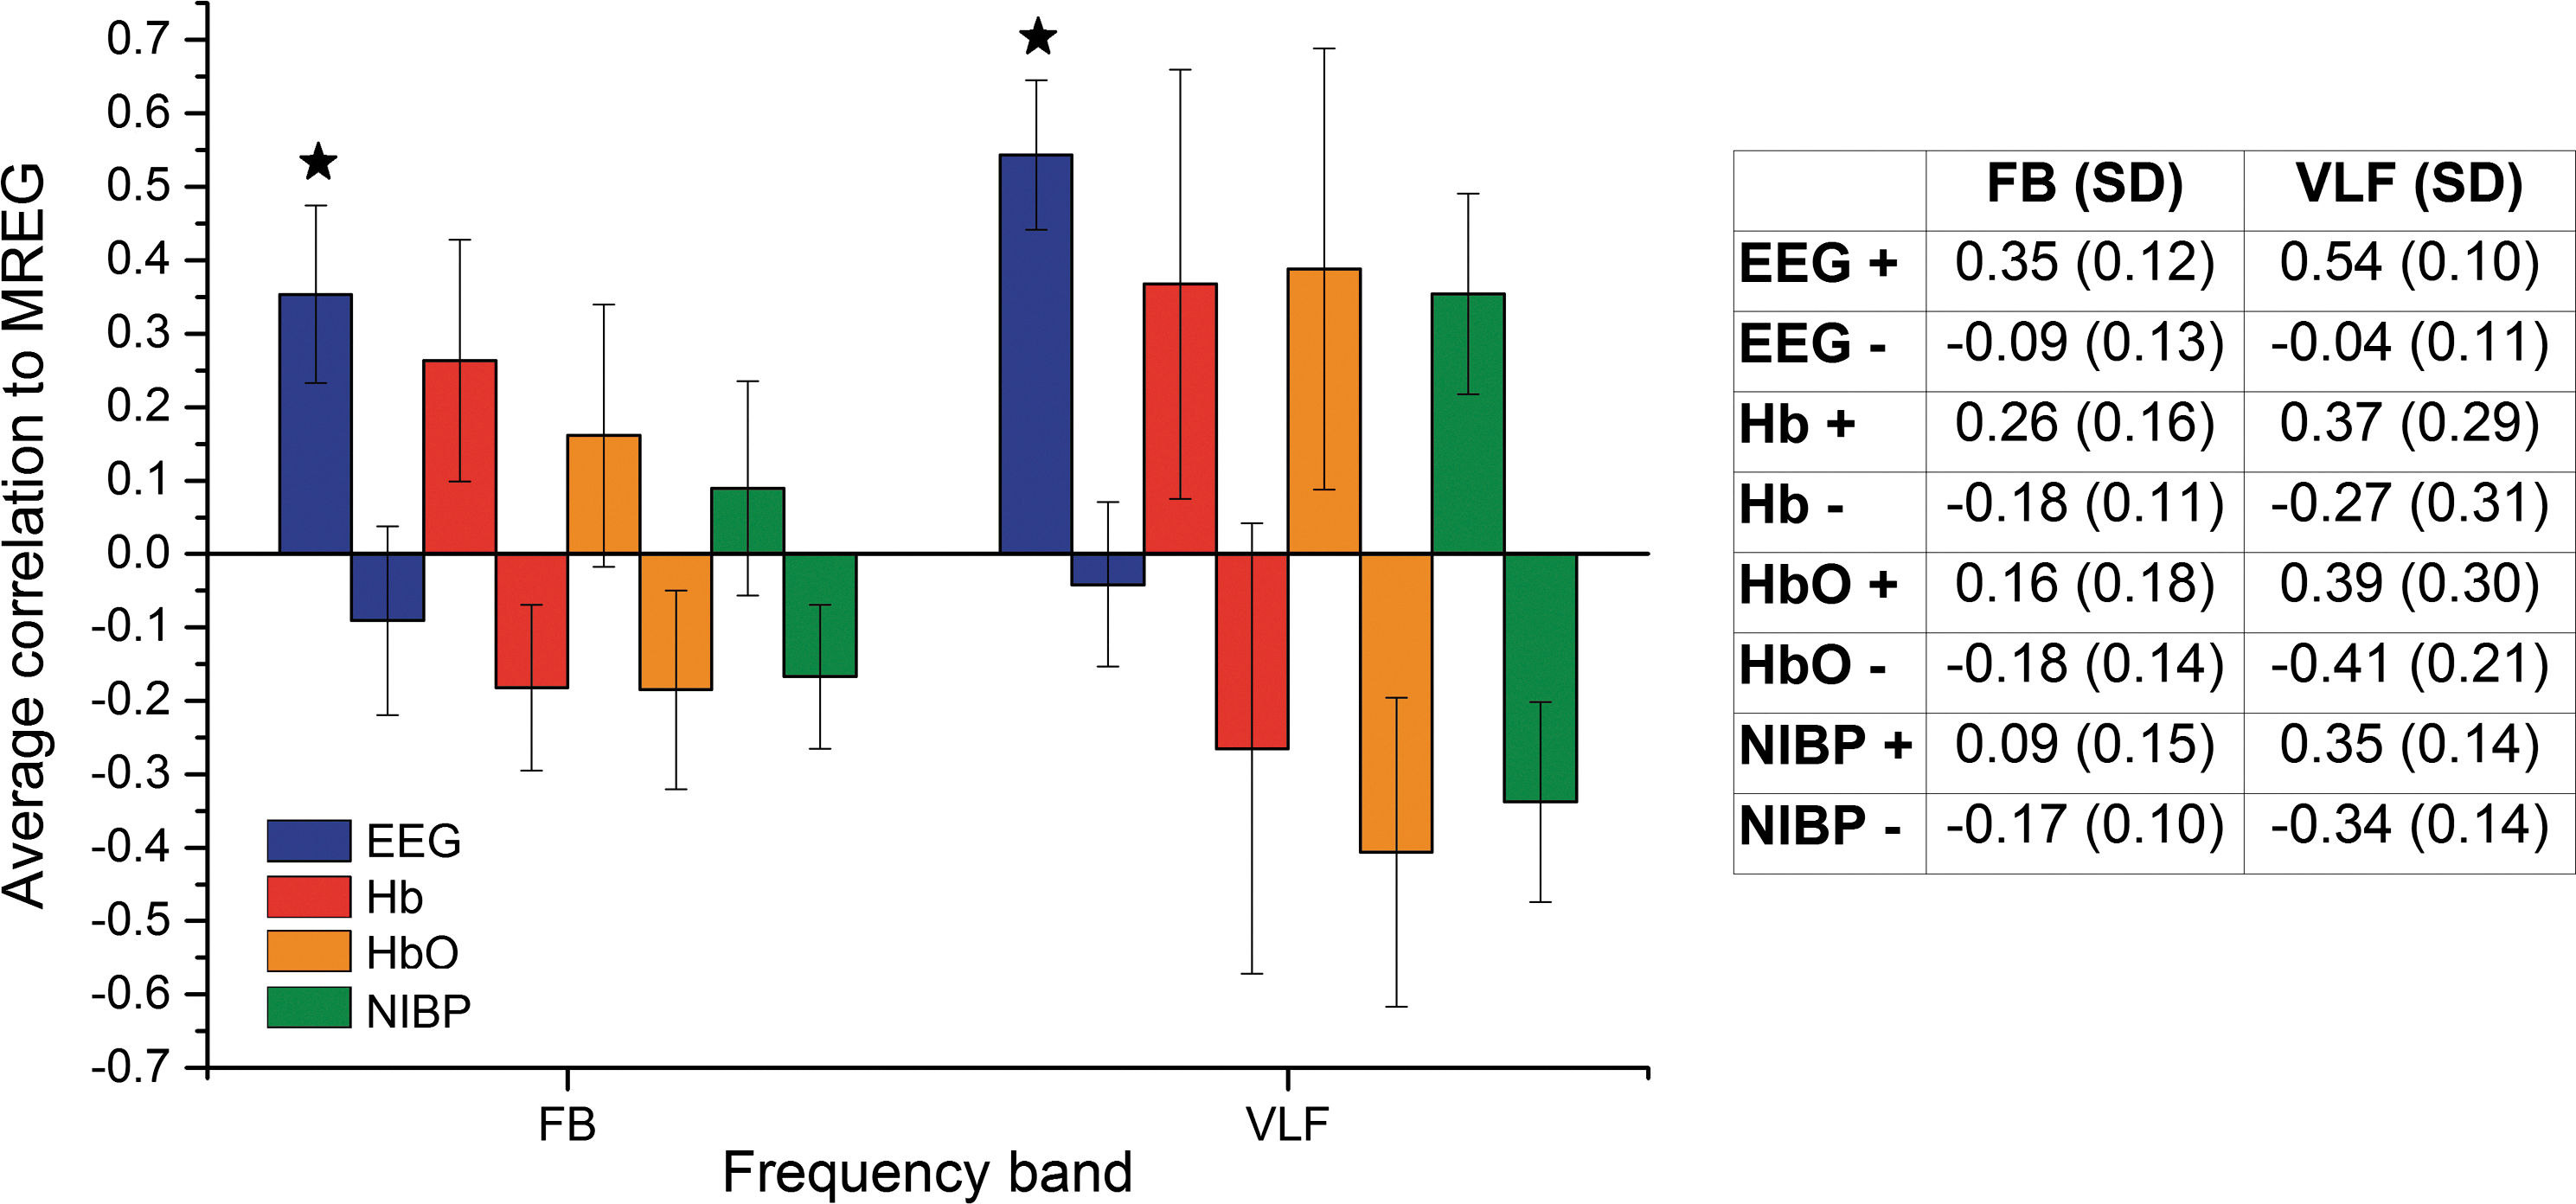
Average correlations (both highest positive and lowest negative) and their SD bars between MREG DMNvmpf and EEG IC (blue), DMNvmpf and NIRS-Hb (red), DMNvmpf and NIRS-HbO (orange), and DMNvmpf and NIBP (green) on FB (left) and on VLF (right). Table presents average correlation coefficient values (highest positive [+] and lowest negative [−]) and their SD. Significant difference between highest positive and absolute value of lowest negative is marked with a star.
EEG/NIRS/NIBP signal correlations
Average correlations were calculated between EEG ICs, NIRS, and NIBP signals with two different time window lengths (10 min and 2 min) and each with two different frequency bands (FB and VLF). Average correlation coefficients and their SDs are presented in Figure 6 and values in Table 1. All average correlations were higher in VLF than in an FB and also in 2-min time window than in whole measurement (10 min). In addition, all differences were statistically significant except two cases (10 min VLF vs. FB in between EEG-NIBP and Hb-NIBP correlations). The highest correlations were always between EEG IC and NIRS-Hb. Notably the correlations between EEG and NIRS Hb exceed those between EEG and MREG in 2-min time window.
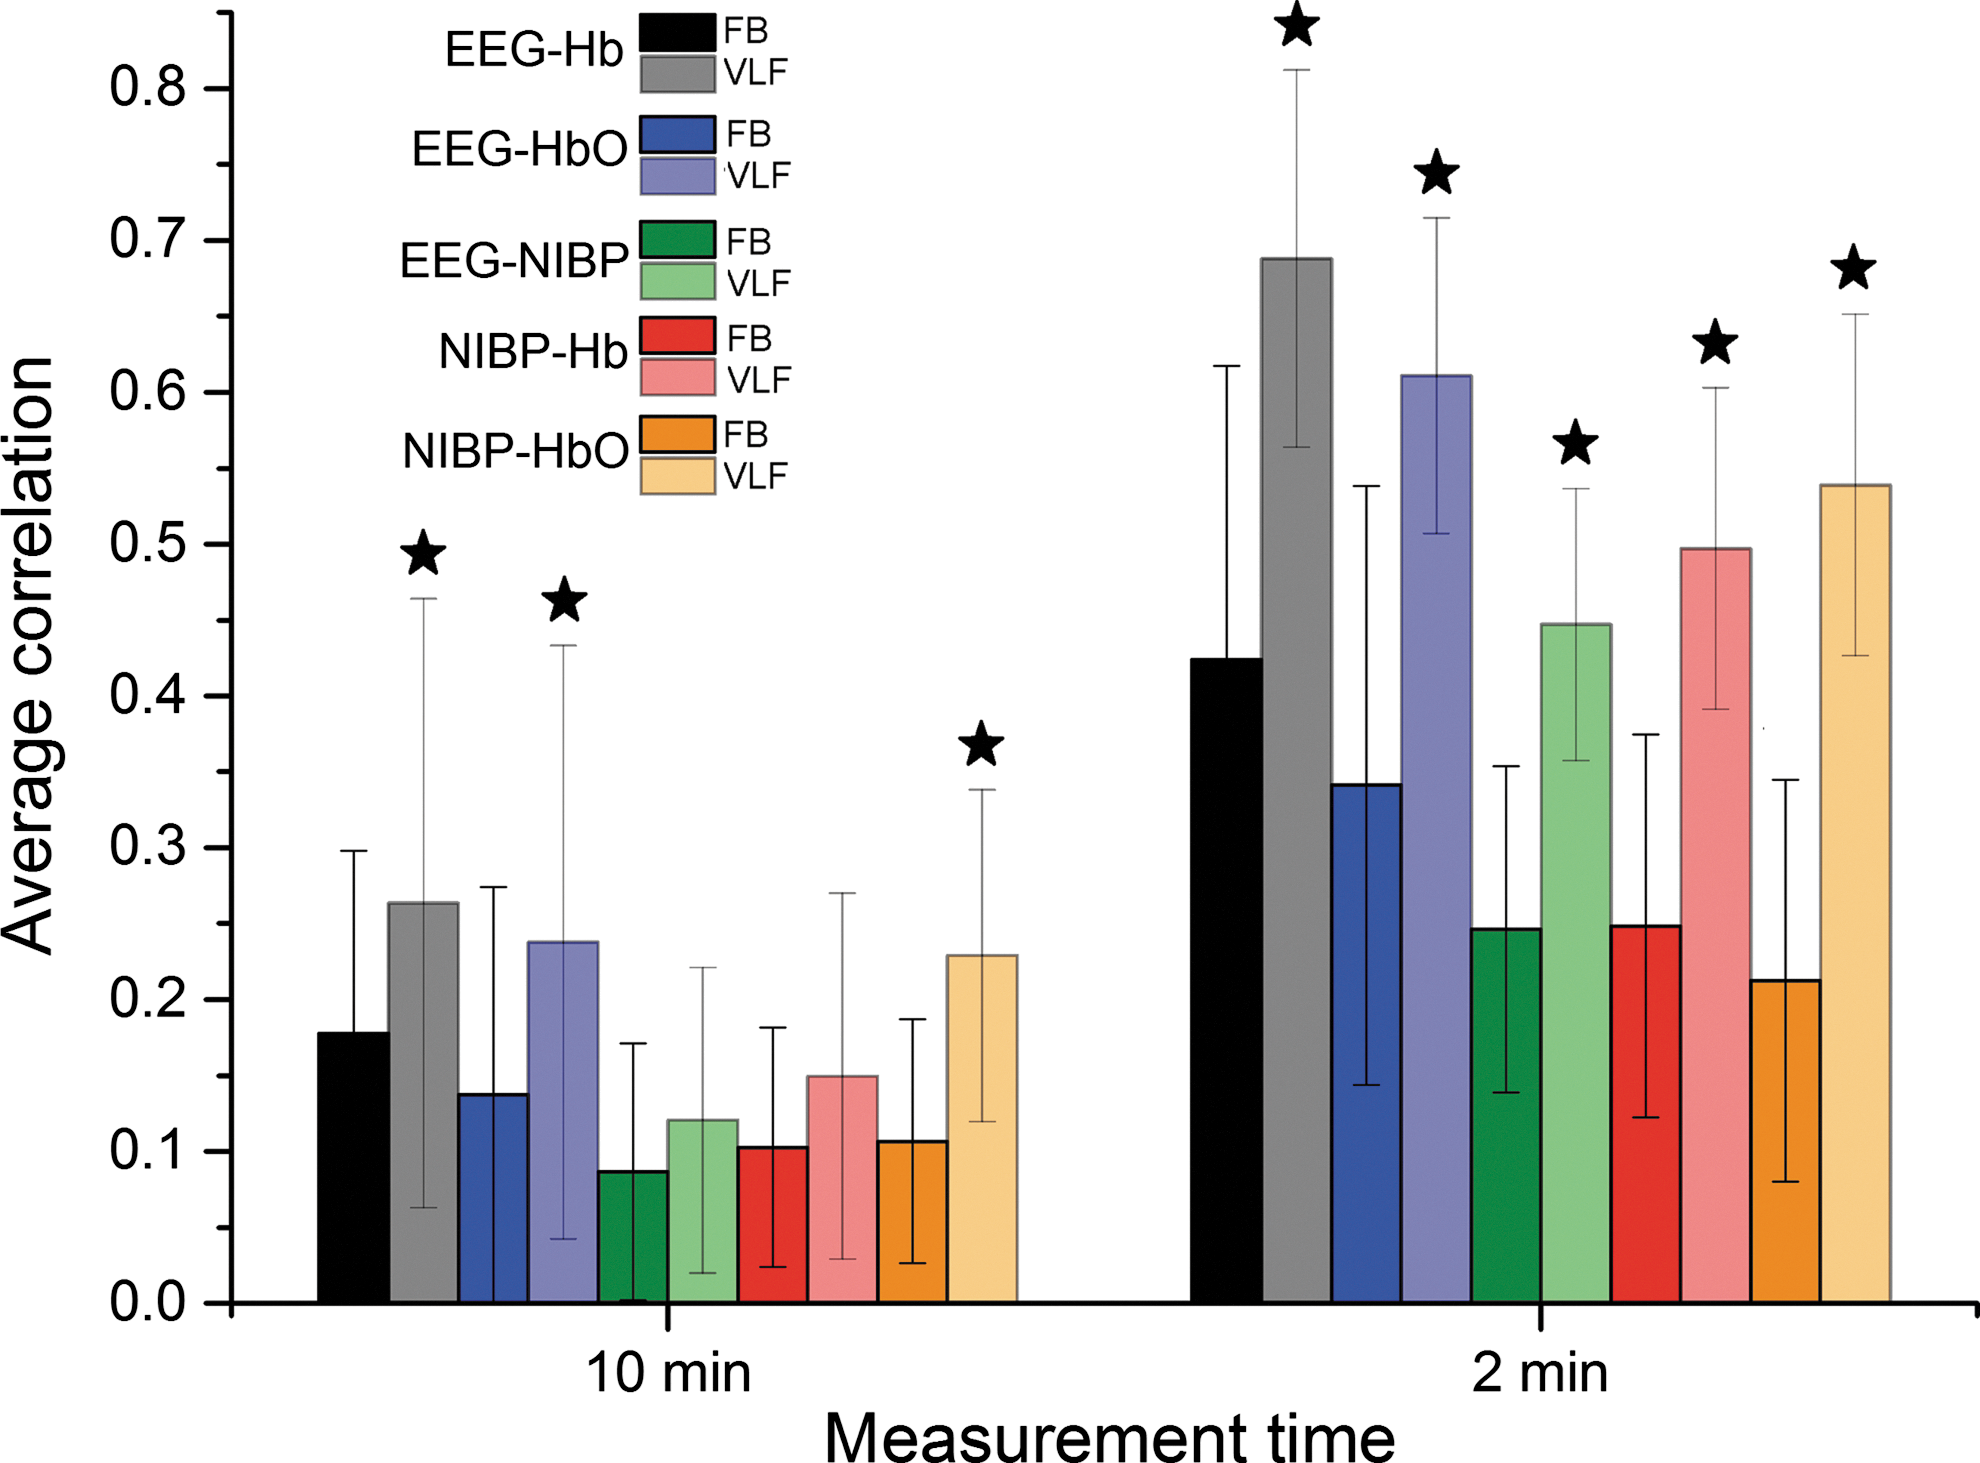
FB and VLF average correlations and their standard deviation bars between EEG IC and NIRS-Hb (black), EEG IC and NIRS-HbO (blue), EEG IC and NIBP (green), NIRS-Hb and NIBP (red), and NIRS-HbO and NIBP (orange) both on whole 10-min measurement (left) and highest 2-min time window (right). VLF bars are lighter on color. All VLF correlations that are significantly higher than corresponding FB correlations are marked with a star. All 2-min correlations are significantly higher than corresponding 10-min ones.
Discussion
In this study we show that it is feasible to scan critically sampled 3D human MREG BOLD signal with all major physiological parameters in the Hepta-scan concept. ICA-based dual-regression procedure enables very high statistical power to the analysis and minimizes source variance overlap of the critically sampled 10-Hz MREG data. We show now that non-aliased VLF BOLD fluctuations are more linked to DC-EEG signal source oscillations than other sources. This study also shows for the first time that there is a correlation between vasomotor BP waves and BOLD signal oscillations of DMNvmpf. In addition we can correlate the NIRS and measure both Hb and HbO oscillation contributions to the BOLD signal in the default mode network. We discovered a new form of temporal dynamics in the correlations between the multimodal data and offer new perspectives to the understanding of the brain activity that cannot be understood by measuring any of the multimodal data alone.
Hepta feasibility
At the present time, we have successfully combined most relevant neurophysiological modalities to our Hepta-scan setup. Hepta-scan allows noninvasive, simultaneous, and continuous measurement of such a wide range of most used modalities in brain studies, including MREG, EEG, NIRS, NIBP, expCO2, SpO2, and ECG, and all in millisecond synchrony. Importantly, responses gathered with the different methods are not influenced by each other, but are totally independent.
Multimodal measurements are increasingly being employed in neuroimaging to utilize simultaneous measurements, especially in the brain studies, such as combined EEG and fMRI (Huster et al., 2012; Laufs, 2012), NIRS and fMRI (Cooper et al., 2012; Sasai et al., 2012; Tong and Frederick, 2010), or EEG, NIRS, and NIBP (Nikulin et al., 2014; Pfurtscheller et al., 2012; Toronov et al., 2013). Comprehensive understanding of the brain and its functioning requires a simultaneous exploration of the brain and other physiological signal sources during brain activity. Combining simultaneous multimodal measurements from different techniques allows a description of human brain activity using a range of spatial and temporal precision and contrast mechanisms that is not possible to achieve by any single imaging modality (Ferrari and Quaresima, 2012). This data can further be used to analyze correlations, mechanisms, and relationships of physiological signals and their dynamics in relation to brain functions.
EEG versus MREG
Several studies have shown that BOLD signal reflects electrophysiological activity (Huster et al., 2012; Laufs, 2012). Even though EEG has scale-free 1/f characteristics, studies that correlate EEG to fMRI concentrate on higher frequency bands and not on VLF band at all (He et al., 2010; Palva et al., 2013). In this study we show also EEG ICs VLF band correlation values with MREG DMNvmpf. Maximal correlation coefficients of 0.3 between local field potentials (LFPs) and BOLD signal indicate that only some 10% of BOLD signal variance is explained by neuronal activity (Pan et al., 2013; Schölvinck et al., 2010; Shmuel and Leopold, 2008). Recently correlation coefficient between VLF EEG ICs and MREG DMNvmpf was reported to be 0.14 (Hiltunen et al., 2014). In this study the average correlation coefficients between EEG ICs and MREG DMNvmpf can reach on average 0.55 in VLF band for optimal 2-min time window. Also, the average correlation over the 10-min FB was still 0.25, which is within the normal values obtained by other groups with classical low-sampling-rate BOLD.
The correlation coefficients were considerably higher even though we used temporal instead of spatial correlation values in selection procedure. In other words we calculated correlation coefficients between MREG and EEG IC timeseries and not the voxel vise correlations between spatial maps as in previous study (Hiltunen et al., 2014). This way we get temporal information of correlations between EEG and MREG. The previously reported relatively low correlations between EEG ICs and BOLD could be due to the marked discrepancy in sampling rates of both data. MREG sequence has higher sampling rate that allows correlating these signals more accurately and thereby results in higher correlation values. This could indicate that DC-potential shifts might explain BOLD signal more than earlier thought.
GLM analyses of ultrafast BOLD data use a noise term of fifth-order autoregressive (AR) process to account for additional autocorrelations originating from the higher-temporal-resolution data. Importantly, we avoided the need for autocorrelation corrections by using dual regression of MREG signal (Boyacioglu et al., 2013b). The autocorrelation corrections in the fifth order reduce statistical power of the signal and, partially due to this reason, our dual-regression-based results have higher correlation as well.
It has also been shown that BOLD signals are delayed relative to LFP changes and shifting BOLD signal significantly improves correlation values (Pan et al., 2013; Schölvinck et al., 2010; Shmuel and Leopold, 2008; Thompson et al., 2014). In this study we did not use any time shifts and still reach average correlation value of 0.55 with VLF EEG IC in 2-min time period. Shifting signals could improve the correlation values even more and this is something we will research in future.
NIRS versus MREG
There are only a few publications where fMRI and NIRS time signals are compared together when they are measured simultaneously from the brain in resting state (Cooper et al., 2012; Greve et al., 2009; Sasai et al., 2012; Tong and Frederick, 2010; Tong et al., 2011). Recently increasing attention has been paid to applying functional NIRS to investigate resting-state functional connectivity (Duan et al., 2012; White et al., 2009). To the best of our knowledge, this study was the first one where ultrahigh-temporal-resolution fMRI and NIRS signals are compared together.
The use of critical sampling is a very important factor related to fMRI data because now we were able to filter out all the high frequencies (respiration and cardiac) faithfully in VLF band without aliasing. Because of that this study supports the fact that VLFFs arise from physiological processes rather than experimental acquisition-induced artifacts and that it is not mainly the aliased signal from cardiac pulsation and respiration (Tong, 2012). In addition, Tong and coworkers (2013) are thus far the only ones who have used ICA in their correlation analyses between peripheral NIRS and classical BOLD. They showed that DMN component signal was not highly correlated with peripheral blood oxygenation fluctuations. In contrast to this, our central vasomotor wave signals gave higher correlations reaching up to 0.6 average coefficients in VLF 2-min time windows, suggesting a somewhat closer relationship to the DMNvmpf signals.
Typically fMRI exploits the BOLD signal, which is widely thought to correlate with Hb (Huppert et al., 2006; Toronov et al., 2001). However, especially in resting state, it is not so clear and BOLD increase (an Hb decrease) may correspond to an increase in oxygenation, or a decrease in blood volume (Hillman, 2007). That is why we have presented in this study both Hb and HbO average correlations to MREG DMNvmpf, EEG IC, and NIBP. In our calculations Hb signal correlated mainly better to MREG DMNvmpf signal than HbO signal. However, an exception was the highest 2-min time window average correlation where HbO correlated slightly better to DMNvmpf than Hb.
NIBP versus MREG
This current study is the first that succeeds in coregistering BP waves noninvasively in a human and compares the pressure waves directly with BOLD signal oscillations. Since the dawn of resting-state fMRI scanning, blood flow fluctuations (i.e., Mayer waves of BP) have been related to low-frequency fluctuations of the measured BOLD signal (Biswal et al., 1995; Kiviniemi et al., 2000). A classical work on the issue is the study by Kannurpatti and Biswal where they replicated the earliest exanguination vasomotor studies by Hales from 1733 (Miakawa et al., 1984) by showing that withdrawal of blood from an anesthetized rat increased low-frequency oscillations of the BOLD signal markedly (Kannurpatti et al., 2008).
The correlations between vasomotor tone waves detected by the NIBP and MREG signals are almost within the same range in strength as the NIRS versus MREG correlations, reaching in VLF 2-min time windows nearly 0.45 correlation coefficient values on average. Moreover, using only the VLF increases the strength of correlation markedly with the MREG signal as well as in comparison with the EEG, Hb, and HbO signals. Similarly the NIBP correlations have a marked temporal variability as well. The reason for this variability is not known and it requires further research on the matter on a more precise way with correlation phase analytics. In general, the NIBP signal correlation strength is not very high over extended periods of time. This could in principle be anticipated from the general principle of cerebral autoregulation, which states that the cerebral blood flow stays relatively stable over perfusion pressure changes. However, this seems to be true to a certain degree and indeed the vasomotor waves do not explain more than a few per cent of the MREG, NIRS, and EEG signal variability.
The correlations could perhaps be increased with more advanced probe technology that is currently being developed. Validation of NIBP measurement by accelerometers is still in progress but, as could be seen from Figure 1, so far comparisons between NIBP and IBP responses have been indicating a good correspondence even with relatively fast-respiration-induced BP variations. However, more measurements are still needed to provide a numerical evaluation of the NIBP method's accuracy and correlation to IBP. Moreover, work is also in progress to enhance accuracy and reliability in situations where one sensor temporarily fails to produce a good signal. This may be the reason for the low correlation coefficients in a whole measurement window.
Physiological signal correlations (without MREG)
The highest intermodal correlations, including MREG, were found between Hb and EEG IC, that is, maximally on average 0.69 in VLF range for 2-min time window. Also in previous studies, simultaneous NIRS-EEG measurements have shown correlations between alpha activity and both Hb and HbO (Bari et al., 2011; Moosmann et al., 2003). Bari and Calcagnile found EEG alpha power to correlate with Hb with correlation value 0.23 and with HbO 0.20. In both of the calculated time periods and both full and VLF bands, the EEG IC correlation with Hb was higher than with HbO as in previous study (Bari et al., 2011).
Also, NIBP and Hb/HbO correlated with each other. Hb correlated slightly better than HbO with EEG and HbO a bit better with NIBP. Nikulin and associates (2014) showed recently that EEG correlates with NIRS and NIBP. In their measurements, NIRS and NIBP coherence with EEG was approximately similar. In our measurements NIBP correlated also to EEG but not as much as NIRS.
FB versus VLF
Correlations were higher in VLF band in all measurements (except for NIBP 10-min FB), even though our sequence allows higher frequency analysis as well. Our preliminary investigations on cardiorespiratory impulse effects in human 3D BOLD signal reveal strongly pulsatile nature of the effects both in 3D and time, which may be nearly impossible to remove from undersampled data with interleaved classical BOLD EPI scans. Our data have high temporal resolution in every modality and it enables us to filter out properly all the higher frequency cardiorespiratory signals. The removal of cardiorespiratory signals in the VLF smoothies the signal and increases the correlation significantly.
The reason why the VLF signals correlated significantly better than FB signals between DMNvmpf and NIRS is that in both modalities VLF oscillations (<0.1 Hz) are dominating (Tong, 2012; Tong and Frederick, 2010). This same phenomenon can be seen also between DMNvmpf and both EEG and NIBP. The VLFF similarity and increased intermodal correlations suggest a common source for signal variability that may be nonneuronal (Vanhatalo et al., 2004; Voipio et al., 2003).
Temporally dynamic correlation
There is increasing knowledge on the dynamic nature of the correlations and our critically sampled Hepta-scan data offer unique approaches to the issue. All of the Hepta-scan multimodal signals have higher correlation coefficients when calculated in shorter time windows. Although it could in theory be due to lower statistical accuracy, the signal sampled with 10 Hz still has 1200 time points from 2-min MREG measurements. This corresponds to 40 min of TR 2-sec BOLD data. This implies that none of the physiological signals are stable over time so all affect BOLD signal differently in different time points. The reason for this new discovery is not known currently.
All modalities presented both positive and negative correlations to MREG in 2-min analyses (compare Fig. 5). Taken together, these varying correlation values average out and so the 10-min analyses have lower correlation values. The reason for this nonstationarity is not clear. Its emergence in our data may be related to increased data-sampling rate; the FB data have rich physiological noise reducing the correlation. The VLF data on the other hand are now much better filtered and do not have aliased signal that reduces correlation results. Critical sampling thus adds to the intermodal correlation due to non-aliased noise sources.
Moreover, the temporal variability is present actually between all modalities (data not shown). Noncritically sampled NIRS versus fMRI data from Tong and associates (2012) show that LFFs (0.01–0.15 Hz) are not static, but instead, travel over the cortex and arrive at different brain voxels at different times. Quasi-periodic activity patterns linked to LFP spread over the brain cortices in time both in rats and in human subjects in very low frequencies (Majeed et al., 2011; Thompson et al., 2014). These quasi-periodic fluctuations in the cortex may affect topical NIRS and EEG measurements in the scalp dynamically. We are investigating the effects of quasi-periodic pulsations and periodic cardiorespiratory pulsations in the formation of EEG and NIRS signals. Moreover, heart rate variability can be linked to the generation of these pulsations as well (Chang et al., 2013).
One reason could be local adaptive vasomotor control phenomena suggested by Sirotin and Das (2009). The localized vasomotor changes dominate on task/stimulus-state transitions, which may well exist also in resting DMN. Another reason might be metabolic oscillations that are known to be functionally connected at least in some studies (Obrig et al., 2000; Vern et al., 1997). The spatiotemporal structure of metabolic oscillations remains to be shown in human data until now. Another factor might be the combined effects of electromagnetic alterations in the human brain cortex due to DC shifts; the magnetic signal may be differentially affected due to the strong DC-potential oscillations on the cortex. The spin changes in the presence of DC-changes in the 3T field may be overlooked. These effects need to be analyzed in the future.
Limitations and future prospects
In the interest of space we only performed zero-lag analyses. Partly related to this the use of absolute values may miss phase differences between measured signals as well. In the interest of the nonstationary activity, we will perform advanced nested phase and coherence analytics and maximize intermodal correlation with individual phase shifting to optimize the results. Also, novel neuronal avalanche analyses, such as CAP by Liu and Duyn (2013), and sliding window ICA analyses will be employed in the future (Hutchison et al., 2013). In the future we will investigate the effects of (quasi-)periodic MREG signal patterns that can now be measured with critical accuracy. We will also use shorter time windows to get better idea of temporal behavior of different signals.
In this study we chose the EEG IC that had the highest correlation coefficient with MREG DMNvmpf and used it in all other correlations as well. The selection of highest EEG IC versus DMNvmpf was used earlier as well (Hiltunen et al., 2014). This has unavoidably influenced to correlation coefficients with other modalities and this is something we will research more in future studies. Different EEC ICs were shown to correlate with NIRS or NIBP more (data not shown). Further, the spatial representation of the EEG ICs is not completely similar between subjects since we chose the temporal correlation as a selection criterion. Denser EEG lead distribution would be required for accurate mapping of spatial distribution of the EEG sources. Moreover, it seems that the DMNvmpf is also spatially nonstationary and thus its EEG source localization would require adaptable source localizer algorithms allowing spatial nonstationarity (Kiviniemi et al., 2011).
To be realistic with our setup we decided to include all subjects into this first publication regarding the multimodal Hepta-scan. For that reason some intermodal correlations were not optimal; NIRS data could be quite noisy in some individuals probably due to poor contact between the optodes and the scalp. Also, the NIRS optodes could be suboptimally placed compared to the group-PICA DMNvmpf map. Individual ICA results seem to offer somewhat better results; differences in individual RSN profiles or on how many Hb/HbO-modulating sources occur in the path of the NIRS photons affect the results (Tong and Frederick, 2010). Issue of interest for further analysis is the anticorrelating voxels within the DMNvmpf component.
NIBP may not always be as accurate as IBP measurement but these cannot be taken without vital indications on the subject. More-advanced probe technology could increase the sensitivity to beat-to-beat BP variability of the cardiac pulses, especially in patients with lots of fat tissue that suppresses the propagation of pressure pulses. Moreover, poor attachment of the acceleration sensor may result as an unclear signal response. Therefore, improvements for the attachment method of the sensor, especially in neck, still have to be done.
BOLD signal is influenced by metabolic, electrophysiological, and vasomotor fluctuations (Kiviniemi, 2008). Hepta-scan concept allows us to measure vasomotor and electrophysiological fluctuations but a missing issue is the lack of metabolism. Vern and coworkers (1997) and Obrig and associates (2000) have shown that metabolic oscillations exist in brain but their measurement is still demanding and currently we have not been able to measure those. Via international collaboration we may be able to get more advanced signal separation of metabolic substrates from the NIRS data. Metabolic oscillations might explain some of the temporal dynamics of intermodal correlations. The multimodal data itself can be used to further de-noise the MREG signal. For example, NIRS data are used for verification of BOLD signals from the brain cortex and for removal of cardio-respiratory signals from MREG data for more accurate analysis of neurophysiological events.
Conclusions
Critically sampled multimodal brain imaging is feasible and offers unpresented information on the contributions of physiological signal sources on neuroimaging signals. The results supported the hypothesis that low-frequency fluctuations reflect the simultaneous activity of several physiological fluctuations. Optimized electrophysiological DC-EEG signal has highest correlation to the measured MREG BOLD signal from DMNvmpf. Frontal HbO/Hb levels and central vasomotor waves also correlate with default mode network. High sampling rate of the data revealed strong temporal variability in correlation between measurements. Focusing on VLF power <0.1 Hz increases the correlation of most measurements significantly, suggesting a common source of VLF variability.
Footnotes
Acknowledgments
The authors would like to extend their warmest thanks to M.Sc.(Tech) student Aleksandra Zienkiewicz (Gdansk University of Technology) for her assistance in NIBP data analysis. The SalWe Research Program for Mind and Body (Tekes—the Finnish Funding Agency for Technology and Innovation, Grant No. 1104/10), Chinese NFSC number 81020108022 grant, Academy of Finland grants 111711 and 123772, and Instrumentarium Science Foundation grants are cordially acknowledged.
Author Disclosure Statement
No competing financial interests exist.