
Abstract
Functional changes across brain hemispheres have been reported after unilateral cortical or peripheral nerve injury. Interhemispheric callosal connections usually underlie this cortico-cortical plasticity. However, the effect of the altered callosal inputs on local cortical plasticity in the adult brain is not well studied. Ipsilateral functional magnetic resonance imaging (fMRI) activation has been reliably detected in the deafferented barrel cortex (BC) at 2 weeks after unilateral infraorbital denervation (IO) in adult rats. The ipsilateral fMRI signal relies on callosal-mediated interhemispheric plasticity. This form of interhemispheric plasticity provides a good chronic model to study the interaction between callosal inputs and local cortical plasticity. The receptive field of forepaw in the primary somatosensory cortex (S1), which is adjacent to the BC, was mapped with fMRI. The S1 receptive field expanded to take over a portion of the BC in 2 weeks after both ascending inputs and callosal inputs were removed in IO rats with ablated contralateral BC (IO+ablation). This expansion, estimated specifically by fMRI mapping, is significantly larger than what has been observed in the IO rats with intact callosal connectivity, as well as in the rats with sham surgery. This work indicates that altered callosal inputs prevent the functional takeover of the deafferented BC from adjacent cortices and may help preserve the functional identity of the BC.
Introduction
Global functional brain mapping has led to a series of novel discoveries on large-scale brain plasticity across different neural pathways after injuries to sensory systems (Finney et al., 2001; Sadato et al., 1996). A specific form of interhemispheric plasticity has been detected by functional magnetic resonance imaging (fMRI) in animal models with long-term peripheral deafferentation (Pawela et al., 2010; Pelled et al., 2007, 2009; Yu et al., 2012a) and in patients with limb amputation (Frey et al., 2008; Simoes et al., 2012). This interhemispheric plasticity is characterized by fMRI at the deafferented cortex ipsilateral (same side) to sensory input from the intact body part, which also elicits neural activity in the contralateral, homotopic cortical area. This unexpected fMRI activation in the deafferented cortex may have consequences for the neural mechanism mediating phantom limb sensations of amputees (Franz and Ramachandran, 1998; Giummarra et al., 2007; Hari et al., 1998; Simoes et al., 2012). Corticocortical callosal connections between the two hemispheres have been proposed to mediate this plasticity across brain hemispheres (Clarey et al., 1996; Pelled et al., 2007; Pluto et al., 2005). However, the functional role of the callosal-mediated ipsilateral plasticity measured with fMRI is not understood.
A recent study demonstrated robust ipsilateral fMRI activation in the deafferented barrel cortex (BC) in the unilateral infraorbital denervated rat model (IO) (Yu et al., 2012a), which was larger than what had been previously detected in forepaw (FP) and hindpaw (HP) S1 after unitalateral denervation (Pelled et al., 2007, 2009). In addition, a manganese-enhanced MRI (MEMRI) neural tracing study showed that the callosal projections from the intact BC to the deafferented BC have been strengthened in the IO rats (Yu et al., 2014). These results raise the possibility that the altered callosal inputs to the deafferented BC affect plasticity from adjacent brain regions. The hypothesis is that the upregulated callosal input might “protect” the homologous BC from takeover by neighboring cortices, such as the forelimb S1 cortex, after denervation.
The adult cerebral cortex remains highly plastic, though plasticity is significantly reduced after the critical period (Purves et al., 2001). Sensory deprivation-induced local cortical plasticity in the adult brain leads to the functional takeover of the deprived somatosensory cortices, such as the enlarged receptive field from spared digits into the deprived cortex representing amputated digits (Merzenich et al., 1984). Similar plasticity also occurs at ocular dominance columns in the visual cortex (Sawtell et al., 2003) and tonotopic representations in the auditory cortex (Recanzone et al., 1993). Thus, it is clear that limited changes can occur in the local cortical circuits of the adult brain. However, the limiting factors to constrain adult cortical plasticity remain largely unknown.
In contrast to intracortical plasticity, interhemispheric plasticity has been detected in a variety of experiments with different roles played by the corpus callosum (Calford and Tweedale, 1990; Clarey et al., 1996; Pietrasanta et al., 2012). As reported in an early study by single unit recordings in the monkey S1, after the removal of the thumb from one hand, the single unit responses from the unaffected homologus S1 area to the stimulation of the other intact hand showed an expanded representation to cover the adjacent phalangeal area at 2 min after the denervation (Calford and Tweedale, 1990). This plasticity is directly driven through the ascending pathway, but is modulated by an immediate unmasking effect through the corpus callosum (Clarey et al., 1996). Different from the indirect role played by the corpus callosum to modulate bottom-up neural activity, the ipsilateral fMRI activation in the deafferented BC at 2 weeks after unilateral IO denervation was reported to be directly mediated through callosal inputs (Yu et al., 2014). A similar conclusion about the role of callosal inputs to mediate the ipsilateral fMRI activation in the deafferented FP-S1 has also been reported (Pelled et al., 2007). Although the net effect of callosal inputs can either be net inhibition or excitation (Bloom and Hynd, 2005; Pelled et al., 2009; van der Knaap and van der Ham, 2011), it is possible that the altered callosal inputs can interfere with the excitatory/inhibitory balance of the local cortical circuit and influence intracortical plasticity.
In this study, we identified the effects of altered callsal inputs on functional takeover of the deafferented BC at 2 weeks after IO surgery. The forepaw representative cortical area was mapped in both hemispheres with or without the callosal inputs from the homotopic BC that represents the normal, uninjured whiskers in IO and sham rats. The results demonstrated that the strengthened callosal inputs can protect the takeover of the deafferented BC from the expansion of the adjacent FP-S1 cortex.
Materials and Methods
Animal surgeries
The surgical procedures are performed based on the protocol approved by the Animal Care and Use Committee and the Animal Health and Care Resection of the National Institute of Neurological Disorders and Stroke, National Institutes of Health (Bethesda, MD). The infraorbital denervation (IO) has been established in our group, and the detailed procedure was previously described (Yu et al., 2012a). Briefly, IO surgeries were done in 4-week-old Sprague–Dawley rats anesthetized with isoflurane. The infraorbital branch of the trigeminal nerve was stretched from the infraorbital foramen and approximately 2–3 mm distal to the ligature was cauterized toward the vibrissal roots. The rats with IO are called IO rats. For those undergoing a sham procedure, incisions were made but nerve bundle ligation and cauterization was not performed. To reduce the acute and chronic pain due to nerve cut, we applied a few pain-relieving treatments to animals: (1) Soy diet was supplied to animals for the neuropathic pain reduction (Shir et al., 2002). (2) Lidocaine gel (2%) was applied on whisker pad to reduce the pain sensation during surgery. (3) Ketoprofen was injected to animals for 3 consecutive days to relieve the pain. (4) After 3 days, Tramadol was delivered orally if the rats showed continuous grooming of the nerve-cut whisker pad due to pain sensation. To study the effect of callosal inputs, we also ablated the BC contralateral to the intact whisker pad in the IO rats (IO+ablation). For the cortical ablation procedure, a blur hole was drilled above the BC and an electrode was positioned at a 1 mm depth to the cortex. The cortex was ablated by delivery of AC current at 1 mA for 8 s using Precision Instruments stimulator (WPI). Rats were allowed to recover for 14–16 days before MRI imaging. There were totally 35 rats, including 11 sham rats, 13 IO rats, and 11 IO+ablation rats.
Animal preparation for fMRI
Animal surgeries for fMRI have been described in the previous study (Yu et al., 2010). Briefly, rats were initially anesthetized with isoflurane and were orally intubated under a mechanical ventilator. Plastic catheters were inserted into the right femoral artery and vein to allow monitoring of arterial blood gases and administration of drugs. After surgery, all rats were given an i.v. bolus of α-chloralose (80 mg/kg) and isoflurane was discontinued. Anesthesia was maintained with a constant infusion of α-chloralose (26.5 mg/kg/h). The rats were placed on a heated water pad to maintain rectal temperature at ∼37°C while in the magnet. End-tidal CO2, rectal temperature, tidal pressure of ventilation, heart rate, and arterial blood pressure were continuously monitored during the experiment. Arterial blood gas levels were checked periodically, and corrections were made by adjusting respiratory volume or administering sodium bicarbonate to maintain normal levels when required. An i.v. injection of pancuronium bromide (4 mg/kg/h) was also infused with the α-chloralose.
Mn-tracing preparation
A detailed procedure was described in the previous study (Yu et al., 2012a). 250 nL of 50 mM MnCl2 solution (0.9% saline) was injected into the dorsal ventral thalamus (Bregma 3.0, lateral −3.0, and ventral 5.5 mm). The stereotactic coordinates were determined according to the Paxinos and Watson atlas (6th edition). For stereotactic injections, animals were initially anesthetized by isoflurane. A small bur hole was drilled after exposing the skull. A homemade glass injection needle was placed at the proper coordinates in the stereotactic frame. Injections were administered slowly over 5–6 min using a microinjector (Narishige), and the needle was slowly removed after being kept at the injection site for 10 min. MRI was performed right after stereotactic injections to make sure the MnCl2 was delivered to the proper site and at 4 to 6 h postinjection to analyze the traced Mn in the cortex. For MRI scans, rats were initially anesthetized with 1–2% isoflurane using a nose cone and rectal temperature was maintained at 37°C±1°C by a heated water bath. After surgery and in between scans, the rats were allowed to recover and were free to roam within their cages.
MRI image acquisition
All images were acquired with an 11.7 T/31 cm horizontal bore magnet (Magnex), interfaced to an AVANCE III console (Bruker) and equipped with a 12 cm gradient set, capable of providing 100 G/cm with a rise time of 150 (s (Resonance Research). A custom-built 9 cm diameter quadrature transmitter coil was attached to the gradient. A 1 cm diameter surface receive coil was used during imaging acquisition. The fMRI imaging setup included shimming, adjustments to echo spacing and symmetry, and B0 compensation. A 3D gradient-echo, EPI sequence with a 64×64×32 matrix was run with the following parameters: effective echo time (TE) 16 ms, repetition time (TR) 1.5 s (effective TR 46.875 ms), bandwidth 178 kHz, flip angle 12°, and FOV 1.92×1.92×0.96 cm. A two-block design stimulation paradigm was applied in this study. For the simultaneous forepaw and whisker pad stimulation experiment, the paradigm consisted of 320 dummy scans to reach steady state; followed by 20 scans prestimulation, 20 scans during electrical stimulation, and 20 scans poststimulation, which was repeated thrice (140 scans were acquired overall). Six to eight multiple trials were acquired for each rat.
For the Mn-tracing study, a Magnetization Prepared Rapid Gradient Echo (MP-RAGE) sequence (Mugler and Brookeman, 1990) was used to examine the MEMRI signal at a higher sensitivity. Sequence parameters such as optimal inversion delay time for best tissue contrast with the MP-RAGE sequence were determined from the T 1 values obtained from the previous study (Tucciarone et al., 2009). Sixteen coronal slices with FOV=1.92×1.44 cm, matrix 192×144, and thickness=0.5 mm (TR=4000 ms, Echo TR/TE=15/5 ms, TI=1000 ms, number of segments=4, and Averages=10) were used to cover the area of interest at 100 μm in-plane resolution with a total imaging time of 40 min. To estimate the deposited Mn in the thalamus across animals, a T1-map was acquired using a Rapid Acquisition with Refocused Echoes (RARE) sequence with a similar image orientation to the MP-RAGE sequence (TE=9.6 ms, Multi-TR=0.5, 1, 1.9, 3.2 and 10 s, Rare factor=2). For the purpose of cross-subject registration, T1-weigted anatomical images were also acquired in the same orientation as that of the 3D EPI and MPRAGE images with the following parameters: TR=500 ms, TE=4 ms, flip angle 45°, and in-plane resolution 100 μm.
Data processing
BOLD-fMRI data were processed with the Analysis of Functional NeuroImages software (AFNI) software (NIH) and Matlab. The preprocessing steps with AFNI include reconstruction, denoising, smoothing, normalization, registration, and AFNI, which were previously described (Yu et al., 2010). The beta value of each voxel was derived from a linear regression analysis to estimate the amplitude of BOLD response (Cox, 1996), which is briefly described in the next equation:
(Yi are the measurements, Xi are the known regressors or predictor variables, βi are the unknown parameters to be estimated for each voxel, and ɛi are random errors).
MRI images were registered to the brain atlas using C++ and Matlab programming (detailed description in Yu et al. Neuron 2012 Supplementary note-3) (Yu et al., 2012a). The anatomical borders of the FP-S1 and BC were characterized by Mn tracing to the Layer 4 of the somatosensory cortex. The curved line profile based on L4 Mn enhancement was drawn to identify the cortical borders so as to compare the BOLD fMRI signal spatial distribution across different cortices in response to the forepaw electrical stimulation. Group analyzed data were presented as mean±SEM. Statistical analyses were carried out using one-way ANOVA analysis.
Results
Callosal-mediated barrel cortical activity in IO rats
Previously, it has been reported that IO can lead to bilateral fMRI activity in the BC in response to the stimulation of the intact whisker pad (Yu et al., 2012a). Figure 1 shows fMRI functional beta maps from two individual rats in IO and Sham groups (Fig. 1A, B). The electrical stimulation of the whisker pad elicited reliable fMRI signal in the contralateral BC of Sham rats (mean beta in contra BC: 2.38±0.72, mean beta in ipsi. BC: 0.00±0.57, n=4). In contrast, the fMRI signal detected in the bilateral BC of the IO rats is much higher than that of the sham rats (mean beta in contra BC: 4.14±0.43, mean beta in ipsi. BC: 2.03±1.52, n=4). The results confirms previous reported studies in rats due to denervation of forepaw and hindpaw, as well as a previous study of IO from whiskers (Pelled et al., 2007; Yu et al., 2012a).
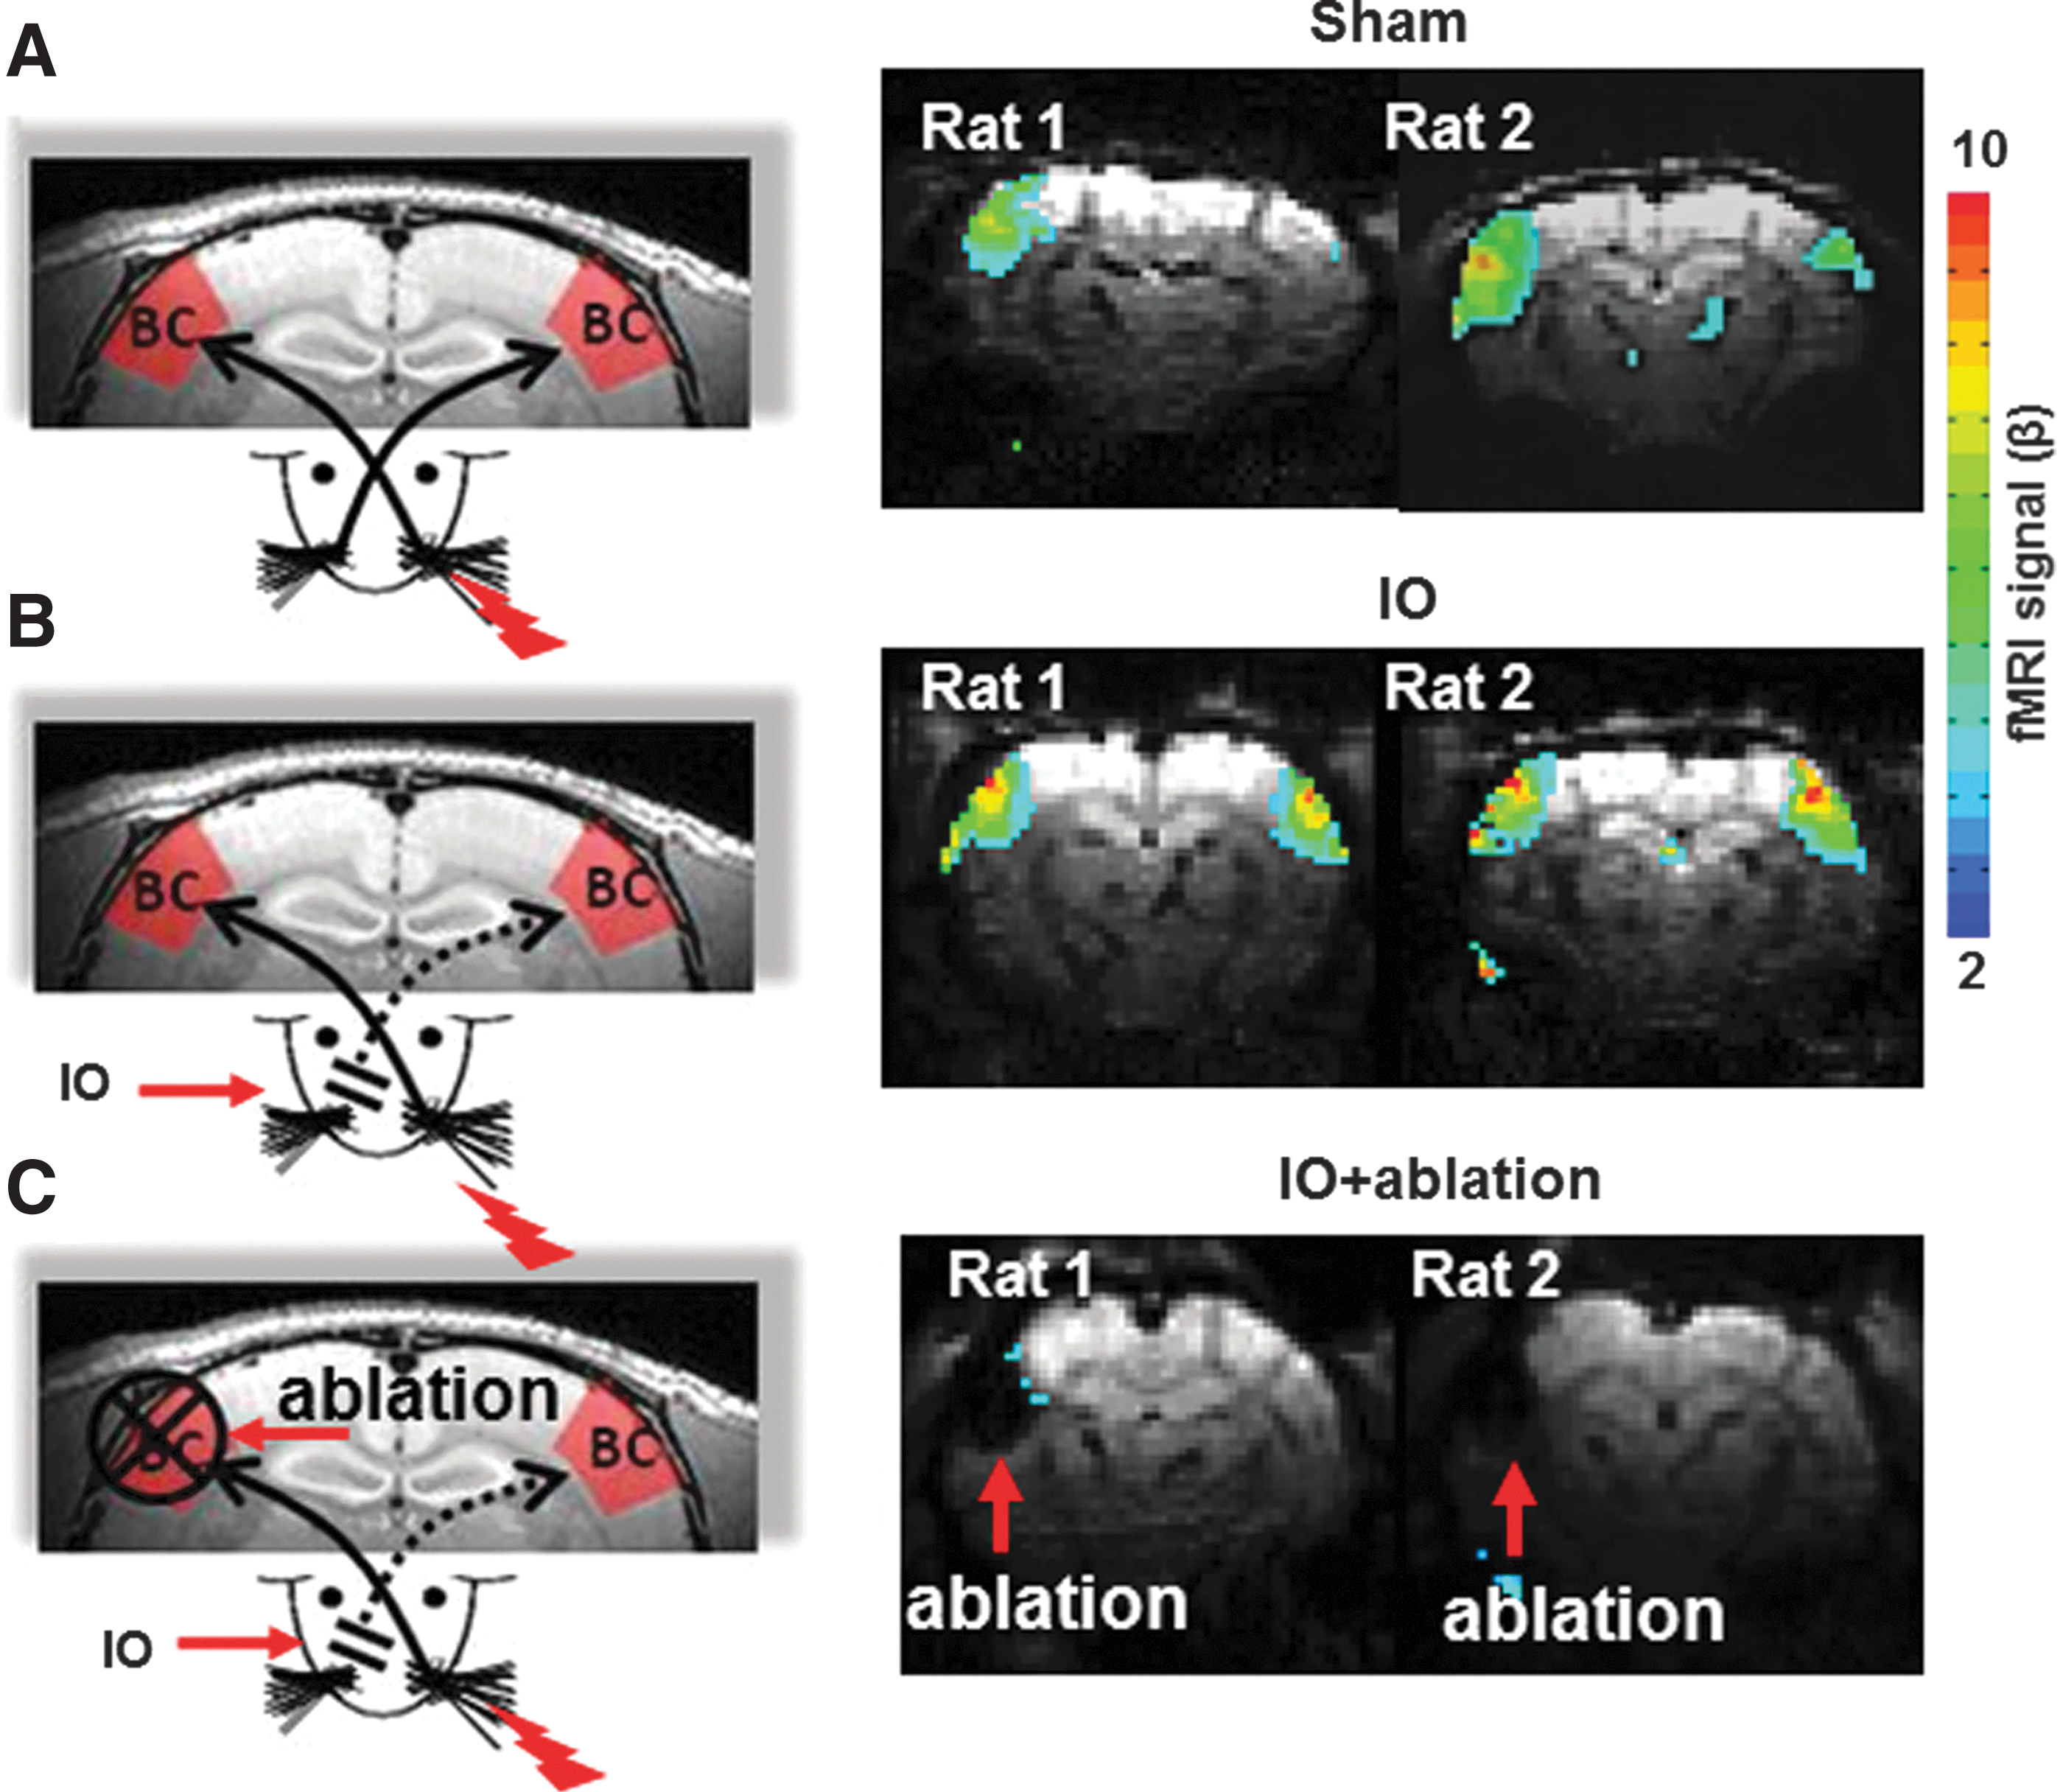
Map of the barrel cortical activity with functional magnetic resonance imaging (fMRI). Left panel is the schematic of the whisker pad electrical stimulation in three groups of rats: Sham
Ablating the cortical representation of the intact whisker pad, that is, the contralateral BC, led to the elimination of the ipsilateral fMRI activation (Pelled et al., 2007; Yu et al., 2014). These results suggested that callosal inputs from the contralateral BC underlie the ipsilateral plasticity detected by fMRI. In this work, cortical ablation was performed in the IO rats (IO+ablation) and no fMRI activation was observed in the ipsilateral BC (Fig. 1C). This result indicates that there is a loss of thalamocortical and callosal inputs to the ipsilateral BC in the cortical ablated IO rats (IO+ablation).
Identifying the FP-S1 anatomical borders with MEMRI
To better characterize the anatomical borders in the somatosensory cortex, layer specific MEMRI neural tracing was used to highlight cortical layer 4 of HP-S1, FP-S1, and BC in T1-weighted MPRAGE images (Tucciarone et al., 2009). MnCl2 was injected into the dorsal thalamic nuclei, including the ventral posteriolateral and posteriomedial nuclei. Previously, MRI taken at 4–6 h after a thalamic Mn injection has shown that laminar specific enhancement was mostly located at layer 4 and partially in layer 5 consistent with the primary thalamocortical inputs (Tucciarone et al., 2009; Yu et al., 2012a). Figure 2 shows that at 5 h after injection, Mn accumulated primarily at layer 4 and partially in layer 5 of the S1 cortices via thalamocortical transport of Mn. The Mn-enhanced peak signal defines the HP, FP, and BC regions due to the lower signal region in the dysgranular zones. The Mn-enhanced signal provided good anatomical markers to identify FP-S1 cortical borders with MEMRI, as dysgranular zones between cortices do not receive inputs. The MEMRI images were registered with the same brain atlas as used to define the activated S1 areas in fMRI images as described in the Method section. The Mn-enhanced line-profile signal was sampled based on the border line in the brain atlas. The MRI-based anatomical borders of FP-S1 was defined based on the spatial location of the lowest signal (0.93±0.08 mm and 2.23±0.08 mm) from the line profile spreading from the peak signal detected in the FP-S1 regions (Fig. 2B). The mean distance of FP-S1 is 1.3±0.08 mm. The spatial location of FP-S1 borders detected by MEMRI would be applied to characterize the spatial location of fMRI line-profile signal along the registered EPI images in the next experiments.
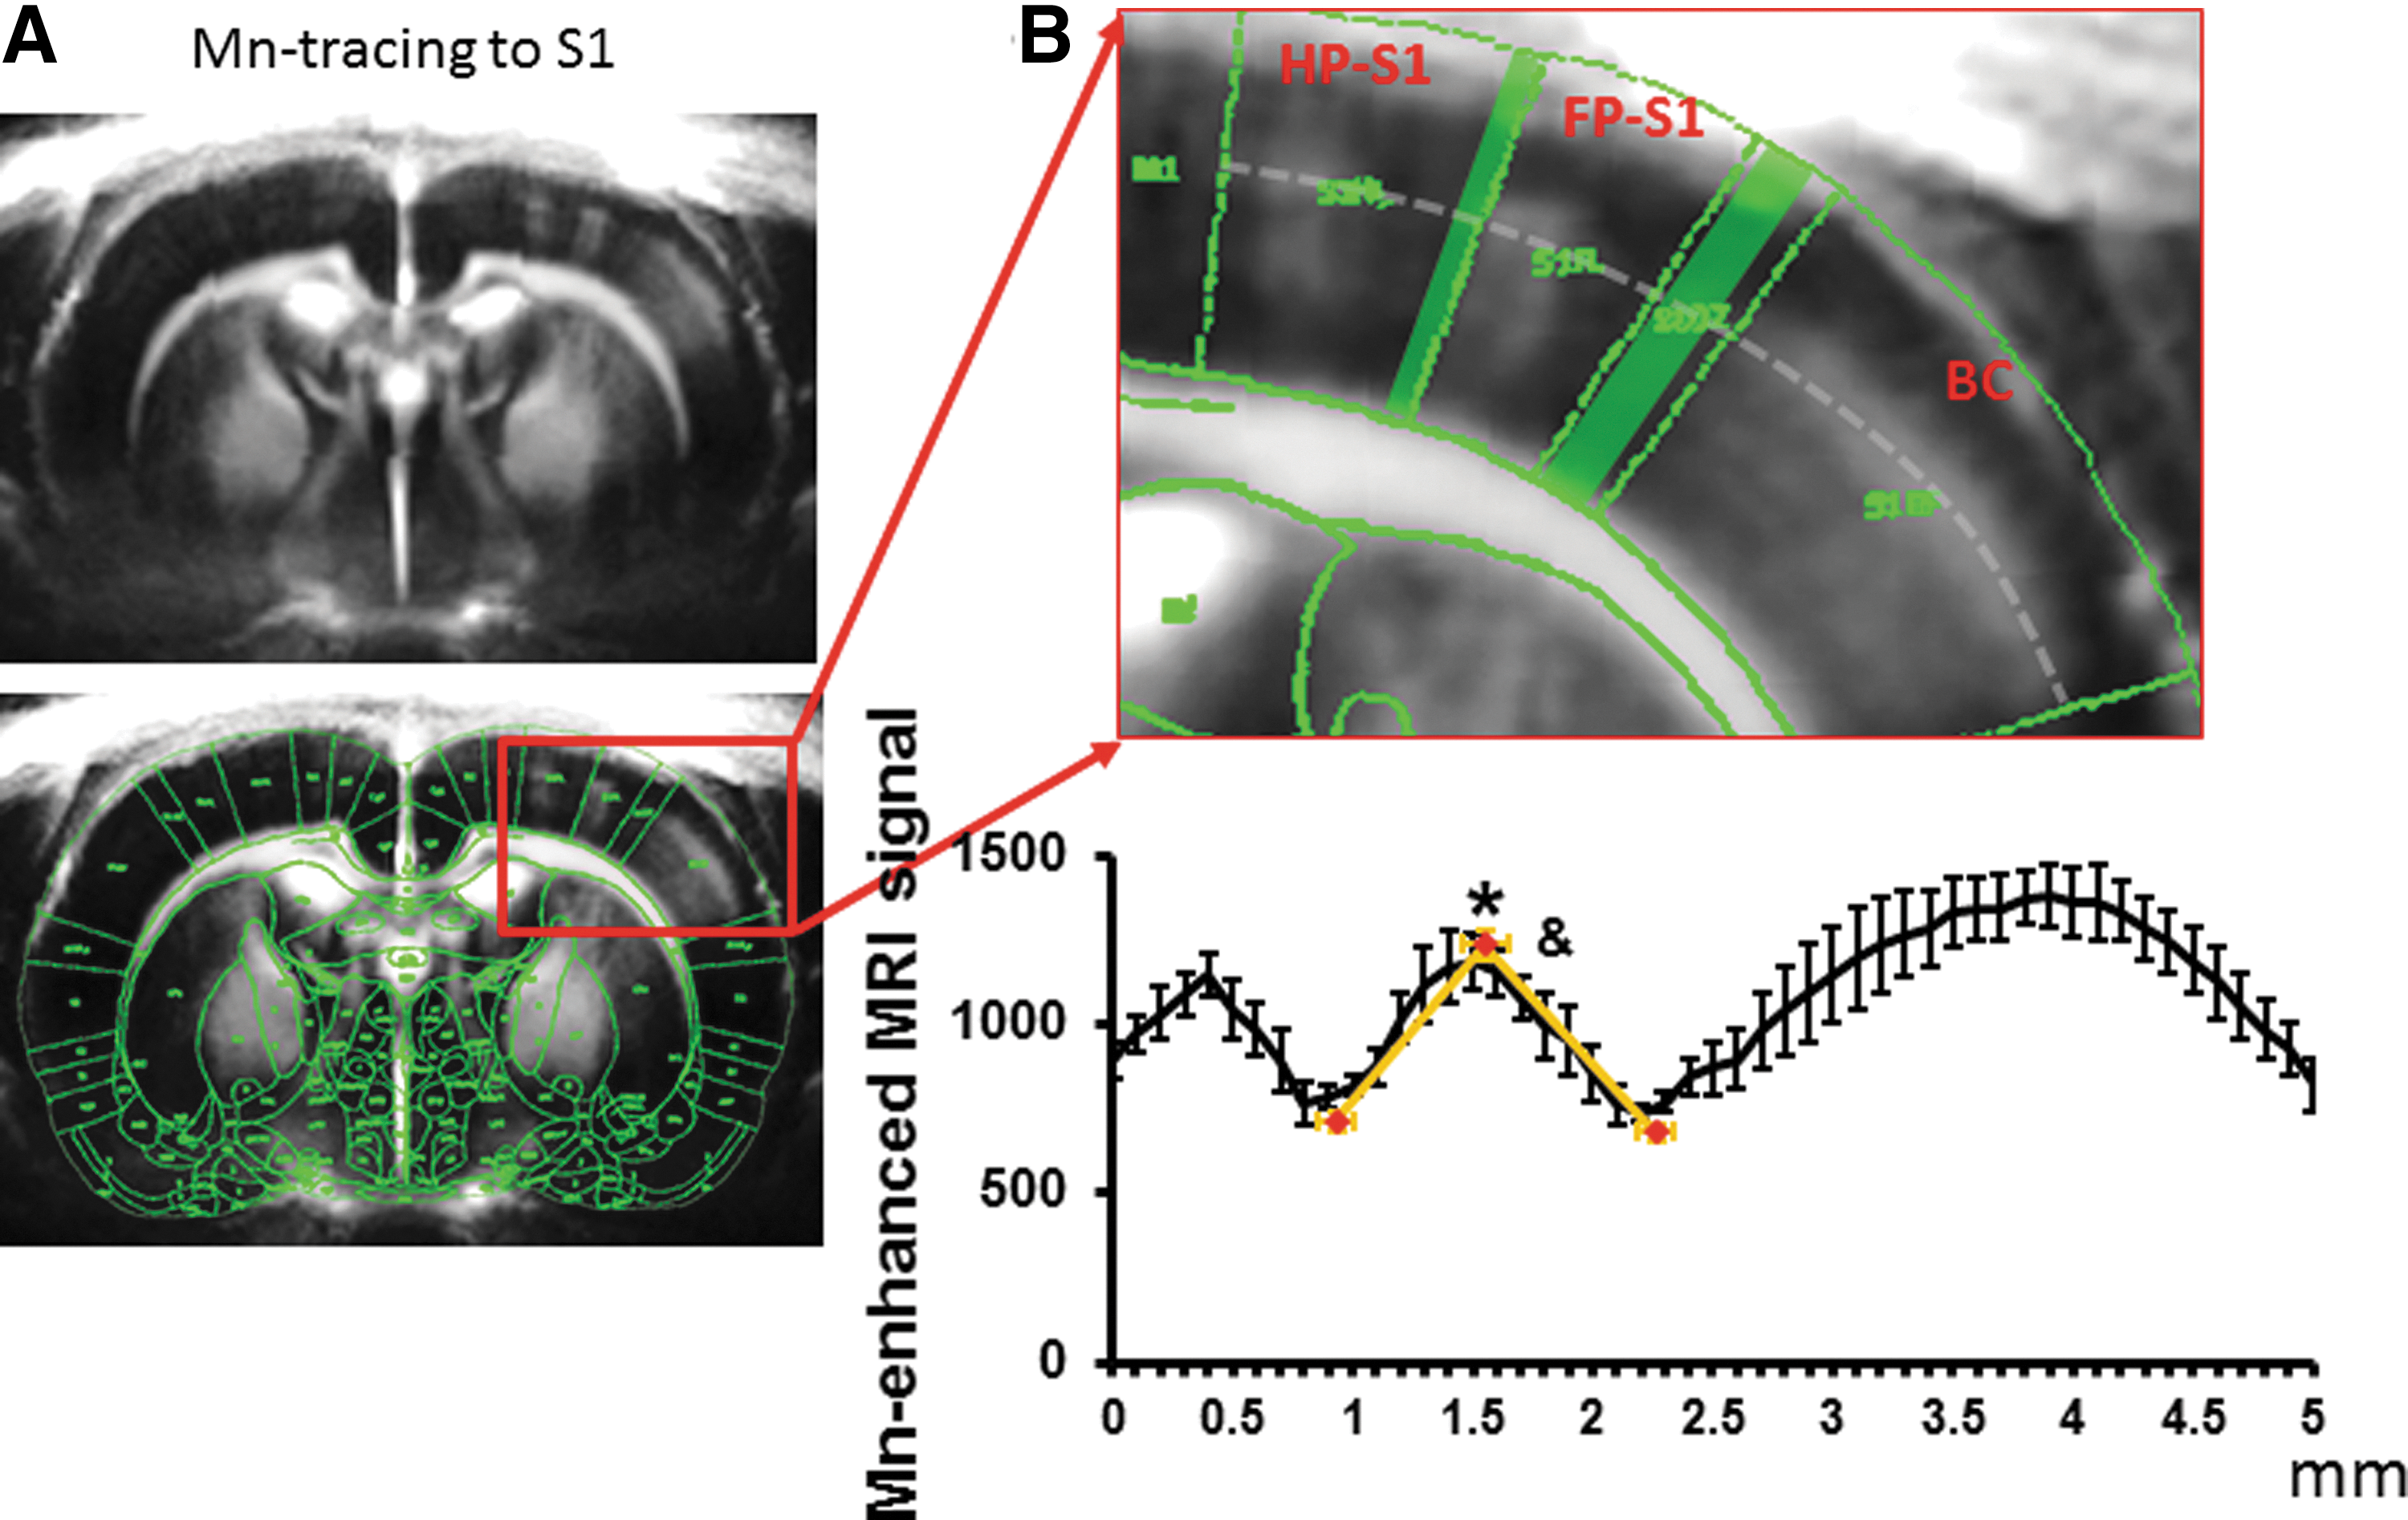
Use Manganese-enhanced MRI (MEMRI) to delineate the spatial distribution of FP-S1 fMRI across S1 cortices.
Spatial characterization of the functional maps by bilateral forepaw stimulation
In the somatosensory cortex of the rat brain, the FP-S1 is adjacent to the BC with a dysgranular zone in between. Simultaneous bilateral electrical stimulation of the rat forepaws in the Sham, IO, and IO+ablation rats was performed. All functional maps were registered to the same anatomical MRI template, which was registered to the rat brain atlas (Keilholz et al., 2004; Yu et al., 2012a) (Paxinos and Watson, Ed. 6th). The averaged fMRI beta maps represent the activated cortical areas in the bilateral S1 cortices. The registered brain atlas was overlapped with the fMRI beta map to characterize the spatial distribution of the fMRI activation in the S1 cortices (Fig. 3). The results showed that the fMRI signal is primarily located in the FP-S1 cortices in the three groups of rats. However, there is an apparent spread of fMRI signal to the deafferented BC in the cortical ablated IO rats (IO+ablation).
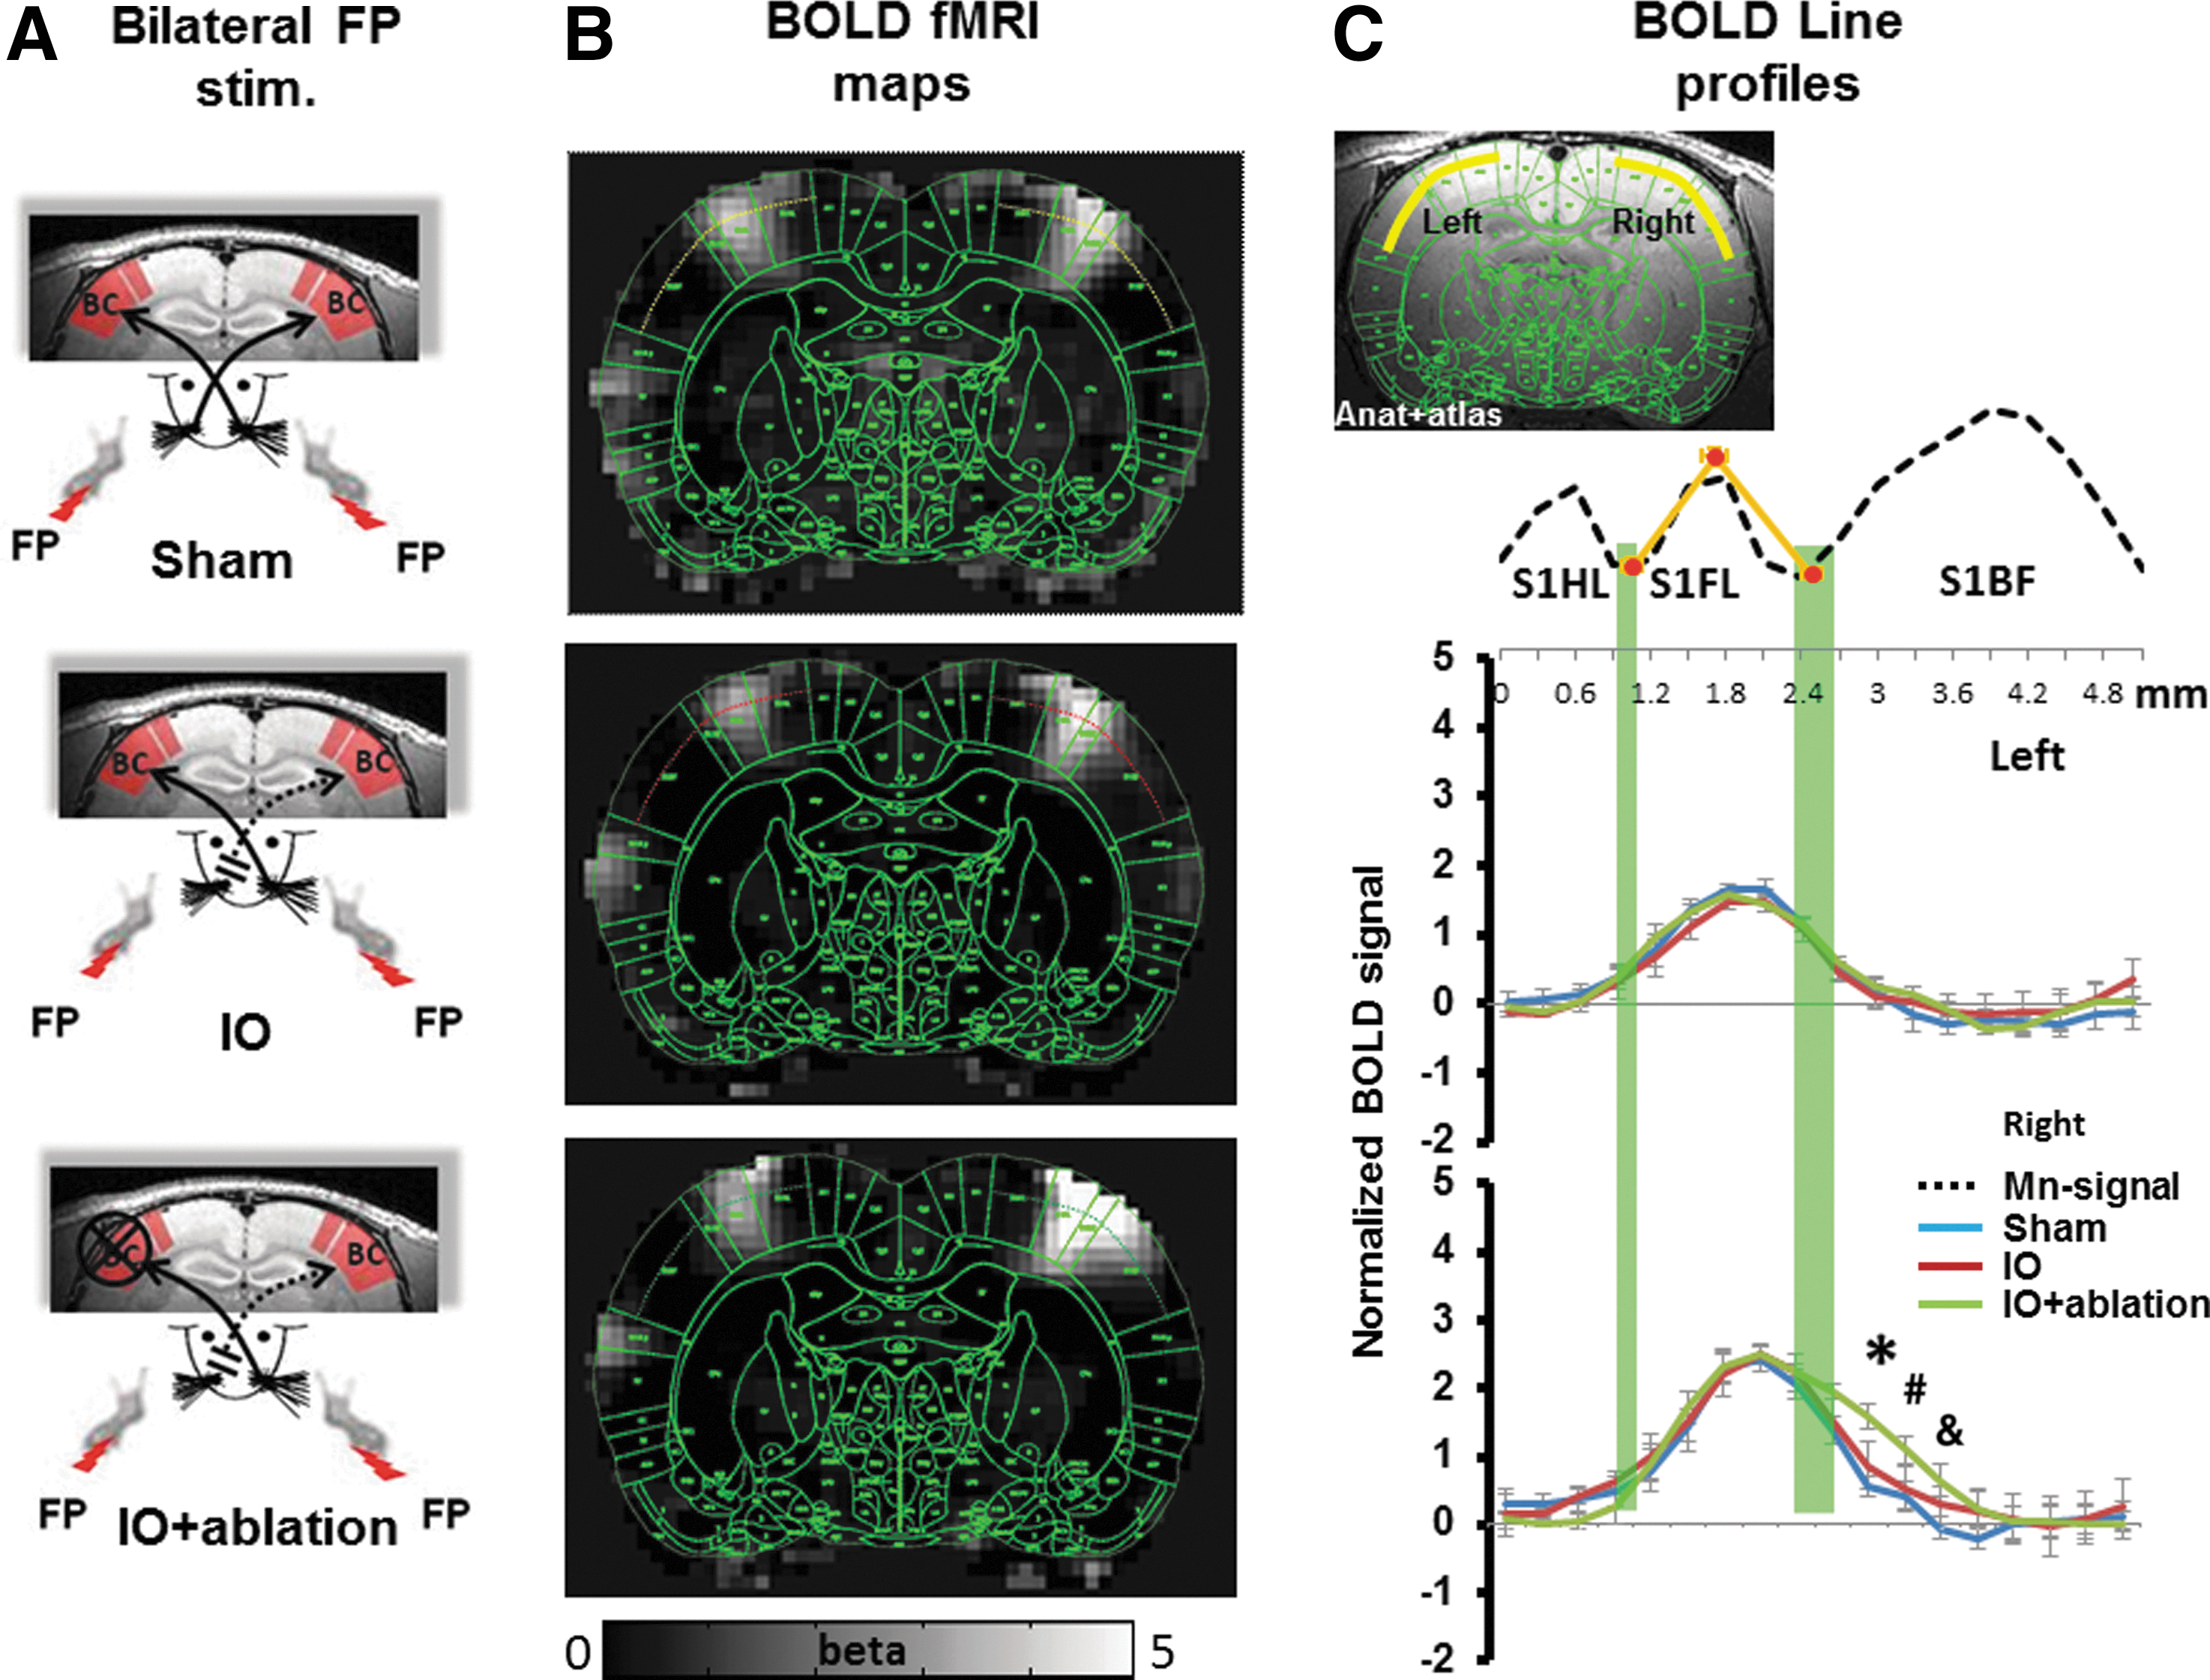
Map of the activity in response to bilateral forepaw stimulation.
To better quantitate the expansion of the fMRI activation from FP-S1 to the BC, fMRI signal changes across the deep S1 cortical layers were analyzed. The fMRI signal was collected from the line profile extending from the HP-S1 to the BC based on the registered brain atlas. Figure 3C shows the peak-normalized fMRI line profiles from all individual rats from different groups. Peak normalization is important, because previously we have shown that the uninjured BC has increased fMRI in this model (Yu et al., 2012a). The peak fMRI signal aligned well in the FP-S1 regions with two tails that extended into the adjacent HP-S1 and BC. This is consistent with a previous study which showed that normal FP-S1 fMRI signal bears a component that extends into neighboring regions (Goloshevsky et al., 2011). In the left hemisphere, forepaw stimulation elicited a similar spatial distribution pattern in all three groups of rats. In contrast, the fMRI activation in the right hemisphere of the cortical ablated IO rats was increased further into the deafferented BC than in either the IO or sham groups. The fMRI signal (beta value) at 0.6 mm into the BC from FP-S1 border was 1.59±0.13 in cortical ablated IO rats (IO+ablation), approximately two-fold greater than the value of 0.86±0.19 in IO rats and almost thrice greater than the value of 0.57±0.11 in sham rats. The spatial distribution of the FP-S1 fMRI signal toward the HP-S1 provided an internal control to quantitate the expansion of FP-S1 into the deafferented BC in the IO and IO+ablation rats. In addition, the fMRI line profiles from individual rats were provided in Supplementary Fig. S1 (Supplementary Data are available online at
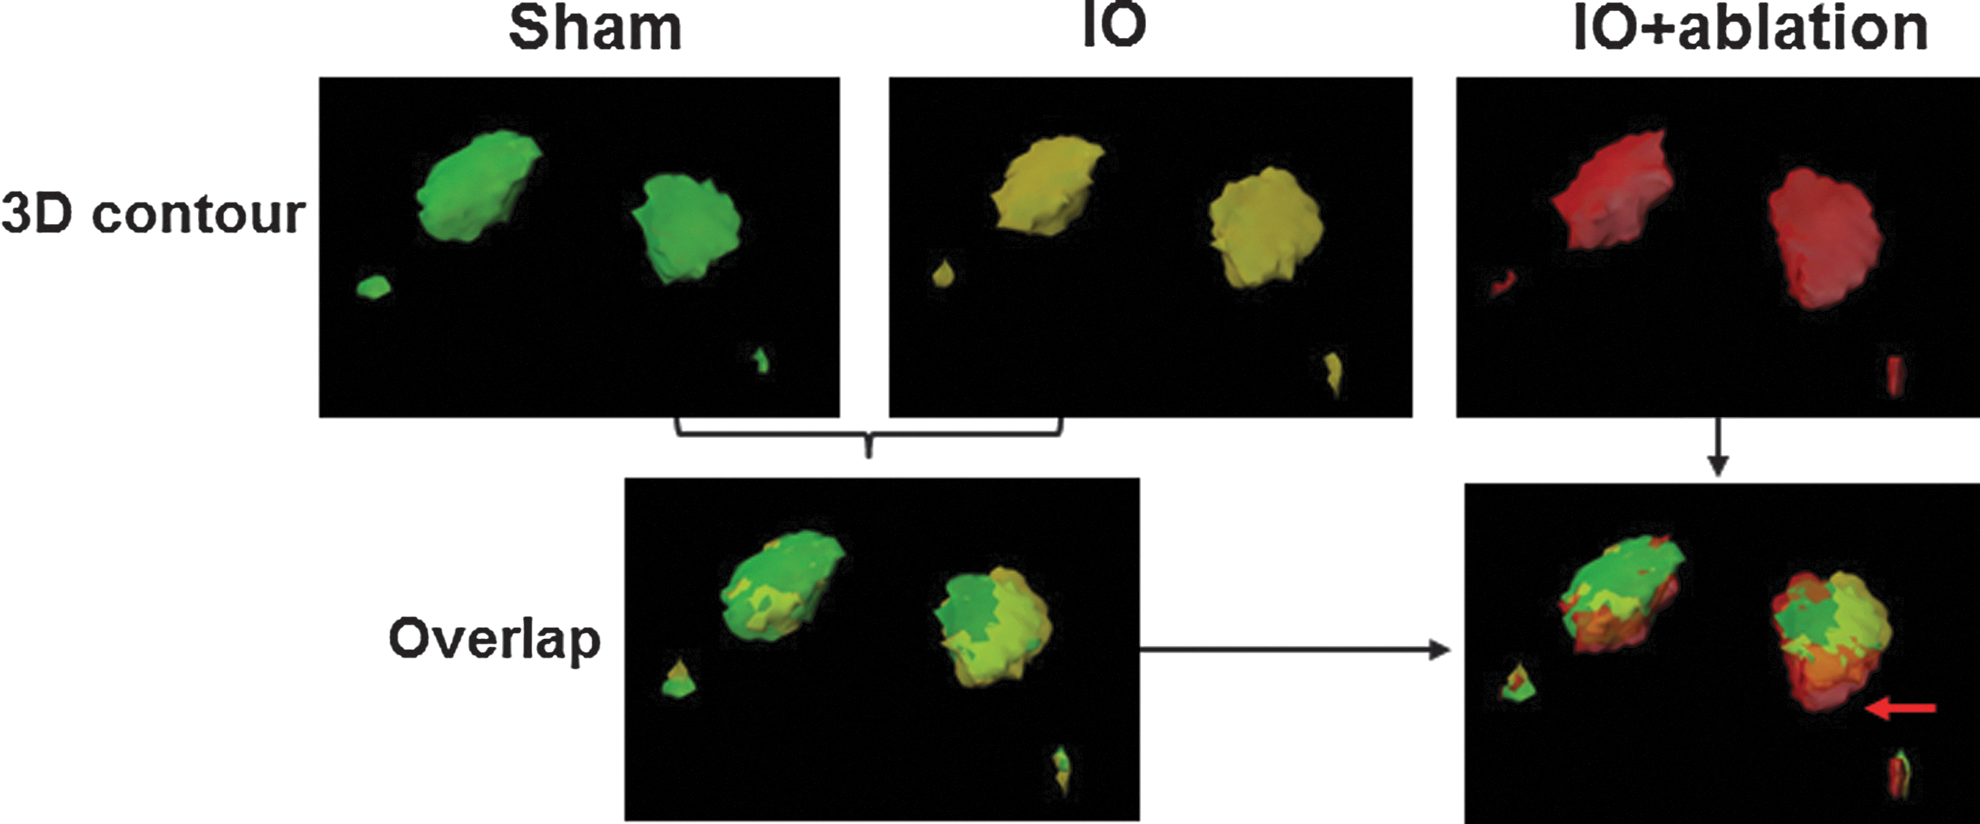
The 3D contour of the activated regions in response to bilateral forepaw stimulation. The colored contours were created from the averaged 3D functional beta maps of sham (green), IO (yellow), and IO+ablation (red) rats with a threshold at 2. In the 3D contour, both primary cortical regions (FP-S1) and the S2 regions (smaller blobs) were detected. In the overlap maps, no difference was detected between sham and IO 3D contours, but there was a clear expansion in the IO+ablation group toward the barrel cortex as shown by the red arrow (details in the Supplementary Movie S1).
Discussion
In the rodent brain, peripheral denervation leads to interhemispheric plasticity. Ipsilateral fMRI activation of the deafferented forepaw, hindpaw, and whisker barrel cortices can be elicited by the stimulation of the intact body parts at 2 weeks after nerve injury (Pelled et al., 2007, 2009; Yu et al., 2012a, 2014). This form of interhemispheric plasticity has been observed in both animal models (Pawela et al., 2010; Pelled et al., 2007, 2009; Yu et al., 2012a, 2014) and human amputees (Frey et al., 2008; Simoes et al., 2012). This plasticity likely depends on the callosal inputs as indicated by ablation experiments and an increased transport of Mn through the callosal fibers after denervation (Pelled et al., 2007; Yu et al., 2014). This study analyzed the effect of the callosal-mediated ipsilateral activity on the intracortical plasticity between FP-S1 and BC. Callosal inputs can modulate the spatial profile of the fMRI signal, indicating the expansion of the adjacent receptive field toward the deafferented BC. In contrast to a small FP-S1 fMRI signal increase in the deafferented BC of IO rats, the removal of the callosal input by cortical ablation in IO rats leads to a large and significant increase of FP-S1 fMRI activation in the deafferented BC.
fMRI has been applied to map global brain plasticity after CNS or nerve injury in animal models (Dijkhuizen et al., 2001; Pawela et al., 2010; Pelled et al., 2009; Sydekum et al., 2009). However, it remains challenging to characterize the intracortical plasticity that leads to small changes in spatial distribution of the amplitude of the fMRI signal. Two major issues limit intracortical plasticity studies by fMRI. The first is that fMRI directly detects the hemodynamic signal from the local vasculature in the activated region. The spatial distribution of fMRI signal is determined by an ill-defined point-spread function of the activated cortical area. A number of studies at high resolution indicate that this point-spread function is in the order of 300–500 μm (Duong et al., 2001; Goloshevsky et al., 2011; Parkes et al., 2005; Shmuel et al., 2007; Turner, 2002; Yu et al., 2010). The other issue is that adult cortical plasticity often occurs across anatomically delineated cortical regions. The expansion of the cortical receptive field usually occurs in the adjacent cortical representation as has been measured in a number of sensory systems, such as digits, or a frequency selective cortical band in the auditory cortex, or ocular dominant columns in the visual cortex (Hubel et al., 1977; Merzenich et al., 1984; Robertson and Irvine, 1989). In these studies, the cortical representation is altered by a few hundred microns. Therefore, the potential spatial scale of adult intracortical plasticity is in the order of the highest spatial resolution and specificity of fMRI in the cortex. Thus, it is critical to obtain a very high spatial resolution and high sensitivity fMRI as well as to align to local anatomical cortical borders. In contrast to the functional estimate of cortical borders with fMRI, MEMRI neural tracing provides good anatomical markers to identify the S1 borders. A clear Mn-enhanced cortical band could be detected in the S1 with interruptions, which are assigned as the dysgranular zones that separate HP-S1, FP-S1, and BC. The MRI-based anatomical S1 borders provide a good reference to examine the intracortical plasticity.
After we ablated the contralateral BC to remove the callosal inputs to the BC, significant fMRI signal increases toward the deprived BC were detected in IO+ablation rats. The spatial distribution of fMRI signal delineated by anatomical S1 borders demonstrates a clear receptive field expansion in IO+ablation rats. Three important factors were considered to identify the spatial expansion of the FP-S1 activity detected by fMRI. First, we normalized the peak fMRI signal of individual rats (Fig. 3) so that the group analysis of fMRI spatial signal is independent of the fMRI amplitude across animals. Second, the fMRI signal in response to bilateral forepaw stimulation was simultaneously acquired for each rat. The fMRI spatial distribution in the left hemisphere was used as an internal control to examine the plasticity based on the fMRI line profile in the right hemisphere. Previously, the interhemispheric suppression by bilateral forepaw stimulation was only detected when there was an inter-stimulus delay time with 30–50 ms (Ogawa et al., 2000). When the electrical pulses were delivered simultaneously, no significant fMRI signal changes were detected at the FP-S1 in comparison to the unilateral forepaw stimulation in both Ogawa's work (Ogawa et al., 2000) and our works (Hirano et al., 2010; Silva and Koretsky, 2003). Therefore, interhemispheric suppression effects on this study are negligible. Third, for the line profile in the right hemisphere, the normalized fMRI spatial distribution was also measured from the FP-S1 in two directions toward the HP-S1 (left) and the BC (right). The significant expansion was only observed in the direction toward the deprived BC in the cortical ablated IO rats (IO+ablation rats). This result indicates that the callosal input can prevent the functional takeover of the deafferented BC, which may play a role in protecting the functional identity of the deafferented BC, or may have functional effects on the use of the uninjured whisker.
Previously, fMRI was used to study plasticity after bilateral ablation of follicle cells in the whisker pad of rats at postnatal 10 days (Yu et al., 2010). Sensory deprivation is well known to lead to large plasticity changes during the critical period within 2 weeks after birth (Waite and Taylor, 1978). Significant expansion was only detectable from the nose representation toward the deafferented BC by about 600 μm. No expansion was detected from the FP-S1 or HP-S1 (Yu et al., 2010). The lack of expansion of the FP and HP representation may indicate that the reciprocal callosal inputs from the deprived BC remain competing with intracortical projections from the FP/HP ascending pathways even in the early development stage. In another aspect, the spatial resolution of the fMRI was 300 μm in a previous study as well as in this study. Thus, the spatial fMRI signal expansion of the receptive field less than 300 μm would not be detected given the spatial resolution of fMRI. In contrast, the cortical expansion toward deprived BC due to an intracortical plasticity larger than 600 μm was detected in both previous and present studies. The small difference in the fMRI spatial distribution between IO and Sham rats cannot exclude the possibility that the forepaw representative S1 area expands into the deafferented BC of the IO rats, but covers an area less than 300 μm.
The signal-to-noise ratio (SNR) of the fMRI responses can also be considered a factor that influences detection of cortical plasticity. The spatial line profile of the fMRI signal from middle cortical regions was previously analyzed after massive on/off block design averaging over 100 blocks (Goloshevsky et al., 2011). At this high SNR, a secondary component along the line profile of the fMRI was detected. It remains unclear whether this secondary component of the fMRI spatial profile is due to sub-threshold activity, a few responding cells in the adjacent representation, or just indicates spreading vascular responses into the adjacent cortices. A recent fMRI study that detected time course of activation of single venules may enable distinguishing activity induced fMRI from passive vascular draining (Yu et al., 2012b). Changes in the bi-phasic fMRI line profile were able to distinguish plasticity changes between the HP-S1 and FP-S1 after sciatic nerve excision during the critical period to deprive sensory inputs to the HP-S1. Although the functional images were acquired in fewer repetitions in this study as compared with the previous study, a secondary component was also detected in the sham rats along the fMRI line profile outside the FP-S1 and into the BC in the right hemisphere. Interestingly, the line profile in the IO rats had a small increase in the secondary component to a similar spatial extent as the previous plasticity observations between HP-S1 and FP-S1 (Goloshevsky et al., 2011). Therefore, although there is only a small fMRI increase at the deafferented BC of IO rats in comparison to sham rats, the fMRI signal increase of the secondary component may indicate a small amount of plasticity. One speculation on the biphasic spatial changes of the fMRI line profile in IO versus sham rats is that the site of the secondary component may represent lateral intracortical projections from FP-S1 neurons into the BC. In the deafferented BC, it could be that increased activity from the lateral projecting neurons directly contributes to the increased fMRI signal within the secondary component. The plasticity change in IO rats is limited to the spatial distribution of the secondary component of FP-S1 fMRI line profile as shown in sham rats. Even in the cortical ablated IO rats, the large increased fMRI from FP-S1 to BC due to the removal of callosal inputs also comes back to baseline at about the same cortical location of the smaller secondary components in Sham and IO rats. Further studies using extensive averaging to acquire high SNR functional images will be needed to be performed to better decide whether there is a true spatial expansion or just an upregulation of low-level fMRI responses that already exist.
Conclusion
There is growing interest in understanding and manipulating adult brain plasticity. Here, we showed that callosal-mediated interhemispheric plasticity can compete with the intracortical plasticity after nerve injury. This study shows that interhemispheric plasticity could block the expansion of the adjacent FP-S1 receptive field toward the deprived BC. Only if the callosal inputs are eliminated, the intracortical functional expansion can be detected on a large scale. Therefore, this study provides the evidence that there are significant interactions between interhemispheric and intracortical plasticity in the adult brain. In addition, the fMRI and MEMRI should enable delineating the most important site of laminar changes, which will enable electrophysiological studies to understand the underlying synaptic mechanism.
Footnotes
Acknowledgments
This research was supported by the Intramural Research Program of the NIH, NINDS. The authors thank Dr. Stephen Dodd for his support in providing the MR technical support. They also thank Ms. Kathryn Sharer and Ms. Nadia Bouraoud for their support in animal handling and surgical preparation.
Author Disclosure Statement
No competing financial interests exist.
References
Supplementary Material
Please find the following supplemental material available below.
For Open Access articles published under a Creative Commons License, all supplemental material carries the same license as the article it is associated with.
For non-Open Access articles published, all supplemental material carries a non-exclusive license, and permission requests for re-use of supplemental material or any part of supplemental material shall be sent directly to the copyright owner as specified in the copyright notice associated with the article.