
Abstract
This work presents a pathway-dependent anatomic and functional connectivity analysis in 19 patients with relapse-remitting multiple sclerosis (MS) and 16 age-, education-, and gender-matched controls. An MS population is used in this study as a model for anatomic connectivity, permitting us to observe relationships between anatomic and functional connectivity more easily. A combined resting-state functional magnetic resonance imaging (fMRI) and whole-brain, high angular resolution diffusion imaging analysis is performed in three independent, monosynaptic pathways. The pathways chosen were transcallosal pathway connecting the bilateral primary sensorimotor regions, right and left posterior portion of the Papez circuit, connecting the posterior cingulate cortex and hippocampus. The Papez circuit is known to be involved in memory function, one of the most frequently impacted cognitive domains in patients with MS. We show that anatomic connectivity, as measured with diffusion-weighted imaging, and functional connectivity, as measured with resting-state fMRI, are significantly reduced in patients as compared with controls for at least some of the pathways considered. In addition when all pathway measures are combined, anatomic and functional connectivity are significantly correlated in patients with MS as well as healthy controls. We suggest that anatomic and functional connectivity are related for monosynaptic pathways and that radial diffusivity, as a diffusion-tensor-based measure of white matter integrity, is a robust measure of anatomic connectivity in the general population.
Introduction
Anatomic connections via white matter pathways in the human brain are intimately related to functional connectivity of neuronal networks that are essential to complex neuronal processing. Several years ago, we demonstrated that measures of white matter integrity along the major interhemispheric pathway connecting the bilateral primary motor regions were highly correlated to resting-state functional connectivity between those two regions (Lowe et al., 2008). In that work, the correlation was observed in a population of patients with multiple sclerosis (MS), but not in healthy control subjects. We postulate that it is easier to observe the relationship between functional and structural connectivity in a sample with a larger range of connectivity due to varying amounts of white matter disease.
Recently, multiple studies have reported a positive relationship between structural and functional connectivity (Honey et al., 2009; Lowe et al., 2008; Skudlarski et al., 2008; van den Heuvel et al., 2009). With the exception of our previous article, all of these methods used the number of fiber counts generated between two brain regions as their measure of structural connectivity. Our prior work and the current study used track-averaged diffusivity values as a measure of structural connectivity. The advantage of this method is that there will be less algorithmic dependence on the result, allowing more generalizable results (Wakana et al., 2007).
Here we extend our previous observation to another directly connected neuronal system, the posterior cingulate cortex-antero-medial temporal lobe (PCC-AMTL) pathway. This afferent pathway from PCC to hippocampus is believed to be involved in memory function, part of the so-called Papez circuit (Mark et al., 1995).
The principal goal of this study is to use MS as a model for anatomic disconnection to investigate the relationship between functional and anatomic connectivity in directly connected brain regions. MS is an adult onset, idiopathic disease of the white matter. It is characterized by reduced axonal conduction throughout the brain, particularly in the periventricular white matter. We hypothesize that, in MS, the broader range of anatomic connectivity will allow us to observe correlations with functional connectivity more easily. We also hypothesize, that by extending our previous study to a larger population, the same relationship will be observed in healthy control subjects, suggesting that radial diffusivity (RD) is a robust measure of anatomic connectivity.
Materials and Methods
We acquired whole-brain resting-state functional magnetic resonance imaging (RS-fMRI) data and whole-brain high angular resolution diffusion imaging (HARDI) data in 16 patients with MS. Healthy controls were selected to provide an age-, education-, and gender-matched sample (n=19). All data were acquired under an approved protocol from the Cleveland Clinic Institutional Review Board. The patients were assessed for extended disability status score (EDSS) by an experienced MS neurologist (L.S. and R.B.). In a separate validation study, five MS patients were studied in a test-retest protocol where they were scanned in two sessions ∼1 week apart. The scan procedures were identical for these subjects as described in the data acquisition section. The analysis and results of that study are presented in the Appendix.
Data acquisition
All data were acquired on a Siemens TIM Trio 3T MRI scanner (Erlangen, Germany) using a 12-channel receive-only head array. A bitebar was used to minimize subject motion.
The following scans were performed:
Scan 1—Whole-brain T1:T1-weighted inversion recovery turboflash (MPRAGE): One hundred twenty axial slices, thickness=1–1.2 mm, field-of-view (FOV)=256×256 mm2, inversion time/echo time (TE)/repetition time (TR)/flip angle=900 msec/1.71 msec/1900 msec/8°, matrix 256×128, and receiver bandwidth (BW)=62 kHz.
Scan 2—HARDI: Two-millimeter isotropic voxels (128×128 matrix, 256×256 mm2 FOV, 5/8 partial echo, receive BW=1628 Hz/pixel, and forty-eight 2-mm-thick axial slices) were acquired with 71 noncollinear diffusion-weighting gradients, with b=1000 sec/mm2 eight b=0 volumes, number of excitations=4. Twice-refocused spin echo was used to minimize eddy current artifact (TE/TR=102 msec/7700 msec) (Reese et al., 2003). Iterative motion correction was applied (Sakaie and Lowe, 2010) followed by updating of diffusion gradient directions (Leemans and Jones, 2009).
Scan 3—fMRI activation study: One hundred sixty volumes of thirty-one 4-mm-thick axial slices are acquired using a prospective motion-controlled, gradient recalled echo, echoplanar acquisition with TE/TR/flip=29 msec/2800 msec/80°, matrix=128×128, 256×256 mm2 FOV, and receive BW=1954 Hz/pixel. A patterned, complex, unilateral finger opposition task (right hand) is performed during this scan. Four activation blocks of 16 volume acquisitions are interleaved with four rest blocks of the same duration. An additional rest block is performed at the beginning of the scan. This scan is used to derive seed regions for the sensorimotor cortex (SMC) resting-state analysis.
Scan 4—Whole-brain resting-state BOLD study: One hundred thirty-two repetitions of thirty-one 4-mm-thick axial slices are acquired with TE/TR=29 msec/2800 msec, 128×128 matrix, 256×256 mm2 FOV, and receive BW=1954 Hz/pixel. The subject is instructed to rest with eyes closed and refrain from any voluntary motion.
Data analysis
Except for seed region definition, the analysis proceeded as described in the reference Lowe et al. (2008). Briefly:
The fMRI data were postprocessed in the following manner: 1. Retrospective motion correction was performed using 3dvolreg from Analysis of Functional NeuroImaging (AFNI) (Cox, 1996). 2. Spatial filtering with 2D in-plane Gaussian filter (4-mm full width at half maximum [FWHM]) was used to improve functional contrast-to-noise ratio and make in-plane resolution more similar to through-plane resolution.
The functional connectivity data were postprocessed in the following manner: 1. Cardiac and respiratory signals were measured during scanning and regressed out using RETROICOR as provided by AFNI (Cox, 1996; Glover et al., 2000). 2. The data were retrospectively motion corrected using 3dvolreg from AFNI (Cox, 1996). 3. Second-order motion correction was performed to regress signal fluctuations at the voxel level that correlate with the calculated voxel level displacement from the motion correction parameters from 3dvolreg (Bullmore et al., 1999). 4. Spatial filtering with 2D in-plane Gaussian filter (4-mm FWHM) was performed to improve functional contrast-to-noise ratio and make in-plane resolution more similar to through-plane resolution. 5. The data were temporally filtered to remove all fluctuations above 0.08 Hz (Biswal et al., 1995; Lowe et al., 1998).
The diffusion tensor imaging (DTI) data were postprocessed in the following manner: 1. All image data were motion corrected using the method described earlier in the acquisition description. 2. All images from each of the 71 gradient directions were averaged across the four acquisitions. The eight b=0 images from each volume were similarly averaged. Diffusion gradient information was updated in accordance with the motion correction transformation applied to the diffusion-weighted images (Landman et al., 2007).
Finger tapping analysis
The fMRI data are analyzed using a least-squares fit of a boxcar reference function, representing the 44.8 sec off/44.8 sec on activation paradigm, to the timeseries data of each voxel (Lowe and Russell, 1999). The result is a whole-brain Student's t map that can be thresholded to determine regions of significant involvement in the unimanual tapping task.
Seed region definition
Fiber tracking
Sensorimotor cortex
The seed region was defined as the nine-voxel region centered on the maximally activated pixel in the M1 motor region in each hemisphere. Regions of interest (ROIs) were visually inspected and modified if necessary to ensure that the seed was located in gray matter and not in the intragyral cerebrospinal fluid.
Posterior cingulate cortex-antero-medial temporal lobe
Approximately 1-cm3 PCC seed regions were defined according to Talairach locations reported in the reference Greicius et al. (2003) (Fig. 1). The pathway from PCC to AMTL putatively passes through entorhinal cortex (EC) to the hippocampal formation (Kobayashi and Amaral, 2003; Suzuki and Amaral, 1994). Thus, the target region for the AMTL part of the track was defined anatomically as the posterior portion of EC (Fig. 1).

Functional connectivity
Sensorimotor cortex
The seed region was selected as described previously, and was the same ROI used for the fiber tracking analysis.
Posterior cingulate cortex-antero-medial temporal lobe
Because we did not have task-based activation data to define the EC, we used a combination of anatomic information and the resting-state data itself to define the seed regions. In each of the right and left hemispheres we selected a finite region of the PCC, proximal to retrosplenial cortex, consistent with the Talairach locations reported in the reference Greicius et al. (2003). Using InstaCorr from the AFNI suite, we use the method described in the Appendix to define a nine-voxel seed region in both PCC and posterior hippocampus.
Fiber tracking
We have developed a probabilistic fiber tracking method that is robust in tracking widely separated brain regions (Lowe et al., 2008; Sakaie and Lowe, 2007). This tracking methodology has been demonstrated to be insensitive to the presence of MS lesions (Pine et al., 2009). Using the seed and target regions defined previously, probabilistic fiber tracking is performed for each of the studies performed on each subject. The fiber tracking is described in detail in the reference Lowe et al. (2008). Briefly: 1. Fiber orientation distribution (FOD) determination: For each voxel, the 71-direction diffusion data are used to determine the local FOD function (Sakaie and Lowe, 2007). This function is used to determine the local probability for propagation of tracks from the seed (PCC) to the target (EC). Ten thousand tracks are randomly generated and a voxel-level track density map is constructed by counting how many of the generated tracks between seed and target passed through each voxel in the brain. 2. DTI determination: Tensor values of water diffusion are calculated for each voxel using a standard log-linear least squares method (Basser et al., 1994). The tensor is diagonalized and the scalar tensor values axial diffusivity (AD), RD, mean diffusivity (MD), and fractional anisotropy (FA) are calculated for each voxel. 3. Pathway-dependent diffusion measures are calculated using the track density map, the scalar diffusion values, and a white matter mask constructed by segmenting aforementioned Scan 1 using the FAST algorithm from the FSL library (Smith et al., 2004). Each measure <D> is calculated according to
Where D(v) is the particular tensor-based value of interest (e.g., FA) at voxel v and w(v) is a so-called track visitation map, in which the value of each voxel equals the number tracks generated by the probabilistic tractography algorithm that intersect that voxel. WM is a mask that is set to one for voxels determined to be mostly white matter from the FAST segmentation. An artifact of the track visitation map is that a large, spatially diffuse set of voxels are visited by a small number of tracks. A threshold approach was implemented using a histogram of nonzero values in the track visitation map. A bimodal distribution was found for each study, with a cutoff consistently found at the second bin. Values in the track visitation map, w(v), below this threshold were set to zero (Fig. 2 for a thresholded PCC-AMTL track map for a typical subject). The result is
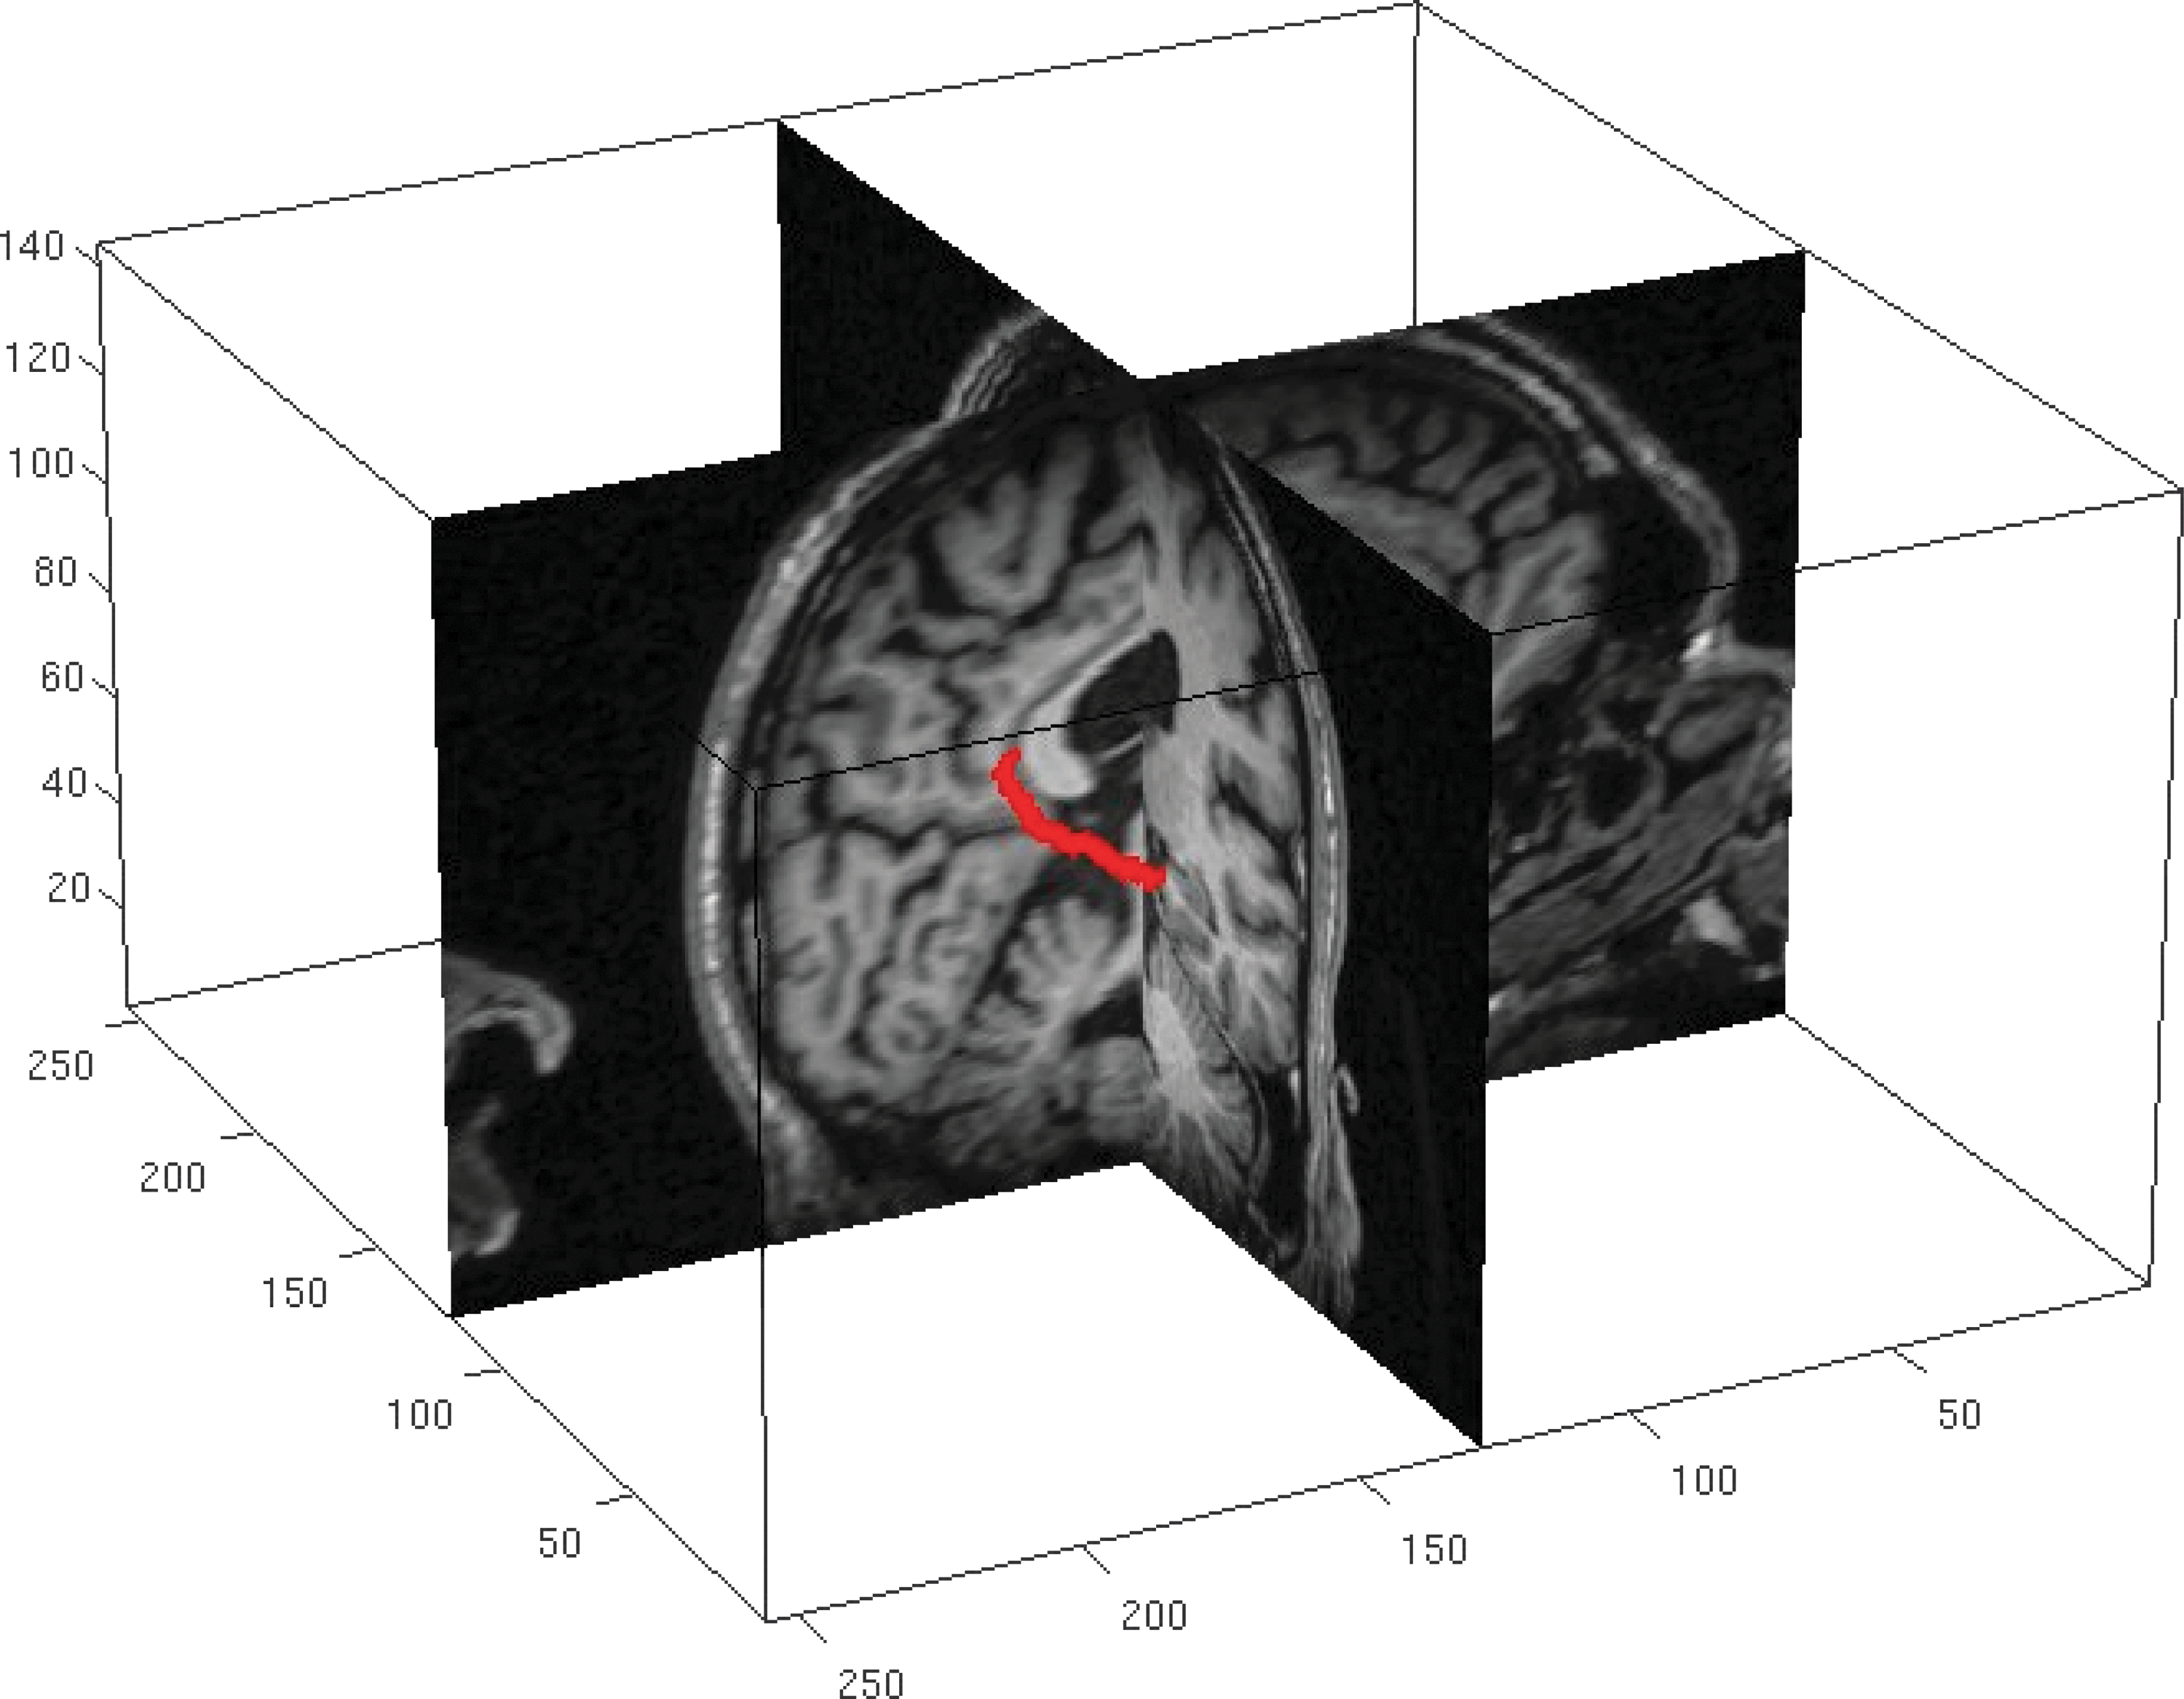
Two-plane view of PCC-EC track identified in one subject. The red pathway is an isosurface of track density identified between the two regions.
Functional connectivity
The RS-fMRI metric fc
is calculated in the following manner: 1. Right and left hemispheres, SMC, hippocampal, and PCC ROIs are defined using method described previously. 2. A reference timeseries is calculated from the linearly detrended arithmetic average of the nine pixels in each of the ROIs. 3. The cross correlation is calculated between the reference timeseries for each pathway of interest. The result is a correlation for each hemisphere's PCC-AMTL pathway and a correlation for the transcallosal motor pathway. 4. The cross correlation is converted to a Student's t (Press et al., 1986). This is taken to be fc
.
Statistical analysis
Given the known impact of MS on white matter RD, MD, and FA, one-sided p-values for two-sample t-tests are reported for comparing those values between MS and controls. The impact of MS on AD is less clear and seems to depend on disease duration and severity (Aung et al., 2013); thus, two-sided p-values are reported for AD. Similarly, we have an a priori expectation of an inverse correlation between RD, MD, and fc and a positive correlation between FA and fc ; thus, one-sided statistics are used for those p-values.
Results
Demographics
Sixteen relapse-remitting patients with MS (mean age=45.0 years±9.9; 3 men; mean education=15.9 years±2.6; median EDSS=2.25, range=1–6) and 19 age-, education-, and sex-matched control subjects (mean age=45.0 years±9.0; 7 men; mean education=15.2 years±2.3) were scanned in the protocol described previously. Patients and controls did not show differences in motion characteristics as measured by mean and maximum peak-to-peak displacements (Jiang et al., 1995).
Anatomic connectivity
We focus the text of the “Results” section on RD pathway measures of anatomic connectivity. The results for all tensor value comparisons between MS patients and control subjects are reported in Table 1. SMC pathway
Summary of All Pathway Connectivity Results
For MS patient connectivity measures, asterisk (*) means a significant difference (p<0.05) from healthy controls, (**) means p<0.01. For correlation values, (*) means p<0.05.
AD, axial diffusivity; FA, fractional anisotropy; MD, mean diffusivity; MS, multiple sclerosis; PCC-AMTL, posterior cingulate cortex-antero-medial temporal lobe; RD, radial diffusivity; SMC, sensorimotor cortex.
Functional connectivity
PCC-AMTL right-hemisphere fc was significantly lower in patients (p<0.01, one-sided).
Functional and anatomic connectivity correlation
fc
and
Since all pathway measures are statistically independent, it is possible to combine them. Combining all pathways in patients, fc
and

Pathway-dependent radial diffusivity versus function connectivity for SMC, and left- and right-hemisphere PCC-antero-medial temporal lobe (AMTL) for 35 subjects.
Discussion
There are two principal findings reported in this study. The first is that, when grouped as a population, anatomic connectivity measures indicate lower connectivity in some pathways for patients with MS than controls. Also, functional connectivity measures for MS patients are significantly lower than controls for some pathways.
The second, and most important finding reported in this study is that anatomic connectivity for monosynaptic pathways may, in general, be highly correlated to functional connectivity along that pathway. Figure 3 shows quite clearly for all the measured pathways that, generally speaking, if anatomic connectivity was high, so was functional connectivity.
A secondary finding of this study is that RD of water, as measured with diffusion-weighted MRI, is a robust measure of anatomic connectivity in healthy subjects and MS patients. This is reasonable in the context that all physiologic parameters of axons known to affect RD, mainly myelination and compactness of fibers, also affect conduction efficiency (Purves, 2001). Reduced myelination and/or reduced axonal density will result in both higher RD of water and reduced conduction efficiency.
In a disease like MS, there can be widespread white matter disease. Thus, in a report such as this that focuses on regional effects, it is important to demonstrate regional specificity of reported results. The principal finding here is that, along monosynaptic pathways, fc
and
It is interesting to note that, separately, the correlation between fc and RD for healthy controls and MS patients is around −0.5. However, when combined, the correlation is reduced to −0.41. Although the statistical significance increases dramatically due to the increase in sample size from combining the populations, the drop in the raw correlation may imply that there is a different relationship between fc and RD for control subjects and MS patients. This may reflect the fact that MS patients with lower fc values, or higher RD values, are likely due at least in part to impairment from disease, while the range of values of fc and RD for healthy controls is entirely developmental in nature. A much larger population would be necessary to investigate this and should be the focus of further studies.
In this work, our hypothesis was that pathway-averaged RD is a robust measure of anatomic connectivity. There have been other studies that have examined the relationship between functional connectivity and structural connectivity using other diffusion-based measures. Toosy and associates (2004) observed that pathway-averaged FA of the optic radiation correlated strongly with the strength of visual cortex activation in a visual paradigm fMRI. Van den Heuvel and coworkers (2008) observed a strong correlation between the resting-state functional connectivity of two nodes of the default mode network, PCC and medial frontal cortex, and mean FA of connecting white matter tracts along the cingulum. Although FA is a very popular scalar diffusion metric, we feel that RD is a more robust metric of white matter integrity. A principal reason is that FA is not independent of RD. It is calculated from RD and AD. As stated earlier, all physiologic reasons that we are aware of that would lead to decreased axonal conduction efficiency would result in an increased RD. This is not true of AD. AD has been observed to both increase and decrease in certain pathologic conditions (Aung et al., 2013). An ROC analysis demonstrates that RD is the most robust metric of change in white matter integrity if the impact on AD is unknown (i.e., can increase, decrease, or not change) (Lowe et al., 2011).
In this work, we have focused on MS as a model for white matter disconnection in order to study the brain structure-function relationship. Similar work has been done in other neurologic diseases that demonstrate the interdependence of structure and function. Recent work by Schmidt and coworkers (2014) reported a strong correlation between resting-state functional connectivity and structural connectivity, using pathway-averaged FA, in regions most affected by disease in a cohort of patients with amyotrophic lateral sclerosis. Interestingly, they report that the strongest observed correlation was between regions that had direct (i.e., monosynaptic) connections, similar to our findings here.
Another recent study using FA as their anatomic connectivity metric is one that examined anatomic/functional connection relationships in Schizophrenia (Cocchi et al., 2014). Schizophrenia is typically described as a disconnection syndrome of the fronto-temporal regions of the brain. In one of three networks that had significantly different functional connectivity between patients and controls, Cocchi and colleagues (2014) observed a lower correlation between network-level FA-based structural connectivity and functional connectivity in the patient cohort. They further report that, while the control subjects exhibited a strong structure-function correlation, the patient networks had an absence of correlation. This is an interesting result in the context of a brain disorder. One would expect the range of connectivity to be different between patients and controls, but the lack of a relationship between structure and function is hard to understand. It may be due to the extraordinary homogeneity in the composition of the schizophrenic sample (e.g., no comorbid conditions or severe symptomatology).
We justify the use of one-sided statistics for physiologic reasons (MS patients should have increased RD relative to healthy controls) and hypothetical reasons (in a direct pathway, reduced conduction efficiency should result in lower functional connectivity). However, if we use two-sided statistics, then the major findings are essentially unaffected. Only the correlation between SMC pathway RD and fc in the individual MS and control groups loses significance. The correlation between SMC pathway RD and fc is still significant when combining both groups.
Conclusions
We report the results of RS-fMRI and HARDI-based fiber tracking, which show a strong correlation between indices of anatomic connectivity and functional connectivity in three distinct, directly connected (i.e., monosynaptic) brain regions in 35 individuals. These results suggest that for directly connected brain regions, in general, if anatomic connectivity is high, then functional connectivity is high, and vice versa. In addition, these results suggest that RD is an excellent candidate as a diffusion-based measure of anatomic connectivity.
Footnotes
Acknowledgments
The authors gratefully acknowledge the assistance provided by Katherine M. Murphy, John Cowan, and Derrek Tew. This project was supported by a grant from the National Multiple Sclerosis Foundation.
Author Disclosure Statement
No competing financial interests exist.