




Abstract
The emergence of resting-state functional connectivity (rsFC) analysis, which examines temporal correlations of low-frequency (<0.1 Hz) blood oxygen level-dependent signal fluctuations between brain regions, has dramatically improved our understanding of the functional architecture of the typically developing (TD) human brain. This study examined rsFC in Down syndrome (DS) compared with another neurodevelopmental disorder, Williams syndrome (WS), and TD. Ten subjects with DS, 18 subjects with WS, and 40 subjects with TD each participated in a 3-Tesla MRI scan. We tested for group differences (DS vs. TD, DS vs. WS, and WS vs. TD) in between- and within-network rsFC connectivity for seven functional networks. For the DS group, we also examined associations between rsFC and other cognitive and genetic risk factors. In DS compared with TD, we observed higher levels of between-network connectivity in 6 out 21 network pairs but no differences in within-network connectivity. Participants with WS showed lower levels of within-network connectivity and no significant differences in between-network connectivity relative to DS. Finally, our comparison between WS and TD controls revealed lower within-network connectivity in multiple networks and higher between-network connectivity in one network pair relative to TD controls. While preliminary due to modest sample sizes, our findings suggest a global difference in between-network connectivity in individuals with neurodevelopmental disorders compared with controls and that such a difference is exacerbated across many brain regions in DS. However, this alteration in DS does not appear to extend to within-network connections, and therefore, the altered between-network connectivity must be interpreted within the framework of an intact intra-network pattern of activity. In contrast, WS shows markedly lower levels of within-network connectivity in the default mode network and somatomotor network relative to controls. These findings warrant further investigation using a task-based procedure that may help disentangle the relationship between brain function and cognitive performance across the spectrum of neurodevelopmental disorders.
Introduction
Down syndrome (DS; trisomy 21) is a neurodevelopmental disorder that is caused by the presence of three copies of chromosome 21. It occurs in one in every 691 live births in the United States (Parker et al., 2010), and it is the most common genetic cause of intellectual disability (Lott and Dierssen, 2010; Mégarbané et al., 2009). The cognitive deficits associated with DS can vary widely across individuals, ranging from mild to severe cognitive impairment, with the mean full-scale intellectual quotient (IQ) of 50 (Lott and Dierssen, 2010). The cognitive profiles can also vary, but individuals with DS typically exhibit deficits in language, verbal short term-memory, and explicit long-term memory (Brown et al., 2003; Clark and Wilson, 2003; Edgin et al., 2010; Hodapp and Dykens, 2005; Nadel, 2003).
In terms of brain abnormalities, volumetric magnetic resonance imaging (MRI) studies have consistently reported that individuals with DS have significantly smaller whole brain, frontal and prefrontal lobe, temporal lobe, amygdalar, cerebellar, and hippocampal volumes compared with individuals with typical development (TD) (Aylward et al., 1999; Kesslak et al., 1994; Pinter et al., 2001; Raz et al., 1995; White et al., 2003). It has also been suggested that individuals with DS experience accelerated or an early onset of brain aging as evidenced by significant age-related reduction in brain volume (Beacher et al., 2010; Koran et al., 2014; Teipel et al., 2004). While numerous volumetric studies have characterized the structural brain anomalies associated with DS, less is known about the functional consequences of such structural anomalies in the DS brain. A task-based functional MRI (fMRI) study showed decreased activation in receptive language areas in DS compared with TD controls during passive story listening (Reynolds Losin et al., 2009). Another fMRI study showed atypical neural activation during an object-recognition task in DS compared with age-matched TD controls (Jacola et al., 2011). While these task-based fMRI studies suggest altered activation patterns in DS, no studies to date have characterized functional connectivity in the DS brain during rest.
The emergence of resting-state functional connectivity (rsFC), which examines temporal correlations of low-frequency (<0.1 Hz) blood oxygen level-dependent (BOLD) signal fluctuations between brain regions, has dramatically improved our understanding of the functional architecture of the human brain and could be used to measure deficits and longitudinal changes in functional brain networks. The most commonly investigated resting-state network is the default mode network (DMN). The DMN refers to a group of brain regions originally characterized by greater activation during control conditions compared with during cognitively demanding goal-oriented tasks in task-based fMRI studies (Raichle et al., 2001). A subsequent study found that regions in the DMN were functionally correlated during rest, confirming the notion that these regions form a network (Greicius et al., 2003). The four core regions consistently identified in the DMN are the medial prefrontal cortex, posterior cingulate (PCC)/precuneus cortex, and bilateral inferior parietal lobules (Gusnard and Raichle, 2001; Raichle et al., 2001); however, additional regions such as medial temporal lobe are sometimes included as a part of the DMN (Buckner et al., 2008; Greicius et al., 2003, 2004). The DMN is hypothesized to mediate task-independent intrinsic stimulus processing (Buckner et al., 2008; Gusnard and Raichle, 2001; Raichle et al., 2001; Whitfield-Gabrieli and Ford, 2012).
In addition to the DMN, rsFC studies have identified several other resting-state brain networks associated with higher cognitive functioning (Yeo et al., 2011), such as the dorsal and ventral attention networks (DAN and VAN, respectively) (Fox et al., 2006), the salience network (Seeley et al., 2007), and the frontoparietal/executive control network (Seeley et al., 2007; Vincent et al., 2008). Because rest has no cognitive or behavioral demands, rsFC could be particularly useful for characterizing functional brain network differences in populations with intellectual disabilities.
To date, only one published study has evaluated functional connectivity in individuals with DS. Anderson et al. (2013) compared functional connectivity in 15 individuals with DS to 14 TD control subjects while they viewed 50 min of cartoon video clips and found that individuals with DS exhibited higher levels of connectivity between most brain regions. Brain regions that are typically negatively correlated, such as DMN regions and regions comprising the DAN and frontoparietal network, were found to be less (negatively) correlated in individuals with DS. A functional parcellation of the brain showed a simplified network structure in DS, characterized by increased between-network connectivity, particularly in networks with shorter-range connections, which was not observed in an autism comparison sample with normal IQ (Anderson et al., 2013). The authors suggest that their findings indicate immature development of connectivity in DS with impaired ability to integrate information from distant brain regions into coherent distributed networks. Anderson et al. (2013) has provided one of the first characterizations of functional connectivity across brain networks in the DS population. This study sought to validate those findings when utilizing a conventional resting-state scanning procedure while extending those findings to include a novel comparison group and also investigation of within-network functional connectivity.
For this study, we compared between- and within-network rsFC using a published parcellation of the brain into seven functional networks (Yeo et al., 2011). Given the nature of DS as a neurodevelopmental disorder, we were interested in evaluating whether any abnormalities observed in DS were distinct in different neurodevelopmental disorders. Therefore, we compared between- and within-network rsFC connectivity in our DS group to individuals with Williams syndrome (WS) and TD controls. WS is a neurodevelopmental disorder caused by the hemizygous deletion of a 1–2 Mb contiguous genomic region containing 26–28 genes on chromosome 7q11.23 (Korenberg et al., 2000). As with DS, WS is also associated with cognitive impairment, with average full-scale IQ for individuals ranging from 50 to 60, indicating mild to moderate intellectual disability (Martens et al., 2008). The WS cognitive profile is characterized by deficits in visuospatial and implicit memory and strengths in language, verbal short-term memory, face and object recognition, and music processing skills (Conners et al., 2011; Dykens et al., 2005; Hocking et al., 2011; Tsai et al., 2008). In addition, individuals with WS often demonstrate increased nonsocial anxiety and phobias, paired with hypersociability and heightened empathy (Dykens, 2003; Mervis and John, 2010; Morris, 2010). Work in our own lab has investigated rsFC in WS but focused exclusively on auditory processing networks (Pryweller, 2013). To our knowledge, there are no other published studies of rsFC in WS.
In this study, we first aim at confirming previous findings of increased between-network connectivity in DS compared with TD controls and at establishing whether such differences are specific to DS or are also observed in another developmental disability, WS. If the increased between-network connectivity previously observed in DS is due to atypical neurodevelopment that is unique to DS, then we should observe such between-network pairs connectivity differences between DS versus TD, but not between WS versus TD. If, however, increased between-network connectivity is a generalized, nonspecific feature associated with atypical neurodevelopment, then we should observe between-network connectivity differences between each of the DS and WS groups when compared with TD. Finally, we aim at characterizing how the within-network connectivity profiles of DS and WS could be compared with each other and with TD. Together, these aims will attempt to replicate previous work while providing new insights into resting-state brain function across two different neurodevelopmental disorders.
Materials and Methods
Participants
This study included data from ten participants with DS (4 males; 39±10 years of age), 18 participants with WS (13 males; 26±9 years of age), and 40 participants with TD (24 males; 47±22 years of age), all of whom were recruited for other primary studies in the lab. Participants with DS and WS exhibited the physical, cognitive, and behavioral profile associated with their respective neurodevelopmental disorder and received a clinically confirmed genetic diagnosis before enrolling in the research study. Exclusion criteria for all participants included (1) nonremovable ferromagnetic material on or in the body, (2) claustrophobia, (3) pregnancy, (4) a history of a neurological disorder, and (5) untreated hypothyroidism. The three groups were tested for differences in age and gender, using independent samples t-tests and a chi-square test, respectively. Demographic characteristics and between-group statistics are provided in Table 1. The Vanderbilt University Institutional Review Board approved all study protocols. Informed consent was obtained from TD participants and caregivers of participants with DS and WS, while an assent was obtained from all DS and WS participants.
Within-Group Summary Statistics and Between-Group Comparisons of Sample Demographics
p≤0.01 (two-tailed).
DLD, dementia questionnaire for people with learning disabilities; DS, Down syndrome; IQ, intellectual quotient measured by KBIT2; n/a, not applicable since the DLD was only measured in subjects with Down syndrome; SOS, sum of social scores; TD, typically developing; WS, Williams syndrome.
Cognitive testing
IQ was assessed using the Kaufman Brief Intelligence Test, Second Edition (KBIT-2) (Kaufman and Kaufman, 2004), a brief measure of intelligence developed for research or screening purposes in clinical and typically developing populations (TD population: mean=100, SD=15). The KBIT-2 is validated for use in individuals aged 4 years through adulthood, and administration is brief, accommodating functional or behavioral challenges in individuals, which would otherwise preclude the use of a longer intellectual assessment. Standard scores (verbal, nonverbal, and composite IQ) were obtained from 22 of our 40 TD participants, 17 of the 18 WS participants, and all 10 DS participants. KBIT-2 scores correlate highly with other full-scale IQ tests and have successfully been used to estimate intelligence in individuals with neurodevelopmental disorders, including DS and WS (Edgin et al., 2010; Kaufman and Kaufman, 2004; Mervis et al., 2012). Group mean scores from each of the three participant groups were tested for differences using an independent samples t-test (Table 1).
Aging in individuals with DS is associated with an increased risk of developing Alzheimer's disease (AD) (Rohn et al., 2014), with 70 percent developing dementia by age 70 (Evenhuis, 1990). Postmortem studies have revealed that by 40 years of age, nearly all individuals with DS have lesions present in the brain that meet the pathological criteria for AD (Mann, 1988). Caregivers of participants with DS completed the dementia questionnaire for people with learning disabilities (DLD), which is commonly used to assess dementia in individuals with DS (Prasher, 1997; Shultz et al., 2004). The DLD is a 50-item questionnaire that consists of eight subtests to assess cognition and social skills. A sum of cognitive scores is calculated from the short-term memory, long-term memory, and spatiotemporal orientation subtests; whereas a sum of social scores (SOS) is calculated from the speech, practical skills, mood, activity, and interest and behavioral disturbance subtests. Higher scores in either subtest indicate greater impairment. All neuropsychological assessment characteristics along with their corresponding statistical values are detailed in Table 1.
MRI image acquisition
Neuroimaging data were acquired from all participants using a 3T Philips Achieva MRI scanner (Philips Medical Systems, Inc.) housed in the Vanderbilt University Institute of Imaging Science. During acquisition, participants wore foam earplugs and Philips headphones to attenuate noise. In an effort to minimize anxiety and create a comfortable scanner environment, participant-selected music or a movie was presented during acquisition of structural sequences. Resting-state fMRI was collected in the absence of external stimuli using a T2*-weighted echo planar imaging (EPI) sequence (FOV=240 mm2, 1.875×1.875×3.85 mm3 voxels, TR=2000 msec, TE=35 msec, flip angle=79°, 0.35 gap, 33 axial slices, 150 volumes). A high-resolution T1-weighted (T1W) 3D anatomical image (FOV=256 mm2, 1 mm isotropic voxels, TR=9 msec, TE=4.6 msec, flip angle=8°, 170 sagittal slices) was collected to provide a template for image registration.
fMRI preprocessing
All functional images underwent quality assurance and standard preprocessing in SPM software (version 8, Wellcome Department of Imaging Neuroscience;
Functional connectivity analysis
To evaluate resting-state brain networks, we used a publicly available parcellation of the brain obtained from Yeo et al. (2011), which includes seven distributed brain networks projected into MNI152 space. We used these networks (Visual, Somatomotor, DAN, VAN, Limbic, Frontoparietal, and DMN) as user-defined regions of interest (ROIs) in rsFC analyses performed using the MATLAB-based functional connectivity toolbox “Conn” (
APOE genotyping
Altered rsFC has been observed in APOE ɛ4 carriers compared with noncarriers (Buckner et al., 2005; Filippini et al., 2009; Fleisher et al., 2009). Genotyping was performed at the Vanderbilt DNA Resources Core on a portion of TD (n=17) and on all participants with DS (n=10). APOE was directly genotyped using premade TaqMan single nucleotide polymorphism (SNP) genotyping assays C_3084793-20 (rs429358) and C_904973_10 (rs7412) from Applied Biosystems. Positive controls (DNA samples with known genotypes from Coriell Institute for Medical Research, Camden, NJ) and negative controls (no template) were included on the plate for assay validation. Genotyping was performed in a research laboratory that is not CLIA certified; therefore, genotyping results were not returned to participants or their clinicians. APOE genotypes available for TD and DS participants are detailed in Table 1. Quality control checks for SNP and sample genotyping efficiency, sample duplications, sex discrepancies, and tests of Hardy–Weinberg equilibrium were performed in PLINK (
Statistical analyses for between- and within-network connectivity
The following rsFC analysis procedures were conducted using the MATLAB-based Conn toolbox (Kesler et al., 2014; Redcay et al., 2013; Whitfield-Gabrieli and Nieto-Castanon, 2012). To evaluate between-network connectivity, for each subject, the BOLD time course was averaged across all voxels in each of the seven network ROIs, and the Fisher-transformed correlation was calculated for each pair of networks (for a total of 21 network pairs). Independent samples t-tests were used to assess group differences in between-network connectivity for all 21 network pairs (Table 2). We used a Bonferroni correction for multiple comparisons. Next, we conducted Spearman correlation analyses to assess the relationships between age, IQ, and between-network connectivity for each of the participant groups (Supplementary Table S1; Supplementary Data are available online at
Between-Group Comparison of Within-Network Connectivity
p<0.05 (uncorrected).
p<0.05 (Bonferroni corrected).
DAN, dorsal attention network; DMN, default mode network; VAN, ventral attention network.
To evaluate within-network connectivity, we calculated Fisher-transformed correlations between each voxel within each network ROI and that ROI's mean time course. We then calculated the mean correlation value within each ROI as proxy of total within-network connectivity. Independent samples t-tests were used to assess group differences (DS vs. TD, DS vs. WS, and WS vs. TD) in within-network connectivity for all seven networks (Table 3). Spearman correlation analyses were conducted to evaluate the relationships between age, IQ, and within-network connectivity in all seven networks for each of the participant groups (Supplementary Table S2).
Between-Group Comparison of Between-Network Connectivity
p<0.05 (Uncorrected).
p<0.05 (Bonferroni corrected).
Secondary analyses addressing age as potential confounder
Given that the range of ages differs substantially between groups and that connectivity can vary with age (Grady et al., 2006), it is possible that age is a confounder in our between-group analyses. To address this question, we repeated our between-network and within-network analyses after restricting the TD age range to more closely match that of both the DS and WS groups. In addition, as recommended by Faresjö and Faresjö (2010), we also conducted univariate regression analyses, using age as a covariate and testing for significance of the Group term beta coefficient (Faresjö and Faresjö, 2010).
Exploratory analyses in DS
To further characterize rsFC patterns specific to DS, we performed several analyses to test for an association between rsFC and other cognitive and genetic risk factors. Spearman correlation analyses were used to assess the relationship between DLD-SOS score and between-network connectivity (included in Supplementary Table S1), and between DLD-SOS score and within-network connectivity for each of the seven networks (included in Supplementary Table S2). To control for Type I error, we restricted our DLD-SOS correlation analyses to network pairs that were statistically significant in any of the group comparisons.
Next, we performed an exploratory analysis to determine the relationship between rsFC and APOE genotype in the TD and DS participants for whom genotyping was performed. The participants with APOE genotype data were divided into two groups based on the absence (ɛ4−; n=22) or presence (ɛ4+; n=5) of an APOE ɛ4 allele. For each of the seven networks, the relationship between APOE ɛ4 and within-network connectivity or between-network connectivity was assessed using independent samples t-tests. These analyses were restricted to network pairs that were statistically significant in the DS versus TD comparison.
Results
Between-network connectivity results
We first tested for group differences in connectivity between brain networks. The networks were defined a priori by using the seven-network brain parcellation obtained from Yeo et al. (2011). Consistent with previous findings (Anderson et al., 2013), the DS group showed greater between-network connectivity for 12 out of 21 network pairs compared with TD. After correcting for multiple comparisons, 6 out of 21 network pairs remained statistically significant (Table 2a and Fig. 1a). In particular, DS showed significantly greater between-network connectivity compared with TD for the following network pairs: (1) Visual-Frontoparietal (t(48)=4.83, p<0.0001), (2) Somatomotor-Frontoparietal (t(48)=3.45, p=0.0012), (3) Somatomotor-DMN (t(48)=3.68, p=0.0006), (4) DAN-Frontoparietal (t(48)=4.95, p<0.0001), (5) DAN-DMN (t(48)=4.30, p=0.0001), and (6) Limbic-DMN (t(48)=3.18, p=0.0025).
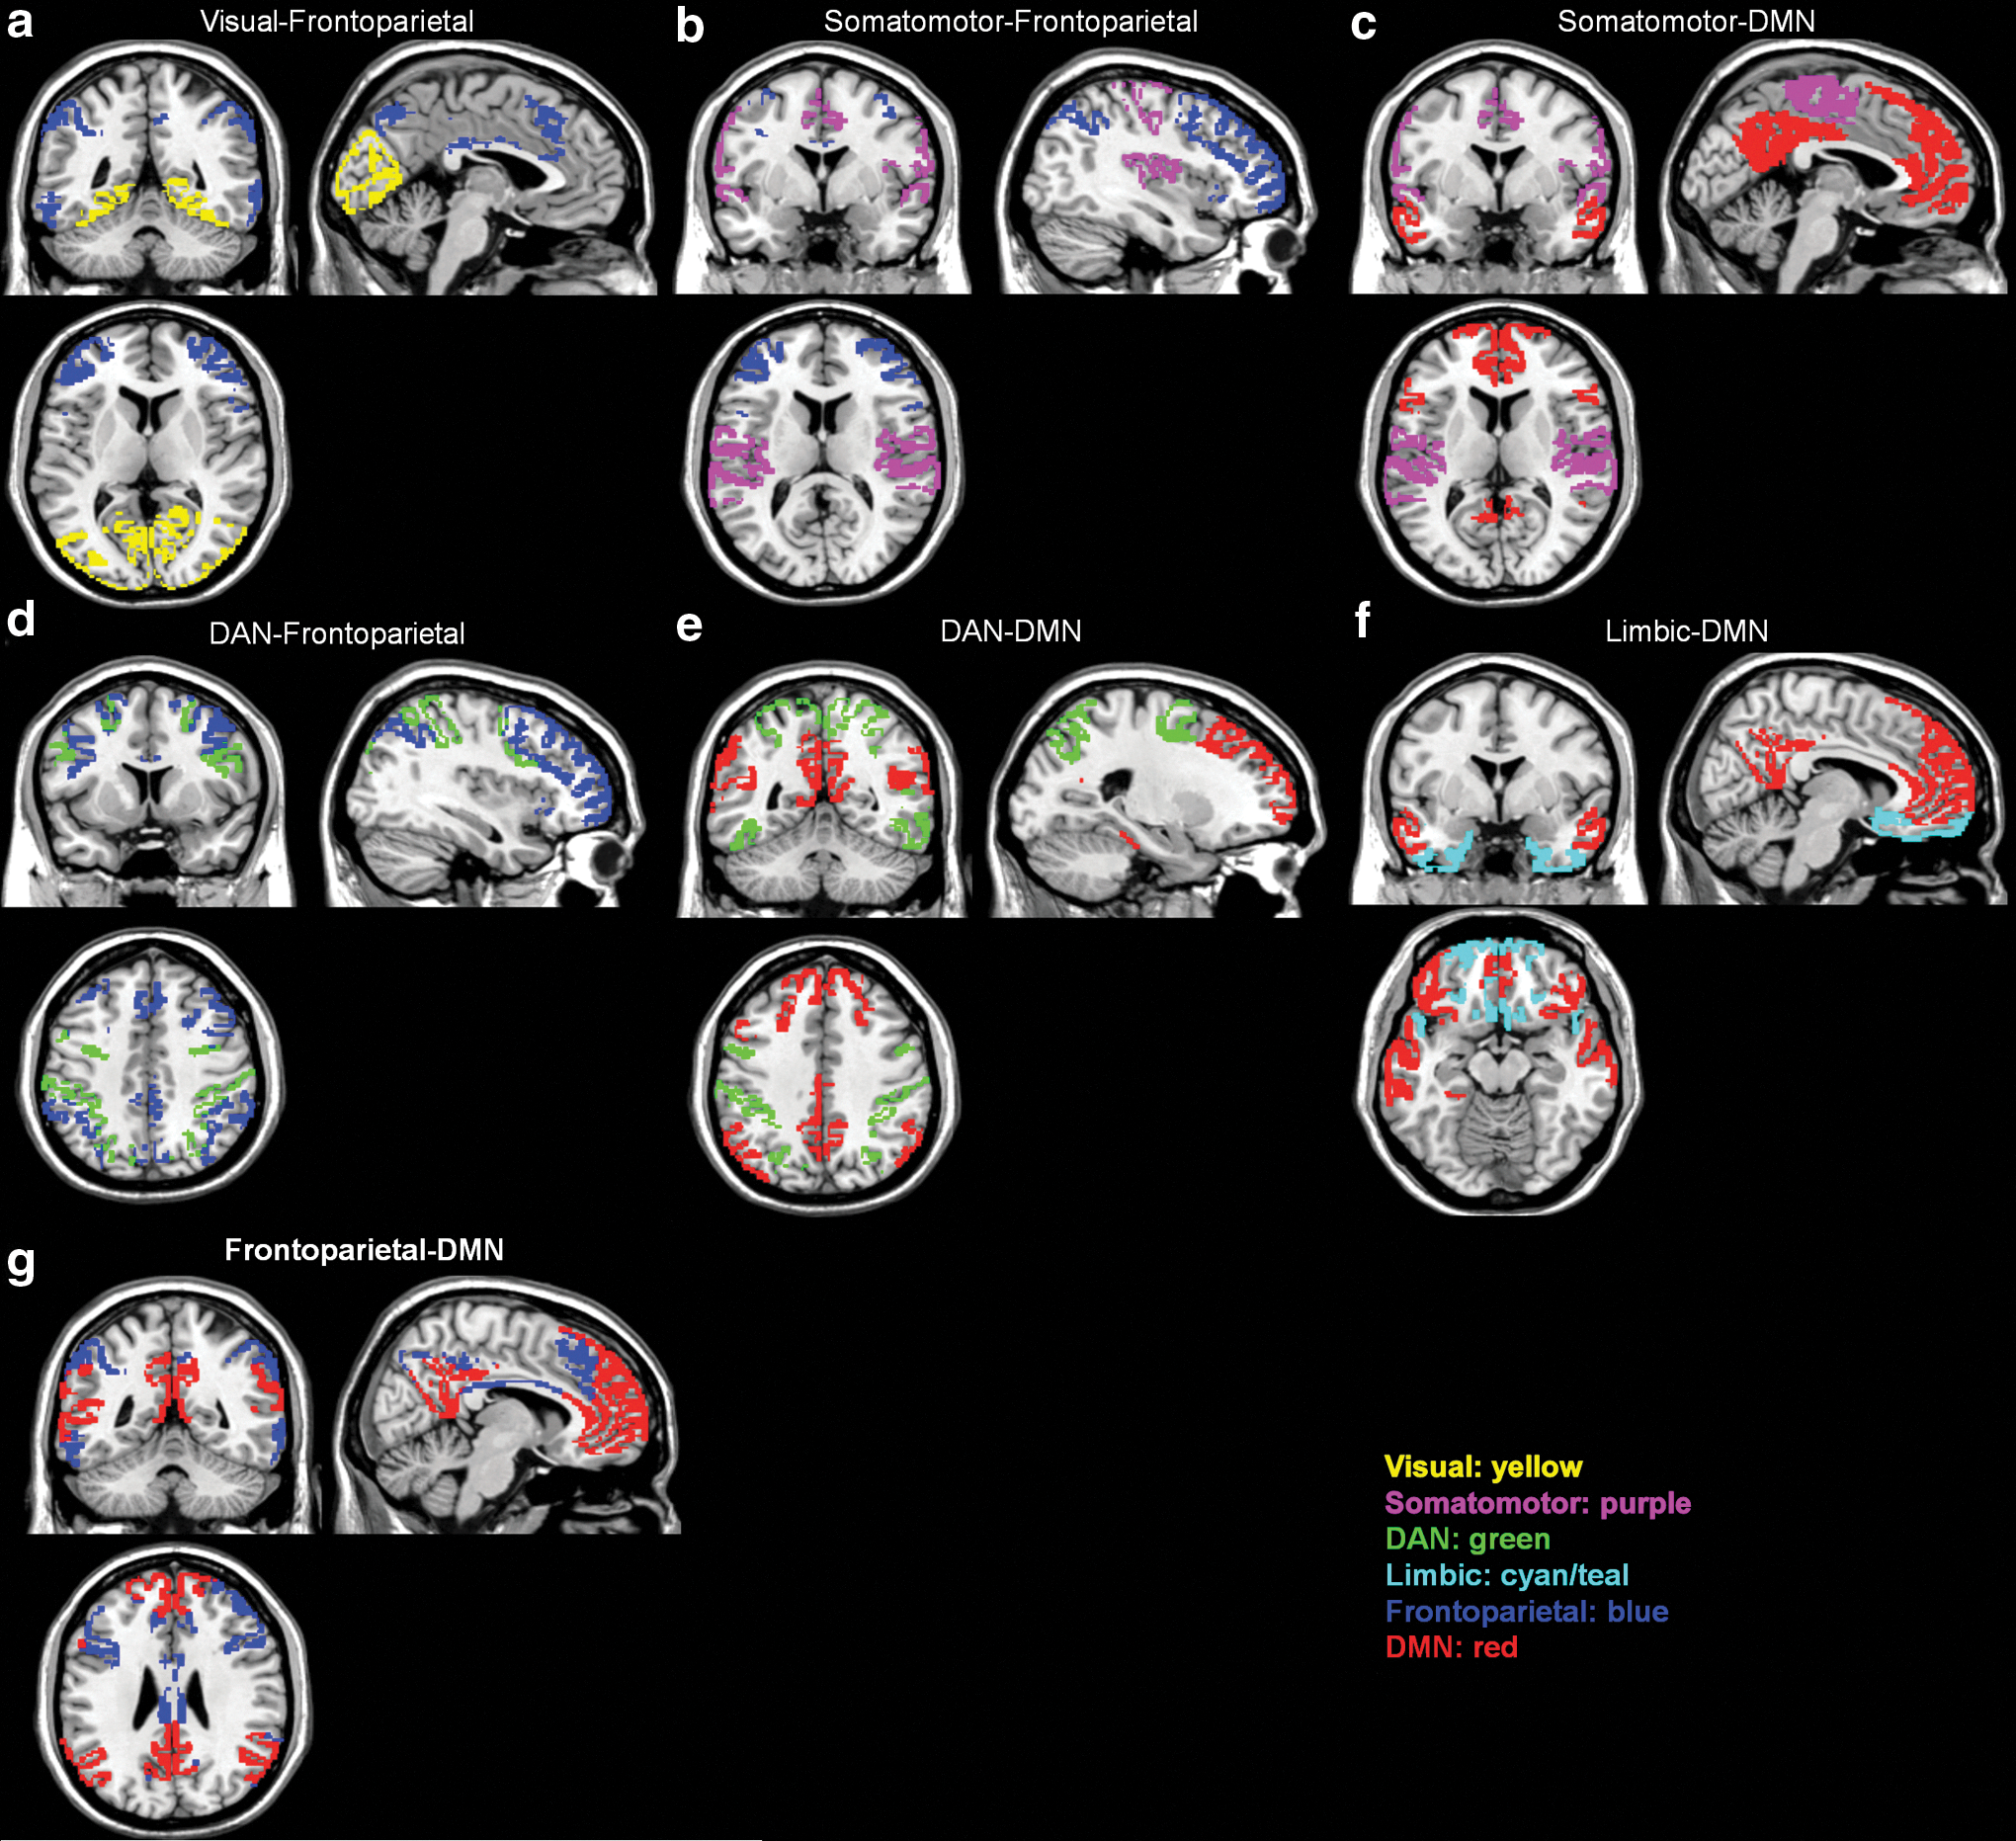
Visualization of the approximate anatomical location of between-network pairs whose interconnectivity was significantly different for DS versus TD
The DS group showed a trend toward greater between-network connectivity compared with the WS group for 8 out of 21 network pairs; however, none of these network pairs remained statistically significant after correcting for multiple comparisons (Table 2b). Similarly, the WS group showed a trend toward greater between-network connectivity for seven out of 21 network pairs compared with TD, but only one out of 21 network pairs remained statistically significant (Table 2b and Fig. 1b). WS showed significantly greater between-network connectivity compared with TD for the Frontoparietal-DMN (t(56)=3.48, p=0.001) network pair.
We then tested for associations between age and IQ and between-network connectivity. We limited our correlation analysis to the seven network pairs that were shown to be statistically significant in the DS versus TD and the WS versus TD comparisons. Results for each group are shown in Supplementary Table S1. In the Spearman correlation analyses, age showed a significant negative correlation with the Limbic-DMN pair (ρ(40)=−0.49, p=0.001; corrected p<0.05) for the TD group (Supplementary Fig. S1), such that connectivity was lower for higher ages. Neither age nor IQ showed a significant association with any of the significant between-network pairs in the DS or WS group.
Within-network connectivity results
We next tested for group differences in connectivity within each of the seven brain networks. Results are shown in Table 3 for each group comparison. For the within-network connectivity analyses, the DS group showed a trend for greater within-network connectivity in the Limbic network compared with the TD group. However, no differences in within-network connectivity for the DS versus TD comparison remained significant after correction for multiple testing. When examining differences in within-network connectivity between DS and WS, DS showed a trend for greater within-network connectivity in three out of seven networks compared with WS. After correcting for multiple comparisons, the following two networks remained statistically significant for the DS versus WS comparison: (1) DMN (t(26)=3.38, p<0.05) and (2) Visual network (t(26)=3.39, p<0.05). When examining group differences in within-network connectivity between WS and TD, TD showed a trend for greater within-network connectivity in four out of seven networks compared with WS. After correcting for multiple comparisons, the following three networks remained statistically significant for the WS versus TD comparison: (1) DMN (t(56)=−3.47, p<0.05), (2) VAN (t(56)=3.10, p<0.05), and (3) Somatomotor network (t(56)=−3.98, p<0.05).
We then tested for associations between age and IQ measures and within-network connectivity. Results for each group are shown in Supplementary Table S2. In the Spearman correlation analyses, composite IQ showed a significant positive correlation with DMN connectivity (rs (22)= 0.63, p=0.002; Bonferroni-corrected p<0.05) for the TD group (Supplementary Fig. S2), such that DMN connectivity was higher in individuals with higher composite IQ. No associations were seen between IQ and age with any of the seven networks for either the DS or WS groups.
Secondary analyses addressing age as potential confounder
Age-restricted t-test results
For the DS versus TD comparisons, the TD age range was restricted to ≤56 years (the age of the oldest DS participant), thereby reducing the TD sample size to n=21, and for the WS versus TD comparisons, the TD age range was restricted to ≤48 (the age of the oldest WS participant), thereby reducing the TD sample size to n=20. For the between-network connectivity comparisons, out of the seven that were significant in the full dataset, two were no longer significant when using the age-restricted TD dataset—the Limbic-DMN for DS versus TD (Supplementary Table S3a) and the Frontoparietal-DMN for WS versus TD (Supplementary Table S3b). For the within-network connectivity comparisons, one of the three networks that were significant in the full dataset no longer reached significance—the VAN for the WS versus TD group (Supplementary Table S4b). However, there also was one within-network connectivity comparison that reached significance using the age-restricted TD dataset that was only showing a trend in the full dataset—the Limbic network, suggesting DS within-newtwork connectivity was greater compared with TD (Supplementary Table S4a).
Age-adjusted regression results
For the between-network connectivity comparisons, out of the seven that were significant in the full dataset, two were no longer significant when using age as a covariate and testing for significance of the Group term beta coefficient—the Limbic-DMN for DS versus TD (Supplementary Table S5a) and the Frontoparietal-DMN for WS versus TD (Supplementary Table S6b). For the within-network connectivity comparisons, one of the three networks that were significant in the full dataset no longer reached significance—the VAN for the WS versus TD group (Supplementary Table S6b). The results for the DS versus TD within-network comparison remained unchanged from the original analysis (Supplementary Table S6a).
Exploratory analyses in DS
In the DLD-SOS post hoc Spearman correlation analysis, which was performed only in the relevant DS group, no relationship between DLD-SOS score and any of the seven significant between-network pairs was found (included in Supplementary Table S1). In the Spearman correlation analysis for DLD-SOS score and within-network connectivity, no relationship was found for any of the seven networks after correcting for multiple comparisons (included in Supplementary Table S2). However, there was a trend toward higher DLD-SOS scores being associated with lower VAN (rs (10)=−0.70, p=0.02, uncorrected) and DAN (rs (10)=−0.65, p=0.04, uncorrected) within-network connectivity.
In the APOE ɛ4 post hoc analysis for between-network connectivity, no differences were observed in any of the network pairs that were shown to be statistically significant for the DS versus TD comparison (Supplementary Table S3). In the APOE ɛ4 post hoc analysis for within-network connectivity, ɛ4 carriers were shown to have decreased connectivity within the DAN compared with noncarriers (t(25)=3.10, p=0.005, Table 4 and Fig. 2).
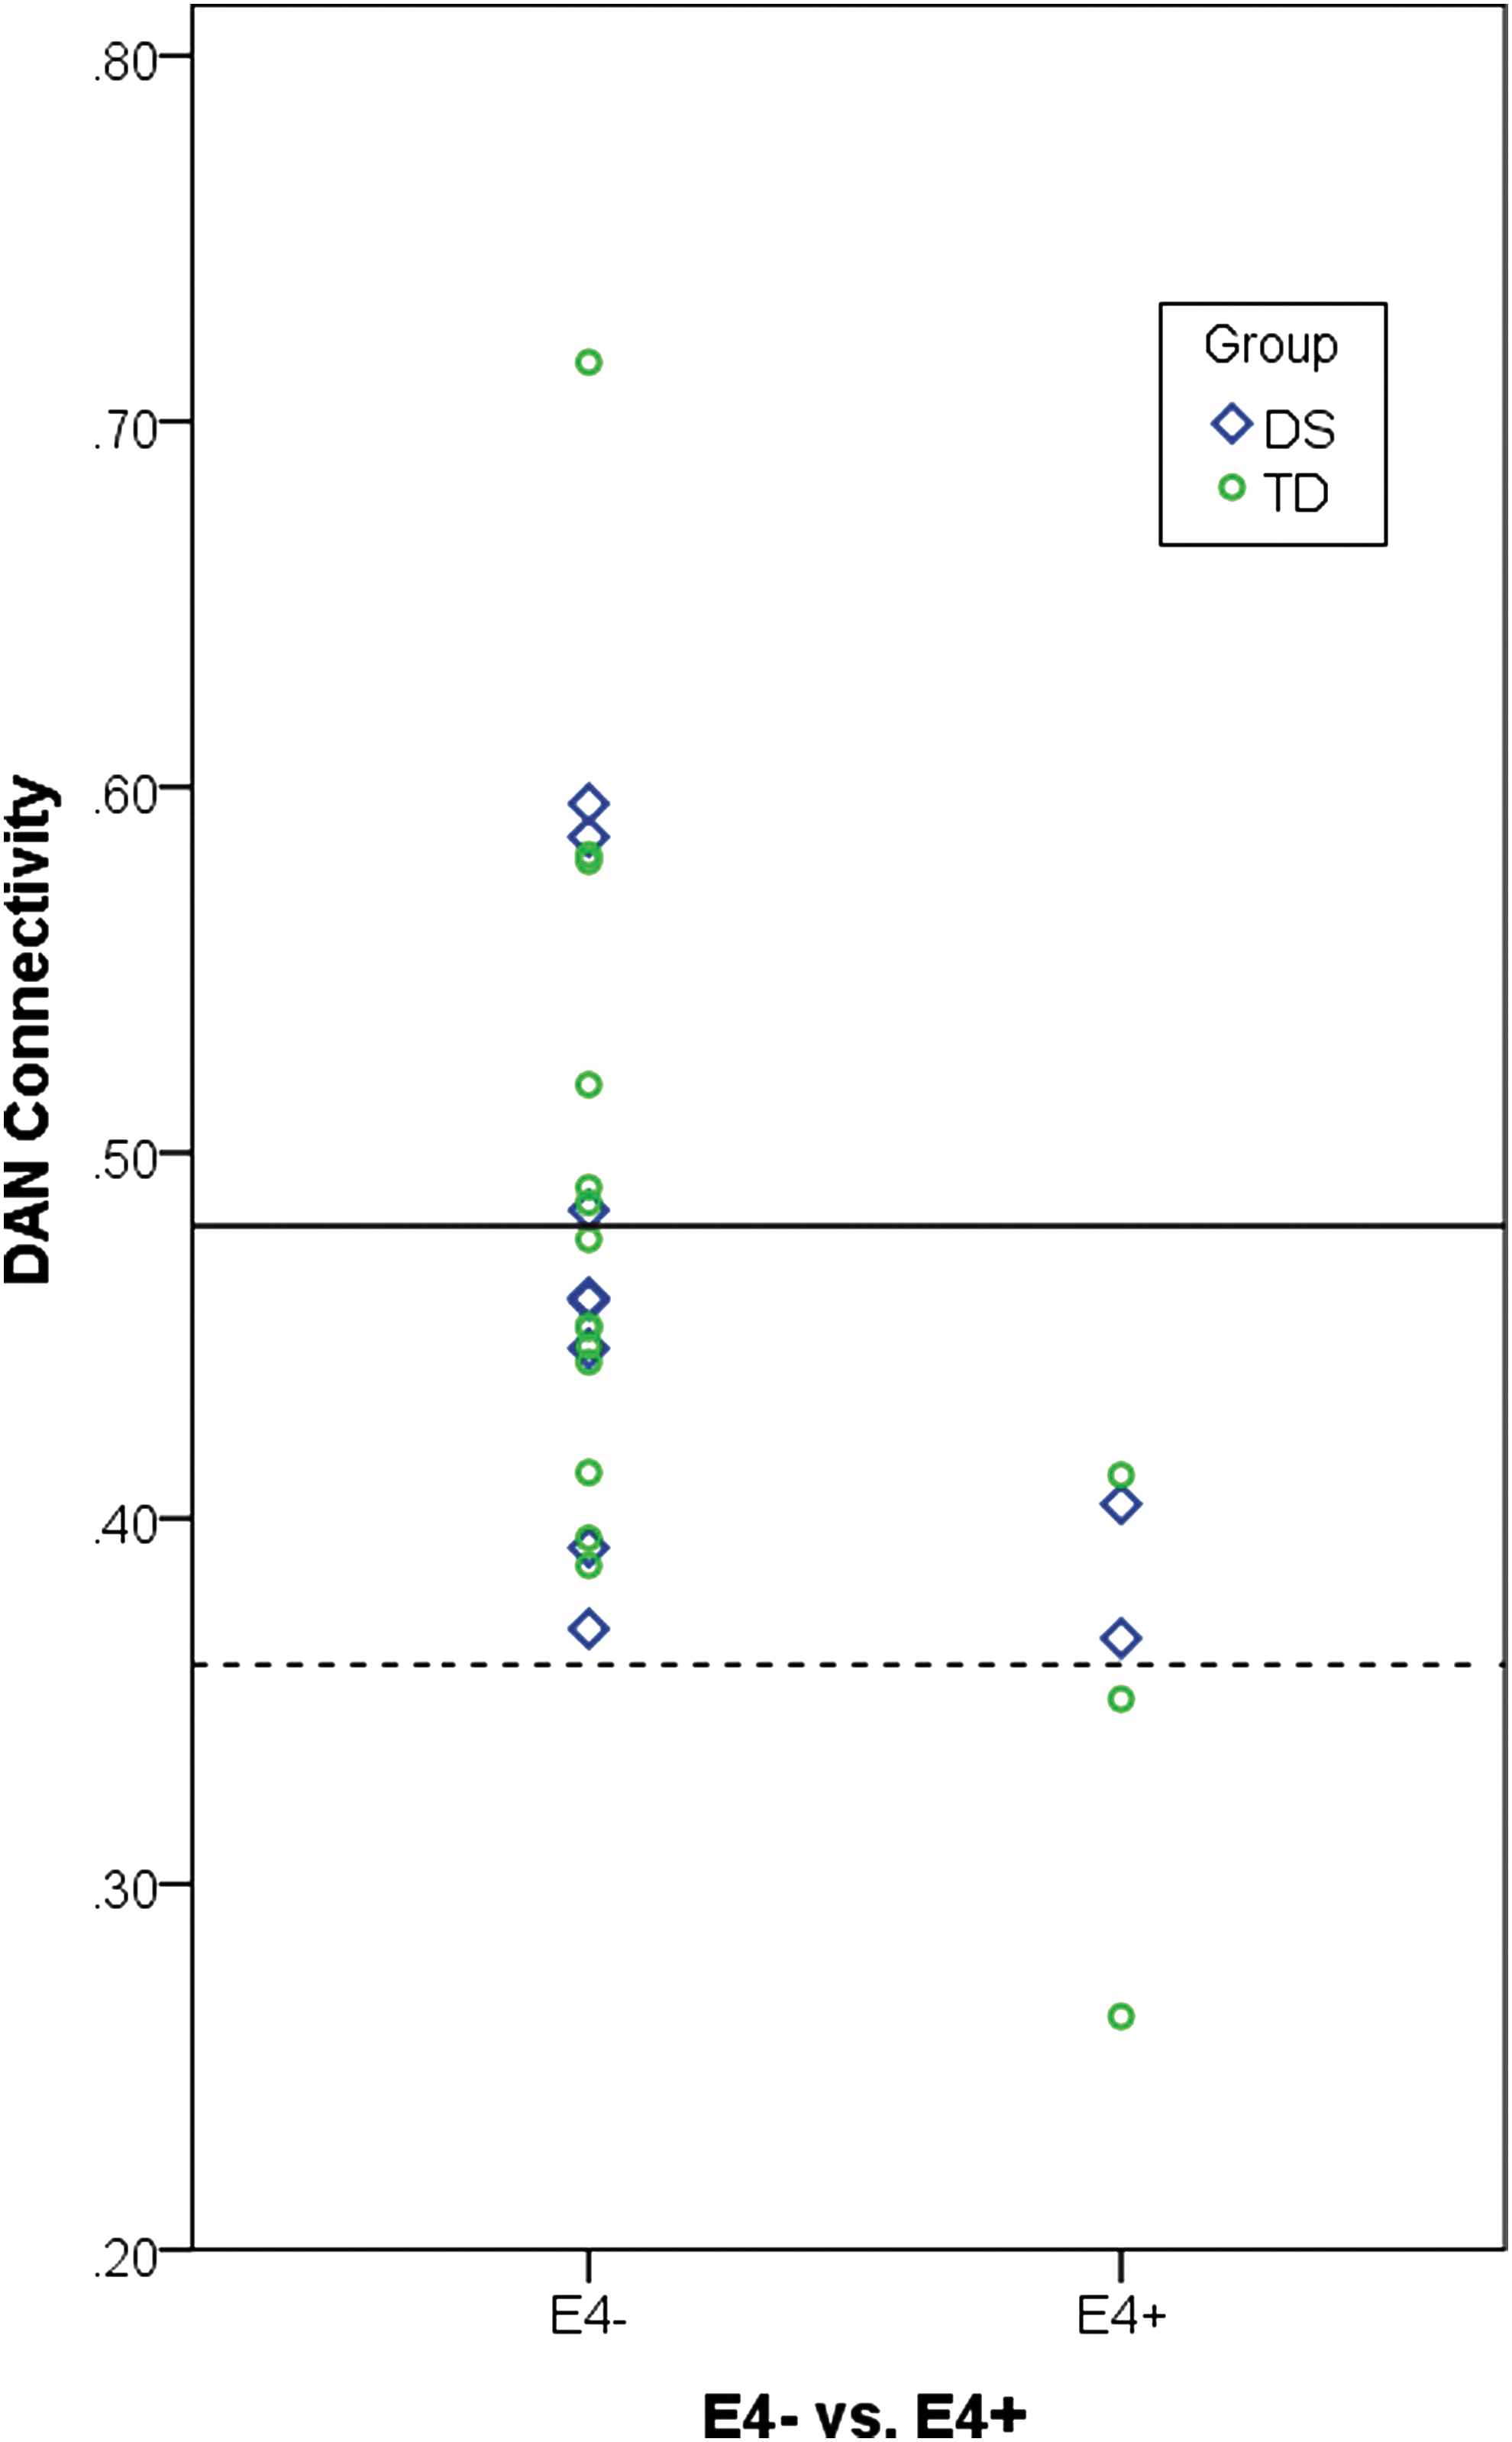
For the purpose of visualization, the presence (ɛ4+) or absence (ɛ4−) of APOE ɛ4 alleles is plotted in relationship to within-DAN connectivity across the DS (blue) and TD (green) groups. The solid line indicates the mean for within-DAN connectivity value for the ɛ4− group, and the dashed line indicates the mean within-DAN connectivity value for the ɛ4+ group. A two-sample t-test showed APOE ɛ4 carrier status to be associated with connectivity within the DAN; however, a larger sample size will be needed to accurately estimate this effect.
Difference in Mean Within-Network Connectivity by APOE Carrier Status
Correlation is significant at the 0.05 level (Bonferroni corrected).
Discussion
Between-network connectivity
The first aim of the current study was to confirm previous findings of increased connectivity in DS between most brain regions compared with TD. As in Anderson et al. (2013), we evaluated connectivity between pairs of the following resting-state networks: (1) Visual network, (2) Somatomotor network, (3) DAN, (4) VAN, (5) Limbic network, (6) Frontoparietal, and (7) DMN (for a total of 21 network pairs). DS participants showed greater functional connectivity in 12 out of 21 between-network pairs compared in our analyses, which is quite comparable to the 14 out of 21 between-network pair differences previously observed (Anderson et al., 2013). Six of these comparisons were statistically significant after correction for multiple testing. The greater connectivity disturbances observed in frontoparietal network pairs in DS are consistent with results from the Arizona Cognitive Test Battery, specifically designed for DS, in which neuropsychological measures that probe frontal lobe function demonstrate the most prominent cognitive deficits in DS (Edgin et al., 2010). However, unlike the previous work comparing DS with autism (Anderson et al., 2013), our results also suggest that while the magnitude of between-network connectivity is slightly higher in DS compared with WS, the overall profile of the two developmental disabilities is quite similar. Both groups show trend level or statistically significant differences in many of the between-network combinations when compared with TD controls. Therefore, between-network connectivity alterations, particularly involving the DMN and/or frontoparietal networks, may be a more general feature of neurodevelopmental disorders. Such a possibility is further supported by previous findings of default mode dysfunction in autism (Assaf et al., 2010; Maximo et al., 2013; Starck et al., 2013) and ADHD (Choi et al., 2013; Uddin et al., 2008) comparable to the observed alterations in WS outlined next. However, it should be noted that Anderson et al. (2013) did not observe this atypical pattern of greater between-network connectivity pattern in their cohort of individuals with autism with normal IQ (Anderson et al., 2013). More research on the between-network connectivity in developmental disabilities is warranted to clarify which alterations (if any) are specific to the pathogenesis of a given neurodevelopmental disorder.
Although there appears to be a global difference in between-network connectivity in individuals with neurodevelopmental disorders compared with controls, our results also replicate a preferential abnormality across many brain regions in DS. As highlighted by Anderson et al. (2013), this may be due to a lack of global network differentiation, or dedifferentiation, in DS due to alterations in inhibitory circuitry, although our data cannot evaluate such a model directly.
Within-network connectivity
The second aim of this article was to characterize how the within-network connectivity profiles differ between groups. Interestingly, when we looked at the within-network connectivity in DS compared with TD controls, most regions showed similar within-network connectivity patterns; only the limbic network showed a nominally significant difference between the two groups. That is, although the inter-relationships between these distributed brain networks are abnormal in DS, such an abnormality must be interpreted within the context of seemingly intact within-network synchronization. When comparing WS with TD, however, the WS group showed elevated between-network connectivity, particularly in the DMN-frontoparietal network pair, as well as lower levels of within-network connectivity in the DMN, VAN, and somatomotor network. That is, in WS, the high levels of between-network connectivity appear in the context of reduced within-network connectivity, suggesting that a lack of differentiation between the DMN and other networks may be driving both observations. However, in DS, the within-network connectivity findings suggest that the increased synchrony between networks is not being driven by global dedifferentiation per se, as regions within each network appear to be co-activating in a typical way.
WS participants showed decreased connectivity in the DMN and the visual attention network, relative to controls and DS participants. Previous studies have shown that, compared with controls, people with WS have a higher ratio of frontal to posterior (parietal and occipital) lobe volume and cortical thickness, which specifically includes the PCC and inferior parietal cortex (Meda et al., 2012; Reiss et al., 2000, 2004). Abnormal corpus callosum morphology and shape have been implicated in the WS cognitive and behavioral phenotype (Sampaio et al., 2013). Such differences in integrity may influence inter-hemispheric connectivity in WS, driving our findings of reduced within network connectivity (i.e., across left and right parts of a single network) in this group compared with DS or TD. Decreased connectivity in the visual orientation network in WS may be related to decreased WM integrity previously observed in the inferior fronto-occipital fasciculus (Arlinghaus et al., 2011), which ipsilaterally connects the parietal, temporal, and occipital lobes to the frontal lobe. Decreased WM integrity in WS also has been identified in prefrontal-amygdala tracts and the uncinate fasciculus, the latter of which connects the amygdala to temporal gyri and the subcallosal region (Arlinghaus et al., 2011; Avery et al., 2012). These reports, while seemingly paradoxical to our findings of typical (or perhaps greater) connectivity within the limbic network, may together present a possibility for compensatory mechanisms. Our findings in the context of these previous reports of WM tract differences warrant future investigation, possibly with the use of a task-based neuroimaging approach that would disentangle the relationship between brain function and cognitive performance in WS.
One possible mechanism driving the increased connectivity observed between networks in DS, in the presence of typical within-network connections, is the unique dendritic arborization that has been characterized in DS. Becker et al. (1986) observed that infants with DS show increased dendritic arborization early in life, with more interconnections and greater average dendritic length when compared with controls (Becker et al., 1986). However, this increased arborization showed a steady decrease during early neural development, ultimately resulting in fewer connections and shorter dendrites. Similar findings have been observed in parietal and motor cortices (Kaufmann, 2000). One possible outcome of such abnormal neural development and pruning is that some of the longer, between-network connections may remain intact resulting in abnormal between-network co-activation after the networks have fully developed (Kaufmann, 2000). Less work on dendritic density has been performed in WS; however, other neurodevelopmental disorders, such as autism (Kelleher and Bear, 2008; Pardo and Eberhart, 2007; Walsh et al., 2008) and Rett syndrome (Ramocki and Zoghbi, 2008), are also characterized by altered dendritic arborization in early development (Jan and Jan, 2010).
A second possibility is that the increased network co-activation is due to some type of compensatory mechanism that is exhibited to some degree in all neurodevelopmental disorders but is perhaps particularly salient in DS where the neurodegenerative process associated with amyloid deposition may compound any neuronal injury. In support of such a possibility, DS subjects appear to show increases in glucose metabolism in regions vulnerable to AD pathology before the onset of clinical symptoms of dementia, and some of the genes over-expressed in DS may play a role in such a compensatory pathway (Head et al., 2007). However, it is difficult to know exactly how such compensatory brain activity would affect connectivity patterns. In addition, a relationship between the amount of between-network connectivity and cognitive performance was not observed in our DS cohort. Longitudinal studies tracking alterations in brain network architecture and cognitive decline will be needed to clarify whether the observed abnormal connectivity patterns are compensatory or a state characteristic of DS.
Exploratory analyses in DS
Our post hoc analyses focused on cognitive and genetic markers of dementia, because adults with DS account for approximately 60% of individuals with intellectual disabilities who exhibit signs of AD (Zigman et al., 2004). Postmortem studies have revealed that by 40 years of age nearly all individuals with DS have lesions present in the brain that meet the pathological criteria for AD (Mann, 1988) Therefore, we wanted to explore the relationship between rsFC patterns specific to DS and cognitive and genetic markers of AD, even though our effective sample size is clearly too low to draw conclusions at this point.
The DLD is often used to aid in the diagnosis of dementia in people with DS (Prasher, 1997; Shultz et al., 2004). No relationship between DLD-SOS score and any of the significant seven between-network pairs or for within-network connectivity was observed; however, there was a trend toward higher DLD-SOS scores (greater impairment) being associated with lower VAN and DAN within-network connectivity. While between-network connectivity differences are pervasive in DS, these were not significantly correlated with cognitive status or intellectual ability. However, more sensitive measures of cognitive function and a larger, more heterogeneous sample across the spectrum of cognitive impairment may be necessary to evaluate the association between connectivity and cognitive impairment in DS.
Finally, we evaluated the association between connectivity and APOE genotype. The APOE ɛ4 allele has been shown to increase risk for developing AD in both the DS (Coppus et al., 2008; Prasher et al., 2008; Rohn et al., 2014) and TD populations (Bertram and Tanzi, 2008; Corder et al., 1993; Liu et al., 2015). The observed ɛ4 carrier frequency was 5 out of 54 alleles, or 9%, which is similar to the frequency observed in the general population (13%) (Bertram and Tanzi, 2008; Corder et al., 1993; Liu et al., 2015). No significant difference between ɛ4 carriers and noncarriers was observed for any between-network pairs tested. However, ɛ4 carriers were shown to have decreased connectivity within the DAN compared with noncarriers. The validity and size of this effect would need to be confirmed in a larger sample. In summary, we did not find evidence that AD-related factors were responsible for the large differences in between-network connectivity observed in DS, compared with the WS and TD groups.
Strengths and weaknesses
The strengths of this study include our replication and extension of previous findings, showing between-network connectivity alterations in DS compared with TD controls (Anderson et al., 2013). Further, our results dissociate patterns in connectivity between and within established resting-state brain networks in DS. This study design included two informative contrast groups and allowed us to interpret our results within the larger framework of intellectual and development disabilities.
Many of the comparisons reported here have not been previously published, and it must be noted that, because the sample size for the DS group is small (although not dissimilar to that of other neuroimaging studies of neurodevelopmental disorders), it is possible that observed effects of the DS group in comparison to the WS and TD groups will not be replicated in an independent sample. In addition, while we used the very conservative Bonferroni approach to correct for the 21 different networks and network pairs tested, we did not also correct for having conducted these analyses for each pair of groups. For these reasons, many of the reported effects should be considered preliminary.
Other potential concerns are related to the quality and reliability of neuroimaging data and analysis methods. For example, noise from non-neuronal sources can drive spurious associations in studies of rsFC, particularly when recruiting participant groups with developmental disabilities or other cognitive or affective disorders. Artifacts related to head motion during data acquisition have been shown to significantly influence intrinsic functional connectivity measurements (Satterthwaite et al., 2012; Van Dijk et al., 2012); therefore, we took care to account for such issues by performing rigorous corrections for subject motion, including initial motion correction during preprocessing and additional artifact and motion regression using the ART toolbox. However, even with such corrections in place, it remains possible that subtle differences in motion or other confounding factors such as respiration may have had some contribution to the observed differences in functional connectivity. That we replicated previous results that were performed using different corrections for motion would suggest that any such confounds are at least consistent across connectivity studies in DS patients.
It has been consistently reported that the brains of DS individuals show reduced intracranial volume relative to TD individuals (Aylward et al., 1999; Kesslak et al., 1994; Raz et al., 1995). Therefore, it is possible that volumetric differences could be driving our findings. However, there is no reason to expect that such differences would have an effect on between-network connectivity without having any effect on within-network connectivity; thus, the dissociation in this article would suggest that such volumetric differences are not driving the observed result.
Finally, there was a large age difference in our WS group compared with our DS and TD groups, in that our WS group was much younger. Given the known associations between age and functional connectivity, particularly in the DMN (Damoiseaux et al., 2008), it is possible that such age differences could have biased our results. We aimed at addressing this question by repeating our between-network and within-network analyses after restricting the TD age range to more closely match that of both the DS and WS groups and also by conducting regression analyses while controlling for age as a covariate. Our results suggest that while age is certainly related to connectivity, this relationship was similar enough between groups such that it could not be deemed responsible for the majority of between-group effects observed in this study. Future work should expand recruitment to adults across the life span for all groups to confirm these results.
Conclusions
This study sought to characterize the pattern of rsFC in individuals with DS relative to WS and TD. Our results replicate previous findings (Anderson et al., 2013) of higher levels of between-network connectivity in DS compared with TD and also provide evidence for preserved within-network connectivity in DS. In summary, these findings suggest that altered between-network connectivity, particularly in the DMN, may be characteristic of a number of neurodevelopmental disorders involving intellectual disability, including DS and WS, and that perhaps within-network connectivity is a feature that shows more variable patterns across different neurodevelopmental disorders.
Footnotes
Acknowledgments
The authors would like to thank all the study volunteers for their time and willingness to participate in this research. They are grateful to the sponsors of the Williams Syndrome Music Camp, including the Vanderbilt Kennedy Center for Research on Human Development, the Academy of Country Music's Lifting Lives program, and the Vanderbilt Blair School of Music. They would also like to thank and acknowledge the research staff of the Williams Syndrome Music Camp, including Elizabeth Roof, Research Coordinator and the MRI technologists in the Vanderbilt University Institute of Imaging Science, including Dave Pennell, Leslie McIntosh, Kristen George-Durrett, and Donna Butler, for their expertise, professionalism, and wonderful manner of dealing with participants.
This research was supported in large part by a Vanderbilt Kennedy Center Hobbs Discovery Grant (to T.A.T.W.), the Recruitment for Genetic Aging Research (P30 AG036445 to T.A.T.W.), the Training Program on Genetic Variation and Human Phenotypes Training Grant (5T32 GM080178-06 to J.N.V.), the Vanderbilt Brain Institute Clinical Neuroscience Scholars Program (to J.N.V.), the Vanderbilt/National Institute of Mental Health Neurogenomics Training grant (T32 MH65215 to T.J.H.), a PhRMA Foundation Postdoctoral fellowship in Translational Medicine and Therapeutics (to T.J.H.), and a National Center for Advancing Translational Sciences award (Vanderbilt CTSA Grant 2UL1TR000445 VR#5003.1 to J.R.P.). The funders had no role in study design, data collection and analysis, decision to publish, or preparation of this article. Its contents are solely the responsibility of the authors and do not necessarily represent official views of the National Center for Advancing Translational Sciences or the National Institutes of Health.
Author Disclosure Statement
No competing financial interests exist.
References
Supplementary Material
Please find the following supplemental material available below.
For Open Access articles published under a Creative Commons License, all supplemental material carries the same license as the article it is associated with.
For non-Open Access articles published, all supplemental material carries a non-exclusive license, and permission requests for re-use of supplemental material or any part of supplemental material shall be sent directly to the copyright owner as specified in the copyright notice associated with the article.
