
Abstract
A definitive diagnosis of mild traumatic brain injury (mTBI) is difficult due to the absence of biomarkers in standard clinical imaging. The brain is a complex network of interconnected neurons and subtle changes can modulate key networks of cognitive function. The resting state default mode network (DMN) has been shown to be sensitive to changes induced by pathology. This study seeks to determine whether quantitative measures of the DMN are sensitive in distinguishing mTBI subjects. Resting state functional magnetic resonance imaging data were obtained for healthy (n=12) and mTBI subjects (n=15). DMN maps were computed using dual-regression Independent Component Analysis (ICA). A goodness-of-fit (GOF) index was calculated to assess the degree of spatial specificity and sensitivity between healthy controls and mTBI subjects. DMN regions and neuropsychological assessments were examined to identify potential relationships. The resting state DMN maps indicate an increase in spatial coactivity in mTBI subjects within key regions of the DMN. Significant coactivity within the cerebellum and supplementary motor areas of mTBI subjects were also observed. This has not been previously reported in seed-based resting state network analysis. The GOF suggested the presence of high variability within the mTBI subject group, with poor sensitivity and specificity. The neuropsychological data showed correlations between areas of coactivity within the resting state network in the brain with a number of measures of emotion and cognitive functioning. The poor performance of the GOF highlights the key challenge associated with mTBI injury: the high variability in injury mechanisms and subsequent recovery. However, the quantification of the DMN using dual-regression ICA has potential to distinguish mTBI from healthy subjects, and provide information on the relationship of aspects of cognitive and emotional functioning with their potential neural correlates.
Introduction
Mild traumatic brain injury (mTBI) is a prevalent pathology, with up to 1.5 million cases annually reported in the civilian population (Faul et al., 2010; Gerberding, 2003). The recent conflicts in Iraq and Afghanistan have resulted in an estimated 360,000 service members who suffer from traumatic brain injury (TBI), of which ∼89% are classified as mild (Faul et al., 2010; MacGregor et al., 2011; Zoroya, 2009). TBI has been referred to as the “signature injury” of Operation Enduring Freedom (OEF) and Operation Iraqi Freedom (OIF), largely due to the vast number of injuries resulting from improvised explosive devices (Hoge et al., 2008). A key challenge in the diagnosis of mTBI is the absence of biomarkers within standard clinical imaging modalities (computed tomography and magnetic resonance imaging [MRI]) (De Kruijk et al., 2001; Ruff, 2005). Furthermore, the inhomogeneous nature of mTBI severity and location combined with the variable and transient nature of mTBI effects serve to increase the complexity of diagnosis and treatment (Hoge et al., 2008; Kushner, 1998). Current assessment of TBI heavily relies on behavioral observations such as the Glasgow Coma Scale (GCS) and on patient recall of events such as post-traumatic amnesia (PTA) and loss of consciousness (LOC) (Borg et al., 2004; Kushner, 1998).
While most mTBI symptoms are known to be transient and generally resolve within the first few months of injury (Carroll et al., 2004; Silver et al., 2005; Vanderploeg et al., 2005), for some individuals, symptoms may persist significantly longer (Iverson et al., 2006; Vanderploeg et al., 2005). In the military population, recovery may be complicated by a number of factors including pain (Lew et al., 2009), stress or emotional distress (Belanger et al., 2010; Hoge et al., 2008), and extracranial injuries or sensory difficulties (French, 2010). One recent military study (Macgregor et al., 2013) found persistent health problems in those with mTBI including headache, back pain, memory problems, and dizziness compared to those with nonhead injuries, even when controlling for stress symptoms.
It has been argued that there is a need for more definitive indicators that look further than these classical behavioral observations and provide consistent and in-depth diagnosis (Borg et al., 2004; Kushner, 1998). A functional network in the brain represents several regions that are connected and information is relayed between them. One of the most studied “resting state” brain networks (Fox and Raichle, 2007) is the default mode network (DMN) (Beckmann et al., 2005; Damoiseaux et al., 2006; Raichle et al., 2001). The DMN is important as it has been found to correlate with cortical networks that are involved with cognition, alertness, perception, and memory (Buckner et al., 2008). During conscious and purposeful tasks, coactivity of the DMN is observed to “deactivate.” Once the person returns to a “resting” state absent of explicit tasks, the DMN coactivity re-emerges. This consistency in coactivity and “deactivation” of functional connectivity within the DMN in healthy subjects gives the DMN its value in being able to distinguish several cognitive pathologies such as attention deficit hyperactive disorder (ADHD), schizophrenia, and Alzheimer's disease (Koch et al., 2012; Uddin et al., 2008; Whitfield-Gabrieli et al., 2009). The resting state task was 6 min long and subjects lay supine in the scanner with their eyes closed. The conditions of eyes open, eyes closed, or eyes fixated to a point all have similar brain patters across the DMN (Marx, 2004; Yan et al., 2009). However, the eyes open and eyes open with a fixation point were reported to produce increased functional connectivity within the DMN, potentially from nonspecific visual information processing, distractions from eyes wandering around the screen or room, or “day dreaming” (Yan et al., 2009). Conversely, another study reported a decrease in activity during eyes open paradigms primarily in the visual cortex, resting state visual and sensory networks (Marx et al., 2004). We choose to use the eyes closed paradigm for consistency, to reduce distractions and potential eye strain from fixating on a point for the entire duration of the 6 min scan.
There are several functional imaging studies that have examined the DMN in mTBI subjects (Mayer et al., 2011; Tang et al., 2011). Most of the published studies used seed-based correlation analysis to determine functional connectivity. This approach is not without its limitations, including the process of selecting seed regions, consistency of the seed regions of interest between subjects, and the assumption that the time course of seed voxels are an accurate representation of other voxels within regions of the functional network (Beckmann et al., 2005; Damoiseaux et al., 2006; Van de Ven et al., 2004). Such assumptions are arbitrary and could be biased by various sources of indeterminate noise in the MRI scanner (Beckmann et al., 2005; Damoiseaux et al., 2006; Van de Ven et al., 2004). Furthermore, the seed methods are not able to account for time course composites within the blood-oxygen level-dependent (BOLD) signal and may “detect” artificial correlations (false positive) or conversely disregard important relationships between multiple voxels or other relevant patterns of coactivity (false negative) (Beckmann et al., 2005; Damoiseaux et al., 2006; Van de Ven et al., 2004).
The goal of this exploratory study is to understand how functional connectivity of the resting state DMN varies between healthy controls and mTBI subjects. The multivariate data-driven approach using Independent Component Analysis (ICA) provides an unbiased means for exploratory data analysis (Hyvärinen et al., 2001). The first objective of this study is to ascertain whether a data-driven approach for exploratory analysis would enhance the understanding of DMN activity in an mTBI population. The second objective is to explore whether neural correlates of behavior are present with DMN connectivity, by examining the relationship between functional connectivity of the DMN with neuropsychological assessments.
Materials and Methods
Subjects
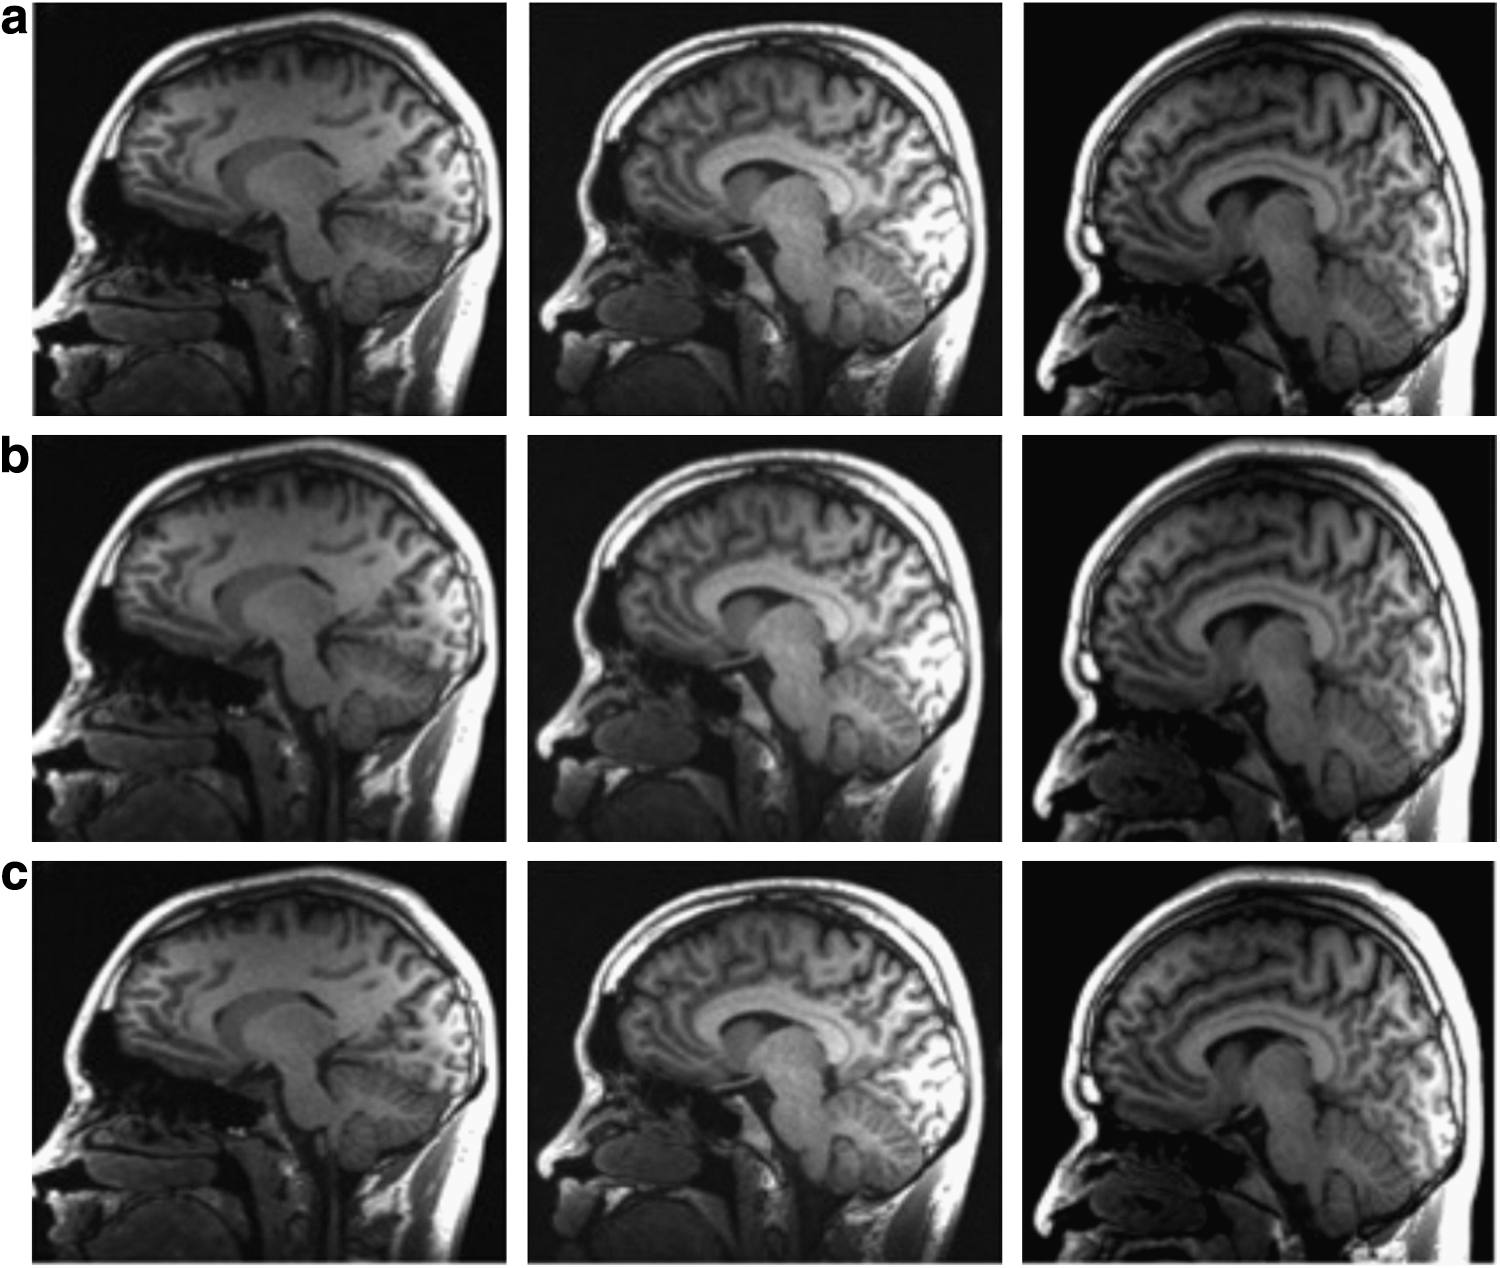
Active duty male and female subjects who were between the ages of 18 to 60 years were recruited for this study. A total of 15 active duty male subjects (age=25.6±4.4 years) who had been medically evacuated from Afghanistan or Iraq and were clinically diagnosed with mTBI participated in this study. Inclusion criteria for the TBI group stipulated a single injury; clinically categorized as mTBI; no clinical diagnosis of post-traumatic stress disorder (PTSD); and no previous diagnosis of neurological or psychiatric disorders. The mTBI subjects were excluded if they were unable to consent themselves, were actively enrolled in other randomized controlled treatment trials, and were pregnant or breast feeding. These subjects were selected from a larger group of 48 subjects. Of these 48 subjects, four were excluded as they had multiple TBI injuries, 10 were excluded as they were later classified as having either moderate or severe TBI and the remainder (19 subjects) who were classified as mild were excluded due to failure to complete all the prescribed neuropsychological tests. On the day of the scan, the mTBI subjects were screened for prescribed medications and the results reported in Table 1. The control subjects consisted of 12 individuals (M=9, F=3, age=26.4±5.8 years) from a group of 15 subjects who were active duty service members and selected to age-match the mTBI subjects. Three of the control subjects were excluded from the study due to excessive head motion during the functional magnetic resonance imaging (fMRI) scan. The control subjects were screened prior to the study to ensure that they did not have a previous diagnosis of neurological or psychiatric disorders, head injuries, neurological insults or TBI, and were not currently pregnant or breast feeding. All subjects were determined to be right handed. The MRI anatomical data were examined for anatomical anomalies and injuries by a licensed clinical neuroradiologist and the results reported in Table 2. For each mTBI subject with documented anomalies or injuries from the clinician's report, a representative anatomical image is shown in Figure 1a–c. All subjects gave written informed consent to participate in the study, which was approved by the Institutional Review Board of the Walter Reed Army Medical Center (WRAMC). The mTBI subjects were also screened for symptoms prior to the scan and the results reported in Table 3.
List of Medications Prescribed the Day of Brain Imaging Scan
Anatomical Magnetic Resonance Imaging Report for Mild Traumatic Brain Injury Subjects
mTBI, mild traumatic brain injury.
Symptoms for Mild Traumatic Brain Injury Subjects
MRI, magnetic resonance imaging.
Diagnosis of TBI was based on a routine comprehensive clinical screening evaluation undertaken by medical/healthcare professionals at WRAMC for patients admitted to the hospital after medical evacuation, and follow standard Department of Defense and Department of Veterans Affairs definition of TBI. For the purposes of this study, classification of brain injury severity was primarily based on duration of LOC and duration of PTA. GCS scores are often not available shortly after combat-related injuries and were not uniformly available for use. mTBI severity was defined as PTA <24 h and LOC <15 min. The mTBI subjects recruited for this study had an average of 147.21±87.19 days since injury with a range of 2 to 10 months postinjury. There were two subjects who did not experience PTA, two subjects with PTA from 1 to 15 min, and the other 11 subjects had PTA of less than 1 min. Of the 15 subjects, three of them did not experience LOC and one of them had an LOC from 1 to 15 min. The other 11 subjects had an LOC that was less than a minute.
Clinical assessment
A battery of neuropsychological tests was administered to the mTBI subjects to assess neuropsychological symptoms and neurocognitive function. These tests were the Verbal Fluency subtest from the Delis-Kaplan Executive Function System (DKEFS), the Conners' Continuous Performance Test (CPT), the California Verbal Learning Test-Second Edition (CVLT II), selected subtests from the Wechsler Adult Intelligence Scale-III (WAIS-III), the Wechsler Test of Adult Reading (WTAR), the Automated Neuropsychological Assessment Metrics (ANAM), the Personality Assessment Inventory (PAI), the 36-Item Short Form Health Survey (SF36), the Neurobehavioral Symptom Inventory (NBSI), the PTSD Check List-Civilian Version (PCL-C), and the Test of Memory Malingering. These assessments were administered by trained psychometrists who were familiar with the study's objectives.
MRI data acquisition
Images were acquired on a 3 T MRI scanner (GE Healthcare, Waukesha, WI) with a 32-channel phased array head coil (MR Instruments, Inc. Minnetonka, MI). The data used in this article were from the T1-weighted structural scans of the entire brain (3D BRAVO sequence: repetition time/echo time (TR/TE)=6.7/2.5 msec, FA=12°, Resolution=1.0×1.0×1.2 mm) and the fMRI resting state task (echo planar imaging pulse sequence, sagittal plane, TE/TR=25/2000 msec, FA=60°, in plane resolution=3.75×3.75×4 mm, matrix size 64×64, and field of view 240×240). No survey was conducted prior to or after the 6-min task-free scan to assess the mental or emotional state of subjects. The DMN fMRI scan was acquired at the beginning of a longer MRI acquisition protocol that involved other fMRI tasks and anatomic scans that did not require subject interaction. For all subjects, the acquisition protocol was identical with the same scans being acquired and in the same order. Therefore, all subjects experienced the same conditions within the last 30 min prior to the resting state scan.
Data analysis
The Analysis of Functional Neuroimages (AFNI) software package (Cox, 1996) was used to perform three-dimensional volume registrations to correct head movement using the middle volume of the resting state series. AFNI was also used to perform temporal interpolation to correct slice time acquisition differences (Cox, 1996). The first 3 time points were discarded to account for magnetization steady state, thereby removing the T1 contrast. The data sets were then transformed into Neuroimaging Informatics Technology Initiative (NIfTI) format and registered to the Montreal Neurorological Institute (MNI) 152 template (Grabner et al., 2006) using a 12 degree-of-freedom linear fit using the FMRIB Software Library (FSL) package (Smith et al., 2004; Woolrich et al., 2009). The MELODIC (Multivariate Exploratory Linear Decomposition into Independent Components) tool in the FSL software package was used for group level temporal concatenated ICA (Beckmann and Smith, 2004; Smith et al., 2004; Woolrich et al., 2009). The group level analysis consisted of combining both healthy controls and mTBI subjects. The first step in the analysis consisted of high pass filtering at 0.01 Hz and masking out all nonbrain voxels. Following this, voxel-wise de-meaning and normalization of the voxel-wise variance was performed, with subsequent whitening of the data sets. The group data set was decomposed into 25 independent components, as determined using Principle Component Analysis (PCA) estimates from Eigenspectrum analysis. The intensity of the component maps were normalized by dividing by the standard deviation of the residual (Beckmann and Smith, 2004). ICA separates temporally independent signals that are linearly mixed through maximization of mutual independence among elements of the data set (Hyvärinen et al., 2001). This is a multivariate data-driven approach with nonparametric association and without a priori assumption that can be viewed as an unbiased means for exploratory data analysis (Hyvärinen et al., 2001). A key challenge of ICA group analysis is to identify the independent components and then to relate them to individual subject spatial and temporal maps. A method that has been determined to be reliable for exploratory resting state fMRI data analysis is the dual-regression ICA approach (Beckmann et al., 2009; Zou et al., 2010). Dual-regression ICA uses multiple linear regression to estimate spatial and temporal interactions at the subject level and hinges upon regression that is performed against the original data. Using the results from the dual-regression ICA, the DMN was identified based on a template from the literature (Beckmann et al., 2005; Greicius et al., 2009).
To compare differences in functional connectivity of the resting state DMN between mTBI and healthy controls, two additional analyses were performed. The first analysis identified differences in functional connectivity between brain regions of control and mTBI groups. Each individual subject's Z-statistic spatial map was resampled to a 2 mm3 voxel size, then spatially smoothed using a Gaussian blur with a full width half maximum of 4 mm. Subsequently, voxel-wise t-tests were calculated. The initial statistical maps were threshold using parametric and spatial thresholds as determined by 10,000 Monte Carlo simulations (Cox, 1996; Forman et al., 1995). The final group maps were thresholded using a corrected p-value<0.05 and a cluster size greater than 260 voxels (8 mm3 each).
The goal of the second analysis was to compare the entire DMN between the TBI and control populations. A goodness-of-fit (GOF) index was calculated for each individual subject. The GOF index is defined as the difference between the mean z-score of all voxels within the DMN mask compared with the mean Z-score of all voxels outside the mask (Petrella et al., 2011). To calculate the individual subject GOF index, the corrected group map of the healthy subjects was used as a template to assess how well the healthy and mTBI subjects matched the DMN map. Using this corrected group map, a binary mask was generated for significant correlations in the DMN and a second mask was generated as an inverse version for regions that were not correlated, or outside of the DMN. These group-based binary masks were subsequently overlaid on each individual subject's DMN map. The individual subject maps were threshold using a Z-statistic of 3.498, a corrected p<0.005, and a cluster size of 50 voxels (8 mm3 each). The Z-statistics from voxels that survived the threshold were used to calculate the GOF index for each individual subject. An independent samples t-test and analysis of variance (ANOVA) with a significance level of p<0.05 were performed using Statistical Package for the Social Sciences (SPSS; IBM Corp., Armonk, NY) to determine whether the group means were statistically different. The Kolmogrov–Smirnov test was used as a confirmatory test due to the nonparametric nature of the data. A scattergram of the individual subject data was plotted and a cutoff point using the mean of the healthy control group with three standard errors of the mean was used as a threshold to provide optimal sensitivity and specificity in contrasting both groups.
A final analysis explored the relationship between DMN and behavioral correlates. Partial linear regression analysis was calculated using SPSS to determine whether relationships exist between clinical assessments with the spatial regions of coactivity in the DMN. Anatomical masks were generated using the Harvard cortical, Harvard subcortical, and probabilistic cerebellar atlases (Desikan et al., 2006; Diedrichsen et al., 2009). Using these anatomical masks, voxels within statistically significant clusters from the individual subject corrected masks were extracted. The time of injury and age for each individual subject were regressed out and Pearson's correlation was calculated for each region of the DMN, GOF index, and neuropsychological data. The results were thresholded using R 2≥± 0.70, and p<0.005.
Results
Part 1: spatial differences in DMN maps comparing controls and mTBI subjects
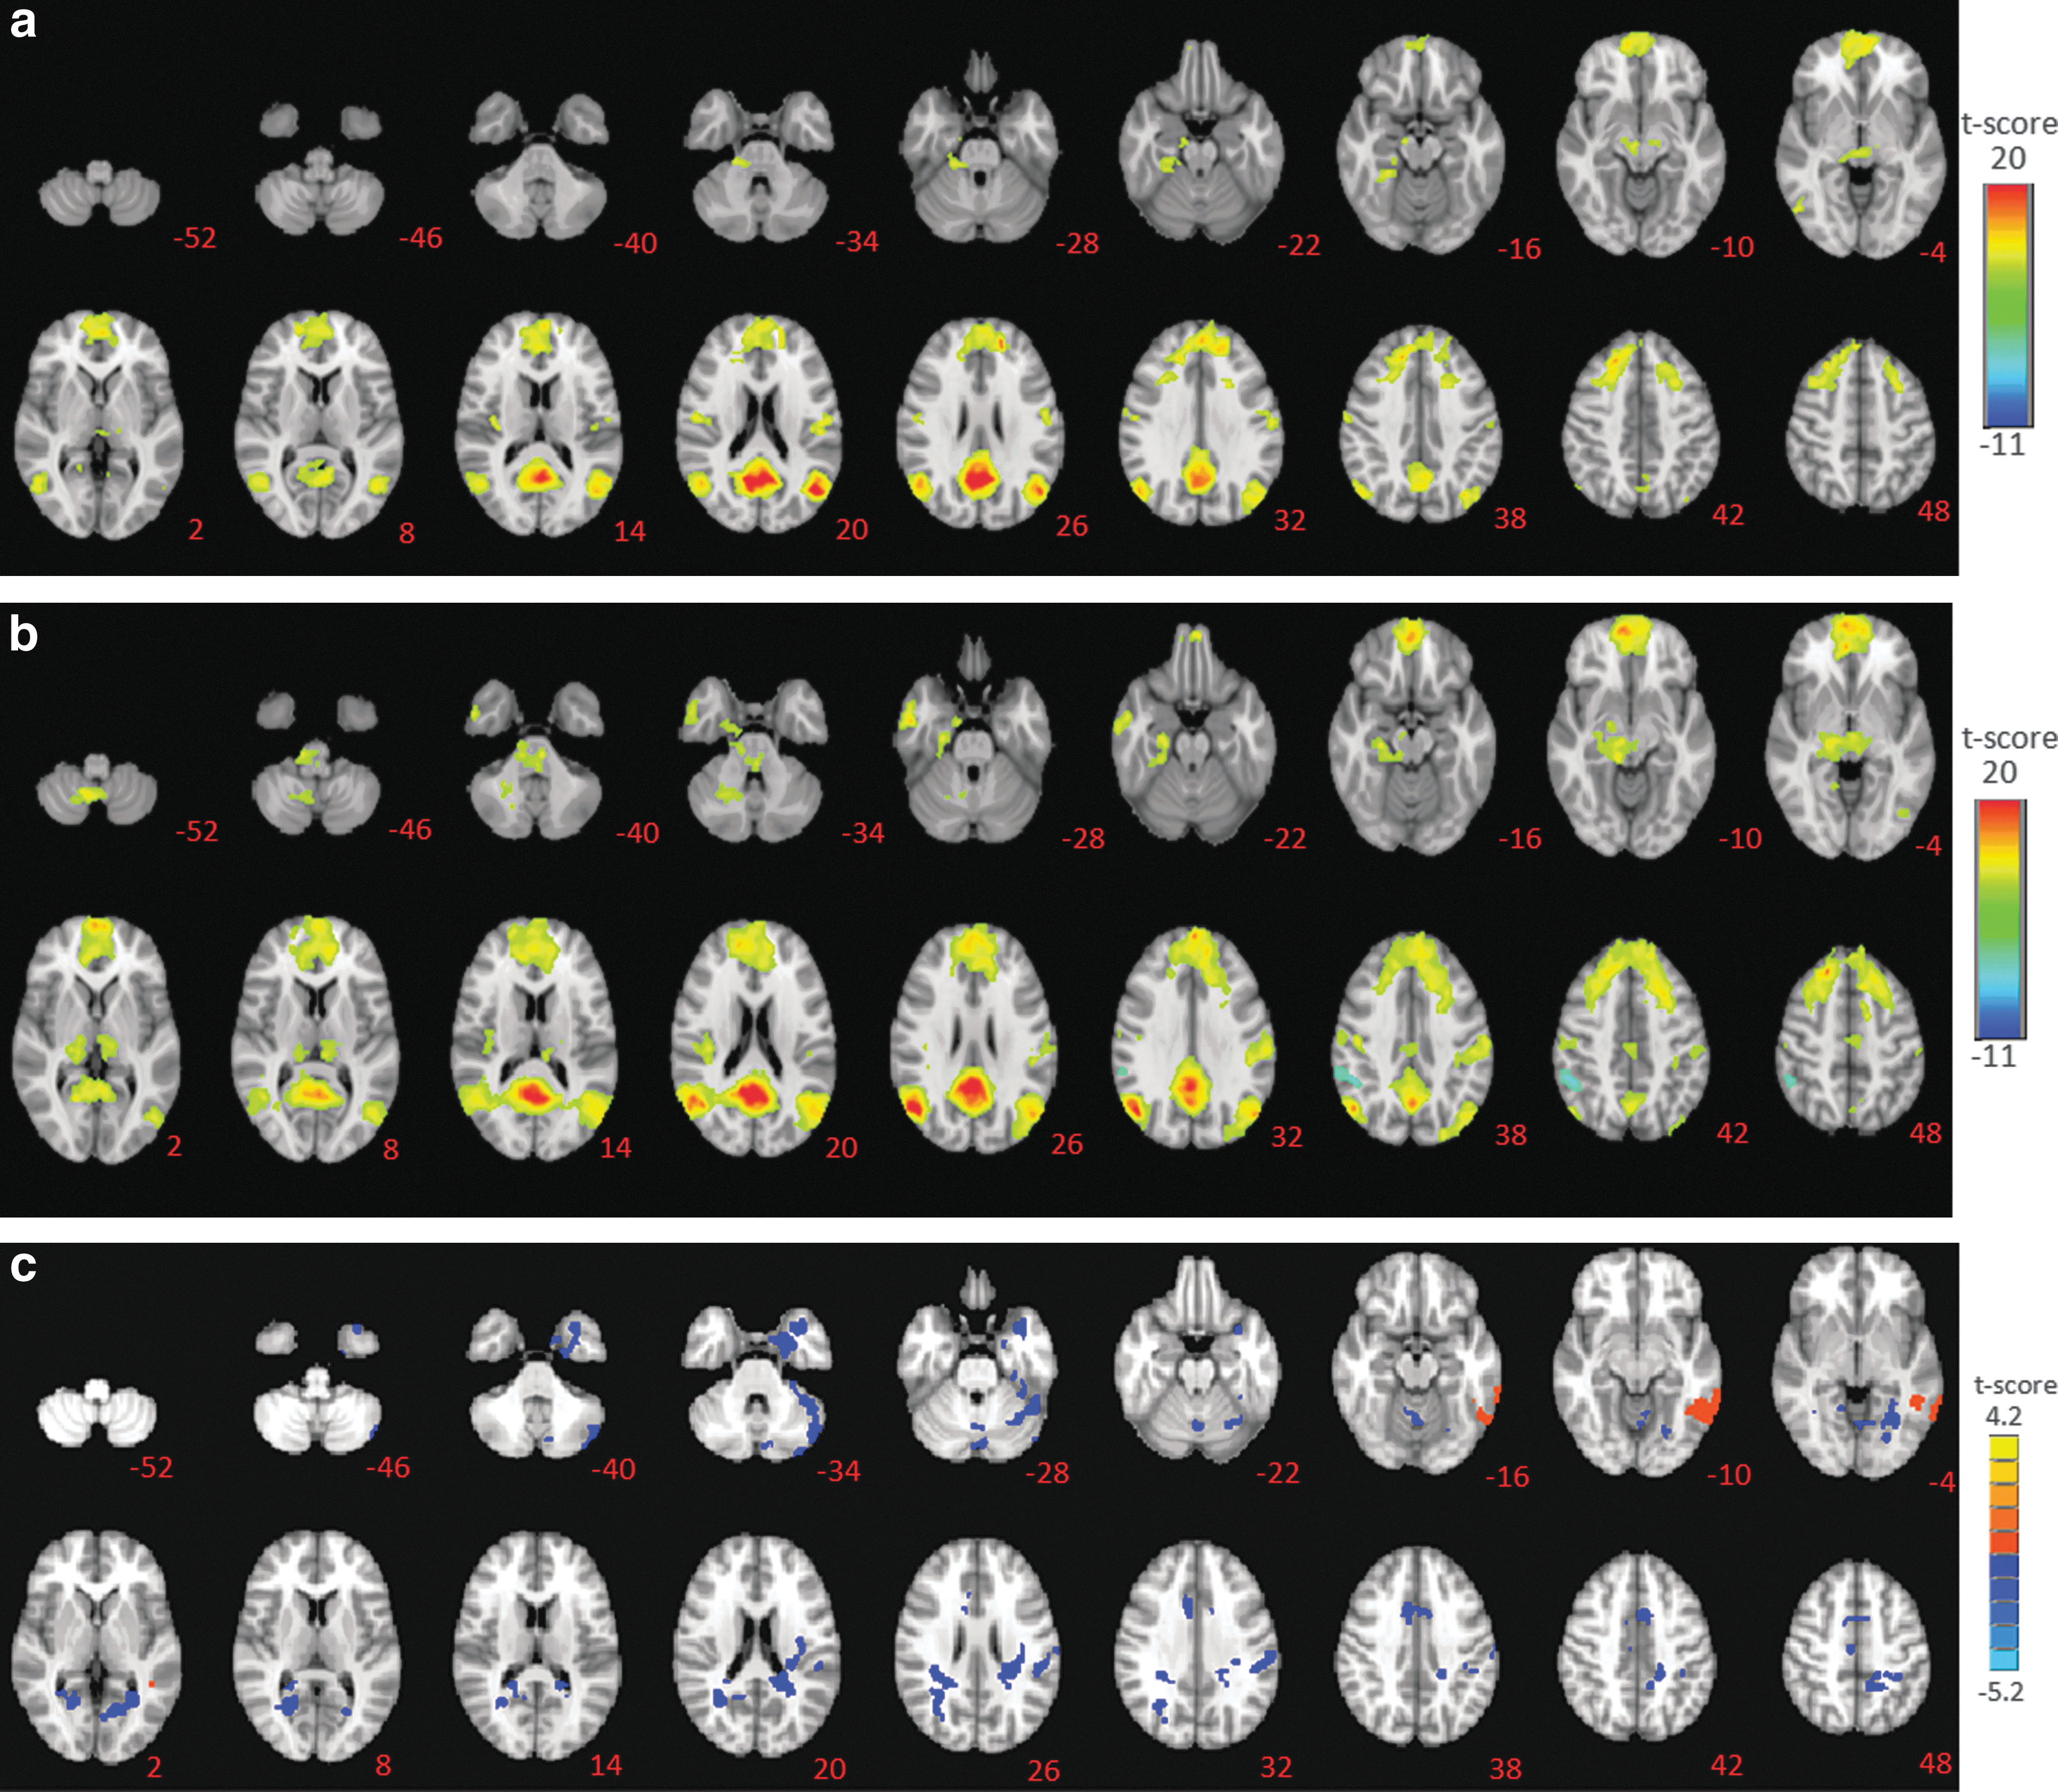
The goal of the first analysis was to explore differences in spatial information between controls and mTBI groups. The results presented in Table 4 suggest that the mTBI subjects had a decrease in DMN connectivity within regions of the left inferior temporal gyrus, right precentral gyrus, and left caudate. In addition, there was a significant decrease in connectivity within the right inferior parietal lobule in the DMN network of the mTBI subjects. However, when compared with the controls, the mTBI group exhibited increased resting state spatial connectivity within the DMN in which there were several significant clusters in the left and right posterior cingulate, and temporal regions. Furthermore, the left cerebellum lobule VII and the right supplementary motor area (SMA) in the mTBI subject group had significantly higher connectivity. The cerebellum and SMA are regions that are not typically associated with the resting state task and the DMN.
Comparison of Default Mode Network Spatial Information Between Controls and Mild Traumatic Brain Injury Groups
SMA, supplementary motor area.
Figure 2a shows the DMN connectivity for the control group, and Figure 2b shows the connectivity for the mTBI group. The differences between the healthy and control groups as calculated using a voxel-wise t-test are shown in Figure 2c.
Part 2: GOF index analysis
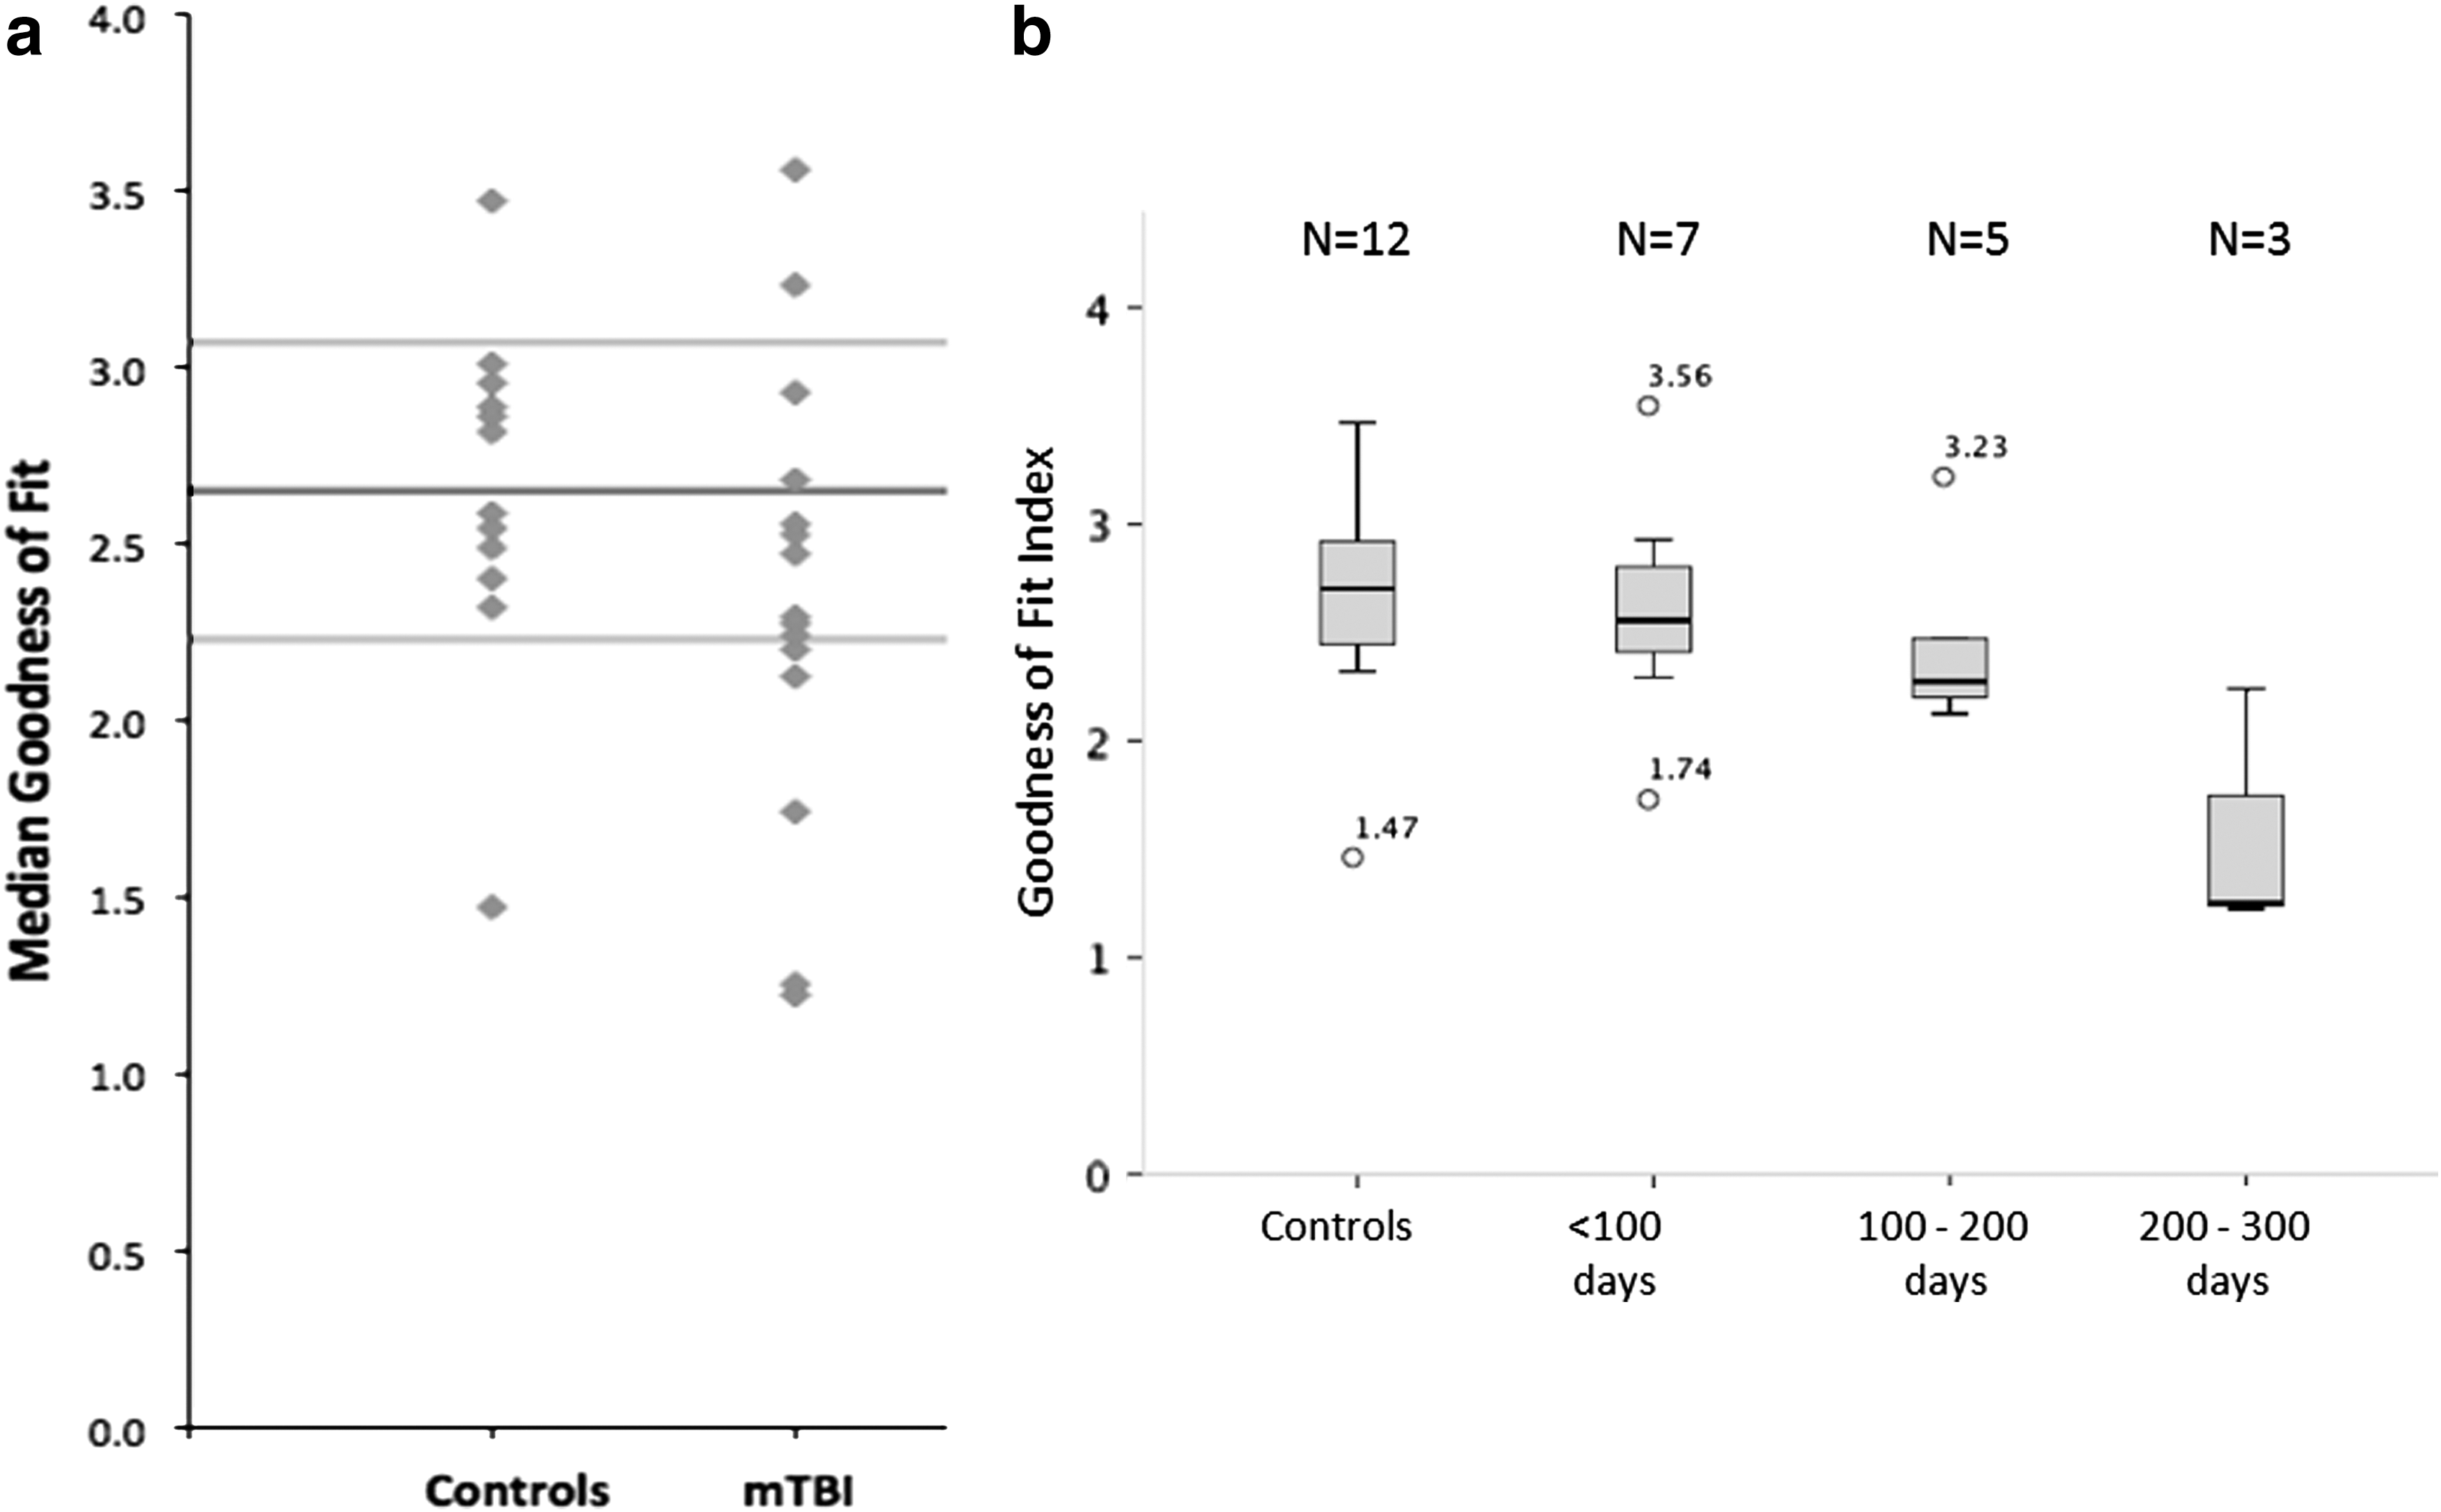
The GOF index (Petrella et al., 2011) was calculated to explore the feasibility of obtaining an objective measure to distinguish between mTBI and control subjects. Figure 3a shows the median GOF index. The ANOVA analysis failed to show a significant difference between the two groups (F=1.769, df=25, p=1.906), and subsequently the comparison of means using the t-test suggests that the groups were not significantly different (F=0.604, df=25, p=0.44) for this measure. The post hoc analysis using the Kolmogorov–Smirnov test supports the t-test finding (p=0.134). The sensitivity and specificity of the data set were calculated to be 0.65 and 0.60 respectively. Further analysis of the effect of time since injury revealed a trend in which the GOF index decreased with increasing time since injury as shown in Figure 3b. A preliminary analysis using a univariate ANOVA suggested significant difference in the GOF measures for subjects for time since injury (F=3.778, df=26, p<0.024, corrected). The pair-wise comparisons using the Sidak test suggests that mTBI subjects in the range of 200–300 days since injury were significantly different from controls (p<0.02) and were also significantly different from mTBI subjects in the range of 100–200 days (p<0.042). However, with the small sample size, it is difficult to generalize these results and more testing is needed.
Part 3: clinical neuropsychological assessments and analysis of neuropsychological assessment correlations
All subjects showed adequate engagement and effort as measured by the Test of Medical Malingering (TOMM) assessment and were considered to have produced valid results. In addition, the mean scores from the PCL-C assessment and its subclusters are summarized in Table 5, as are selected results from the neurocognitive evaluation. The mean score on the PCL, while suggestive of stress symptoms, fell below suggested cutoff scores for PTSD (Wilkins et al., 2011).
Neuropsychological Assessments Summary for Mild Traumatic Brain Injury Subjects Only
CVLT II, California Verbal Learning Test-Second Edition; DKEFS, Delis-Kaplan Executive Function System; PCL-C, Post Traumatic Stress Disorder Check List-Civilian Version; WAIS-III, Wechsler Adult Intelligence Scale-III; WTAR, Wechsler Test of Adult Reading.
Significant correlations (R 2≥± 0.70, p<0.005) were observed between a variety of neuropsychological test measures and data from the DMN connectivity maps of mTBI subjects in cerebellar and cortical regions as presented in Table 6. These test measures included reaction times on sustained attention measures; speed of processing measures verbal generativity and switching; and emotional manifestations of mood change, irritability, and anxiety. The partial correlation analysis also suggests that the GOF measure was positively correlated (R 2=0.799, p<0.001) with the DKEFS Verbal Fluency—letter versus category—contrast standard score. All of these correlation analyses were performed with the time since injury and age for each individual subject regressed out.
Comparison of Correlations Between Region-of-Interest Spatial Information with Neuropsychological Measures
ANAM, Automated Neuropsychological Assessment Metrics; CPT, Conners' Continuous Performance Test; PAI, Personality Assessment Inventory.
Discussion
The first objective of this study was to explore the variations in functional connectivity within the DMN network between healthy controls and mTBI subjects, using a data-driven approach. The second objective was to investigate whether neural correlates of behavior are present within the DMN by examining the relationship between functional connectivity of the DMN and neuropsychological assessments. The results suggest that in the subset of mTBI subjects analyzed for this article, there is an increase of functional connectivity present in regions of the resting state DMN. In addition, the SMA, portions of the right cerebellum (right cerebellar inferior semi-lunar lobule, right Culmen, and right cerebellar tonsil) were observed to have significantly increased functional connectivity. These regions are not traditionally associated with the DMNs obtained using seed-based analysis. Furthermore, abnormal functional connectivity within these regions has not been previously reported in resting state fMRI pertaining to the DMN in mTBI subjects (Mayer et al., 2011; Tang et al., 2011). However, in an extensive study comparing multiple resting state networks, Stevens et al. (2012) reported the presence of enhanced functional connectivity in the right posterior cerebellum declive in the visual and fronto-striatal resting state networks, respectively. The cerebellar regions reported by Stevens et al. (2012) are different from those reported in this study, nevertheless these cerebellar regions are located adjacent to each other in the same hemisphere as shown in Figure 2b, and share common connections (Snell, 2009).
Our results suggest that the GOF index is not sufficiently sensitive to clearly distinguish mTBI from control subjects within this subset of mTBI subjects, probably due to the small sample size, and also in general the large variability in the mTBI subject group. Injury severity, location, and mechanism may influence DMN connectivity of the brain and increase inter subject variability. When comparing the subjects based on time since injury as shown in Figure 3b, a decrease in the GOF index measure with respect to increased time since injury was observed. These differences could imply the presence of cortical reorganization, however, the impact on recovery or the formation of chronic impairments is not clear, and this trend warrants more research with a larger sample size; and exploration across other resting state brain networks. Imaging modalities such as diffusion tensor imaging or susceptibility weighted imaging could compliment the DMN data and add benefit to elucidate the underlying white matter structure and connectivity. The data (Fig. 2b) show these abnormal increases in functional connectivity of the DMN within the mTBI population, especially in the left and right temporal regions, which are correlated with depression, aggressive behaviors, and stress-related symptoms, as measured by assessments such as the PAI and PCL-C. The results support the notion of abnormal emotional responses as the result of mTBI injury as reported in the literature (Brenner et al., 2009; Rutherford and Corrigan, 2009). The medial temporal lobes are involved with episodic memory processing, and have a prominent role in processing higher-level visual information (Gabrieli et al., 1997; Squire et al., 2004). Increased functional connectivity of the DMN in the temporal lobes is believed to reflect increased effort to suppress unwanted thoughts, and to increase concentration, or conversely an increased effort to relax, even at rest in the absence of explicit stimuli (Greicius et al., 2007; Sheline et al., 2009). Increases in connectivity in the right frontal gyrus as seen in Figure 2b are likely to impact cognitive processes involving self-awareness, impulse control, and inhibition of actions (Chikazoe et al., 2007; Johnson et al., 2013).
Furthermore, the abnormal functional connectivity in the anterior cingulate cortex could reflect limitations with attention, learning, motivation, and modulation of emotions (Devinsky et al., 1995; Lane et al., 1998). Abnormal coactivity of the DMN has the potential to affect proper regulation of emotions and attention as seen from the correlation analysis in Table 5 for the measures of PAI, PCL-C, and SF36 scores; it is supported by literature (Devinsky et al., 1995; Forman et al., 1995; Squire et al., 2004). The high correspondence between functional imaging data and neuropsychological measures using the data-driven approach of analysis is unique compared to current mTBI research that have provided limited comparisons (Mayer et al., 2011; Stevens et al., 2012). It is unclear how abnormal functional connectivity in the DMN of mTBI subjects translates to direct cognitive or behavioral impairments as the specific behavioral correlates of the DMN are not clearly defined at this moment (Greicius et al., 2009; Raichle et al., 2001). However, it has been proposed that the DMN represents a state of consciousness in which an individual is awake and alert, but not actively engaged in any cognitive or functional tasks (Beckmann et al., 2005; Damoiseaux et al., 2006; Fox and Raichle, 2007; Raichle et al., 2001). Abnormal functional connectivity within the DMN has the potential to affect proper regulation of emotions and attention (Mazoyera et al., 2001; Petrella et al., 2011; Sheline et al., 2009), and could be an indicator of inappropriate information processing within and between brain regions, further suggesting a compromised functional brain network. The results from the correlation analysis in Table 5 for the measures of PAI, PCL-C, and SF36 scores suggest a relationship between DMN functional connectivity and cognitive function in the mTBI subject population analyzed.
In addition, the data presented in Table 5 suggest potential deficits in verbal learning and memory as measured by the CVLT II, reaction time, and sustained attention as measured by the ANAM, CPT, and verbal generativity and mental switching as measured by the DKEFS verbal fluency scores. The DMN has been observed to deregulate during the active performance of a task, based on the amount of effort needed (Buckner et al., 2008; Greicius et al., 2009). In our data, we observe an abnormal DMN map with mostly an increase in the functional connectivity in the majority of regions in the mTBI group, except for three brain regions of the left inferior temporal gyrus, right precentral gyrus, and left caudate. The correlation with markers of emotional response within the cerebellum is a novel finding. There is an emerging understanding of the role of the cerebellum in cognitive and emotional functioning (Rapoport et al., 2000). A recent study in a military population has shown cerebellar hypometabolism in a blast injured-TBI/PTSD population (Peskind et al., 2011). The findings in this study suggest that the cerebellum has a larger role during cognitive-related processes and could be part of a network involved with memory-related functions, through connections via regions of the thalamus and brain stem that in turn project to cortical regions such as the frontal and temporal lobes (Snell, 2009). The results from the partial correlations analysis also suggest a relationship between visual attention measure and frontal regions of the brain and cerebellum. Unlike other pathologies such as Alzheimer's disease, schizophrenia, or ADHD (Koch et al., 2012; Liang et al., 2006; Uddin et al., 2008), which have pronounced DMN connectivity anomalies, the results from our region-of-interest and correlation analysis show distinct unilateral coactivity. It is believed that these distinct patterns could be attributed to the characteristics of mTBI, which occur from trauma-related incidences. These may be related to a focal blow to one area of the head or related mechanism (Hoge et al., 2008; Rutherford and Corrigan, 2009; Silver et al., 2005). Furthermore, from the data presented in Table 4 showing regions of the brain with significantly different functional connectivity, we observe that some of these regions such as the left cerebellar lobule VII and the right SMA did not have significant correlations with the neuropsychological data.
A challenge that motivates this work is to ascertain whether trauma-induced injury and subsequent cognitive deficits serve to bolster the development of PTSD, depression, or chronic postconcussive symptoms. While the exact etiology of the abnormal functional connectivity within the DMN is not clear, our results indicate a measurable impact on disruption of normal brain function and on the performance of activities of daily living within this subject population.
Limitations
There are a number of weaknesses in this study that may limit generalizability. First, as these subjects were drawn from a clinical population, we were unable to find “pure” mTBI patients. There is a high rate of extracranial physical injuries and psychological stress experienced in our population. Second, our control group was limited by clinical, administrative, and ethical factors to narrowly recruit from the population that was used, namely active-duty but non-TBI service members. The control subjects used in this study represent the largest homogenous population available, while the small number (n=15) indicates the difficulty in recruitment for reasonably matched control subjects. Likewise, we would have preferred to match subjects based on level of stress symptoms, but those data were not available for our control subjects. Third, while our subjects did not have stress symptoms that approached the level of PTSD, they may have had clinically significant symptoms that mediated the findings. Fourth, the mTBI population recruited at WRAMC may not be fully representative of the overall mTBI population in the military. Fifth, sleep disturbances could have an effect on the regulation of DMN activity; however, the group reports for these symptoms as obtained by the NBSI and PCL-C were reported as very mild and did not approach significantly disruptive levels. Sixth, the medications prescribed during the day of the imaging scan could be a potential confound that alters cerebral perfusion. Since the research study occurred during ongoing clinical care for injuries experienced in addition to the TBI, this TBI neuroimaging study had little control over the medication regime. However, these alterations have been reported to be inconsistent across brain regions and various medications could have opposing effects (Franklin et al., 2011; Vlassenko et al., 2004). Therefore, the isolation of medication effects is very difficult (Franklin et al., 2011; Vlassenko et al., 2004). Seventh, we observed that 6 of the 15 mTBI subjects reported slight to mild pain. Chronic pain does influence the pain and sensory networks in the brain and affects cognitive networks by increasing connectivity during task performance (Baliki et al., 2008; Seminowicz and Davis, 2007). There have also been reports on disruptions in the DMN not completely deactivating during active task performance (Baliki et al., 2008). Furthermore, many of these regions reported overlap with the resting state sensory networks (Baliki et al., 2008). It is unclear how the DMN is specifically altered by chronic pain during a task-free paradigm, and with the relatively small sample size of the current study, pain is indeed a potential confound that is difficult to parse out and isolate. Finally, some of the correlation analyses used neuropsychological assessments that were subjective in nature. While there was evidence of valid performance, such measures could be susceptible to individual bias while reporting symptoms, and a more objective measure of neuropsychological symptoms and impairment should be incorporated in a future study.
Conclusions
Despite the limitations of the study, the results suggest that the use of the data-driven approach with dual regression is able to identify functional connectivity of the DMN within specific brain regions in a purely exploratory manner with minimal assumptions of the data set. Our results indicate that abnormal functional connectivity of the DMN correlate with some behavioral measures such as abnormal emotional processing (depression, aggressive behaviors, stress, and anxiety), working memory, and self perception. The approach to functional connectivity analysis in mTBI subjects using ICA compliments the work of Stevens et al. (2012). However, the use of dual regression to perform correlation analysis with a broad range of neuropsychological measures is novel to this study. The data suggest that GOF measure is not sensitive enough to distinguish mTBI subjects and has large variability, possibly due to mechanisms of injury and variable recovery in the brain, however, the limited sample size also contributes toward this limitation. Specific coactivity was also observed within this small sample in regions previously not reported in the literature relating to the DMN maps such as the cerebellum and SMA. Correlations between mTBI spatial information with neuropsychological assessments may provide a tool to assess the effects of mTBI on an individual subject level and supports prior behavioral findings of reported mTBI symptoms (Hoge et al., 2008; Rutherford and Corrigan, 2009; Silver et al., 2005). The work presented in this article has potential for the development of a biomarker for mTBI to provide an unbiased and reliable platform that will aid the selection of appropriate treatment and evaluation of mTBI recovery outcomes. This is of particular importance because at present, complete and adequate information on injuries are difficult to obtain and are subjective as they are highly dependent on self-reported measures. However, more testing on a larger sample size is needed to be able to further generalize the findings from this article.
Footnotes
Acknowledgments
We are grateful to Cara Olson, PhD, Research Assistant Professor and Biostatistics Consultant at the Uniformed Services University of the Health Sciences for assistance with the statistics, Jacob Hershorin, MS, psychometrist at the National Intrepid Center of Excellence, Walter Reed National Military Medical Center for assistance with analysis of the clinical assessment data, and Anthony Panettiere, MD, Neurologist at the National Intrepid Center of Excellence, Walter Reed National Military Medical Center. The views expressed in this article are solely those of the authors and do not reflect official policy of the United States Department of Defense, United States Military, or the United States Government. This research was supported by Center for Neuroscience and Regenerative Medicine (CNRM), (G.R., Henry M. Jackson Foundation Award Number: 300606–07.01-60855) and the Congressional Directed Medical Research Programs (G.R., CDMRP Award Number: W81XWH-08-2-0165).
Author Disclosure Statement
No competing financial interests exist.