
Abstract
The anterior insulae (INSs) are involved in accumulating sensory evidence in perceptual decision-making independent of the motor response, whereas the dorsal anterior cingulate cortex (dACC) is known to play a role in choosing appropriate behavioral responses. Recent evidence suggests that INSs and dACC are part of the salience network (SN), a key network known to be involved in decision-making and thought to be important for the coordination of behavioral responses. However, how these nodes in the SN contribute to the decision-making process from segregation of stimuli to the generation of an appropriate behavioral response remains unknown. In this study, the authors scanned 33 participants in functional magnetic resonance imaging and asked them to decide whether the presented pairs of audio (a beep of sound) and visual (a flash of light) stimuli were synchronous or asynchronous. Participants reported their perception with a button press. Stimuli were presented in block of eight pairs with a temporal lag (ΔT) between the first (audio) and the second (visual) stimulus in each pair. They used dynamic causal modeling (DCM) and the Bayesian model evidence technique to elucidate the functional architecture between the nodes of SN. Both the synchrony and the asynchrony perception resulted in strong activation in the SN. Most importantly, the DCM analyses demonstrated that the INSs were integrating as well as driving hubs in the SN. The INSs were found to a play an important role in the integration of sensory information; input to the SN is most likely through INSs. Furthermore, significant INSs to dACC intrinsic connectivity established by these task conditions help us conclude that INSs drive the dACC to guide the behavior of choosing the appropriate response. The authors therefore argue that the dACC and INS are part of a system involved in the decision-making process from perception to planning of a motor response, and that this observed functional mechanism might be important during the performance of cognitively demanding goal-directed tasks.
Introduction
The anterior insulae (INSs) are known to be involved in perceptual decision-making independent of response modalities (Grinband et al., 2006; Ho et al., 2009). The increase in the activity of INSs at the moment of a perceptual decision during an image recognition task (Ploran et al., 2007) further supports their role in the decision-making process (Binder et al., 2004). Also, INSs have been shown to be involved in the integration of perceptual information in the auditory and visual domains (Bushara et al., 2001; Lewis et al., 2000) and were found to be strongly affected by the task difficulty level (Tregellas et al., 2006).
Another brain region on the medial wall of the frontal lobe, the dorsal anterior cingulate cortex (dACC), has long been implicated in movement initiation (Picard and Strick, 1996; Ploner et al., 2010). dACC lesions can lead to difficulties initiating complex voluntary movements and actions (Rushworth et al., 2004; Williams et al., 2004). The activity in the dACC is known to have a direct causal role on choosing an action during the goal-directed action selection (Dosenbach et al., 2007; Medford and Critchley, 2010; Zysset et al., 2006) and is involved in the top-down modulation to the primary motor cortex (Taylor et al., 2007).
In task-based functional imaging, INSs and dACC have been found to be coactivated (Dosenbach et al., 2007; Ham et al., 2013; Ploran et al., 2007) and are anatomically interconnected (van den Heuvel et al., 2009). The spike of activity in this network was found time-locked with the moment of recognition in a perceptual discrimination task (Ploran et al., 2007). This is in accordance with the previously documented evidence on their role in the decision-making process (Grinband et al., 2006; Thielscher and Pessoa, 2007). The network formed by INSs and dACC has been named the “salience network (SN)” (Seeley et al., 2007; Sridharan et al., 2008).
Previous studies have indicated a broad role of SN in the decision-making process, including the implementation of goal-directed tasks (Dosenbach et al., 2006, 2007). However, when available sensory information is scant, the task of decision-making becomes difficult and is reflected in the uncertainty of the decisions (Ho et al., 2009; Shenhav et al., 2013; Woolgar et al., 2011). For optimal performance of decision-making, the brain has to put together the ambiguous information to arrive at the perceptual decisions (Botvinick et al., 2001). How is the ambiguity resolved? What is the role of the INSs in the ambiguity resolution? How a goal-directed behavior evolves from the causal interactions of nodes within the SN remains to be understood.
In this study, the authors aimed to understand the contribution of cortical nodes of SN (INSs and dACC) in the decision-making process: from segregation of stimuli to response selection. To pursue the goal, they used functional magnetic resonance imaging (fMRI) with dynamic causal modeling (DCM), a technique that infers effective connectivity from fMRI data, coupled with a Bayesian model evidence technique. Thirty-three healthy participants were scanned and asked whether the presented pairs of audiovisual (AV) stimuli were synchronous or asynchronous. Stimulus pairs were presented in blocks of eight pairs with a participant-specific temporal lag (ΔT) between audio and visual stimulus onset. The perception of synchrony or asynchrony is strongly influenced time lag (ΔT). Time spacing between the tone and flash was unique to each individual. The individuals' ΔT was chosen by finding the point of subjective simultaneity (PSS; details in the Materials and Methods section). The task difficulty, the cognitive demand of this task, was manipulated by creating the temporal lag near the PSS.
Materials and Methods
Participants
Thirty-three healthy individuals (17 females and 16 males; mean age, 27.54 years) participated in this experiment. All participants had normal hearing and normal or corrected to normal vision, as well as normal neurological history. Participants were compensated for their participation. The Institutional Review Board (IRB) for Georgia State University and Georgia Institute of Technology, Atlanta, GA, approved the experimental procedure. All participants provided written informed consent in accordance with institutional guidelines.
Stimuli
The authors used a pair of auditory (a tone) and visual (a flash of light) stimuli. The auditory stimulus consisted of a 440-Hz–30-ms tone, while the visual stimulus consisted of a 30-ms yellow-red flash from the disc of 0.7 cm radius. The auditory stimulus was delivered through a pair of earphones, one on each ear, and visual stimulus was flashed at the central position on the computer screen. Sound was presented first with a stimulus onset asynchrony depending on the participants' PSS (for details see the Task and Behavioral Paradigms section). Participants judged whether the pair of stimuli appeared to have been presented simultaneously (synchronously) or not (asynchronously). They were asked to report their decision by pressing the left or the right button on a button box with either their right index or middle finger. Subjects were asked to indicate their decision as quickly and as accurately as possible outside the scanner and after the question mark appeared on the screen in the fMRI run. The trials in which they failed to respond or made an incorrect response were discarded for further analysis. The presentation software (
Task and behavioral paradigms
Outside the fMRI scanner
The experimental task outside the scanner was divided into two separate sessions and each session consisted of a single run. The first session was aimed to identify a PSS, that is, how far apart in time the asynchronously presented audio and visual pair could be perceived as synchronous. The PSS is unique to each individual. The perception of synchrony (or asynchrony) of AV signals is affected by a variety of factors such as the nature of the stimuli, its complexity, experience, life span, and is especially influenced by time lag (ΔT): time spacing between the tone and flash (Navarra et al., 2005; Pons and Lewkowicz, 2014; Vatakis et al., 2007; Vatakis and Spence, 2006; Zampini et al., 2003). The behavioral run started with 5 sec of initial rest followed by the presentation of audio and visual stimuli with a systematically varying asynchrony lag of 66.6, 83.3, 100, 116.6, 133.3, 150, and 166.6 ms. Previous literature suggested that humans can correctly detect AV asynchrony within these limits (Pons and Lewkowicz, 2014; van Eijk et al., 2008; van Wassenhove et al., 2007; Zampini et al., 2003, 2005). The time between each pair (the pause, τ) was chosen randomly between 1000 and 1160 ms. Participants were seated in a dimly lit room at an approximate distance of 70–80 cm in front of the monitor and responded using a keyboard. On each trial, participants were asked to judge whether the AV stimulus was synchronous or asynchronous. They were asked to indicate their perception by left mouse click if they perceived synchrony or right mouse click for asynchrony. After reporting their perception, participants were asked to click on the middle of the mouse to advance to the next stimulus. Each condition was presented 20 times, totaling 140 trials. After completing the run, the authors looked at the fraction of the trials that were perceived as synchronous or asynchronous. The time lag (ΔT) was chosen from the sets of time lags in which performance accuracy was 50%:50% or close to it (which the authors call temporal threshold or simply threshold in this text). The second session also involved acquiring behavioral data and response time (RT) outside the fMRI scanner. It consisted of a single run, but the time lag (ΔT) was manipulated to a threshold −16.6, threshold, and threshold +16.6 ms. The pair of stimuli was presented 60 times: 20 at each ΔT. The time the stimulus was presented and the RT to that stimulus were recorded for further analysis.
Inside the fMRI scanner
The last experimental run was inside the fMRI scanner where the fMRI data were acquired and behavioral responses were recorded (Fig. 1). This fMRI run started with 30 sec of initial rest followed by 24 multisensory task blocks and 8 blocks of unisensory task. Blocks were presented in a random order and consisted of eight pairs of stimuli in the multisensory block where both the tone and flash were presented. In the unisensory block, either eight flashes or eight beeps were presented. Stimuli within a block were presented with the random pause of 1666–1926 ms followed by the cue of 600 ms at the end of each block, totaling about 24 sec for one block. There was about 10 sec of pause in-between blocks and the run ended with 35 sec of a final rest period. While running the experimental runs, participants were asked to focus their gaze on the crosshair at the center of the screen.
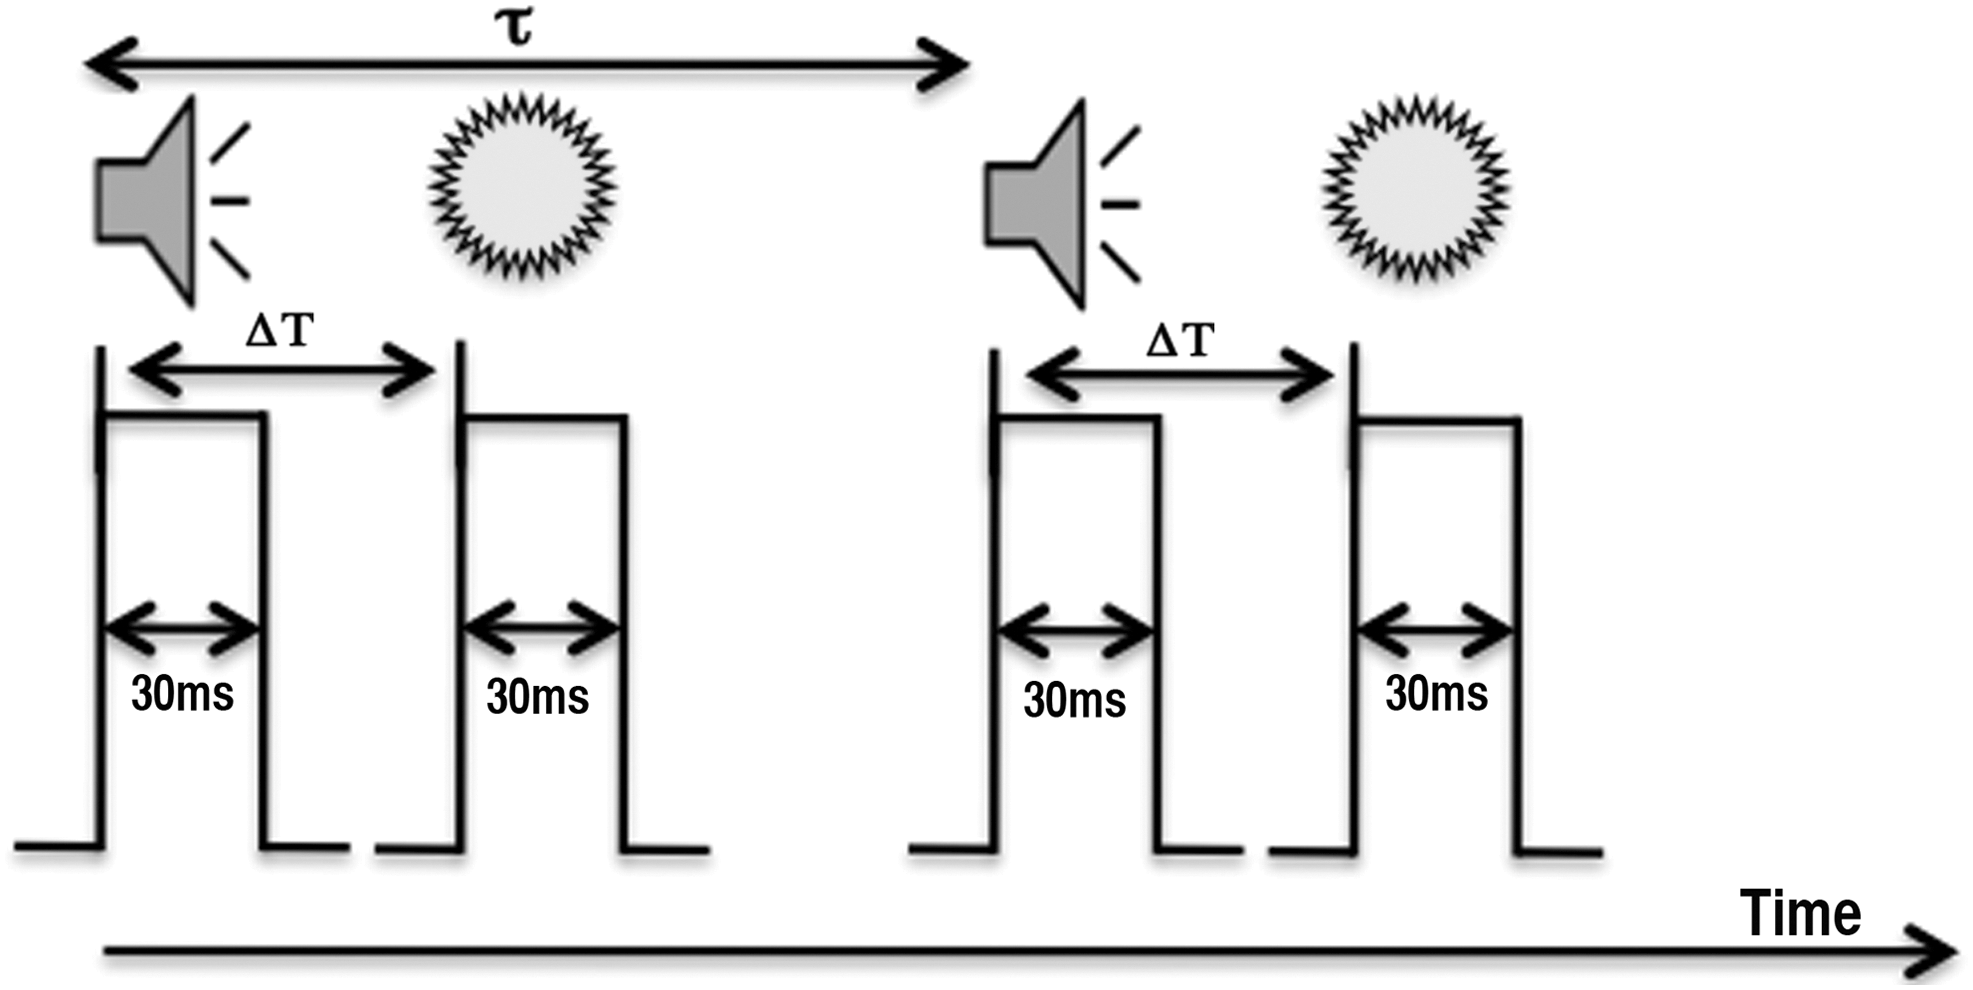
Experimental paradigm: Task paradigm during the functional experiment started with initial 30 sec of rest followed by task blocks and 35 sec of rest at the end of the run. There were two block types: multisensory blocks (beep-flash pair was presented for 30 ms, as shown in figure) and unisensory blocks (flash only or beep only was presented, not shown in figure). The time interval between the beep and sound (ΔT) varied from participant to participant. Stimuli within the block were presented with the random pause (τ) of 1666–1926 ms followed by the cue of 600 ms at the end of each block, totaling about 24 sec of one block. Participants were asked to response after the cue was presented. In unisensory blocks, since a single stimulus was presented, no question was asked about asynchrony and synchrony perception at the end of each block.
While recoding these data, two stimulus types were used; a beep-flash pair with a distracter and one without a distracter. No distracter was used in the unisensory block either. In this study, the distracter was a ball of radius 0.7 cm moving across the screen, only one time per AV pair, either left to right or right to left while the AV pair stimuli were presented. Participants were asked to disregard the ball and focus on the sensory stimuli. The aim of adding the distracter was to be more engaged. The data from these two conditions (with a distracter and without a distracter) were initially analyzed separately. However, the authors did not find significant behavioral difference in the perception of asynchrony with or without the distracter (mean percentages were 35.43 and 31.66, respectively, probability [p]=0.49, a paired t-test was performed). Similarly, they did not find a significant difference between the synchrony response with or without the distracter (means 64.56 and 68.33, p=0.49). Also, no significant difference was found in RT between asynchrony perception with or without the distracter (means were 0.91 and 1.03 sec, p=0.17) and that of synchrony perception (means were 0.78 and 0.79 sec, p=0.87). Furthermore, to make sure that there was no significant difference in brain activation, the authors first analyzed the brain data considering with and without the distracter as a separate regressor in the SPM general linear model (GLM) for both asynchrony and synchrony response trials. They compared mean contrast values extracted from SN nodes using a pairwise t-test. They found no difference in mean contrast values of asynchrony and synchrony perception between with and without the distracter conditions (for lINS: p=0.20 and 0.64, for rINS: p=0.95 and 0.07, for dACC: p=0.93 and 0.14. In this study, the first value of p is between asynchrony perception with a distracter and without a distracter, and the second value is that of synchrony perception). So for further analysis, the authors combined the trials of asynchrony perception from with and without the distracter condition and called them as asynchrony on trials and that of synchrony as synchrony on trials.
Data acquisition and analysis
Behavioral data
RT, the time between onset of the stimulus and button response, for each trial was recorded outside the scanner; and behavioral performance was recorded from both inside and outside the scanner. Participants' behavioral performance was analyzed using MATLAB. Trial by trial RTs of each participant from outside the scanner were separated and averaged for both asynchrony and synchrony responses. Paired t-tests were used to compare the RTs between asynchrony and synchrony perception conditions. The authors did not record RTs inside the scanner as the participants were instructed to wait until the question mark (cue) was displayed in the computer screen before indicating their decision by button presses for the given stimuli.
fMRI data
The whole-brain MR imaging was done on a 3-Tesla Siemens scanner available at CABI (Georgia State and Georgia Tech Center for Advanced Brain Imaging, Atlanta, GA). High-resolution anatomical images were acquired for anatomical references using an MPRAGE sequence (with TR=2250 ms, TE=4.18 ms, flip angle=9°, inversion time=900 ms, voxel size=1×1×1 mm3). FMRI measurements of T2*-weighted BOLD effect were acquired by using a gradient echo-planar imaging protocol and the functional run consisted of 449 scans; echo time (TE)=30 ms, repetition time (TR)=2000 ms, flip angle=90°, voxel size=3×3×3 mm3, field of view=204×204 mm, matrix size=68×68, and 37 interleaved axial slices each of 3 mm thickness.
MRI data were analyzed using Statistical Parametric Mapping (SPM8, Wellcome Trust Center, London,
Effective connectivity analysis: DCM
To examine the effective connectivity established by these experimental conditions (i.e., asynchrony and synchrony perception) between the regions of interest (ROIs) in SN, the authors used DCM (Friston et al., 2003) implemented in SPM8 (DCM10). They identified the ROIs from the group level results and determined the peak voxels of interest from the contrast (asynchrony [A]+synchrony [S]>beep [b]+flash [f]). Then, they used these coordinates as a reference to find the local maxima from the first-level brain map and extracted the eigenvariate by defining a sphere of radius 6 mm for the contrast of interest adjusted for the equivalent F-contrast. The center of each ROI was located on the most significant voxels in the cluster nearest to the peak cluster coordinate obtained from group analysis and activated at a significant level (p<0.05 uncorrected) and lies within twice the width of the Gaussian smoothing kernel used while smoothing the data. Obtained fMRI time series were then used in the DCM analysis. First, using the Bayesian model selection (Penny et al., 2010), the authors identified nodes from where the inputs to the SN entered. Second, using the Bayesian model averaging (BMA), they computed resultant connection (intrinsic and modulatory) strengths established by this task (i.e., perception asynchrony and synchrony). Finally, they tested for statistical significance of resultant intrinsic connection strengths within the SN and determined whether any connections were significantly modulated by task conditions.
For DCM analysis, the authors kept matrix A, the matrix of intrinsic connections, fully connected between the ROIs across all models. For three ROIs, there were six possible intrinsic connections (dACC to RINS, dACC to LINS, RINS to dACC, LINS to dACC, LINS to RINS, and RINS to LINS). The B matrix is the matrix of changes (increases or decreases) in effective connectivity between regions for each task condition of interest. As in the A matrix, there were six possible connections in B matrices and each connection could exist in two states (i.e., modulated or not modulated by task type) and, therefore, there are 26=64 mathematically possible combinations of B matrix. Similarly, the inputs into the network are expressed in the matrix C. It represents the direct influence of the task on specific nodes. For three ROIs, there are seven possible input conditions as follows: dACC alone, RINS alone, LINS alone, dACC and RINS in combination, dACC and LINS in combination, LINS and RINS in combination, and all nodes. Therefore, the authors have used 7×64=448 models per participant to thoroughly explore model space. Each of the 64 models of 7 families was compared using the random-effects option of the family-level Bayesian inference (Penny et al., 2010) and the winning families were taken to the next level analysis (detail analysis and result: on the Results section).
Results
Behavioral performance
Since there is no right or wrong answer, the authors categorized the behavioral responses based on participants' perception of asynchrony and synchrony. The mean performance ratio outside the scanner was about 34:66 (standard deviation [std], 19.71) for asynchrony and synchrony perception, respectively. However, more time was taken to respond with the asynchrony perception (mean RT=0.96 ms, std 0.30) compared to synchrony (mean RT 0.79 ms, std 0.23). This was statistically significant (Student's paired t-test, p = <0.016, t-stat=2.48). Similarly, the mean performance ratio inside the scanner was the ratio of 41:61 (std 17.58). The plots of behavioral results are shown in Figure 2.
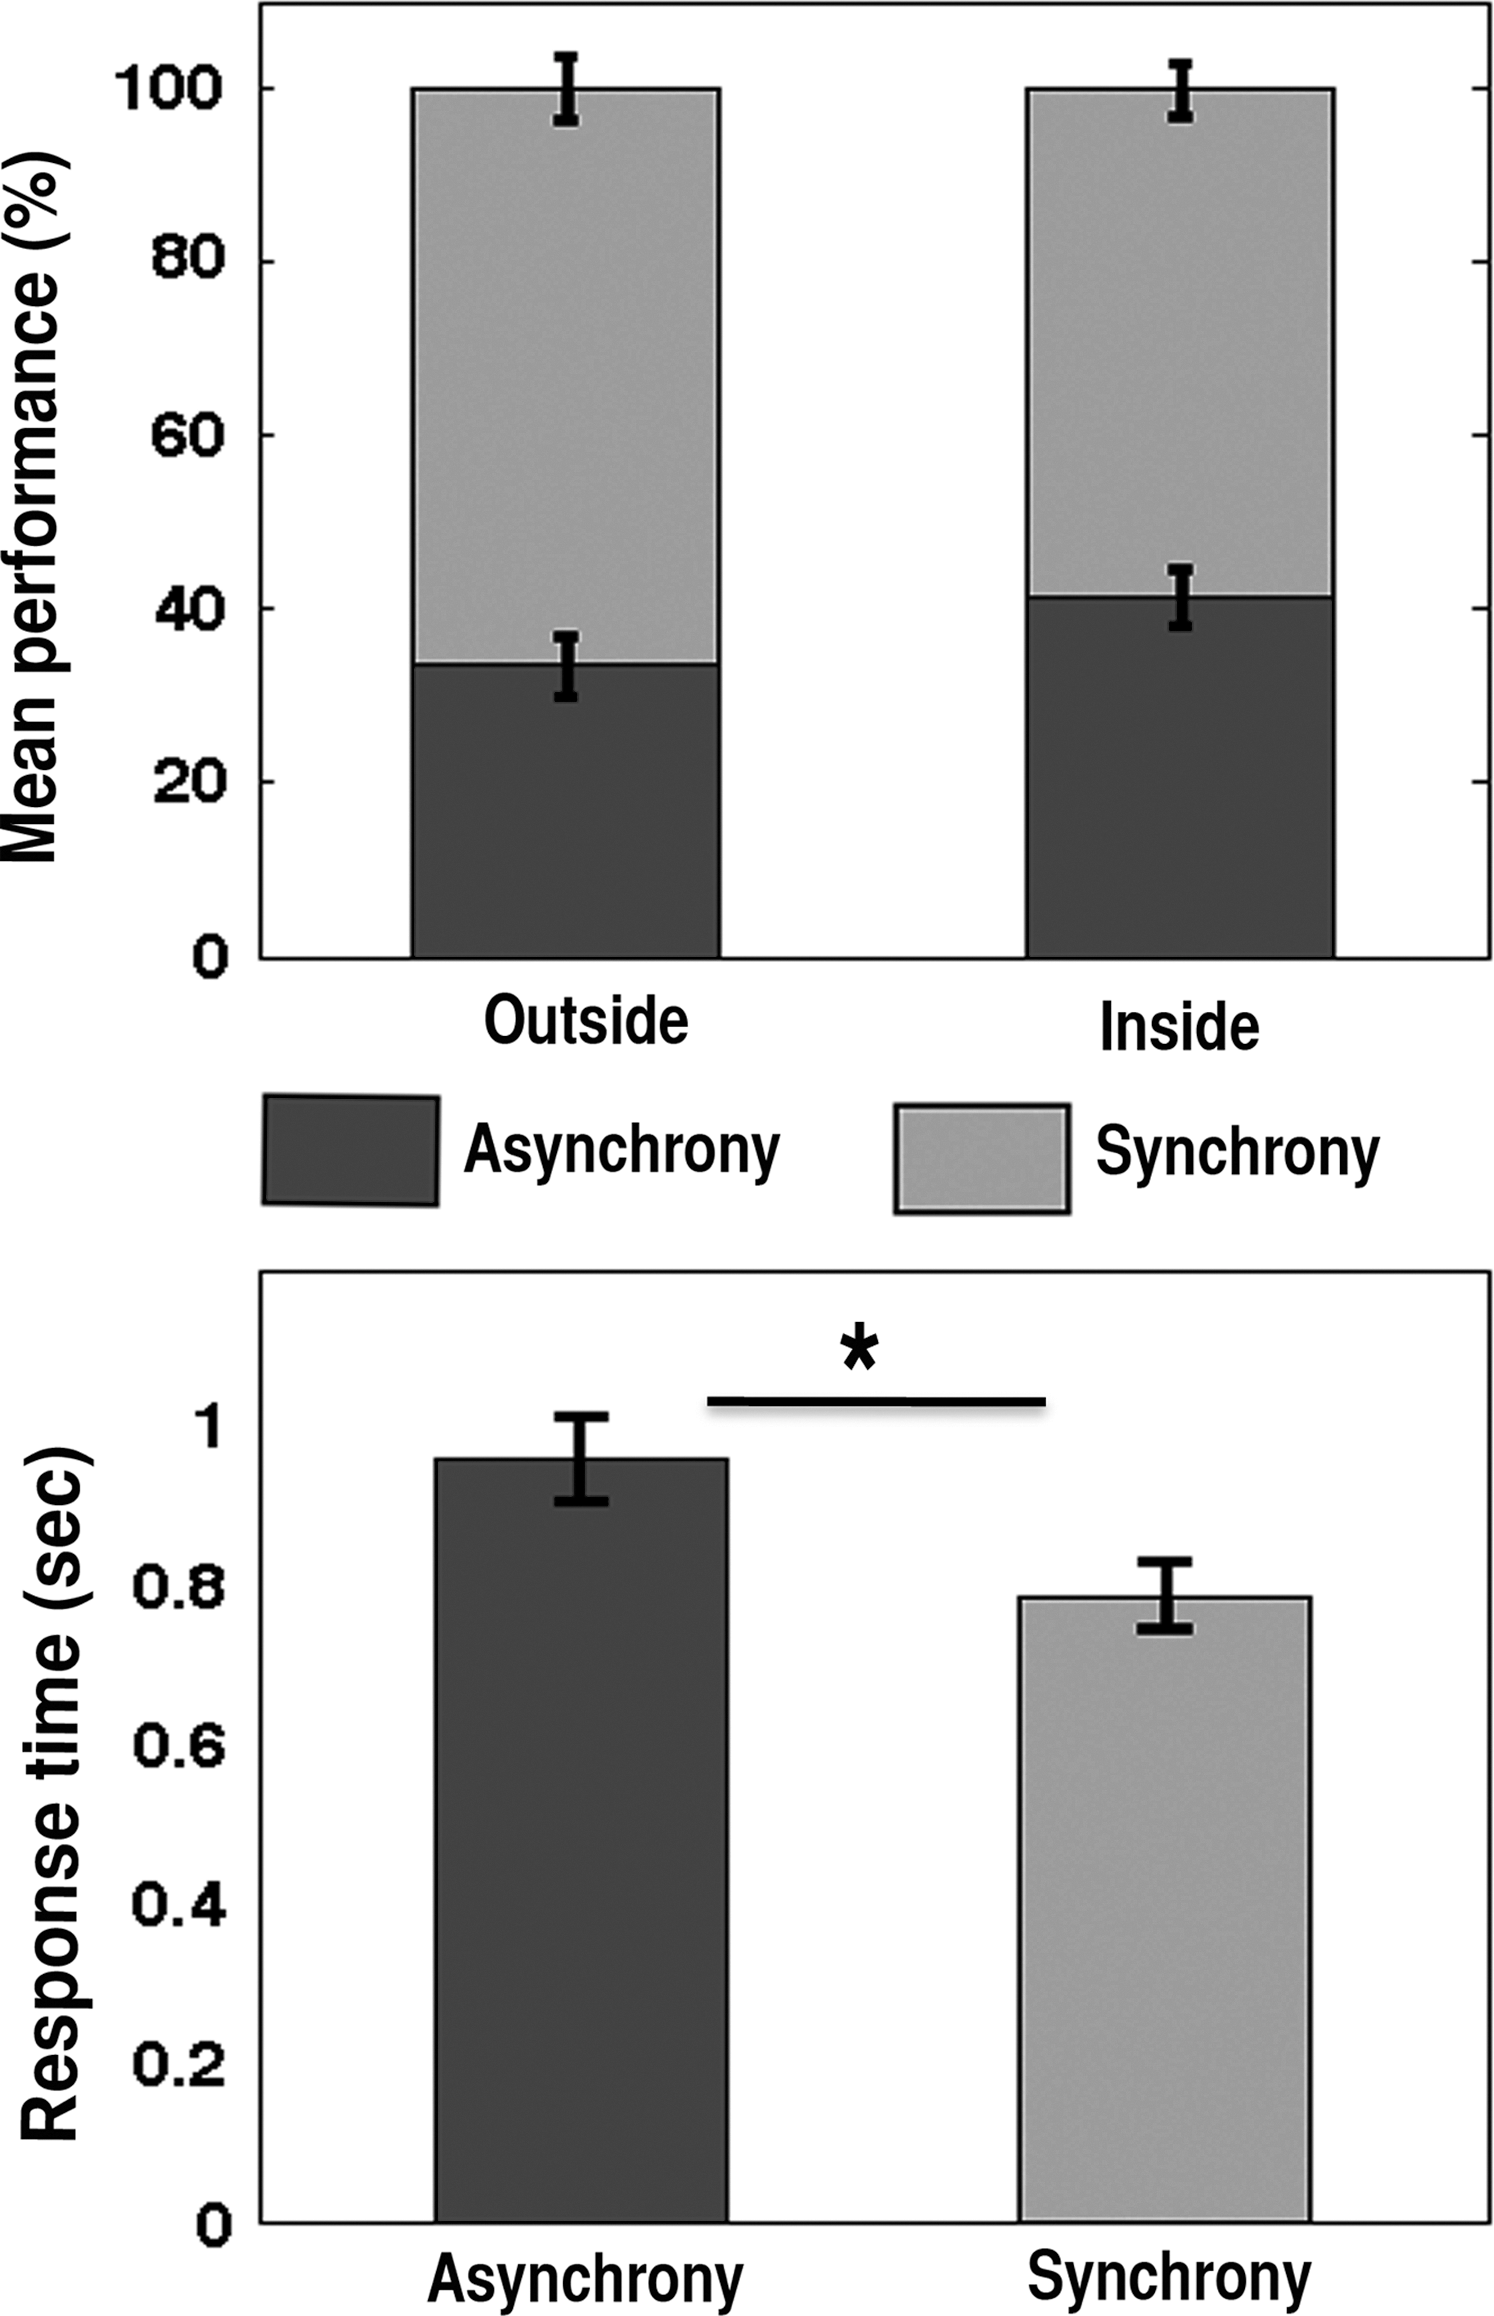
Behavior results. Behavior responses were categorized based on participants perception of asynchrony and synchrony. The mean performance ratio outside the scanner was about 34:66 and that of inside the scanner was 41:59 for asynchrony and synchrony perception, respectively (top). The trial by trial response time (RT) was recorded outside the functional magnetic resonance imaging (fMRI) scanner and mean RT was 0.96 and 0.79 ms for asynchrony and synchrony response, respectively (bottom). Error bars show standard error of the mean. * represents p<0.05.
Brain activation
Both synchrony and asynchrony perceptions activate the SN (Table 1 and Fig. 3). The contrast used was asynchrony perception (A)>(auditory [beep only; b]+visual [flash only; f], in other words multisensory>unisensory) and synchrony perception (S)>(auditory [beep only; b]+visual [flash only; f]), respectively. Furthermore, for ROI analysis purpose, the authors have contrasted (asynchrony perception [A]+synchrony perception [S])>(auditory [beep only; b]+visual [flash only; f]). From the activation map, they have extracted the contrast values (the beta parameters), by defining a sphere of 6 mm radius centered at the local maxima peak activity voxel using MarsBaR (Brett et al., 2002). The group average of contrast values was plotted for each node in the SN, separately for asynchrony and synchrony conditions (Fig. 3B). They found a significantly (paired t-tests) higher brain activity in asynchrony perception compared to synchrony perception conditions in each node of SN.
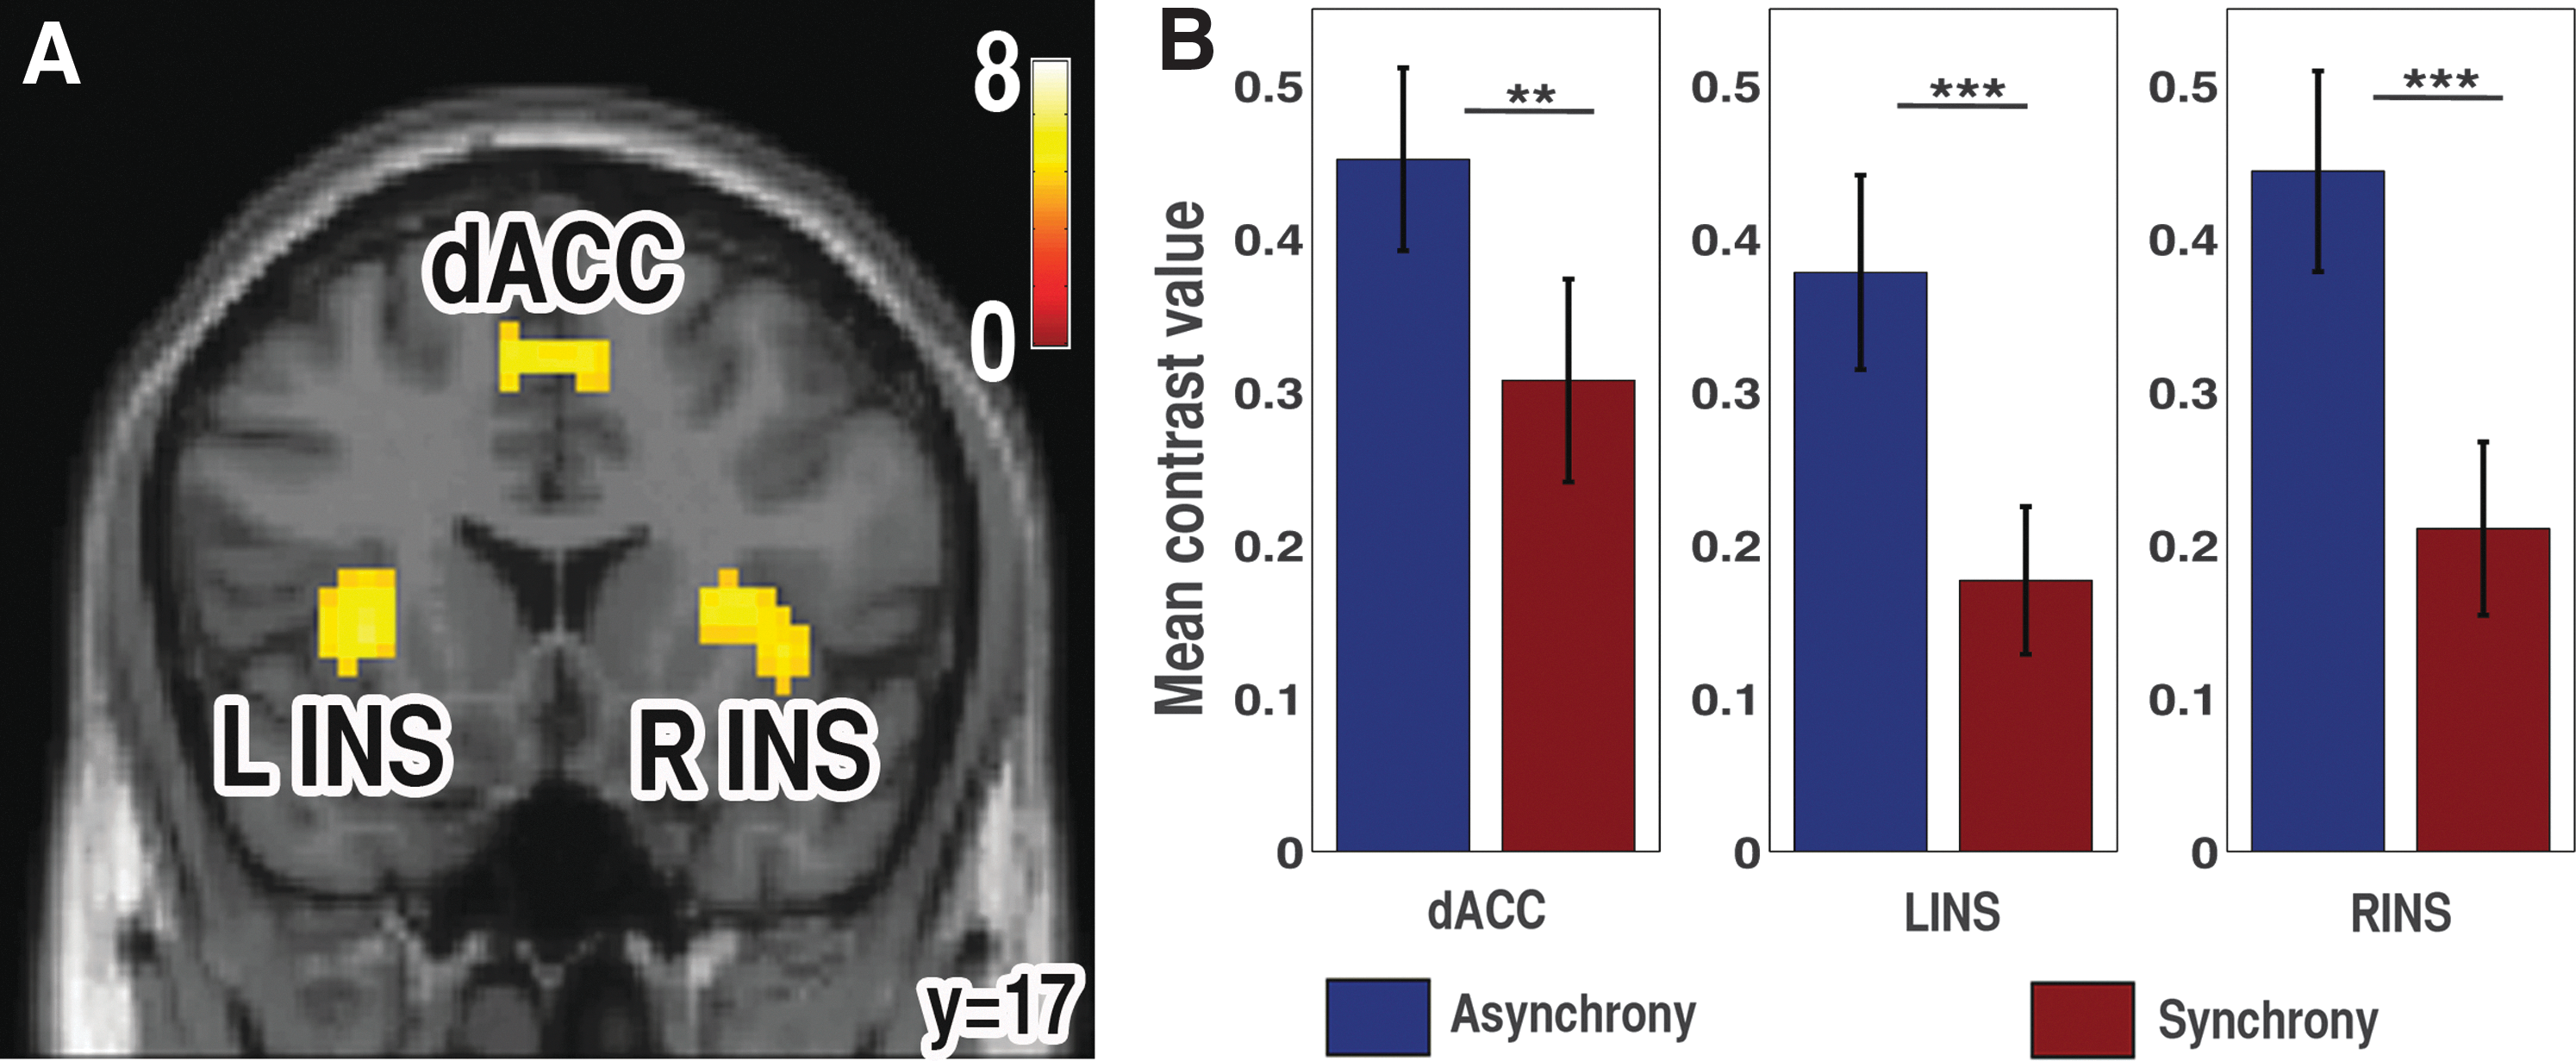
Salience network (SN) activation.
Brain Activations for Asynchrony Perception (A) and Synchrony Perception (S) Contrasted with Audio (Beep, b) and Visual (Flash, f)
Familywise error corrected (FWC) p<0.05, *AlphaSim corrected p<0.05.
DCM analysis
To identify where the inputs to the SN entered, family-level inference was used. This procedure removed the uncertainty about aspects of the model structure other than the characteristic of interest. For example, what are the inputs to the system? (Penny et al., 2010). Of the seven family models that they have compared, the most evidence (xp, the exceedance probability) was for right insula input (83.12%). Similarly, the evidence for dACC and left insula input was 8.50% and 7.90%, respectively. The evidences for the remaining families were less than 0.33% (Fig. 4A). The authors focus their further DCM analysis on the first three winning models as the evidence combining three families resulted 99.51%.
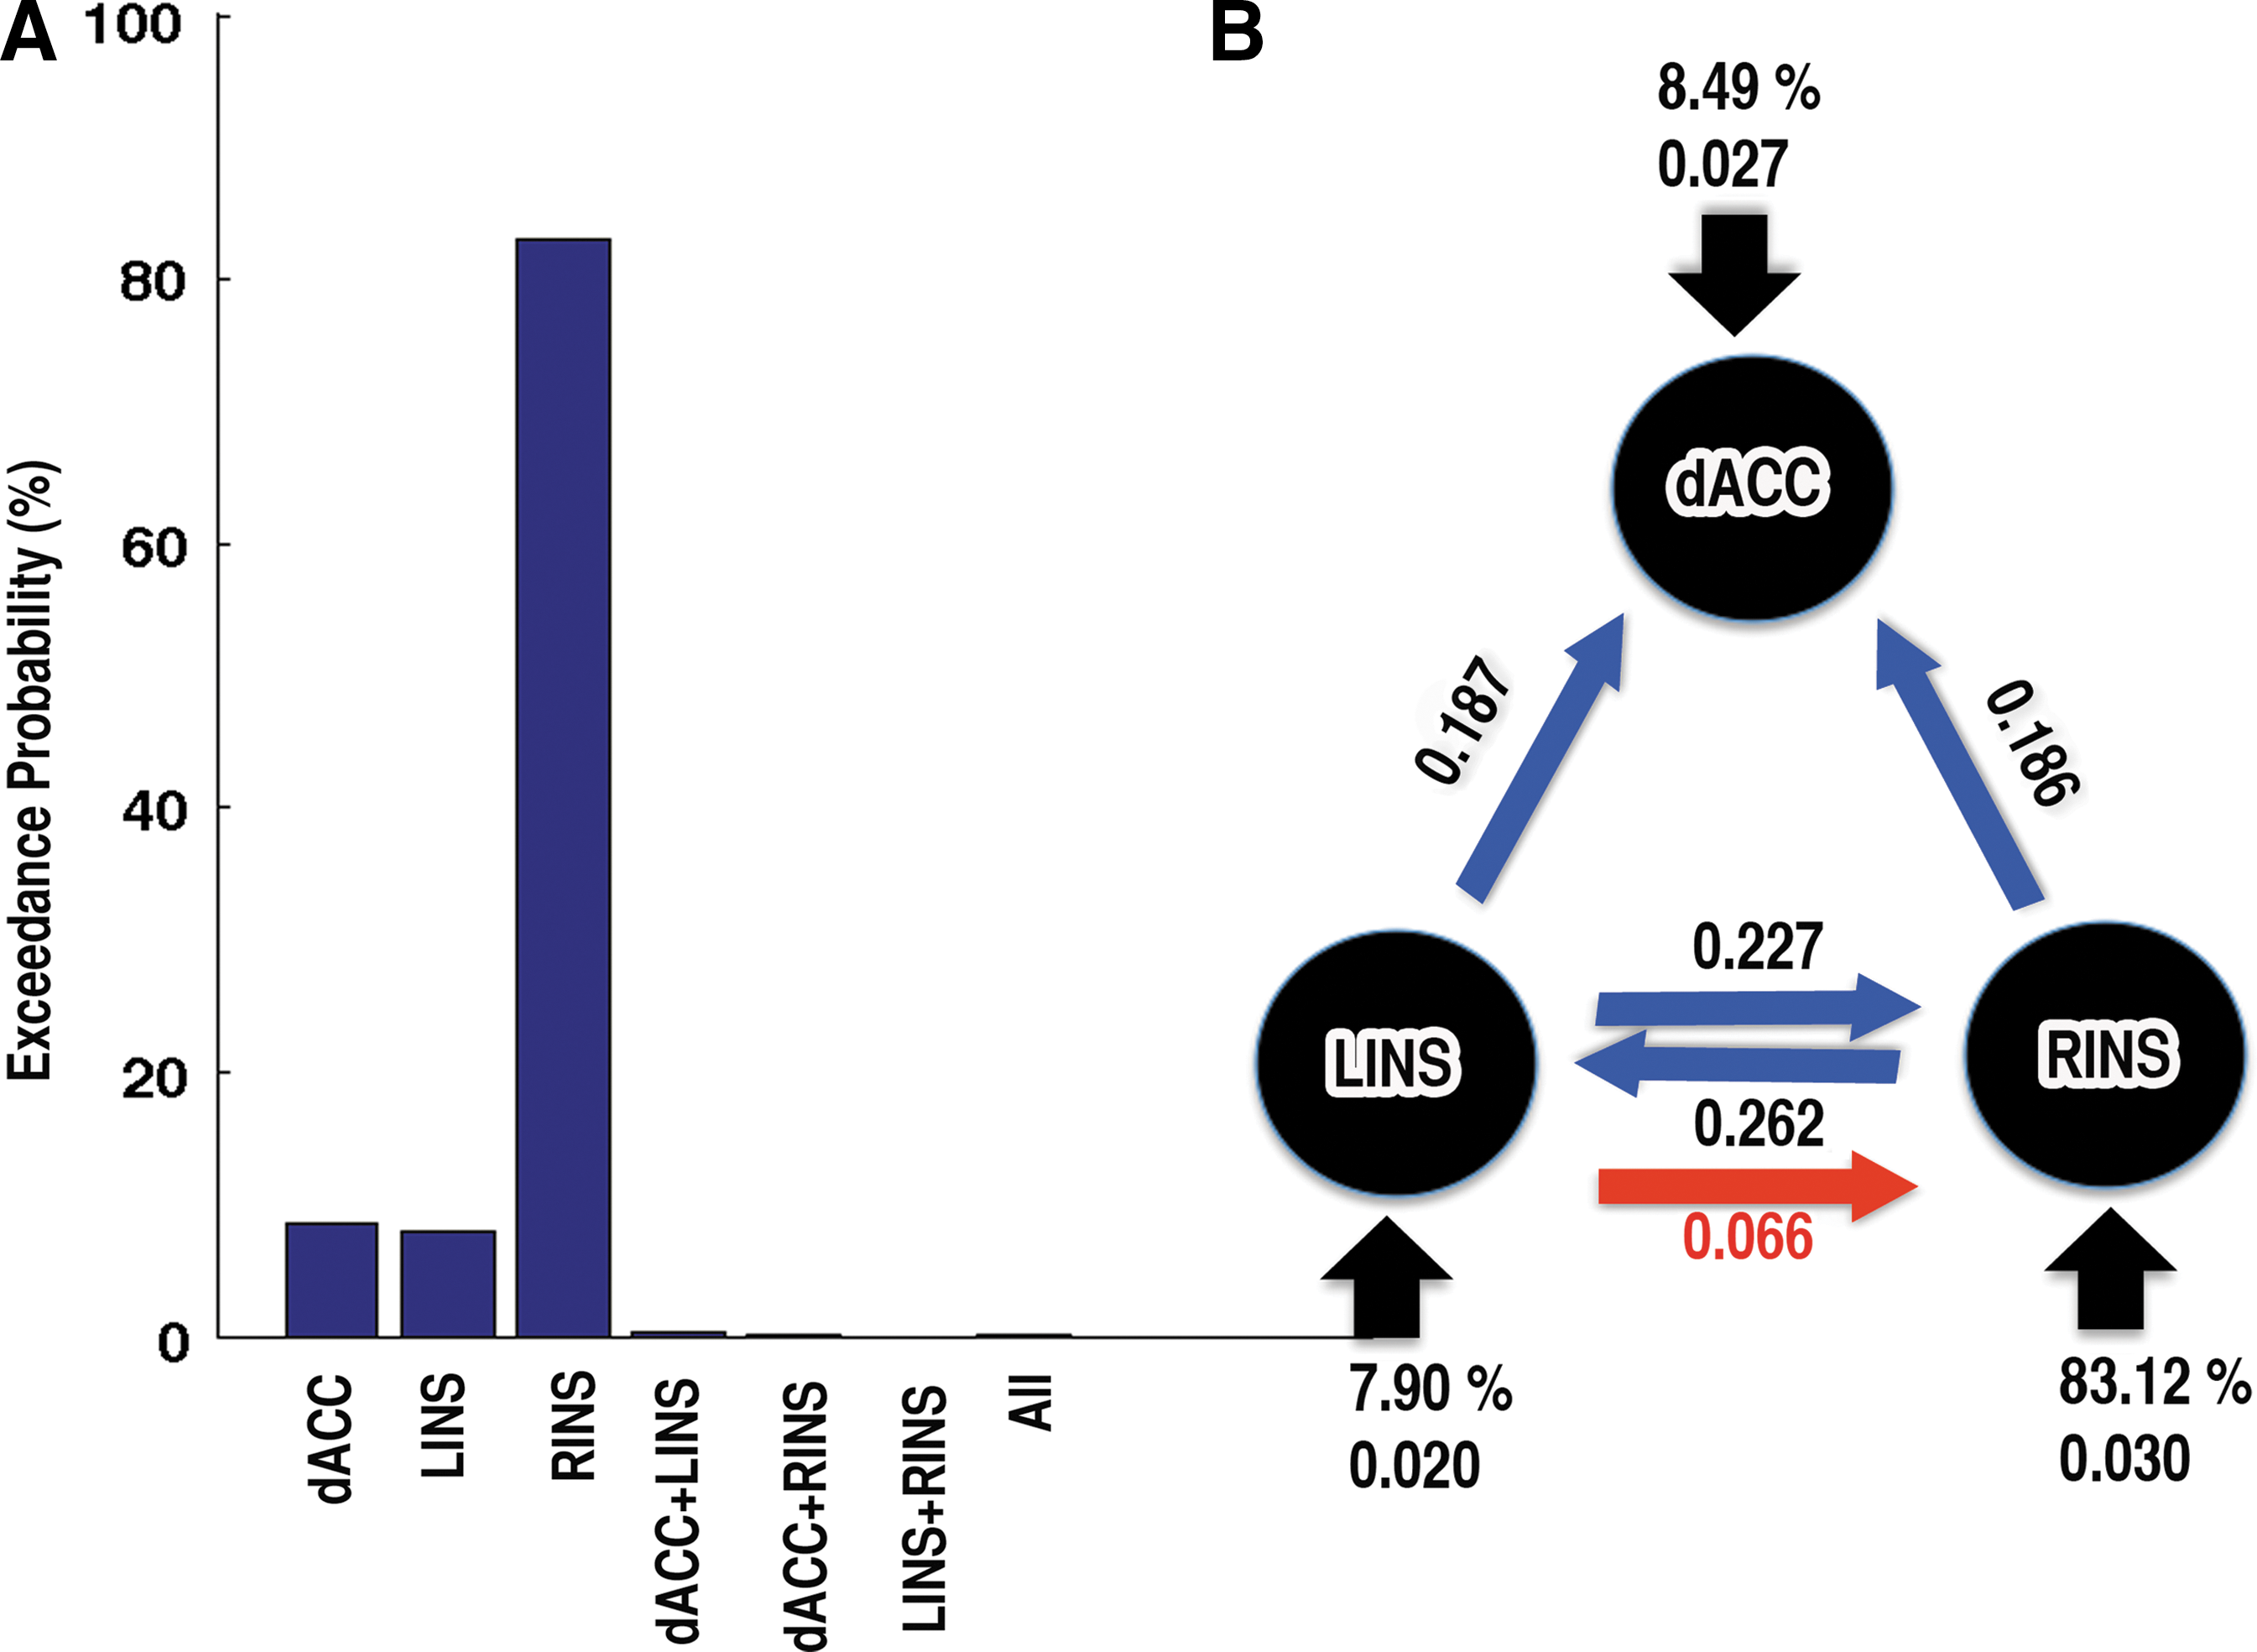
Exceedance probability and connections between nodes of SN.
The random-effects BMA procedure (BMA.rfx) was used to compute resultant pattern of connection strengths (intrinsic and modulatory) established by the perception of asynchrony and synchrony of AV pairs. The intrinsic connections between nodes during asynchrony and synchrony perception were found significant (t-test, p<0.05) from (1) RINS to LINS and dACC (2) LINS to RINS and dACC (Fig. 4B, blue arrows). No significant connections were observed from dACC to RINS and LINS. Next, the authors investigated whether the connections were modulated by asynchrony and synchrony conditions (the matrix B). For the asynchrony condition, the connection from LINS to RINS was significantly increased (Fig. 4B, red arrow). No other connections were found to be modulated by either asynchrony or synchrony perception. The parameter estimates of the driving stimuli to the dACC and left and right insulae were found to be 0.027, 0.020, and 0.030, respectively.
Discussion
The INSs and the dACC form an independent brain network, the SN (Seeley et al., 2007). These brain regions are often coactivated, making it difficult to isolate the functional role of individual nodes (Ullsperger et al., 2010). In this study, the authors attempted to understand the complex and, as yet, only partially characterized patterns of functional connectivity between nodes in the human SN by using the multisensory perception task coupled with DCM. The DCM analysis showed that both RINS and LINS were connected intrinsically to each other and also with the dACC. Input to the SN mostly came through RINS. These results suggest a central role of INSs and dACC in the perception of sensory events and selection of appropriate behavioral responses. These findings further extend previously reported findings that the INSs and dACC serve as part of the decision-making network that integrates information important to choose one response over another (Ho et al., 2009; Krebs et al., 2012; Rushworth et al., 2004; Srinivasan et al., 2013; Venkatraman et al., 2009; Wiech et al., 2010; Woolgar et al., 2011).
A large number of studies have found that the insula is a key structure in perceptual decision-making (Binder et al., 2004; Grinband et al., 2006; Ho et al., 2009; Ploran et al., 2007; Tregellas et al., 2006). INSs have been shown to have widespread efferent and afferent projections to and from both the frontal and parietal cortices (Mesulam and Mufson, 1982a,b; van den Heuvel et al., 2009). This connectivity places the INSs perfectly to perform their putative role on decision-making, for example, INSs are involved in integration (Bushara et al., 2001; Lewis et al., 2000) and comparison (Grinband et al., 2006; Pleger et al., 2006) of sensory information. The significantly higher brain activity (Fig. 3B) in INSs during asynchrony perception might reflect the greater task difficulty in AV integration (Calvert, 2001; Tregellas et al., 2006) and discrimination (Kosillo and Smith, 2010).
The dACC has been implicated as part of the task-set system that initiates and selects action (Dosenbach et al., 2006). Lesions in this part of the brain can lead to difficulties in initiating complex voluntary movements and actions (Rushworth et al., 2004; Srinivasan et al., 2013; Williams et al., 2004). However, in goal-directed actions, knowledge about which task to pursue is important before the authors initiate or select any action. This is done by accumulating evidence to support one action over another action (Gluth et al., 2012; Landmann et al., 2007). The significant intrinsic connectivity from INSs to dACC in this task condition supports the previous findings that the dACC gets immediate access to information about external task cues from the insular cortex, cortical areas associated with high-level perception (Morecraft et al., 2012; Shackman et al., 2011). In this task condition, the dACC might be involved in accessing moment-to-moment perceptual information supporting one versus another response to guide behavior. The higher brain response in the dACC during asynchrony perception compared to synchrony perception might be due to the increased task demand of assessing information required for response selection processing, such as conflicting information, which may make such selection difficult (Nee et al., 2011; Rushworth et al., 2004). This is in line with previous findings that dACC facilitates response selection under conditions of conflicting response alternatives or task sets (Rushworth et al., 2002; Taylor et al., 2007). The role of dACC in the decision-making process includes action initiation (Srinivasan et al., 2013) and the selection of specific actions (Rushworth et al., 2004); the role of dACC is also supported by the findings in a much wider range of decision-making tasks (Ho et al., 2009; Krebs et al., 2012; Venkatraman et al., 2009; Woolgar et al., 2011).
INSs and dACC share a direct white matter connection (van den Heuvel et al., 2009). There is now a wealth of evidence that INSs and dACC have a close functional relationship in wide range of tasks (Dosenbach et al., 2007; Grinband et al., 2006; Ham et al., 2013; Ploran et al., 2007; Seeley et al., 2007; Sridharan et al., 2008; Thielscher and Pessoa, 2007). The SN plays a role in the coordination of behavioral responses (Medford and Critchley, 2010). These findings provide evidence that efficient behavior evolves from the causal interaction of nodes within the SN. The higher evidence that input in SN is mostly from INSs suggests their role in the integration of stimulus saliency (Bushara et al., 2001; Lewis et al., 2000; Wiech et al., 2010). This is supported by the widespread efferent and afferent projections of the INSs to and from both the frontal and parietal cortices (Mesulam and Mufson, 1982a,b; van den Heuvel et al., 2009). The activity in the dACC was triggered by INSs, which has lead to the conclusion that INSs provide cortical signals used for appropriate response selection. This is in line with previous findings that suggest the insula acts as a cortical “out flow hub” to influence activity of other brain regions (Ham et al., 2013; Menon and Uddin, 2010; Sridharan et al., 2008).
The input to the right insula was much higher than to the left insula (Fig. 4B), which suggests a dominant role of the right insula in the SN function. This difference of the left and the right in the insular function has not been understood well possibly because they are usually coactivated (Critchley et al., 2004; Ploner et al., 2010; Singer et al., 2009; Sterzer et al., 2010), as in the current study. In this study, by the use of DCM, the authors were able to point out that there might be different functional roles of the left and right insulae in the integration of perceptual saliency. Based on these results and experimental evidence obtained from other similar studies (Eckert et al., 2009; Ham et al., 2013; Sridharan et al., 2008), they propose that the right insula is, in general, critical for the integration of external stimuli in a perceptual decision process, in which the interactions between the left and the right insulae are essential. Highly engaging tasks such as the asynchrony perception task that they conducted often lead to modulation of effective connectivity from the left to the right. These results are consistent with the earlier proposal that the right insula aids in the coordination and evaluation of task performance across behavioral tasks with varying perceptual and response demands (Eckert et al., 2009).
Broadly, these results support that SN is a set mechanism required during the performance of cognitively demanding goal-directed tasks (Dosenbach et al., 2006, 2007; Nee et al., 2011) and coordination of behavioral responses (Medford and Critchley, 2010). One potential limitation of this study is that the authors constrained this study within the SN as, in many situations, the activity within SN appears related to goal-directed decision-making, especially in engaging tasks (Dosenbach et al., 2006, 2007; Medford and Critchley, 2010; Nee et al., 2011). However, these were not the only higher order cortical brain regions activated by this experimental task. The other brain regions activated included the dorsolateral prefrontal cortex (dlPFC) and inferior parietal lobe (IPL). The dlPFC has been reported in various decision-making tasks (Adhikari et al., 2013; Carlson et al., 2006; de Lafuente and Romo, 2005; Hernandez et al., 2010; Lamichhane et al., 2014) and is also considered a part of the cognitive system (Miller and Cohen, 2001; Pasupathy and Miller, 2005; Weissman et al., 2008). Another brain region, IPL, has also been reported in various decision-making tasks (Badre et al., 2005; Genovesio and Ferraina, 2004; Kuperberg et al., 2008; Muggleton et al., 2003; Tosoni et al., 2008). The thalamus is known to be involved in perceptual task (Sadaghiani et al., 2010). In this study also, the thalamus was strongly activated both in synchrony and asynchrony conditions. The thalamus did not show significant difference in the modulation of activity levels by the perception of synchrony and asynchrony (paired t-test, p=0.63). However, resolving effective connectivity patterns between the salient network and the thalamus would definitely add to the current understanding of salience information processing in the brain. However, the authors leave this computation for future research since the DCM analysis to resolve this connectivity pattern will be computationally expensive due to a large number of models that need to be solved for a connectivity of four nodes with inputs and modulations included per participant.
Finally, the authors provide evidence on how the nodes in the SN played their role in the decision-making process and implementation of goal-directed action. The INSs were found to a play an important role in the integration of sensory information. INSs also supply necessary information for the dACC to use for the selection of the appropriate response. The present results support the hypothesis that the dACC and INS are part of the task-set system involved in the decision-making process and that this mechanism is required during the performance of cognitively demanding goal-directed tasks.
Footnotes
Acknowledgments
The authors would like to thank Crystal Smith and Eli Goshorn for writing computer programs for the stimuli used in the experiment and Bhim M. Adhikari for data collection. They would also like to thank Dr. Karl Friston for his DCM-related suggestions and Kristen Quinn for reading and correcting the initial manuscript. This work was supported by the NSF career award (BCS 0955037) to M.D.
Author Disclosure Statement
There is no conflict of interest for any of the authors.