
Abstract
Working memory (WM) is often compromised after traumatic brain injury (TBI). A number of functional and effective connectivity studies investigated the interaction between brain regions during WM task performance. However, previously used WM tasks did not allow differentiation of WM subprocesses such as capacity and manipulation. We used a novel WM paradigm, CapMan, to investigate effective connectivity associated with the capacity and manipulation subprocesses of WM in individuals with TBI relative to healthy controls (HCs). CapMan allows independent investigation of brain regions associated with capacity and manipulation, while minimizing the influence of other WM-related subprocesses. Areas of the fronto-parietal WM network, previously identified in healthy individuals as engaged in capacity and manipulation during CapMan, were analyzed with the Independent Multiple-sample Greedy Equivalence Search (IMaGES) method to investigate the differences in information flow between healthy individuals and individuals with TBI. We predicted that diffuse axonal injury that often occurs after TBI might lead to changes in task-based effective connectivity and result in hyperconnectivity between the regions engaged in task performance. In accordance with this hypothesis, TBI participants showed greater inter-hemispheric connectivity and less coherent information flow from posterior to anterior brain regions compared with HC participants. Thus, this study provides much needed evidence about the potential mechanism of neurocognitive impairments in individuals affected by TBI.
Introduction
Working memory (WM) is defined as a process of holding and manipulating a certain amount of information on-line when it is no longer present in the environment (Narayanan et al., 2005). Engagement of WM depends on the amount of information one has to hold on-line (e.g., capacity) and on the manipulations that this information requires (e.g., mental arithmetic). Numerous neuroimaging studies have identified a fronto-parietal network of brain regions that appear to be engaged in WM tasks. This network includes the dorsolateral and ventromedial prefrontal cortex (DLPFC and VMPFC, respectively), the anterior cingulate cortex (ACC) and the posterior parietal cortex (Owen et al., 2005; Wager and Smith, 2003).
Traumatic brain injury (TBI) is associated with axonal sheering that compromises brain connectivity by preventing distal neurons from reaching their targets (Brown et al., 2008; Sharp et al., 2014). As a result, WM is often compromised after TBI (Bruce and Echemendia, 2003; McDonald et al., 2012). Functional magnetic resonance imaging (fMRI) studies aimed at detecting group differences between healthy individuals and individuals with TBI report increased blood oxygen level-dependent (BOLD) activation of the fronto-parietal network during WM tasks. This has been suggested to indicate compensatory recruitment of neural resources by individuals with TBI to achieve similar performance as healthy controls (HCs) (Maruishi et al., 2007; Turner and Levine, 2008).
Similarly, structural changes may lead to deficits in functional connectivity between brain regions, where functional connectivity is defined as “temporal correlations between spatially remote neurophysiological events” (Friston, 1994). For example, several fMRI studies showed that functional connectivity between the regions of the fronto-parietal network is altered in individuals with TBI as compared with healthy individuals (Hillary et al., 2011; Kasahara et al., 2011; Turner et al., 2011). However, while functional connectivity studies provide information regarding the joint activity of the WM network, the information about causal relationships between the WM regions is missing. Effective connectivity analyses can provide such information (Friston, 1994). Specifically, effective connectivity analysis can show how one region influences another during task performance (e.g., during information manipulation). Knowing the difference in causal relationships between the regions involved in a WM task can provide a dynamic description of how damaged neuronal mechanisms differ in TBI compared to HCs and potentially explain a specific WM performance deficit associated with TBI. This, ultimately, may lead to the development of targeted treatment strategies.
Previous investigation of WM effective connectivity in TBI examined the causal relationship between the brain regions during the n-back task (Hillary et al., 2011, 2014). While often used to study WM, the n-back task does not allow separating WM subprocesses such as capacity and manipulation (Narayanan et al., 2005; Veltman et al., 2003). Here, we report the results of an effective connectivity analysis in individuals with TBI and in HC during the CapMan WM task that, unlike other WM tasks (e.g., n-back), allowed us to differentiate brain regions that are specifically associated with capacity and manipulation processes of WM. The CapMan task consists of a capacity component that controls the amount of information subjects have to store in WM, and a manipulation component that indicates to participants whether and how the stored information should be manipulated. Previously, we showed that in HC participants, widespread clusters of ventromedial prefrontal, supplementary motor area (SMA; BA6), and inferior parietal regions were activated during the capacity condition of the CapMan task, while smaller and more focused clusters of the DLPFC (BA46), SMA, and inferior parietal lobule (IPL; BA40/7) were found to be engaged during information manipulation (Dobryakova et al., 2014).
This fMRI study describes the causal relationship between these brain regions during capacity and manipulation conditions of the CapMan task in healthy individuals and in individuals with TBI. Since WM differences between TBI and healthy individuals have been shown during increased WM demands (Kasahara et al., 2011; Perlstein et al., 2004), effective connectivity analysis was performed on data associated with high capacity and high manipulation conditions to further elucidate such differences.
We hypothesized that in comparison to HC participants, TBI participants will have different patterns of effective connectivity such that there will be more connections in TBI participants than in the HC participants. Such “hyperconnectivity” might be suggestive of inefficient information processing during high capacity and manipulation demands (Koch et al., 2006) or due to increased effort dedicated to a WM process (Price and Friston, 1999). In addition to revealing “hyperconnectivity” that might indicate differences in neural mechanisms associated with WM performance, the effective connectivity analysis will also show how information flow differs between HC and TBI individuals. To evaluate these differences in information flow, we used a Bayesian algorithm that established connections based on a search over a set of equivalent connectivity graphs estimated using conditional independence. Directionality of connections was then estimated using maximum-likelihood estimation and non-Gaussianity scoring of residuals obtained from applying the algorithm to BOLD time series (Linear non-Gaussian Orientation, Fixed Structure [LOFS]) (Mumford and Ramsey, 2014; Ramsey et al., 2010, 2011, 2014). These methods have been successfully used in language studies to delineate differences in causal relationships between left hemisphere cortical language regions (Boukrina and Graves, 2013; Boukrina et al., 2014), and to detect differences in information flow between patient populations and HCs (Hanson et al., 2013).
Materials and Methods
Participants
Fifteen HC participants (7 female) and 11 individuals with moderate to severe TBI (6 female) participated in the study. There were no between group differences in age (HC: M=30.13, SD=9.96; TBI: M=37.2, SD=10.3) or education (HC: M=16.13, SD=2.67; TBI: M=14.9, SD=1.97). Participants were at least 1-year postinjury (chronic stage), with moderate to severe TBI, according to the Glasgow Coma Scale or positive acute neuroimaging findings. All patients had closed TBI, that is, the damage was not localized to a specific brain area. Motor vehicle accident was the most commonly reported cause of injury. All participants had normal or corrected-to-normal vision, no history of drug abuse, or any neurological conditions (other than TBI, in the TBI group). The study was approved by the Institutional Review Board of the Kessler Foundation. Participants provided informed consent before participation in the experiment and were paid for their participation.
CapMan paradigm
The CapMan task has two difficulty levels of capacity and manipulation (high vs. low), creating a 2×2 design. Each trial of the CapMan task consisted of a start cue, a change cue, and a target stimulus. The Start cue defined the feature of the target stimulus participants had to attend to and served the purpose of loading the WM capacity. The Start cue parameters were drawn from six possible features that had two possible values, that is, “color” (red vs. blue), “case” (upper vs. lower case), “side” (left vs. right side of fixation point), “motion” (a field of dots in the background drifting either up or down), “sound” (vowel vs. consonant), and “typeface” (plain vs. italic) (Fig. 1a). The Start cue was presented for 5000 msec, followed by an inter-stimulus interval (ISI; 500 msec). The Change cue taxed manipulation demands of WM and was presented for 4000 msec followed by an ISI (1000 msec). Based on the information provided by the Change cue participants had to either maintain the same feature value presented during the Start cue (low manipulation) or to change to an opposite value (high manipulation). The target stimulus was presented after the Change cue and stayed on the screen for 2000 msec, followed immediately by a response screen (3000 msec) and the inter-trial interval (500 msec). Subjects had to decide whether or not the features in the target stimulus matched the Change cue. If the target stimulus matched the features updated by the Change cue, subjects were instructed to indicate a match. If the target stimulus did not match the features updated by the Change cue, subjects were instructed to indicate a mismatch.
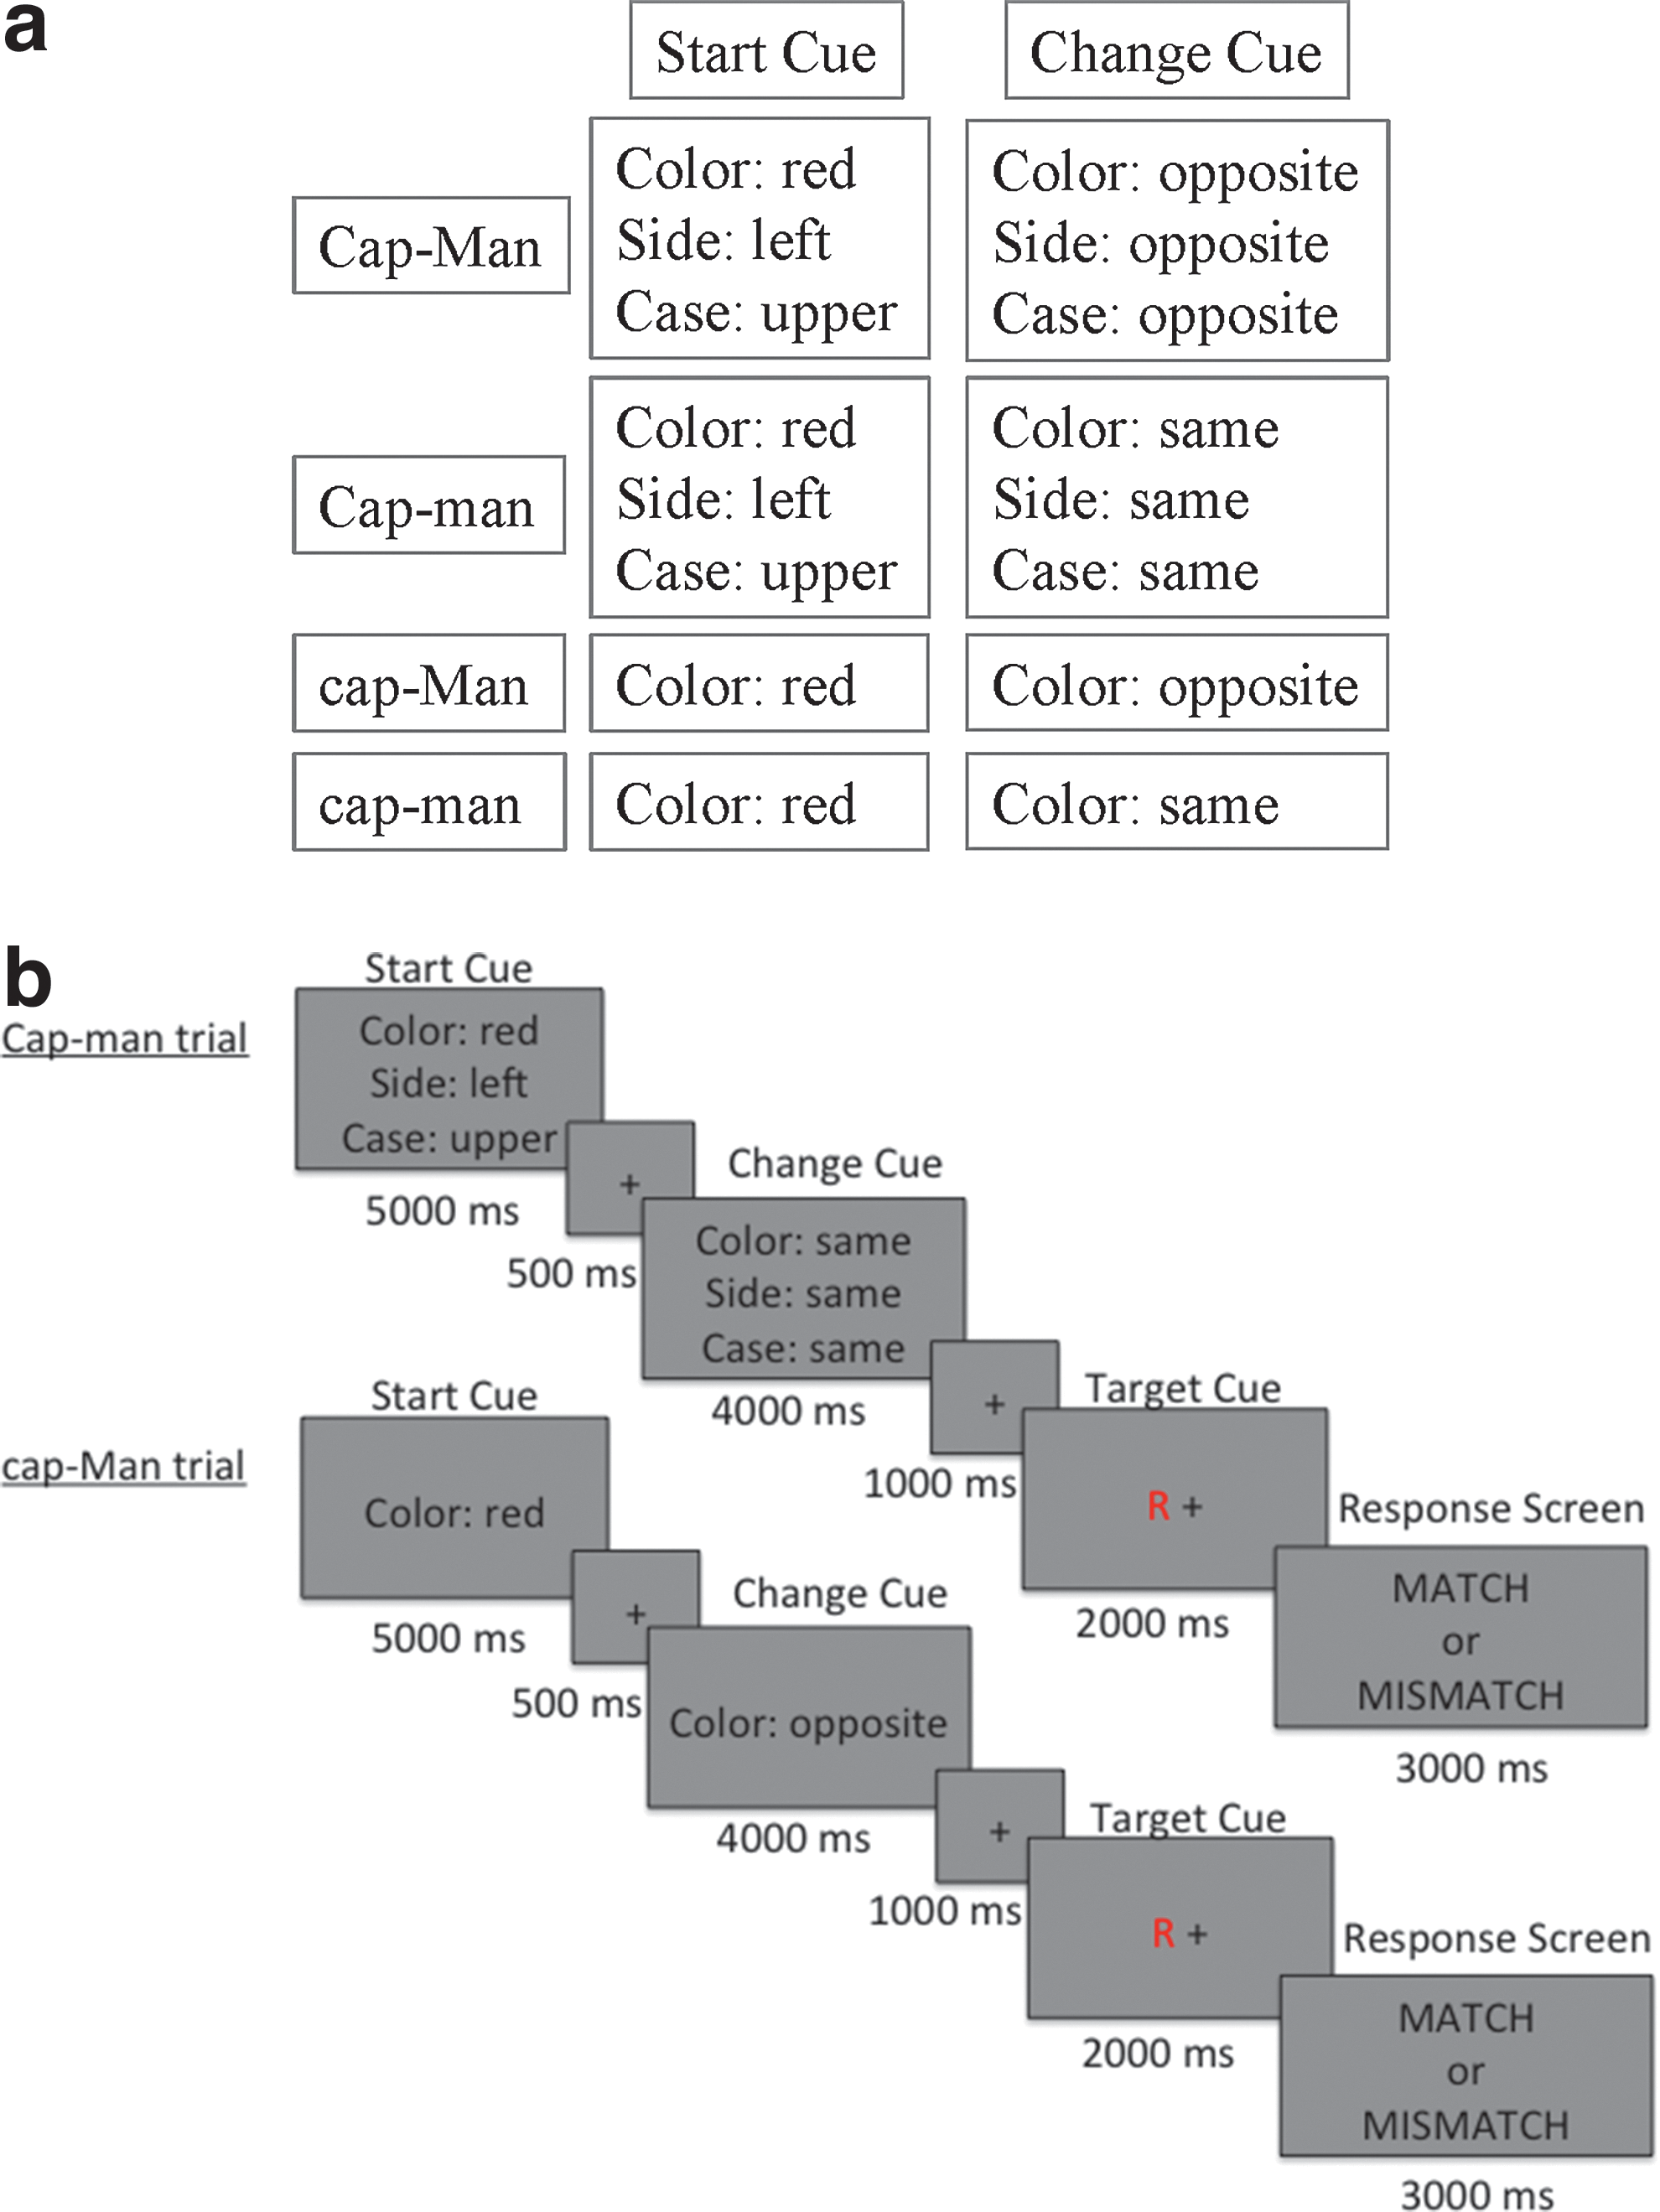
Each CapMan condition was run in a separate block in the scanner and was presented four times. There were four blocks of 64 sec followed by 22 sec of rest. Each task block was composed of four trials resulting in 16 total trials, each lasting 16 sec. The order of the blocks was counterbalanced across subjects and the task lasted ∼22.4 min. Each of the trials in the four task blocks was composed of one of the following four conditions (high capacity and manipulation: CAP-MAN; high capacity, low manipulation: CAP-man; low capacity, high manipulation: cap-MAN; low capacity and manipulation: cap-man) (Dobryakova et al., 2014). Figure 1b presents trials from the conditions used in the effective connectivity analysis: a high capacity-low manipulation (Cap-man) trial and low capacity-high manipulation (cap-Man) trial.
fMRI data acquisition
fMRI data were acquired with a 3T Siemens Allegra scanner. The paradigm was presented in the scanner in a blocked design using E-Prime software (Schneider et al., 2002). The stimuli were presented using a back-projection system in which the stimuli were displayed on a screen positioned at the end of the bore, which subjects viewed via a mirror that was mounted on the Siemens standard 8-channel head coil. Thirty-two contiguous slices of functional images were acquired using T2*-weighted pulse sequence for each run of the task. There were 185 acquisitions per run (TE=30 msec; TR=2000 msec; field of view=22 cm; flip angle=80°; slice thickness=4 mm, matrix=64×64, in-plane resolution=3.438 mm2). A T1-weighted pulse sequence was used to collect structural data (TE=4.38 msec; TR=2000 msec, FOV=220 mm; flip angle=8°; slice thickness=1 mm, NEX=1, matrix=256×256, in-plane resolution=0.859×0.859 mm).
fMRI data preprocessing
All images were preprocessed using Analysis of Functional NeuroImages (AFNI) (Cox, 1996). The first five images of each run were discarded to ensure steady state magnetization. The realignment, co-registration, and normalization were done in a single transform by calculating and saving the parameters necessary for realignment (i.e., the spatial co-registration of all images in each time series to the first image of the series) and multiplying this transformation matrix with the matrix needed to warp the data into standard space. The images were then smoothed, using an 8 mm Gaussian smoothing kernel, and scaled to the mean intensity. These data were used to compute group differences in patterns of connectivity.
Data analysis
Behavioral data
The error rate data were analyzed with an omnibus 2×2×2 analysis of variance (ANOVA) with group as a between-subjects factor, and capacity and manipulation as within-subjects factors. Error rate data for three TBI and two HC participants were lost due to technical difficulties. Therefore, data from 8 TBI and 13 HC subjects were used.
Effective connectivity data analysis
Effective connectivity analysis was performed using the Independent Multiple-sample Greedy Equivalence Search (IMaGES) and the LOFS. IMaGES establishes connections based on a search over a set of equivalent connectivity graphs estimated using conditional independence. It produces connectivity graphs with both directed and undirected connections. Both types of connections are causal, with the difference that the directionality of the undirected connections was not determined. IMaGES can be supplemented by LOFS postprocessor, which estimates the directionality of all connections using maximum-likelihood estimation and non-Gaussianity scoring of residuals obtained from applying the algorithm to BOLD time series LOFS (Mumford and Ramsey, 2014; Ramsey et al., 2010, 2011, 2014). As suggested by Ramsey et al. (2011) a combination of LOFS and IMaGES produces a greater number of oriented connections than IMaGES search alone with no loss of accuracy. The use of both of these methods together has been validated on 28 simulated datasets from a study by Smith et al. (2011). The algorithms produced accuracies of 90% on most of the Smith et al. datasets when recreating functional connections and accuracies of above 80% when directing connections (Smith et al., 2011). After initial preprocessing that included slice-time correction, smoothing, and spatial normalization, time series from the regions of interest (ROIs) previously identified as activated during capacity and manipulation conditions (Dobryakova et al., 2014) were analyzed with IMaGES and LOFS using Tetrad software, version 4.5. IMaGES algorithm establishes directed connections by searching in parallel over multiple datasets for the correct directed acyclic graph (DAG), that is, a graph with nodes connected by directed edges and no closed loop connections between any three nodes. The search is optimized by reducing the search space to equivalence classes, which consist of multiple DAGs with identical sets of conditional independence relations among the ROIs. For example, given three ROIs X, Y, and Z, X is independent of Z, and conditional on Y, when Y causes both X and Z (X←Y→Z), when X causes Y and Y causes Z (X→Y→Z), and when Z causes Y and Y causes X (X←Y←Z). These three patterns are, therefore, members of an equivalence class (for more details see Mumford and Ramsey, 2014). DAGs within an equivalence class have the same undirected connections and v-structures (two ROIs directed to a third ROI).
The search over equivalence classes of DAGs proceeds one connection at a time. Each time the algorithm chooses a connection that maximizes the Bayesian Information Criterion (BIC) score. BIC reflects maximum likelihood estimation of the model fit adjusted by model complexity (e.g., Ramsey et al., 2010). The BIC score from each subject is aggregated in determining what connections to choose. Connections are added until the BIC score stops improving. In the next step, the algorithm proceeds to remove connections via a similar method until the average BIC score cannot be improved. The resulting connectivity graph has both directed and undirected connections.
The final orientation, and in some cases reorientation, of connections was performed using LOFS algorithm (Rule 3) that determined directionality of all connections through selecting a graphical model whose residuals were most non-Gaussian. This step assumes that the errors for each ROI are independent and non-Gaussian, and that the sum of multiple independent and identically distributed non-Gaussian variables is more Gaussian than the individual variables themselves. Therefore, the regression residual of the variable X on a false orientation of its adjacent variables should be more Gaussian (because it is a weighted sum of the error term for X and the errors for the variables of misoriented connections), compared with a correct orientation, where the residual is just the error term for X (e.g., Ramsey et al., 2011). For high manipulation condition graphs, LOFS oriented all of the edges, which were left un-oriented by IMaGES in the HC group. For TBI patients, LOFS redirected 2 connections and oriented 2 additional connections produced by the IMaGES analysis. For high load condition graphs, IMaGES oriented only two of eight connections in the HC group, one of which was redirected by LOFS and the other preserved its orientation. All other connections were oriented by LOFS. For TBI patients in this condition, of the six oriented edges from IMaGES analysis LOFS reoriented only one connection, preserving directionality of the other five and additionally orienting four connections. The LOFS orientations were preferred due to non-Gaussianity of the data indicated by the Kolmogorov–Smirnov (K-S) test. The K-S test compared our data against a normal distribution sample, which we randomly generated using the same number of observations, mean and standard deviation measures as in our data. For both high manipulation and high capacity data, the K-S test was significant (p<0.0001) indicating the presence of non-Gaussian components in the data.
Results
Behavioral results
The 2×2×2 ANOVA showed a significant group by capacity by manipulation interaction: F(1,19)=6.22 (p<0.05). As we were specifically interested in the differences between HCs and TBIs under high load and high manipulation conditions, we performed planned contrasts that indicated HC participants performed significantly better than TBI participants when manipulation demands were high (t(19)=2.41, p<0.05, d′=1.02). However, TBI participants performed as well as HC when the capacity demands were high (t(19)=0.84, p=0.41, d′=0.38).
Effective connectivity results
Table 1 presents directed connections during the high capacity condition for HC and TBI participants. As can be seen from the effective connectivity graph (Fig. 2a), TBI participants had a greater number of connections than HC participants. That is, while TBI participants shared some connections with the HC participants, they had several extra connections that were absent from the connectivity results of HC participants. Moreover, some of the shared connections were reversed in TBI participants; for example, while the VMPFC exerted influence on the ACC activity in TBI participants, ACC exerted influence on VMPFC activity in HC participants. In addition, in HC participants there is a posterior to anterior flow of information between parietal and frontal brain regions. The graph shows that the left IPL serves as a posterior parietal hub in this network with outgoing connections to the right parietal, left temporal, and left frontal cortices. As information flow proceeds more anteriorly, there is a left to right transfer of activation among frontal and temporal regions.
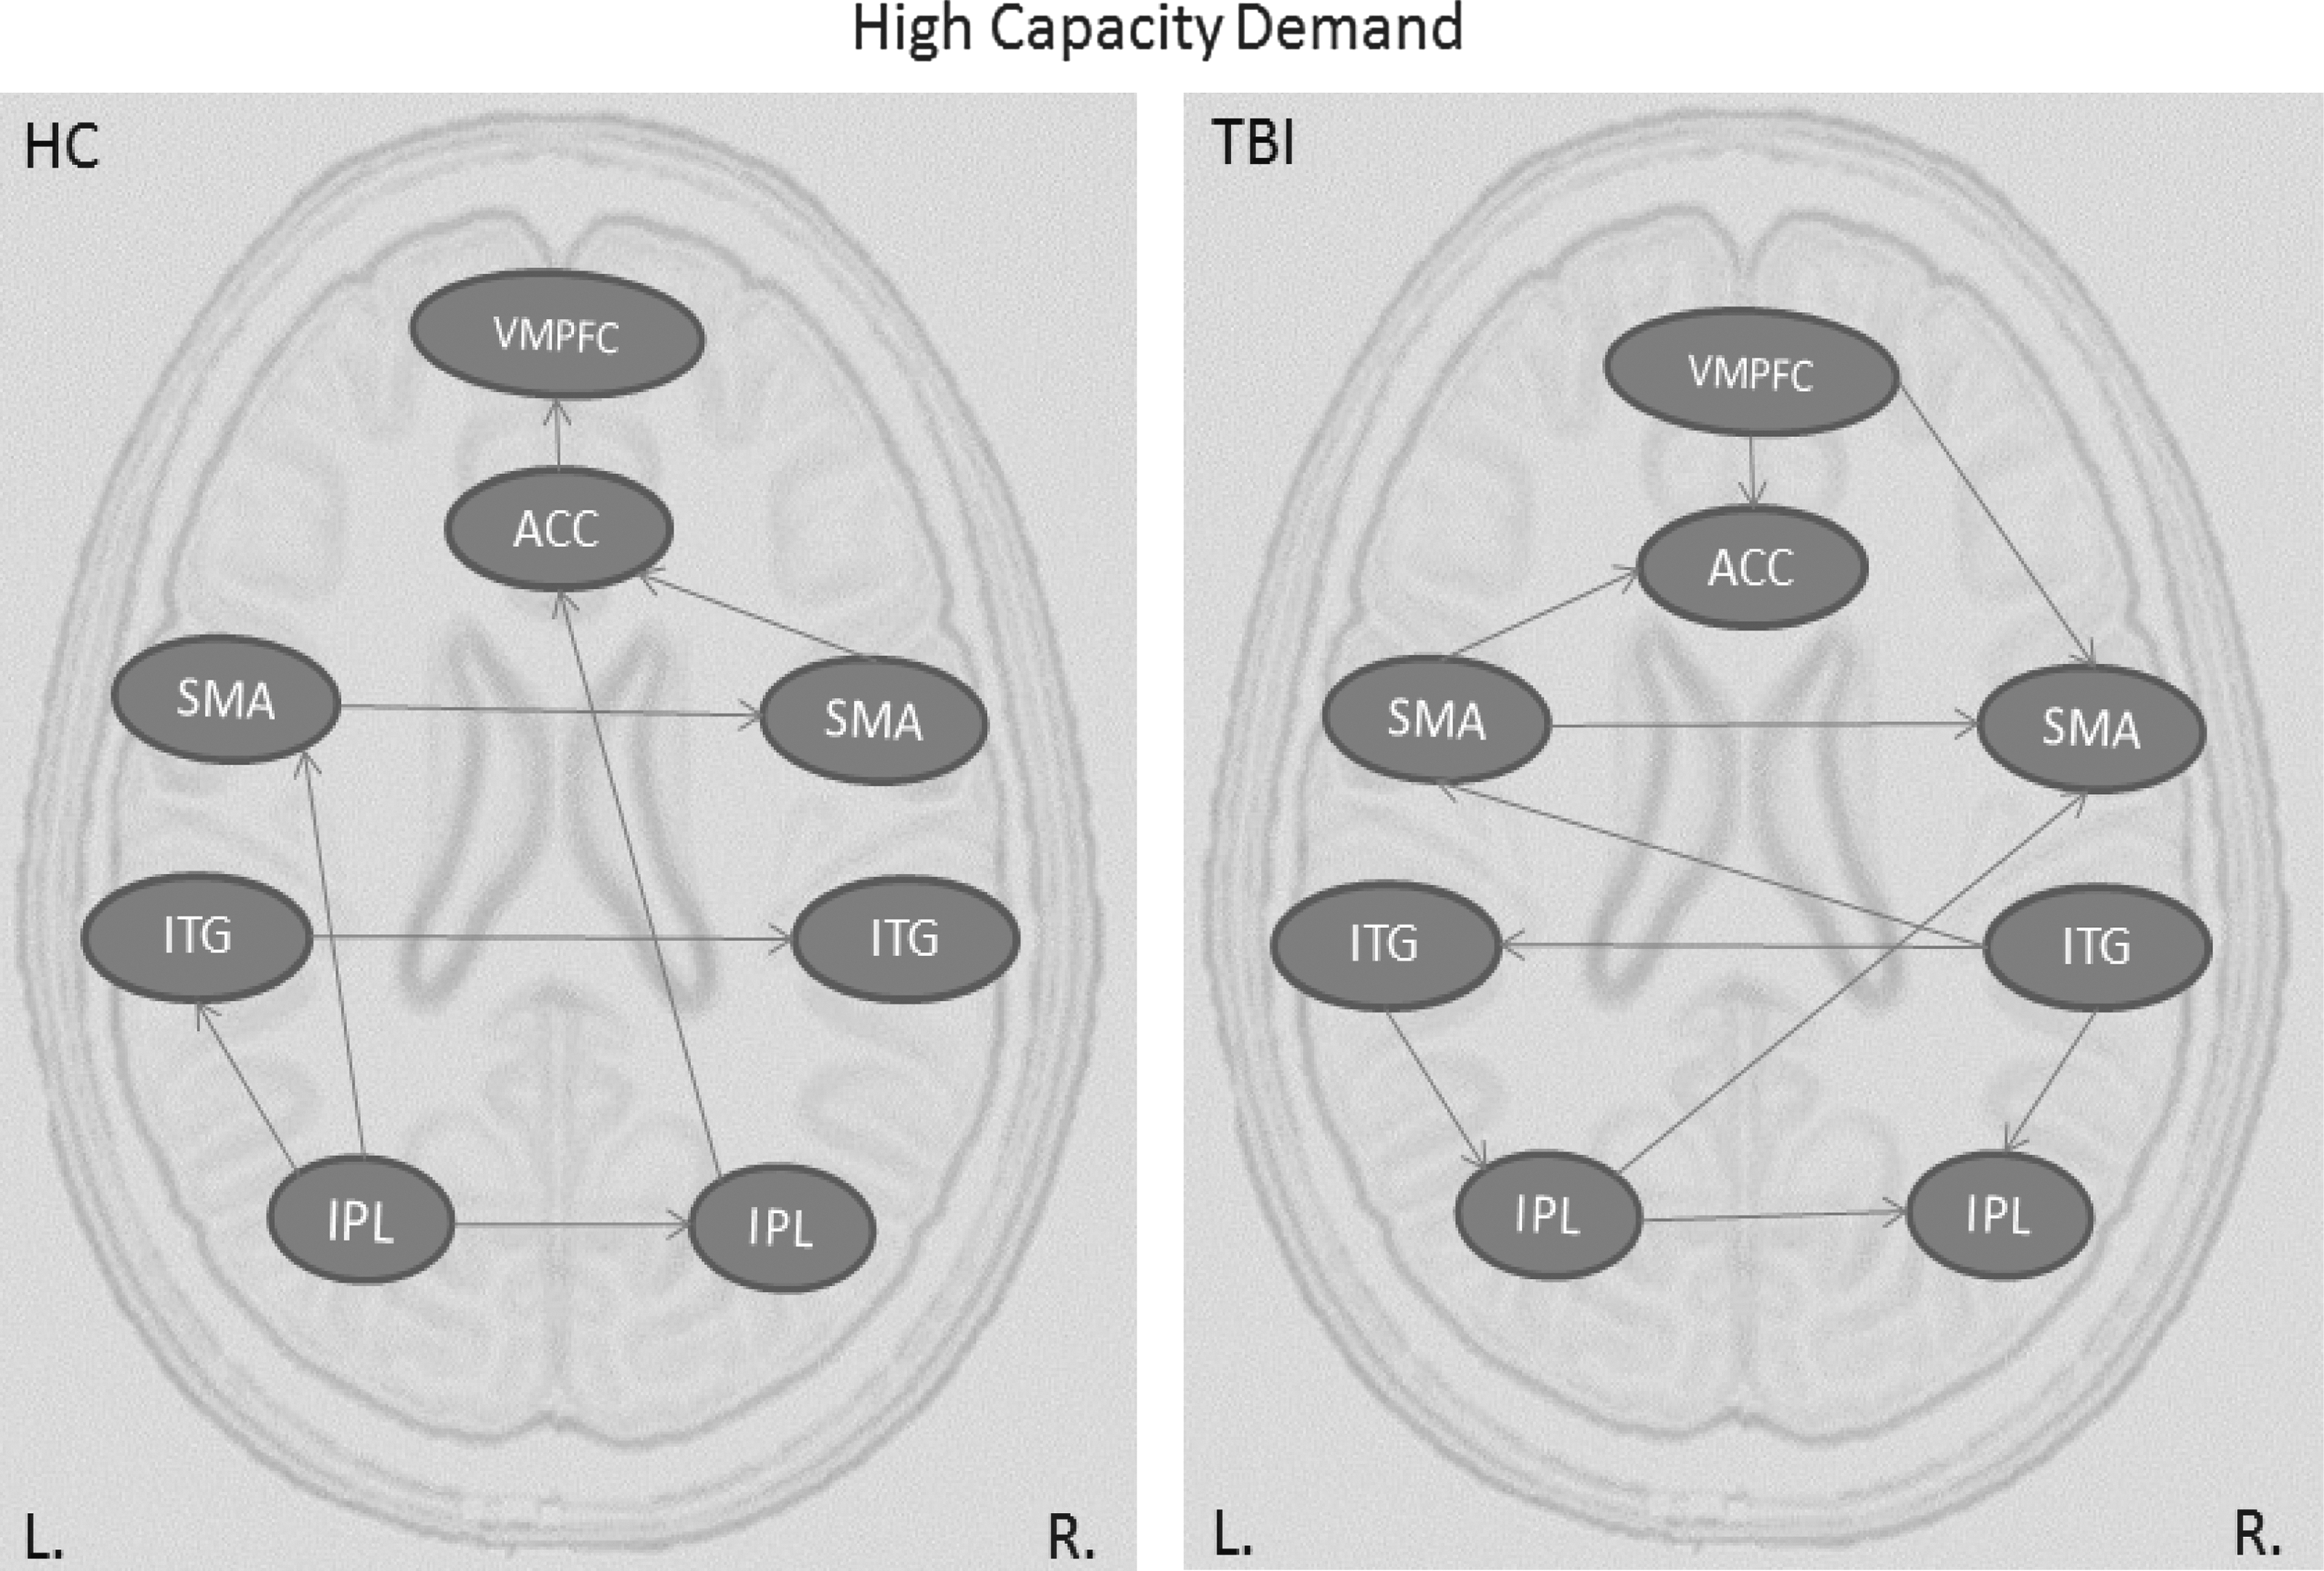
Effective connectivity graphs representing information flow during high capacity condition for HC and TBI groups. ACC, anterior cingulate cortex; HC, healthy control; IPL, inferior parietal lobule; ITG, inferior temporal gyrus; SMA, supplementary motor area; TBI, traumatic brain injury; VMPFC, ventromedial prefrontal cortex.
List of Causal Connections Between Regions Activated in the Healthy Control and Traumatic Brain Injury Groups During the High Capacity Condition in the CapMan Task
ACC, anterior cingulate cortex; HC, healthy control; IPL, inferior parietal lobule; ITG, inferior temporal gyrus; SMA, supplementary motor area; TBI, traumatic brain injury; VMPFC, ventromedial prefrontal cortex.
In contrast, TBI participants show increased inter-hemispheric transfer with almost double the number of connections between the left and right hemispheres relative to HCs. The pattern of connectivity is somewhat redundant and shows no clear directionality of informational flow. While the information appears to be transferred progressively more anteriorly, there are also reverse connections to more posterior brain regions. For example, the connections from the left and right inferior temporal gyrus to left and right IPL, or the connection from VMPFC to right SMA and to ACC.
Similar to connectivity results of the high capacity condition, TBI participants had more connections than HC during the high manipulation condition (Table 2). Moreover, the pattern of connections is radically different in TBI participants than in HC participants (see Figure 3). Specifically, in the HC group, there is a hierarchical structure with a hub in the left insula, which influences both the more anterior (the DLPFC) and the more posterior regions (the SMA and IPL); in TBI participants, the insula receives inputs via two loops both originating in the SMA: SMA to DLPFC to Insula and SMA to IPL to Insula. This pattern of connectivity again is suggestive of redundant connectivity.
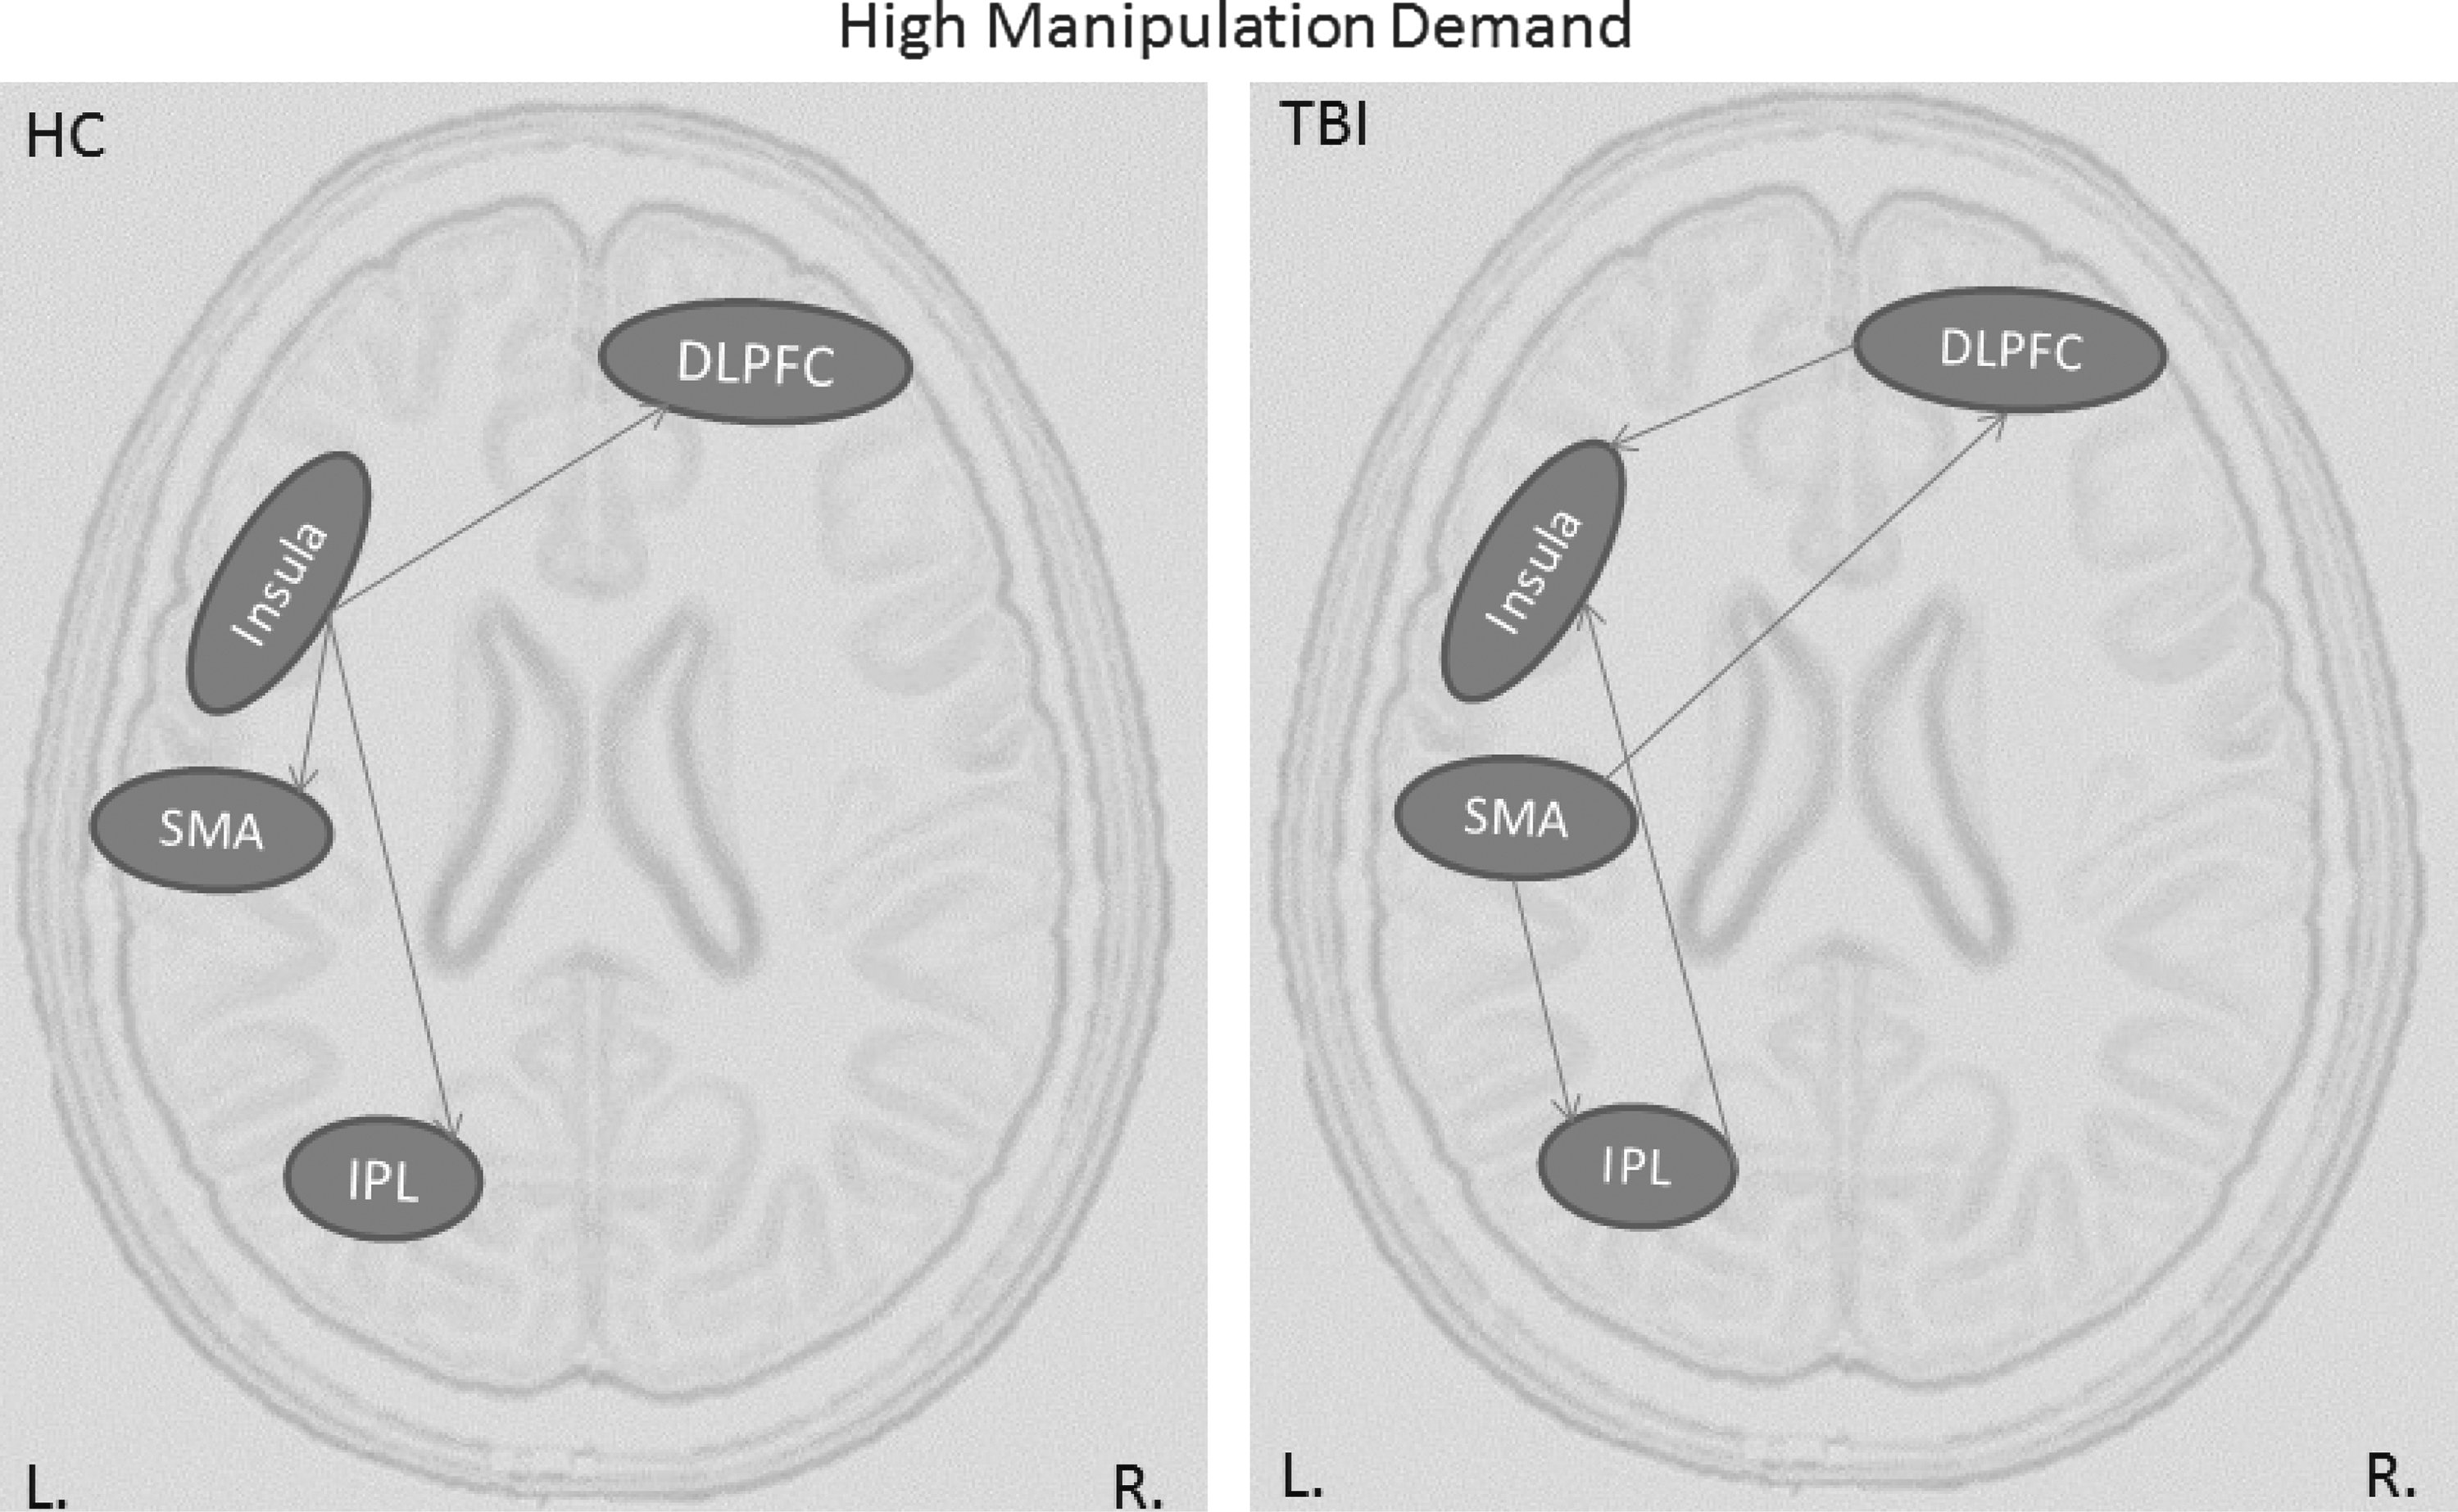
Effective connectivity graphs representing information flow during high manipulation condition for HC and TBI groups. DLPFC, dorsolateral prefrontal cortex.
List of Causal Connections Between Regions Activated in the Healthy Control and Traumatic Brain Injury Groups During the High Manipulation Condition in the CapMan Task
DLPFC, dorsolateral prefrontal cortex.
The IMaGES algorithm searches over the dimension of the graphical structure, but assumes that each graph can be parameterized differently across participants (Mumford and Ramsey, 2014). The model provides estimates of linear coefficient parameters and standard errors using Gaussian distribution theory for each participant, with the caveat being that the underlying latent variables that give rise to the estimated patterns of effective connectivity (e.g., synaptic activity giving rise to BOLD signals) are nonlinear, collective, and interactive (Ramsey et al., 2011). A larger coefficient indicates greater strength of the connection between the two regions. On the network level, some connections are de-emphasized during task performance, while other connections, represented by larger coefficients, account for most of the information processing.
Our analysis of connectivity coefficients revealed systematic group differences. Specifically, significant differences were found between connection strengths of the ACC and the left VMPFC (t(24)=4.96, p<0.001), between the left and right IPL (t(24)=2.88, p<0.01), and between the left IPL and the left SMA (t(24)=4.52, p<0.001), with the HC group having higher mean connection coefficients between these regions than the TBI group.
Discussion
This study is the first to provide data-driven evidence about causal relationships between the regions of the fronto-parietal network in individuals with TBI and healthy participants during a novel WM task. The novel WM task, CapMan, allowed us to delineate network nodes specifically engaged during high capacity and high manipulation demands, which is not possible with other more commonly used WM tasks, such as the n-back task (Bledowski et al., 2010; Narayanan et al., 2005). Our analysis of effective connectivity in TBI and HCs revealed distinct patterns of causal interactions between brain areas activated during storage and information manipulation in WM. Supporting the distinct role of these components in WM, we showed that both capacity and manipulation conditions produced distinct patterns of connectivity in the HC and the TBI groups. Increased inter-hemispheric connectivity and less pronounced directional flow of information in the high capacity condition may reflect suboptimal processing in TBI. Specifically, greater cortical connectivity may stem from increased involvement of compensatory strategies due to long-range white matter tract injury known to occur in TBI (e.g., Brown et al., 2008). The information manipulation condition produced engagement of multiple routes in accessing the left insula, an area associated with sustained attentional processing in healthy participants (e.g., Dosenbach et al., 2008). This pattern of connectivity was associated with a behavioral finding of poor accuracy in this condition for individuals with TBI as compared to HCs.
To our knowledge there are only two effective connectivity studies that looked at the causal relationships between regions during WM performance in individuals with TBI. Both studies utilized the n-back task and did not look specifically at network dynamics during capacity and manipulation (Hillary et al., 2011, 2014). Specifically, Hillary et al. (2011) looked at differences between HC and TBI individuals and how the brain regions communicate during WM task performance. They were specifically interested in how connectivity changes from early to late task performance given the parametric change in load of the n-back task. This investigation showed that individuals with TBI had greater within-right hemisphere connectivity, with the influence of right parietal lobule influencing other brain regions, while within the HC sample the left parietal lobule was performing a similar role. Another study by Hillary et al. (2014) focused on effective connectivity during the 2-back task. Specifically, this study examined how the network dynamics changed from before to after practice of the 2-back task that occurred outside of the scanner. The effective connectivity analysis revealed differences in connectivity from before to after a short practice participants performed in the middle of the two scans, such that connectivity between the frontal and parietal regions increased after practice, suggesting learning. Broadly speaking, the study by Hillary et al. (2011) showed similar increased connectivity in the TBI group as is shown by the findings reported here. However, it is hard to compare this study to the ones conducted by Hillary et al., (2011, 2014) since these investigations differ in the task that has been used, method used to determine causal connections, in how the ROIs were selected and in actual ROIs. Thus, our results represent a novel finding and contribute to the scarce literature of task-related effective connectivity in patients with TBI (Hillary et al., 2011, 2014).
Effective connectivity–behavior relationship
We performed the effective connectivity analysis on the ROIs previously identified to be engaged in capacity and manipulation conditions of the CapMan task (Dobryakova et al., 2014). Our results showed differences in patterns of effective connectivity between HC and TBI participants during both high capacity and high manipulation demands. Some of these connectivity differences were found in conjunction with differences in the patients' and HCs' behavioral performance.
During the high capacity demand condition, the TBI group attained performance levels similar to HCs, however, they did so using very different neural strategies. This is reflected in a greater number of inter-hemispheric connections between the network nodes in the TBI group in conjunction with the absence of accuracy differences. A greater number of connections between network nodes might suggest that increased effort is required to maintain task performance (Price and Friston, 1999). Therefore, our connectivity results suggest that the TBI group used additional neural resources, which in the case of high capacity condition, allowed them to sustain a level of performance comparable to HCs.
During the high manipulation condition, the pattern of connectivity in the TBI group appears to be radically different. According to the connectivity graph of the HC group, the insula influences activity of other regions and appears to be a main hub from which information is transferred to other brain regions during task performance. Such pattern of information transfer is consistent with the functional role attributed to the insula as being a part of the control/core network and showing sustained activity throughout task performance (Dosenbach et al., 2007, 2008). In contrast to the HC group, the TBI group used two separate routes to transfer information from the SMA to the insula. Such a connectivity pattern might lead to the performance differences we detected during high manipulation demands between the TBI and HC groups. Indeed, our results are consistent with previous findings from the TBI literature, showing impairments during high manipulation demands and differences in activity of the regions of the fronto-parietal network in individuals with TBI (e.g., Perlstein et al., 2004). This decrement in performance shown by the TBI group when manipulation demands were high may result from the more disorganized flow of information seen in the effective connectivity results reported here.
Connection strength
The results of the effective connectivity analysis revealed that several regions within the fronto-parietal network have stronger connections in the HC group than in the TBI group. It is difficult to interpret this result in terms of behavioral processes because it simply reflects the statistical fit of the model. However, we speculate that stronger connections from the left to the right IPL and from the ACC to the VMPFC suggests more efficient bottom-up processing/transfer of information in the HC group compared to the TBI group. Similarly, during the high manipulation demand, the HC group had stronger connection strengths between the insula and DLPFC and the insula and IPL than the TBI group. This may reflect more efficient information transfer in the HC group relative to the TBI group.
Network hyperconnectivity
Our results of increased interconnectedness between network nodes during high capacity and high manipulation demands parallel several other functional and effective connectivity studies that also report hyperconnectivity of brain regions in individuals with TBI (Hillary et al., 2011; Palacios et al., 2013; Turner et al., 2011). Moderate to severe TBI is associated not only with immediately apparent cognitive deficits but also with progressive degeneration that is due to DAI following brain trauma (Brown et al., 2008; Povlishock and Katz, 2005), a condition specifically affecting brain connectivity and thought to be one of the major contributors to neurocognitive dysfunction following TBI (e.g., Kumar et al., 2009). Studies using Diffusion Tensor Imaging (DTI) show decreased white matter integrity in both children (e.g., Wilde et al., 2012) and adults (e.g., Benson et al., 2007; Kraus et al., 2007; Kumar et al., 2009) with chronic TBI. However, DTI is not suitable for detecting functional changes. Therefore, analyses of BOLD data constitute an effective method of uncovering shifts in cognitive processing that follow TBI. Moreover, the effective connectivity analysis (unlike General Linear Model analysis) provides a dynamic representation of information flow during task performance and is particularly suitable to detect neural differences between the TBI and HC groups.
Future studies should explore how improving capacity and manipulation abilities in individuals with TBI effects the causal interaction after WM training. In addition to the fronto-parietal network involvement, the basal ganglia has been shown to play a key role in WM training (e.g., Dahlin et al., 2008; Jolles et al., 2010; Kühn et al., 2013) and should exert significant influence on other brain regions, given its vast anatomical connections with the areas of the prefrontal cortex (Levy et al., 1997). The basal ganglia were not included as an ROI in this study since basal ganglia activity was not observed during the original CapMan study (Dobryakova et al., 2014). There are several potential explanations for why the basal ganglia activity was not observed. Specificlaly, the absense of basal gangia activity might be due to the fact that our study was not designed as a training study; as mentioned above, the basal ganglia plays a key role in WM training (e.g., Dahlin et al., 2008; Jolles et al., 2010; Kühn et al., 2013). Similarly, we did not examine the time course of the basal ganglia activity from the beginning to the end of the task because we were not interested in time course differences between the first and the second half of the task. Further, since a blocked rather than event-related design was utilized, we were not able to look at activation and connectivity associated with correct vs. incorrect responses, a contrast where more basal ganglia activation might be observed (e.g., Satterthwaite et al., 2012). Another potential explanation is the type of coil used during data acquisition, since it has been shown that 32-channel coil significantly improves the detectability of connectivity between cortico-striatal networks relative to the standard head-coil used in this study (Anteraper et al., 2013).
Conclusion
This study is the first to provide data-driven evidence about causal relationships between the regions of the fronto-parietal network in individuals with TBI and healthy participants during performance of the CapMan WM task. The CapMan task allowed us to delineate network nodes specifically engaged during capacity and manipulation demands, which is not possible with other more commonly used WM tasks, such as the n-back task (Bledowski et al., 2010; Narayanan et al., 2005). The TBI group showed hyperconnectivity when both capacity demands were high and when manipulation demands were high compared with HCs. However, poor accuracy was observed only during high manipulation demands. These findings indicate that TBI participants may activate the nodes associated with WM differently from HCs even when performance is matched across the groups. Our results represent a novel finding and contribute to the scarce literature of task-related effective connectivity in patients with TBI (Hillary et al., 2011, 2014).
Footnotes
Acknowledgments
This project was supported by grants from the Kessler Foundation and from the National Institutes of Health (1R42NS050007-02 to Dr. Randall Barbour).
Author Disclosure Statement
No competing financial interests exist.