
Abstract
The utility and success of resting-state functional connectivity MRI (rs-fcMRI) depend critically on the reliability of this technique and the extent to which it accurately reflects neuronal function. One challenge is that rs-fcMRI is influenced by various sources of noise, particularly cardiac- and respiratory-related signal variations. The goal of the current study was to evaluate the impact of various physiological noise correction techniques, specifically those that use independent cardiac and respiration measures, on the test–retest reliability of rs-fcMRI. A group of 25 subjects were each scanned at three time points—two within the same imaging session and another 2–3 months later. Physiological noise corrections accounted for significant variance, particularly in blood vessels, sagittal sinus, cerebrospinal fluid, and gray matter. The fraction of variance explained by each of these corrections was highly similar within subjects between sessions, but variable between subjects. Physiological corrections generally reduced intrasubject (between-session) variability, but also significantly reduced intersubject variability, and thus reduced the test–retest reliability of estimating individual differences in functional connectivity. However, based on known nonneuronal mechanisms by which cardiac pulsation and respiration can lead to MRI signal changes, and the observation that the physiological noise itself is highly stable within individuals, removal of this noise will likely increase the validity of measured connectivity differences. Furthermore, removal of these fluctuations will lead to better estimates of average or group maps of connectivity. It is therefore recommended that studies apply physiological noise corrections but also be mindful of potential correlations with measures of interest.
Introduction
Resting-state functional connectivity MRI (rs-fcMRI) is a potentially powerful tool to measure functional connections in the brain (Biswal et al., 1995; Fox and Raichle, 2007). Use of this technique has virtually exploded in the past few years (Birn, 2012), and it has been applied to map alterations in the functional organization of the brain in a range of mental disorders (Greicius, 2008). However, the utility and success of rs-fcMRI for both clinical interventions and neuroscience discoveries depend critically on the reliability of this technique and the extent to which it accurately reflects neuronal function. Ultimately, an important goal of rs-fcMRI, and fMRI in general, is not only to understand group differences in brain activity and connectivity, but also to understand the alterations in functional brain organization within an individual subject. This goal places particularly high demands on the reliability and accuracy of these techniques.
Several recent studies have evaluated the test–retest reliability of rs-fcMRI (Birn et al., 2013; Braun et al., 2012; Guo et al., 2012; Patriat et al., 2013; Shehzad et al., 2009; Song et al., 2012; Wang et al., 2011; Zuo et al., 2010a,b). While higher level measures, such as graph theory metrics, are generally quite robust (Braun et al., 2012), individual differences in functional connectivity strength were found to be high for intrasession comparisons, but only low to moderate for intersession comparisons (Birn et al., 2013; Patriat et al., 2013; Shehzad et al., 2009).
The challenge is that fMRI, and rs-fcMRI in particular, is influenced by various sources of noise. Estimates of functional connectivity from resting-state fMRI are based upon the correlation of low-frequency fluctuations in the fMRI signal. This signal, in turn, is not directly a measure of neuronal activity but rather reflects the blood oxygenation changes associated with the blood flow changes in response to neuronal activation. Brain areas that show synchronized variations in MRI signal are interpreted as showing synchronized variations in brain activity, and are thus said to be functionally connected. However, there are a variety of other reasons why regions of the brain show synchronized fluctuations. For example, subject head motion, heartbeat, and breathing all produce synchronized variations in MRI signal across certain parts of the brain, or even the whole brain (Birn et al., 2006; Chang et al., 2009; Dagli et al., 1999; Power et al., 2012; Shmueli et al., 2007; Van Dijk et al., 2012). More specifically, the pulsatile blood flow due to the heartbeat can lead to fluctuations in MRI signal intensity in arteries, arterioles, and other large vessels largely due to inflow effects (Dagli et al., 1999).
The motion of the chest wall with respiration results in magnetic field changes that can distort the image and lead to further signal intensity changes (Raj et al., 2001). This effect is particularly problematic at higher magnetic field strengths, which are becoming increasingly popular (Bianciardi et al., 2009; van Gelderen et al., 2007). Variations in arterial CO2, resulting from alterations in the depth and/or rate of breathing that occur normally during rest, can result in blood flow changes throughout the brain, but particularly in gray matter and other highly vascularized regions of the brain (Birn et al., 2006; Wise et al., 2004). All of these cardiac- and respiration-related spatially synchronized signal fluctuations can lead to both false-positives and false-negatives in functional connectivity estimates.
A number of correction techniques have been developed to reduce the influence of these variations. One common approach is to model fMRI signal changes using independent measures of the heartbeat and respiration, for example, using a pulse oximeter and/or a respiration belt (Birn et al., 2006; Chang et al., 2009; Glover et al., 2000). These techniques have been shown to account for various fractions of the noise. However, the impact of these preprocessing techniques on the test–retest reliability of rs-fcMRI has not yet been systematically evaluated. The goal of this study was to determine the impact of various physiological (specifically cardiac and respiration) noise correction techniques on the test–retest reliability of measuring individual differences in functional connectivity strength.
This study evaluated not only techniques aimed at reducing fluctuations at the primary cardiac and respiratory frequencies and their harmonics, such as RETROICOR (Glover et al., 2000), but also correction techniques aimed at reducing the effect of variations of heart rate and respiration volume per time changes, which tend to occur at much lower frequencies that overlap closely with the low frequencies used to estimate resting-state functional connectivity, were determined. More specifically, techniques that model cardiac- and respiration-related signal changes were investigated using an independent measure of heartbeat and respiration—RETROICOR (Glover et al., 2000), RVTcor (Birn et al., 2006), RVHRcor (Chang et al., 2009), as well as variants of RVTcor—including the derivative of the RVT time course (RVT-deriv), which includes 2-lagged versions of the RVT (RVT-2) or 8-lagged versions of the RVT (RVT-8) (Bianciardi et al., 2009).
This study also compared these respiration volume and heart rate corrections against two of the most common correction techniques where nuisance regressors are derived from the data—the inclusion of average white matter and cerebrospinal fluid (CSF) time courses (Jo et al., 2010), and the inclusion of average white matter, CSF, and global (whole brain) signals (Fox et al., 2005; Greicius et al., 2003). These latter two techniques have been suggested as a substitute for physiological noise correction that requires independent measurements of the heartbeat and respiration. Our initial hypothesis was that these correction techniques would reduce noise and thus improve the reliability of estimating the strength of functional connectivity. Furthermore, this study wanted to determine the impact of these corrections on the variance across time within each subject, as well as the specificity of localizing activation areas in gray matter regions while reducing the correlation to areas unlikely to be truly connected.
Materials and Methods
Participants and fMRI data acquisition
Written informed consent was obtained from subjects before each scanning session in accordance with a University of Wisconsin–Madison IRB-approved protocol. Twenty-four healthy adults (10 females; 35.5±17.7 years of age on average) with no history of neurological or psychological disorders were scanned three times. Two of these three resting-state scans were acquired on the same day, whereas the remaining scan was acquired an average of 3 months later. All the scans were acquired using a 3 T GE scanner (MR750; General Electric Medical Systems, Waukesha, WI). Each functional scan was 10 min in length and acquired with the same echo planar imaging (EPI) sequence (TR=2.6 sec, TE=25 msec, flip angle=60 degrees, FOV=224 mm×224 mm, matrix size=64×64, slice thickness=3.5 mm, number of slices=40).
Subjects were instructed to relax and lie still in the scanner while remaining “calm, still, and awake” and keeping their eyes open with their gaze fixated on a cross back-projected onto a screen via an LCD projector (Avotec, Inc., Stuart, FL). Subjects were allowed to blink if necessary. T1-weighted structural images were acquired before the functional images using an MPRAGE sequence with the following parameters: TR=8.13 ms, TE=3.18 ms, TI=450 ms, flip angle=12 degrees, FOV=256 mm×256 mm, matrix size=256×256, slice thickness=1 mm, number of slices=156. The dataset for this study is a subset (only the “eyes fixate” condition) of the data used in two of our prior publications (Birn et al., 2013; Patriat et al., 2013).
Data preprocessing
All functional data were processed in AFNI, unless otherwise indicated, and the specific AFNI programs used for each processing step are given in parentheses (Cox, 1996). First, rigid-body volume registration was implemented to reduce the influence of subject motion (3dvolreg, 4th volume as the base image volume for registration). Following this, a physiological noise reduction algorithm was implemented to reduce the physiological noise introduced by the respiration and cardiac cycles. As the goal of the current study was to evaluate the influence of physiological noise correction on the reliability of rs-fcMRI, one of seven different physiological noise correction algorithms was applied.
1. No physiological correction
2. RETROICOR (RC) (Glover et al., 2000)
3. RC+respiration volume per unit time (RVT) (Birn et al., 2006)
4. RC+dual-lagged RVT (RVT-2) (Biancardi et al., 2009)
5. RC+eight-lagged RVT (RVT-8) (Biancardi et al., 2009)
6. RC+RVT+derivatives of RVT (RVTDeriv) (Biancardi et al., 2009)
7. RC+respiration volume and heart rate correction (RVHR) (Chang et al., 2009).
For RETROICOR (correction #2, above), the phase of the cardiac and respiratory cycle at which each image was acquired was estimated using custom-written software in C. The sines and cosines of these phases, and two times these phases, were regressed out of the data on a slice-by-slice basis (3dZcutup, 3dDeconvolve, and 3dZcat). For the RVT correction performed in correction #3, the RVT time course was convolved with the respiration response function (RRF) (Birn et al., 2008) and shifted in 41 steps at 1 sec increments from −20 to +20 sec. The resultant RVT waveform with the best fit in each voxel was regressed out (3dTstat, 3dcalc, and 3dDeconvolve). For the RVT2 correction (#4, above), the RVT was convolved with the RRF and two shifted versions, at −9 and +9 sec, were fit to the data and regressed out (3dDeconvolve). A similar procedure was used for the RVT8 correction (#5, above), but with shifts at −24, −18,−12, −6, 0, +6, +12, and +18 sec. RVHR corrections (#7, above) were performed using Matlab code provided by C. Chang. In addition to these physiological noise correction techniques, two common nuisance regression strategies that derive nuisance regressors from the data were evaluated: 8. average white matter and CSF signal 9. average white matter, CSF, and global signal
Average white matter and CSF signals were obtained by first creating masks of white matter and CSF using FSL's FAST program, eroding these masks by one voxel in each dimension (2×2×2 mm3), and then averaging the EPI time series data over these regions of interest.
The variance explained by each of these nine correction routines was evaluated by computing the fractional reduction in signal variance, R
2:
EPI time series were aligned to their T1-weighted anatomical (align_epi_anat.py) (Saad et al., 2009) and then transformed to Talairach atlas space (Talairach and Tournoux, 1988) in a single interpolation to 2×2×2 mm3 voxels. Finally, EPI time series were temporally filtered (band pass: 0.001 Hz<f<0.01 Hz) and spatially smoothed with a 3D Gaussian kernel (FWHM=6 mm) (3dBandpass).
Motion
Resting-state functional connectivity measures can be significantly affected by subject motion (Jo et al., 2013; Power et al., 2012, 2014; Satterthwaite et al., 2012, 2013; Van Dijk et al., 2012; Yan et al., 2013). Therefore, the volume-to-volume displacement (Satterthwaite et al., 2012; Van Dijk et al., 2012) was examined. Specifically, the volume-to-volume motion was assessed using the sum squared difference (SSD) of consecutive motion parameter estimates,
Where i and j are two consecutive time points (EPI volumes), and x, y, z, α, β, and γ are the six parameters of motion (three translations and three rotations). Rotations were converted from degrees to millimeters by computing the displacement of a point on a sphere of 57 mm radius, which is approximately the distance from the center of the brain to the cortex (Jones et al., 2008; Kennedy and Courchesne, 2008). Time points were censored whenever SSD estimates exceeded 0.2 mm (Power et al., 2012).
A two-way analysis of variance was then run for each of the methods of estimating motion, also including the number of time points censored out. The two ways correspond to subjects and scans. Subjects were not found to move significantly more from one scan to the next (p=0.47 for SSD). No significant difference was found in the amount of time points censored out across scans (p=0.055).
Functional connectivity
Functional connectivity measures were computed using a region of interest–based approach (Biswal et al., 1995). A total of 180 seed regions were evaluated. Of these 180 regions, 159 seed regions (5 mm radius) were taken from Dosenbach and associates (2010). These regions encompassed motor, visual, fronto-parietal, cingulo-opercular, default-mode, and cerebellar functional networks. To get a denser sampling of subcortical and affective functional regions, a particular interest in our lab and those of our close collaborators, 21 seed regions (6 mm radius) in brain areas involved in affect processing according to Cisler and colleagues (2013) were additionally defined.
The preprocessed resting-state fMRI signal was averaged over each of these seeds. Functional connectivity matrices were generated for each of the subject's 27 (3 scans and 9 processing choices) scans by computing regressions pairwise over all of the seeds. The Pearson correlation coefficient and t-statistic from each regression was converted into a Z-score via the Fisher Z transform (Zar, 1996) to create a 180×180 matrix of Z-scores of which the upper right triangle represents the 16,110 unique connections.
To further visualize the impact of various noise correction techniques, we computed the voxel-wise functional connectivity between each seed region and all other voxels in the brain. The Pearson correlation coefficients in the resulting statistical parametric maps were converted to Z-scores via the use of the Fisher Z transform (Zar, 1996). Paired t-tests were performed on these Z-score maps to determine the differences between the correction methods.
Test–retest reliability
The test–retest reliability of fMRI studies has previously been assessed using the intraclass correlation coefficient (ICC) introduced by Shrout and Fleiss in 1979 (Birn et al., 2013; Braun et al., 2012; Li et al., 2012; Patriat et al., 2013; Shehzad et al., 2009; Shrout and Fleiss, 1979; Thomason et al., 2011; Zuo et al., 2010a). This measure compares the within-subject (intrasubject) variability in functional connectivity strength across experimental repeats (e.g., different imaging runs or sessions), to the between-subject (intersubject) variability in functional connectivity strength. A connection with high test–retest reliability would have a small intrasubject variability across sessions compared to the intersubject variability. Our study consisted of three scans in each subject. Two scans were collected in separate runs in the same session (separated by about 30 min), while the third scan was collected approximately 3 months later. This allowed us to assess both intra- and intersession reliability. Let MSb be the mean square between subjects and MSw the mean square within subject. The ICC based on single measurements using a random effects model is defined by
For each of the 16,110 unique connections (180 seeds), an n×k matrix of Z-scores was created with rows as subjects (n=24) and columns as scans (k=3). ICCs were calculated for matrices with “intrasession” scans (i.e., scans 1 and 2, which were obtained during the same scanning session) as well as with “intersession” scans (i.e., scans 1 and 3 and scans 2 and 3, which were obtained during different scanning sessions). A measure of reliability (the ICC) is obtained for each connection.
A prior study by Shehzad and associates (2009) found significant differences in ICCs depending on the significance of the connection. In theory, the connectivity between two unconnected regions should be approximately zero in all subjects and scans with the only variations being due to noise. In this case, the within-subject and between-subject variance should be approximately the same (since both are determined primarily by noise), resulting in an ICC of zero. Consequently, a nonzero ICC for a nonsignificant connection suggests there exists consistent noise within a subject that is reliably different from another subject. While it is unlikely that two areas are completely unconnected (Gonzalez-Castillo et al., 2012), the ICCs of weakly connected regions are more heavily influenced by noise. Consequently, the ICCs of not only all connections but also of the 200 most significant connections were examined, as based on the connectivity without any physiological or white matter/CSF/global nuisance regression.
Differences in ICCs between the different corrections were assessed using jackknife resampling assessed at a significance level of p<0.05 (see below). In this leave-one-out statistical resampling method introduced by Quenouille and furthered by Tukey (Quenouille, 1949; Tukey, 1958), the ICCs were recomputed 25 times, once for leaving out each subject. The implementation is justified for our study since it assumes independence in the variable (here subject—coming from a random sample). These values were directly compared for each correction compared to no correction, or RETROICOR only, which created a distribution of differences. This distribution was used to determine whether differences between each correction technique versus no correction (or vs. RETROICOR only) were significant at 0.05 significance level. The ICC calculations were carried out using Matlab (2010b; The MathWorks, Natick, MA).
Based on our findings of the influence of different physiological noise correction routines on test–retest reliability, we wanted to assess the degree to which the physiological noise itself is reproducible and reliable. We therefore computed the ICC of the variance (R2) explained by each correction technique, thus testing whether the within-subject across-session variability of the physiological noise was larger, similar, or smaller than the between-subject variability in physiological noise.
Specificity
The spatial specificity of functional connectivity maps was assessed by comparing the connectivity of regions expected to be connected to a seed region to those not expected to be connected, similar to the approach used by Weissenbacher and colleagues (2009). The connectivity maps of four seed regions were evaluated: posterior cingulate cortex (default mode network), left precentral gyrus (motor network), left posterior occipital cortex (visual network), and left amygdala (affective network). Signal intensity time courses were averaged over each of these regions, and then correlated against all other voxels in the brain. The resultant connectivity values were then averaged over other ROIs that were part of the same network—default mode network for the posterior cingulate seed, sensorimotor network for the precentral gyrus seed, occipital network for the lpOCC seed, and other affective seed regions for the left amygdala. The first three of these network regions (default mode, sensorimotor, and occipital) were derived from Dosenbach and associates (2010), while the affective brain ROIs were taken from Cisler and colleagues (2013). Areas not expected to be connected were averaged regions of white matter and CSF.
Results
Variance explained by different corrections
Figure 1 shows the fraction of variance explained by each of the nuisance regressors in gray matter, white matter, CSF, and across the whole brain. Regressors created to model the physiological noise all accounted for significant variance in spatially specific regions of the brain. RETROICOR, which models the fluctuations at the primary cardiac and respiratory frequencies, and their first harmonics, accounted for the largest variance in large arteries, such as the Circle of Willis. On average across gray matter, RETROICOR accounted for 14.5%±5.4% of the variance (Fig. 2). Respiration volume per time, and heart rate (RVHR) changes accounted for significant additional variance, above RETROICOR, primarily in the sagittal sinus and internal cerebral veins (see Fig. 3). Adding 8 temporal shifts of the RVT accounted for significant additional variance throughout gray matter (14.0%±4.4% of the remaining variance after RETROICOR) and CSF (15.1%±4.6%). The greatest amount of variance in all tissue types was explained by the white matter, CSF, and global signal regressors.
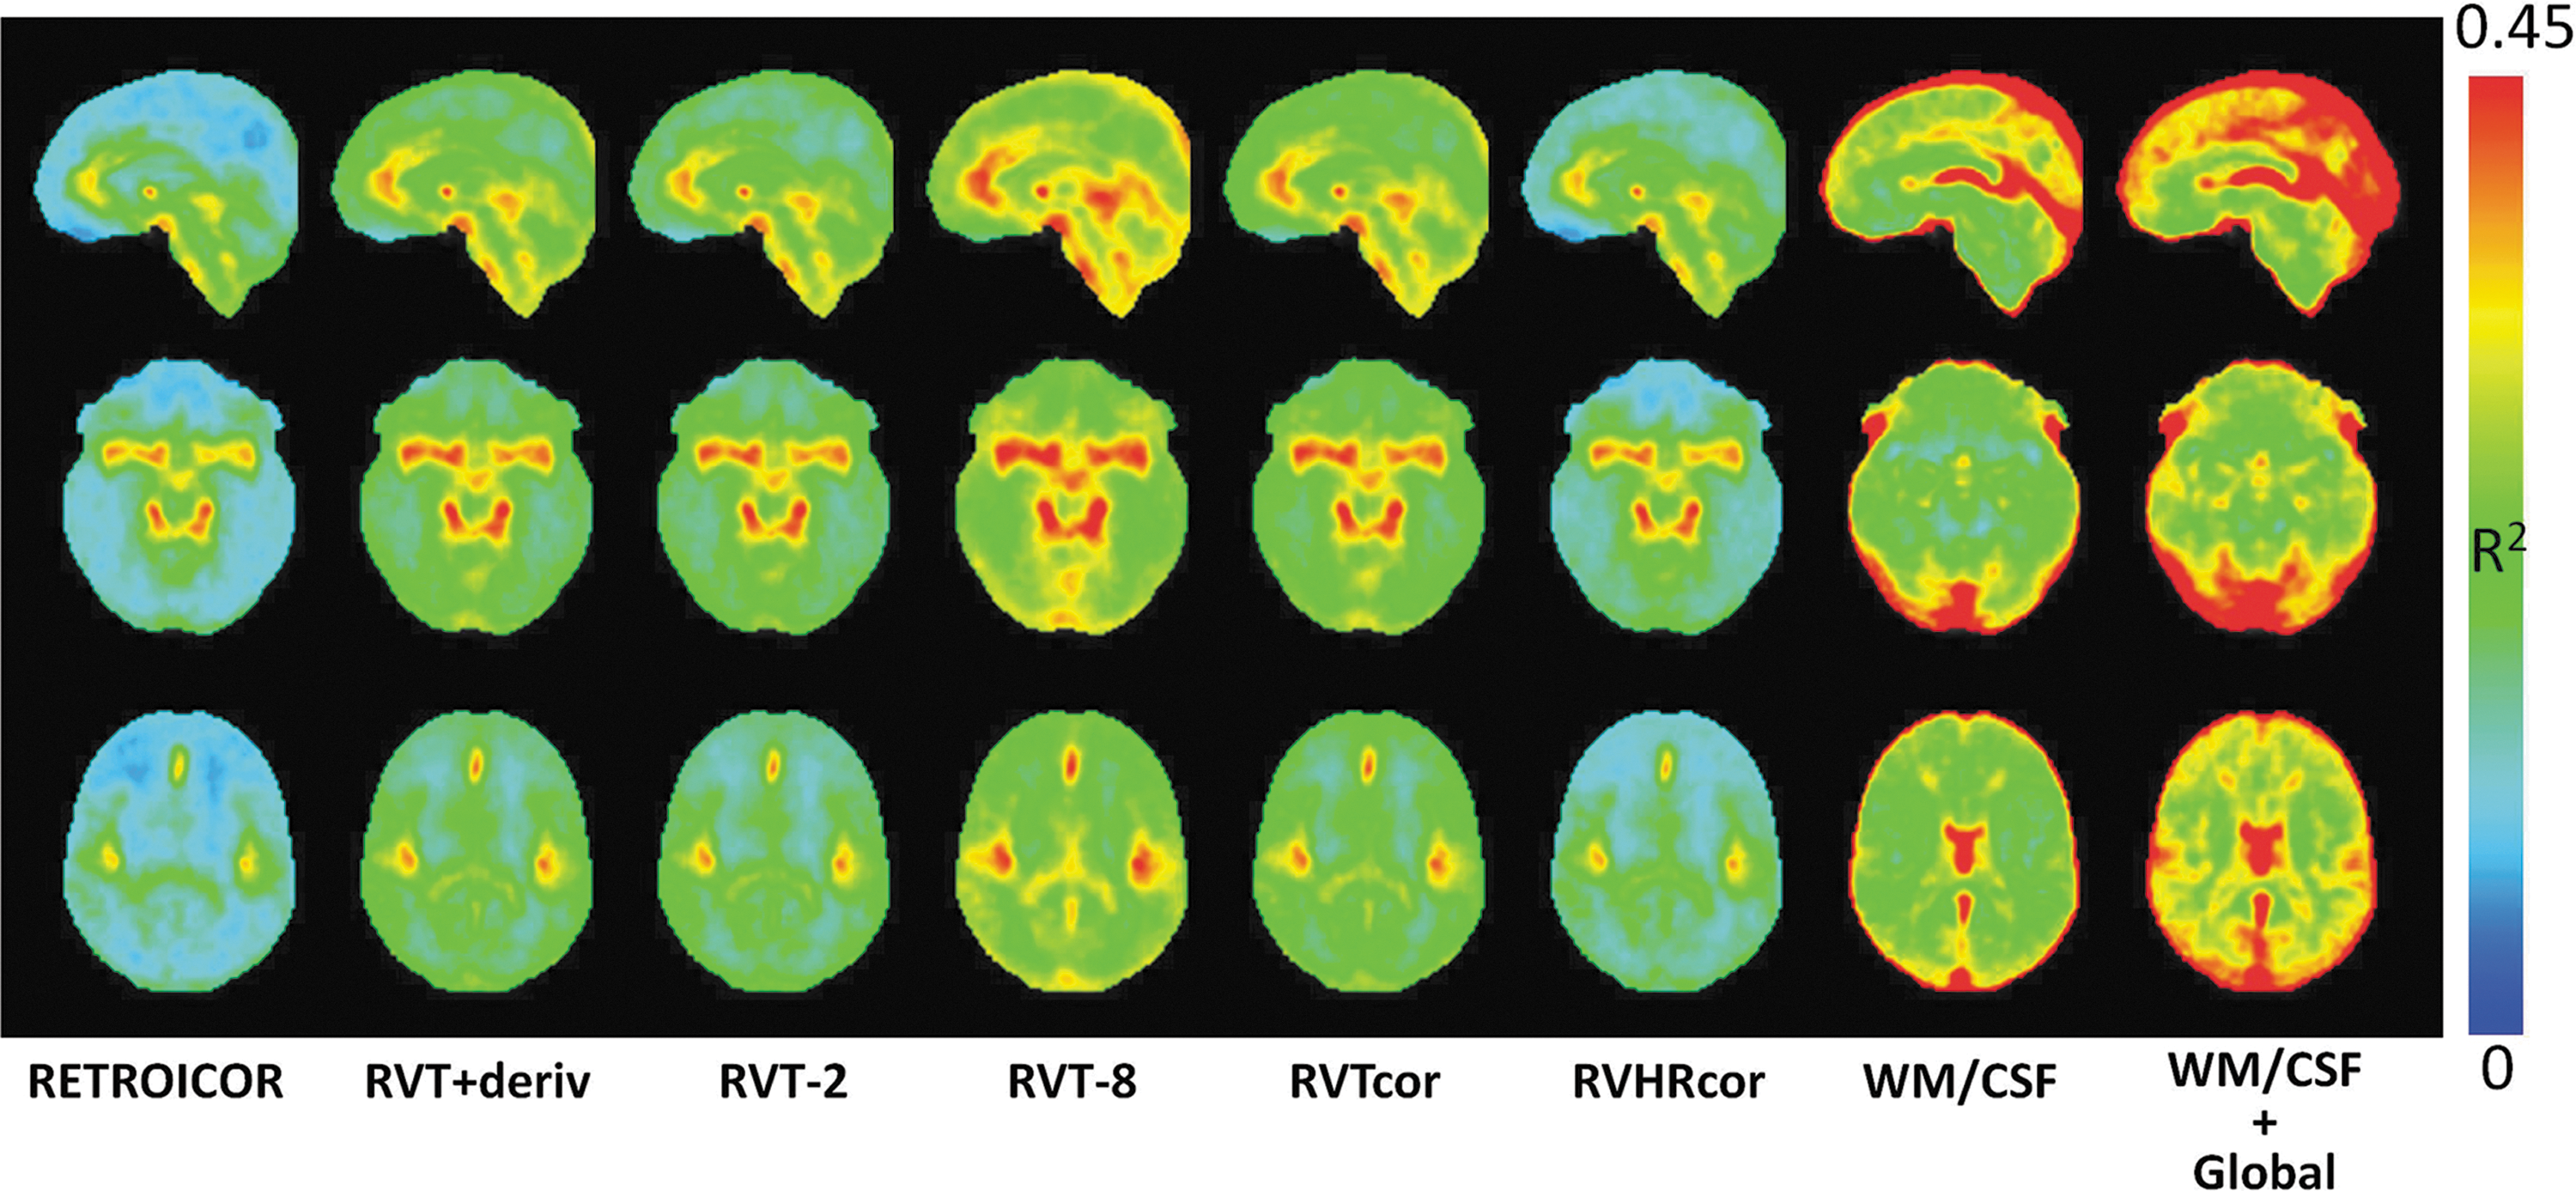
The fraction of variance accounted for by each of the correction methods, relative to no correction. The greatest amount of variance is explained in and near large blood vessels.
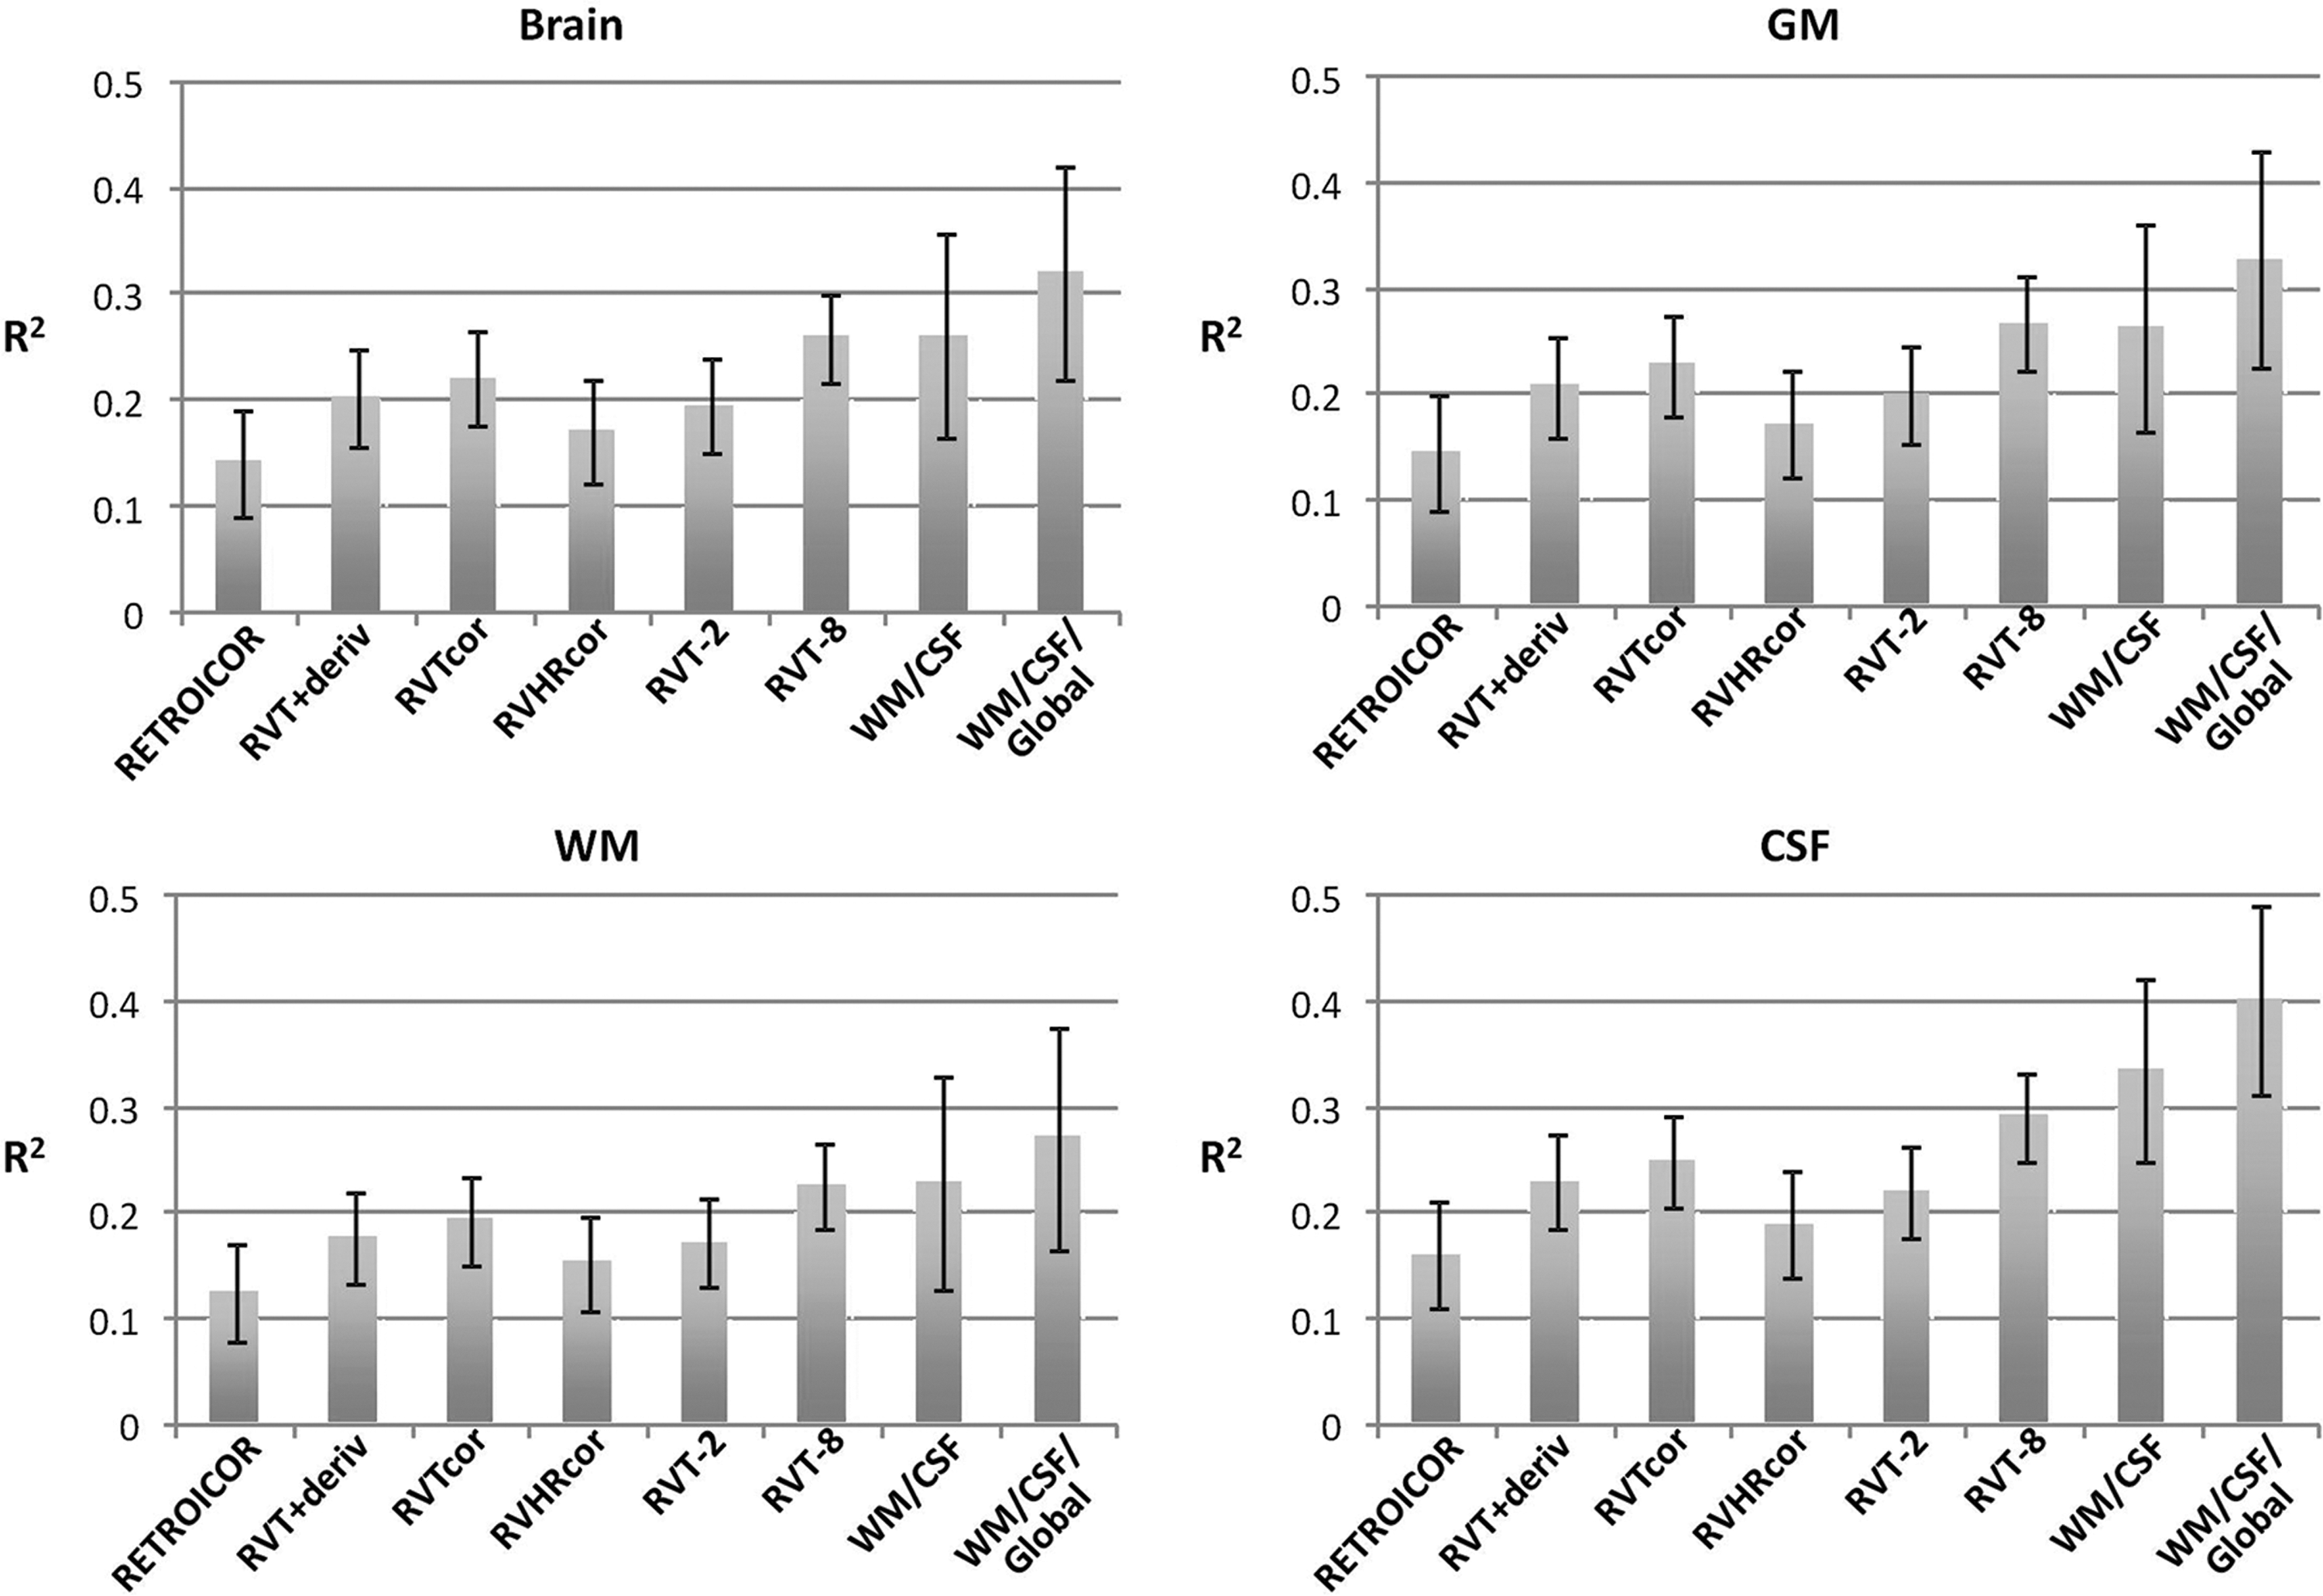
The variance as accounted for by various physiological noise correction techniques, averaged over the entire brain, all gray matter (GM), white matter (WM), and cerebrospinal fluid (CSF).

The fraction of variance accounted for by each of the correction methods that incorporate respiration volume and/or heart rate, relative to RETROICOR.
Functional connectivity
As an example of the influence of various physiological corrections on functional connectivity maps, Figure 4 shows the functional connectivity of a seed region in the posterior cingulate cortex, which replicates the functional connectivity pattern of the default mode network observed in prior studies (Buckner et al., 2008; Greicius et al., 2003; Raichle et al., 2001). Across all correction techniques, the posterior cingulate was most strongly connected to the medial prefrontal cortex, and bilateral parietal regions. At an individual voxel p<0.001, the posterior cingulate was significantly connected to most of the brain for all corrections evaluated except white matter, CSF, and global nuisance regression. White matter and CSF nuisance regression resulted in significant reduction in functional connectivity with more focal connectivity in medial prefrontal and bilateral parietal areas. The addition of global signal regression resulted in anticorrelated regions (see Fig. 4). Raising the individual voxel threshold for functional connectivity estimates for the first seven physiological noise correction techniques (i.e., those that do not include white matter, CSF, and/or global signal regression) made the thresholded maps appear spatially similar, but not identical, to the white matter, CSF, and global signal-regressed connectivity maps.

Functional connectivity maps for a seed in the posterior cingulate for no correction, and nine different postprocessing corrections: RETROICOR (Glover et al., 2000); respiration volume per time (RVT)+derivative of RVT; RVT at 2 lags (RVT-2); RVT at 8 lags (RVT-8); RVT at 41 different lags, but only a single lag in each voxel (RVTcor), RVHRcor (Chang et al., 2009); regression of average WM and CSF (WM/CSF); and regression of average WM, CSF, and global signal (WM/CSF+global). Top row: thresholded at p<10−10; bottom row: thresholded at p<10−30 to obtain connected regions of a thresholded spatial extent similar to that from WM/CSF+global signal regression.
While the group-level connectivity maps did not appear to show significant differences in functional connectivity for corrections using the physiological regressors (e.g., RVTcor, RVHRcor, RVT-2, and RVT-8, RVT+deriv), statistical comparisons revealed several differences. For a posterior cingulate seed, RETROICOR resulted in a greater connectivity in anterior/mid cingulate cortex, and reduced connectivity in a widespread lateral region of gray matter, and some white matter (see Fig. 5). Various versions of RVT corrections resulted in reduced connectivity throughout white and gray matter. Less extensive reductions were found when only two-lagged versions of the RVT were included, and greater differences in connectivity were found for the RVT+deriv, 8-lag (RVT-8), and multiple-shift RVTcor. RVHRcor resulted in reductions particularly in white matter. Not surprisingly, compared to no corrections, white matter, CSF, and global nuisance regression resulted in significant reductions in posterior-cingulate connectivity throughout the brain.
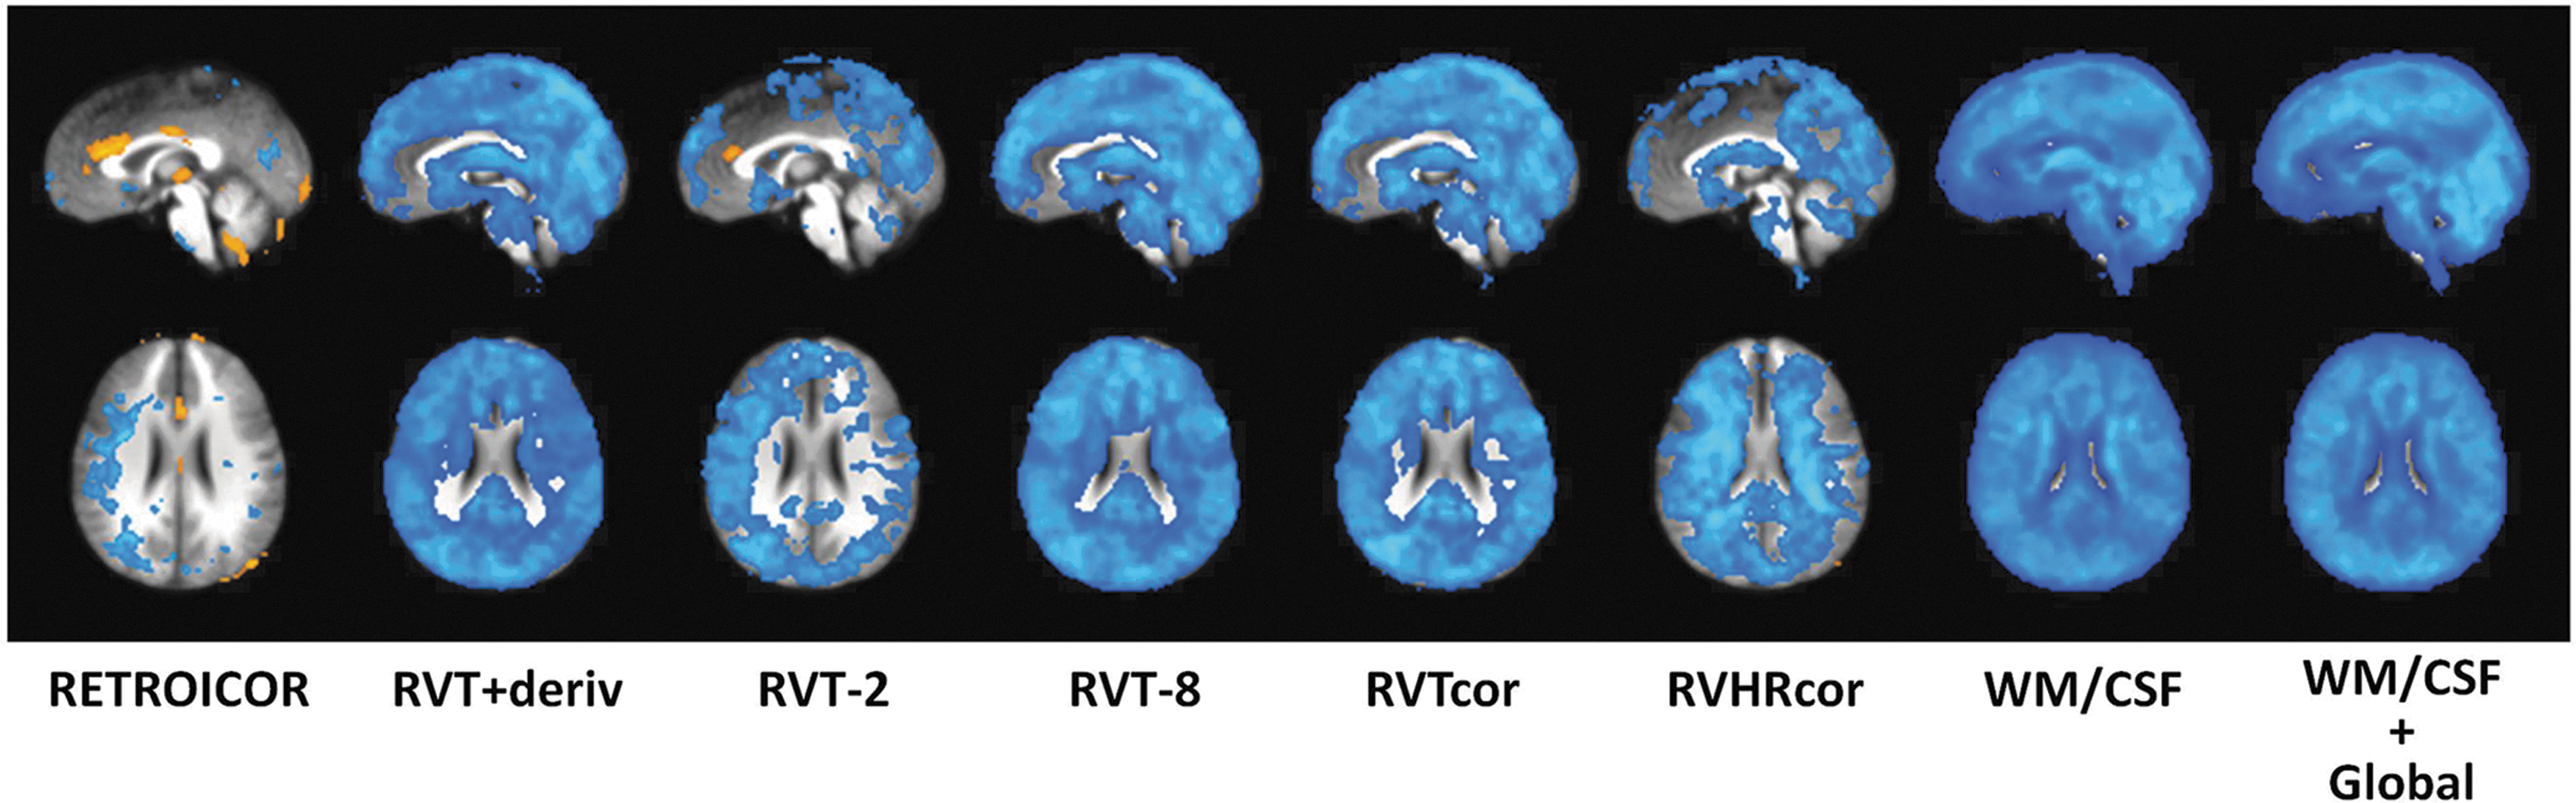
Voxel-wise t-test of differences in functional connectivity for a posterior cingulated seed relative to no physiological corrections.
Test–retest reliability
Contrary to our initial predictions, physiological noise correction resulted in significant decreases in test–retest reliability. On average across all connections, RVTcor, RVT+deriv, RVT-2, RVT-8, WM/CSF, and WM/CSF/global nuisance regression all resulted in significant reductions in reliability (p<0.05, corrected for multiple comparisons), both within sessions and between sessions. The greatest decreases were found for those using nuisance regressors derived from the data itself, specifically white matter, CSF, and global signal regression (see Fig. 6). These patterns were similar for both intrasession and intersession reliability. When only the 200 most significant connections were evaluated (as based on the connectivity without any of the examined physiological corrections), the results were similar, except that the white matter, CSF, and global nuisance regression did not result in a significant difference in ICC (see Fig. 7).

Top: mean intraclass correlation coefficient (ICC), over all 16,110 connections, for different postprocessing corrections—left, within a session (30 min separation between runs); right, between sessions (2–3 months between sessions). *Corrections that show a significant reduction relative to no correction (p<0.05). Bottom: mean within-subject/between-session variance (red bars), and between-subject variance (green bars), for different postprocessing corrections—left, within a session (30 min separation between runs); right, between sessions (2–3 months between sessions).

Top: mean ICC, over the 200 most significant connections (as based on “No correction”), for different postprocessing corrections—left, within a session (30 min separation between runs); right, between sessions (2–3 months between sessions). *Corrections that show a significant reduction relative to no correction (p<0.05). Bottom: mean within-subject/between-session variance (red bars), and between-subject variance (green bars), for different postprocessing corrections. Results are averaged over the 200 most significant connections (as based on “No correction”). Bottom left: within a session (30 min separation between runs); bottom right: between sessions (2–3 months between sessions).
A closer examination of the data revealed that all of the physiological noise corrections reduced between-subject variability to a larger extent than the within-subject variability across sessions. For all corrections except RETROICOR and RVHRcor, the between-subject variability was significantly reduced (p<0.05, corrected) after applying the corrections (see Figs. 6 and 7). Furthermore, the variance explained by each of the correction techniques was highly reliable, both over a period of 30 min within the same session, as well as across 2 sessions separated by 2–3 months (see Fig. 8). The ICC was between 0.48 and 0.81 for intrasession differences (0.37–0.69 for intersession differences), indicating that the within-subject, across-run variability of physiological noise (as assessed by the variance explained by the correction) was significantly smaller than the between-subject variability in physiological noise. In other words, the spatial pattern and amplitude of the variance explained by each physiological correction was highly reproducible.

Mean test–retest reliability (as measured by the intraclass correlation coefficient) for the fraction of variance (R 2) explained by each correction. Mean is computed over all 180 seed regions of interest. Test–retest reliability is quite high for most correction techniques, indicating much smaller within-subject between-session differences in physiological noise variance compared to between-subject differences.
Specificity
Noise corrections that modeled the respiration and heartbeat (RETROICOR), respiration volume per time (RVT), respiration volume and heart rate (RVHR), the RVT and its derivative, and various temporally shifted RVT regressors all had minimal effect on the specificity (see Fig. 9). Correlations with other white matter and CSF regions were slightly reduced, but correlations with other seed regions within the respective networks were also slightly reduced. In contrast, both white matter/CSF and white matter/CSF/global signal regression resulted in much larger changes in the functional connectivity. The connectivity with white matter and CSF was close to zero, as expected since signal fluctuations from these areas were regressed out of the data. However, the correlations with other regions within each network were also significantly reduced. The difference between within-network correlations and correlations with white matter and CSF varied slightly depending on the seed region. For example, for the amygdala seed, the difference in connectivity between within-network ROIs and white matter/CSF was greater for white matter and CSF, as well as white matter, CSF, and global signal regression. However, for other seed regions, such as the PCC, occipital cortex, and motor cortex, the difference was less pronounced.
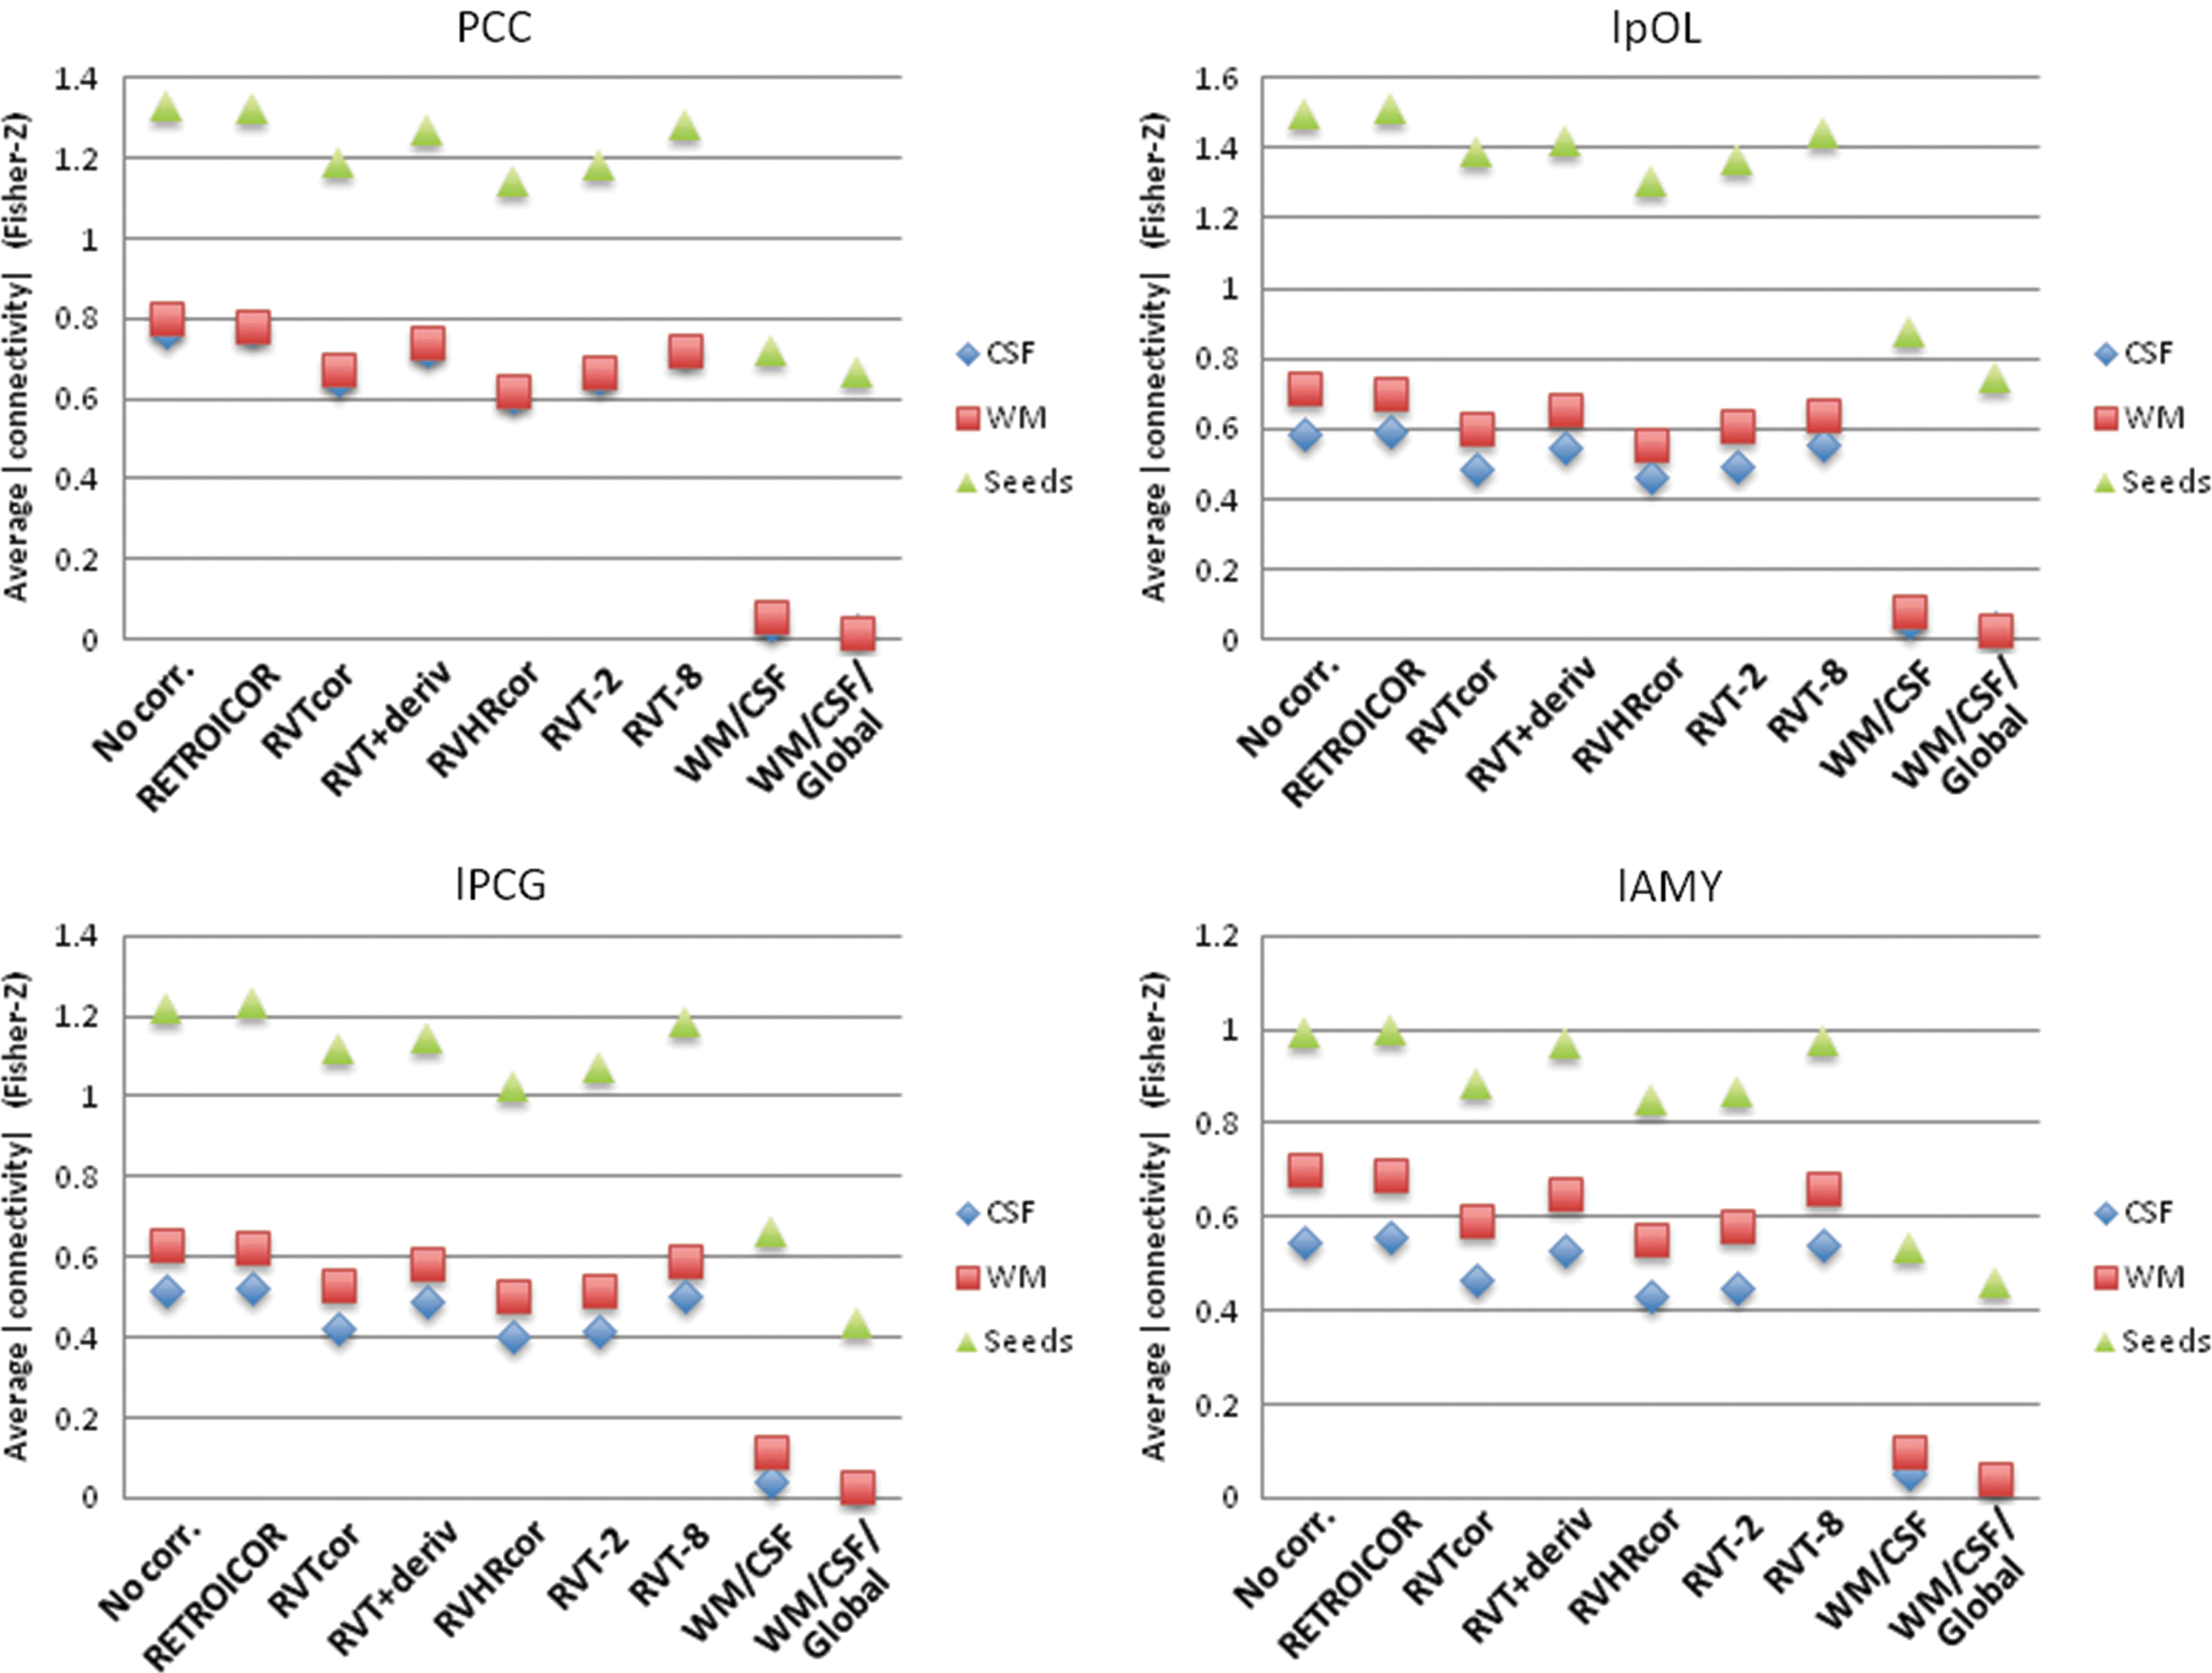
The absolute value of connectivity strength, averaged over CSF, WM, and all other seeds within the respective network, for different seed regions: posterior cingulate (PCC, default mode network); left posterior occipital lobe (lpOL, visual network); left precentral gyrus (lPCG, motor network); left amygdala (lAMY, affective network).
Discussion
All of the physiological noise correction routines tested in this study resulted in significant reductions in variance. As expected, these regions were in brain areas close to larger blood vessels or with denser vasculature, such as the Circle of Willis, sagittal sinus, internal cerebral veins, and, to a certain extent, gray matter. In addition, physiological corrections resulted in significant differences in functional connectivity. For a posterior cingulate seed, part of the default mode network, the influence of RETROICOR was statistically significant, but restricted to more localized regions of the brain. In contrast, all of the physiological regressions that included RVT resulted in significant functional connectivity differences throughout the brain. In this investigation, RVTcor (correction #3) resulted in greater differences in connectivity compared to RVHRcor (correction #7), likely because the latency of the RVT (convolved with RRF) was allowed to vary for each voxel, while for RVHRcor, a single latency of respiration volume (RV) and heart rate (HR) was used. As expected, white matter, CSF, and global signal regression resulted in the largest and most significant differences in functional connectivity with a posterior cingulate seed region. However, it should be kept in mind that physiologically based corrections like RETROICOR will be increasingly important for seed regions closer to pulsatile blood vessels. The application of global signal regression resulted in more regions showing a negative correlation, consistent with prior observations (Fox et al., 2005; Murphy et al., 2009).
Among the techniques evaluated in this work, white matter, CSF, and global signal regression resulted in the greatest reduction of variance in gray matter. In contrast, in regions near pulsatile blood vessels, such as the Circle of Willis, RETROICOR resulted in a much greater reduction of variance, while white matter, CSF, and global signal regression had relatively little effect in this region. Thus, white matter, CSF, and global signal regression are not a substitute for physiological noise corrections (specifically those that model fluctuations at the primary cardiac and respiration frequencies, such as RETROICOR).
Consistent with earlier studies (e.g., Shehzad et al., 2009), test–retest reliability was moderate to high within the same session (a separation of 30 min), but poor to moderate for intersession reliability (a separation of 2–3 months). This relatively low reliability between sessions may be the result of additional noise that is not accounted for by the various noise correction strategies currently employed. The low intersession reliability may also reflect “true” neuronal functional connectivity alterations after 2–3 months. It is possible that some functional reorganization of the brain has taken place after 2–3 months of life experiences. Similarly, it may be that resting-state functional connectivity is influenced not only by stable trait-like characteristics, but also by mental state, food or caffeine intake, daily exercise routines, awake–sleep patterns, seasonal change, and circadian and diurnal rhythms, which are more likely to be different when the scans are months apart than within the same session. Such a dependence of rs-fcMRI on mental state has been observed following a task stimulus (Grigg and Grady, 2010; Lewis et al., 2009; Stevens et al., 2010), when subjects were in different moods or emotional states (Eryilmaz et al., 2011), and with differences in vigilance (Tagliazucchi et al., 2012; Wong et al., 2013).
The test–retest reliability was significantly decreased by almost all correction techniques. This was at first surprising to us, as it was predicted that these noise correction techniques would reduce variance and thus improve reliability. However, a closer inspection of the data showed that the within-subject across-session variance did decrease (statistically significant for some of the corrections), but the between-subject variance decreased by a greater amount. As a result, the ICC, which compares between-subject to within-subject variability, was decreased. One interpretation of this finding is that the physiological noise correction techniques tested in this study remove signal of interest, thus reducing the reliability of estimating functional connections, and should therefore be avoided. However, another likely possibility is that physiological (i.e., cardiac and respiration) fluctuations are similar and repeatable within a subject across sessions. If the variability of these fluctuations within a subject across sessions is smaller than the variability between subjects, then these physiological fluctuations increase the test–retest reliability of functional connectivity and removal of these fluctuations would decrease test–retest reliability. Our analyses support this possibility, showing that the reliability (as reflected in the ICC) of the variance explained by each correction is quite high. Thus, physiological noise corrections reduce spatially structured and temporally repeatable fluctuations, thereby reducing the variability in functional connectivity between subjects. Consequently, physiological noise corrections would increase the statistical power of group-level analyses testing the main effect of connectivity (e.g., whether a region is connected or not).
The specificity of functional connectivity maps, as measured by the correlation with areas expected to be connected to a particular node (i.e., “within-network” connections) compared to the correlation with areas not expected to be connected (i.e., white matter and CSF) improved the most with white matter, CSF, and also global signal regression. One possibility for the lower specificity for the noise corrections that use the measured physiological waveforms (e.g., RETROICOR, RVTcor, and RVHRcor) compared to the nuisance regression based on the data itself is that our models for respiration- and cardiac-related signal variations are incomplete. One of our prior studies, for example, showed that signal variations resulting from respiration variations at rest were not modeled accurately by the RRF derived from cued respiration changes (Birn et al., 2008). Shifting the latency of these responses, which was performed in the RVTcor correction and in effect in the RVT-8 lag model, did improve the fit, but it is possible that the shape of the respiration response to resting breathing fluctuations needs to be adjusted, perhaps even at a voxel-wise level, in order to get an optimal fit. In contrast, both white matter and CSF, as well as white matter, CSF, and the global signal, resulted in the largest difference in specificity. This is expected since our measure of “specificity” includes the correlation with CSF and white matter, both of which are removed in these correction techniques.
The primary focus of the current study was to evaluate the impact of techniques that model cardiac- and respiration-related signal fluctuations using independent measures of these physiological processes. In addition, these techniques were compared against two of the most widely used noise correction strategies that use nuisance regressors derived from the data itself—the regression of average white matter and CSF signals, and the regression of these signals as well as the average whole-brain signal. There are, of course, a large number of additional physiological noise correction techniques [e.g., CompCor (Behzadi et al., 2007), PESTICA (Beall and Lowe, 2007), CORSICA (Perlbarg et al., 2007), PSTCor (Anderson et al., 2011), and FIX (Griffanti et al., 2014)] that do not use independent measures of physiology but primarily estimate noise contributions from the data itself. Furthermore, future studies could also examine the influence of dynamic B0-field corrections at reducing physiological noise (Roopchansingh et al., 2003). On the basis of our finding that the physiological noise itself is highly repeatable and reliable, these techniques would similarly result in lower test–retest reliability, but likely also a higher validity that is more reflective of functional connectivity driven by variations in neuronal activity.
Conclusions
Nuisance regressors intended to model cardiac- and respiration-related signal changes account for significant variance in certain regions of the brain, and significantly affect estimates of functional connectivity. The regions of the brain most affected by these nuisance regressors vary for different correction approaches, with RETROICOR accounting for the most variance in blood vessels (particularly near the base of the brain), various versions of RVT and RVHR corrections affecting additional signals in sagittal sinus and gray matter, and white matter, CSF, and global signal regression affecting the most signal in gray matter.
The influence of these correction methods on test–retest reliability is more complex. For the evaluation of individual differences in the strength of functional connectivity, test–retest reliability was reduced on average across all connections examined for most of the physiological noise correction approaches. This finding should be interpreted with caution when deciding on preprocessing approaches. Physiological noise can be characteristic and repeatable within subjects, and reduction of this noise would reduce test–retest reliability of determining individual differences in connectivity strength, but increase the validity of measured connectivity differences. Physiological noise is more varied between subjects; therefore, removal of the noise may lead to better estimates of average or group maps of network connectivity. Based on the known nonneuronal mechanisms by which cardiac pulsation and respiration can lead to MRI signal changes, and the impact of such fluctuations on functional connectivity, it is recommended that current studies still apply physiological noise corrections but also investigate whether heart rate and/or respiration correlate with measures of interest.
Future studies should examine the impact of these noise correction techniques on the correlation between fMRI estimates of connectivity and other independent and more direct measures of neuronal function, such as EEG, ECoG, or direct recordings in animals.
Footnotes
Acknowledgments
The authors thank Bharat B. Biswal for his assistance in the study design, and C. Chang for providing us with the RVHR correction code. This work was supported by NIH Grants RC1MH090912, T32GM008692, UL1TR000427, K23NS086852, T32EB011434, P50MH100031, and R21MH101526, and the HealthEmotions Research Institute.
Author Disclosure Statement
No competing financial interests exist.