




Abstract
In blood-oxygenation-level-dependent functional magnetic resonance imaging (fMRI), current methods typically acquire ∼500,000 imaging voxels at each time point, and then use computer algorithms to reduce this data to the coefficients of a few hundred parcels or networks. This suggests that the amount of relevant information present in the fMRI signal is relatively small, and presents an opportunity to greatly improve the speed and signal to noise ratio (SNR) of the fMRI process. In this work, a theoretical framework is presented for calculating the coefficients of functional networks directly from highly undersampled fMRI data. Using predefined functional parcellations or networks and a compact k-space trajectory that samples data at optimal spatial scales, the problem of estimating network coefficients is reformulated to allow for direct least squares estimation, without Fourier encoding. By simulation, this approach is shown to allow for acceleration of the imaging process under ideal circumstances by nearly three orders of magnitude.
Introduction
For over 30 years, magnetic resonance imaging (MRI) has been built upon the principles of Fourier encoding, and the reconstruction of uniform grids of voxels from Fourier-encoded data. For medical diagnosis, images are typically evaluated by the human eye, and the generation of images with high and uniform spatial resolution is sensible. However, for functional imaging of the brain, image data are rarely evaluated by eye, and are instead analyzed using a wide variety of computer-based methods to extract functional signals and parameters of interest from these voxel data. Data-driven methods, such as independent component analysis (ICA) (Smith et al., 2012; Tian et al., 2013), and related methods detect features in the data that give clues as to the functional organization of the brain, while strongly model-driven approaches, such as dynamic causal modeling (Friston et al., 2003), attempt to extract parameters of well-defined models from the data. Other approaches, such as functional parcellation (Craddock et al., 2012; Shen et al., 2013) and graph theoretic approaches (Bullmore and Sporns, 2009; van den Heuvel and Sporns, 2011; Zuo et al., 2012), seek to characterize the relationships among brain parcels or nodes.
To date the imaging and processing sides of the functional MRI (fMRI) workflow have been largely independent, and the point of communication between these portions of the process is the four-dimensional data set (three spatial dimensions plus time) that is the typical output of the image acquisition and reconstruction components. The size of this data set is enormous, typically in the hundreds of millions of data points, and yet, for most of the common processing procedures (outlined earlier), this data is typically reduced by approximately three orders of magnitude by the estimation of the blood-oxygenation-level-dependent (BOLD) signal in a few hundred parcels, nodes, or networks.
This implies that the relevant information content present in the fMRI signal is typically three orders of magnitude smaller than the voxel count. This 1000-fold excess in data presents an opportunity for dramatic increases in both imaging speed and SNR efficiency. The high spatial resolution typically acquired in fMRI is largely used to make sure that data are not assigned to the wrong side of a sulcus, rather than because the resolution matches the size of the features of interest.
We point out here that the intermediate step of reconstructing voxels is not explicitly necessary, and postulate that the rate of information extraction from the brain using fMRI and other functional imaging methods can be dramatically accelerated by estimating the parameters of the functional networks/nodes directly, bypassing the reconstruction of voxels.
Theory
The Human Connectome Project (HCP) (Smith, 2013; Van Essen et al., 2012, 2013) is a good benchmark for state-of-the-art fMRI methodology, as the imaging and processing protocols that are emerging from that project are becoming de facto standards in the field. The HCP has pushed MRI technology firmly up against some of the current limits on imaging speed and resolution. It has led the field in advanced gradient technology to move through k-space as fast as possible (Ugurbil et al., 2013), and has also pioneered parallel acceleration methods, such as simultaneous multislice imaging with blipped controlled aliasing in parallel imaging (CAIPI) (Eichner et al., 2013; Setsompop et al., 2012), to maximize imaging speed. For BOLD fMRI, whole-brain imaging at 2-mm isotropic resolution with subsecond temporal resolution is now the standard (Ugurbil et al., 2013).
In a typical 2-mm isotropic whole-brain scan, ∼500,000 imaging voxels are reconstructed at each time point. However, from each of these imaging volumes, the information extracted for most applications is contained in the coefficients of <500 brain nodes or networks. So, why is so much data collected?
One simple answer is that more data provide more degrees of freedom, and the ability to estimate more parameters. This is almost always true in the time domain. More time points, if they are at least somewhat uncorrelated, provide more statistical power, generating higher sensitivity and/or shorter scan times. However, in the spatial domain, resolution comes at a steep price in SNR. For a given voxel volume V and total scan time T,
A second reason that high spatial resolution can be useful is that the brain is a spatially complex structure, and 2-mm resolution is approximately what is required to reliably localize the signal from each voxel to the correct location in gray matter, without contamination across sulci. While this is a valid anatomical consideration, the enormous cost in SNR should be understood.
If the geometry of the networks or nodes present in a given subject is known, then the data acquisition and reconstruction process can be reformulated as a function of the signal in each network or node. The distribution of signal across these networks/nodes is referred to here as network/node maps or nMaps, to distinguish them from spatially uniform voxel maps (i.e., conventional images). Example structures of potential nMaps are shown in Figure 1. For parcels, the value of one element in the nMap is the BOLD signal at one time point, integrated over the spatial extent of the parcel or node. The nMap for a set of networks is slightly different in that it consists of coefficients or “weights” for the BOLD signal associated with each of many potentially spatially overlapping networks. For example, for networks identified by ICA, the nth row of the nMap would be the time course associated with the nth network component.

The nMap is a construct that describes the coefficients of parcels, nodes, or networks over time. Network images adapted from Malaak et al. (2012).
For a given k-space trajectory, the linear relationship between the nMap coefficients and the MR signal can be expressed as a simple encoding matrix that is in general not a Fourier matrix, but instead one derived directly from the MR signal equations integrated over the arbitrarily shaped networks or nodes. For a k-space trajectory (k) and nMap coefficients (x), the MR signal S can be expressed as follows:
where the elements of the encoding matrix A are
Here the integral is over the volume Vj of the jth nMap element, the weight wj is the relative weight of the element over space, and i is indexes over the k-space points acquired. For elements Vj that fall over a uniform Cartesian grid, A reduces to the Fourier encoding matrix.
Our goal is to estimate the elements of the nMap directly from undersampled MR data, and hypothesize that this can dramatically increase the SNR of the estimates of the activation waveforms.
Simulation
An example of direct estimation of nMap data from undersampled k-space data is shown in Figure 2 and compared with conventional estimation. In this example, a 288-parcel Yale atlas (Shen et al., 2013) was sampled at 2-mm isotropic resolution and used as a template. A range of BOLD signal values was assigned to each parcel, and Gaussian noise was added at a level such that in the image domain the average contrast-to-noise ratio (CNR) in each 2-mm voxel was 1. For BOLD imaging, a CNR that is on the order of unity is typical. For the conventional estimation, images were reconstructed by Fourier transform, and signals were averaged across the voxels of each parcel, yielding an estimate of the mean signal in each parcel. These values correspond to the values in one column of the nMap.

Conventional functional magnetic resonance imaging versus direct calculation of the nMap.
For direct nMap estimation, a small subset of 1500 of the noisy k-space data points were selected, representing an undersampling factor of 500, as shown. For this simulation, an efficient three-dimensional (3D) gradient trajectory was designed with low curvature throughout, so that the trajectory can be traversed quickly when subject to gradient slew rate constraints, and with a relatively incoherent aliasing pattern. The trajectory is shown in Figure 3, and is composed of approximately semicircular arcs extending from pole to pole, and intersects the points of a Fibonacci spiral at the equator.
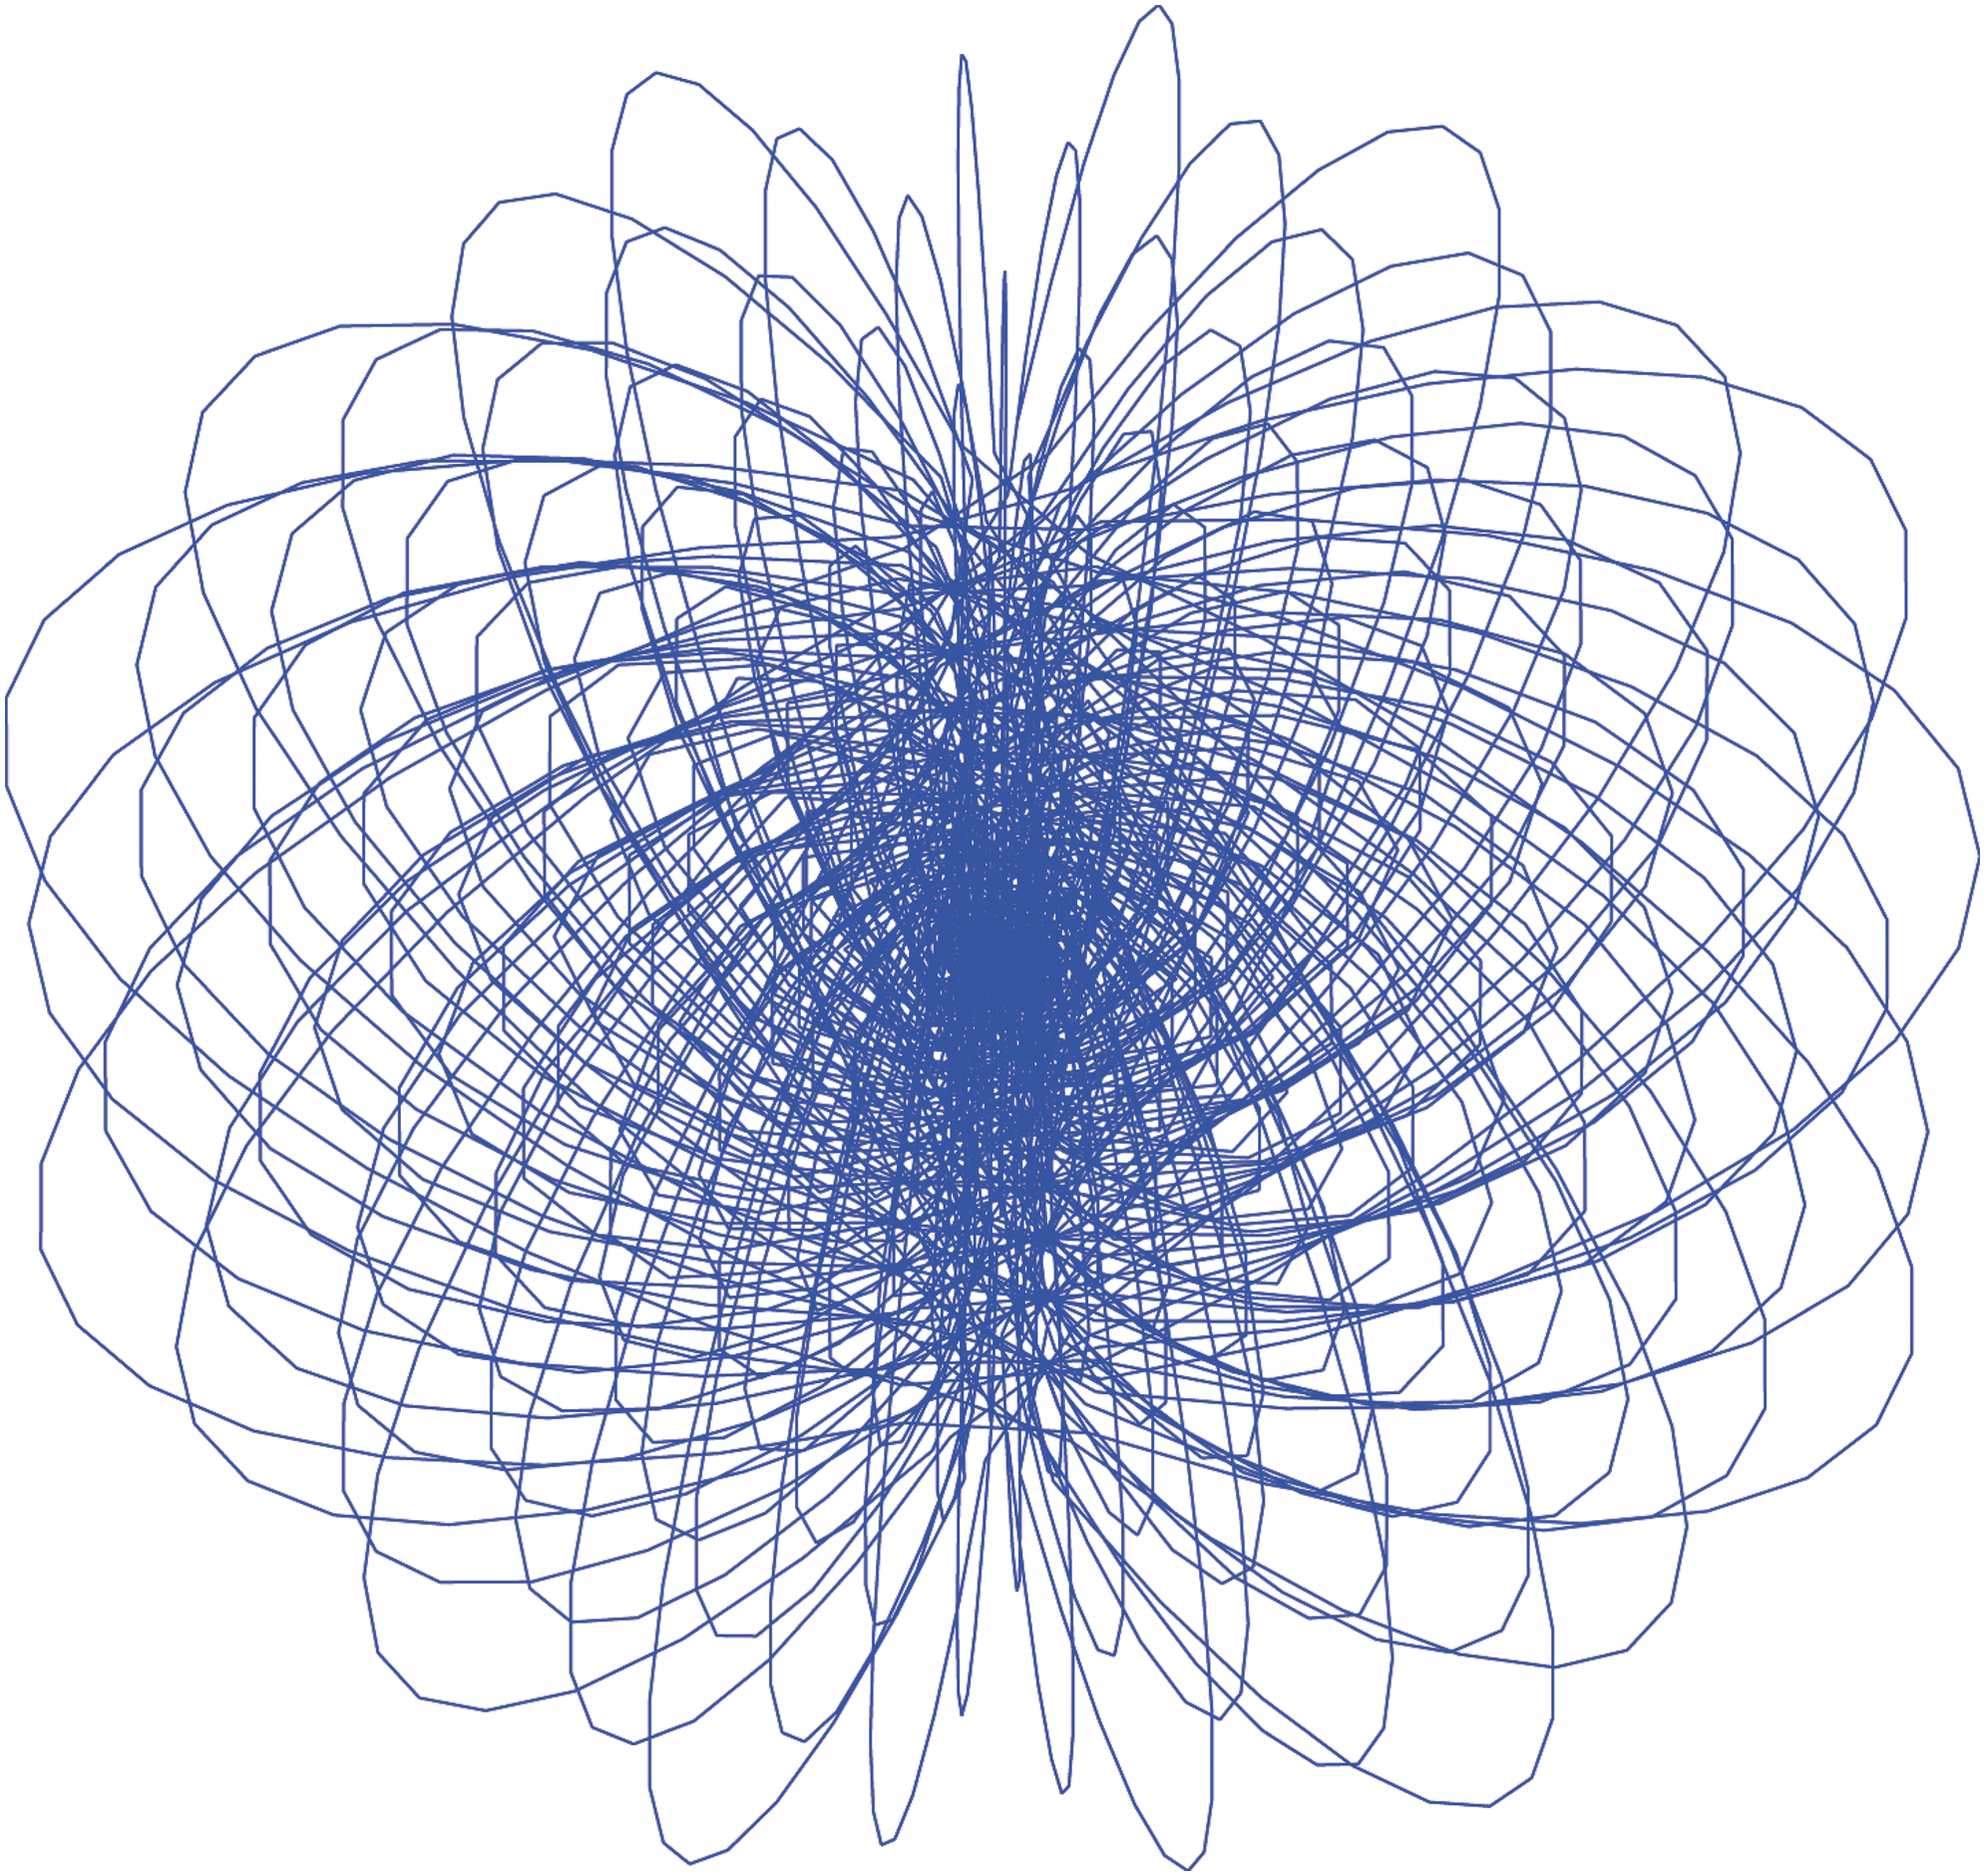
Three-dimensional (3D) K-space trajectory that provides a smooth 3D path, and incoherent aliasing patterns. The trajectory consists of semicircular arcs extending from pole to pole, with a Fibonacci spiral pattern at the intersection with the equatorial plane.
In this example, direct estimation of the nMap from 0.2% of the fully sampled data resulted in an RMS error that was 76% higher than that of the conventional estimation. In our initial testing, we found that the direct estimate always has higher error than the conventional estimate, which is sensible since it uses a subset of the same data. However, this increased error would be compensated by three averages of the 500× undersampled data, which still leaves an undersampling factor of over 150×, with the same net error.
We also performed similar simulations at CNR values of 0.2 and 5.0 for the 2-mm data (Fig. 4), and found similar results; that is, the increase in SNR with direct estimation of the nMap was ∼12×, and the optimal size of the sampled patch of k-space corresponded to a point spread function (PSF) that roughly coincides with the parcel size.
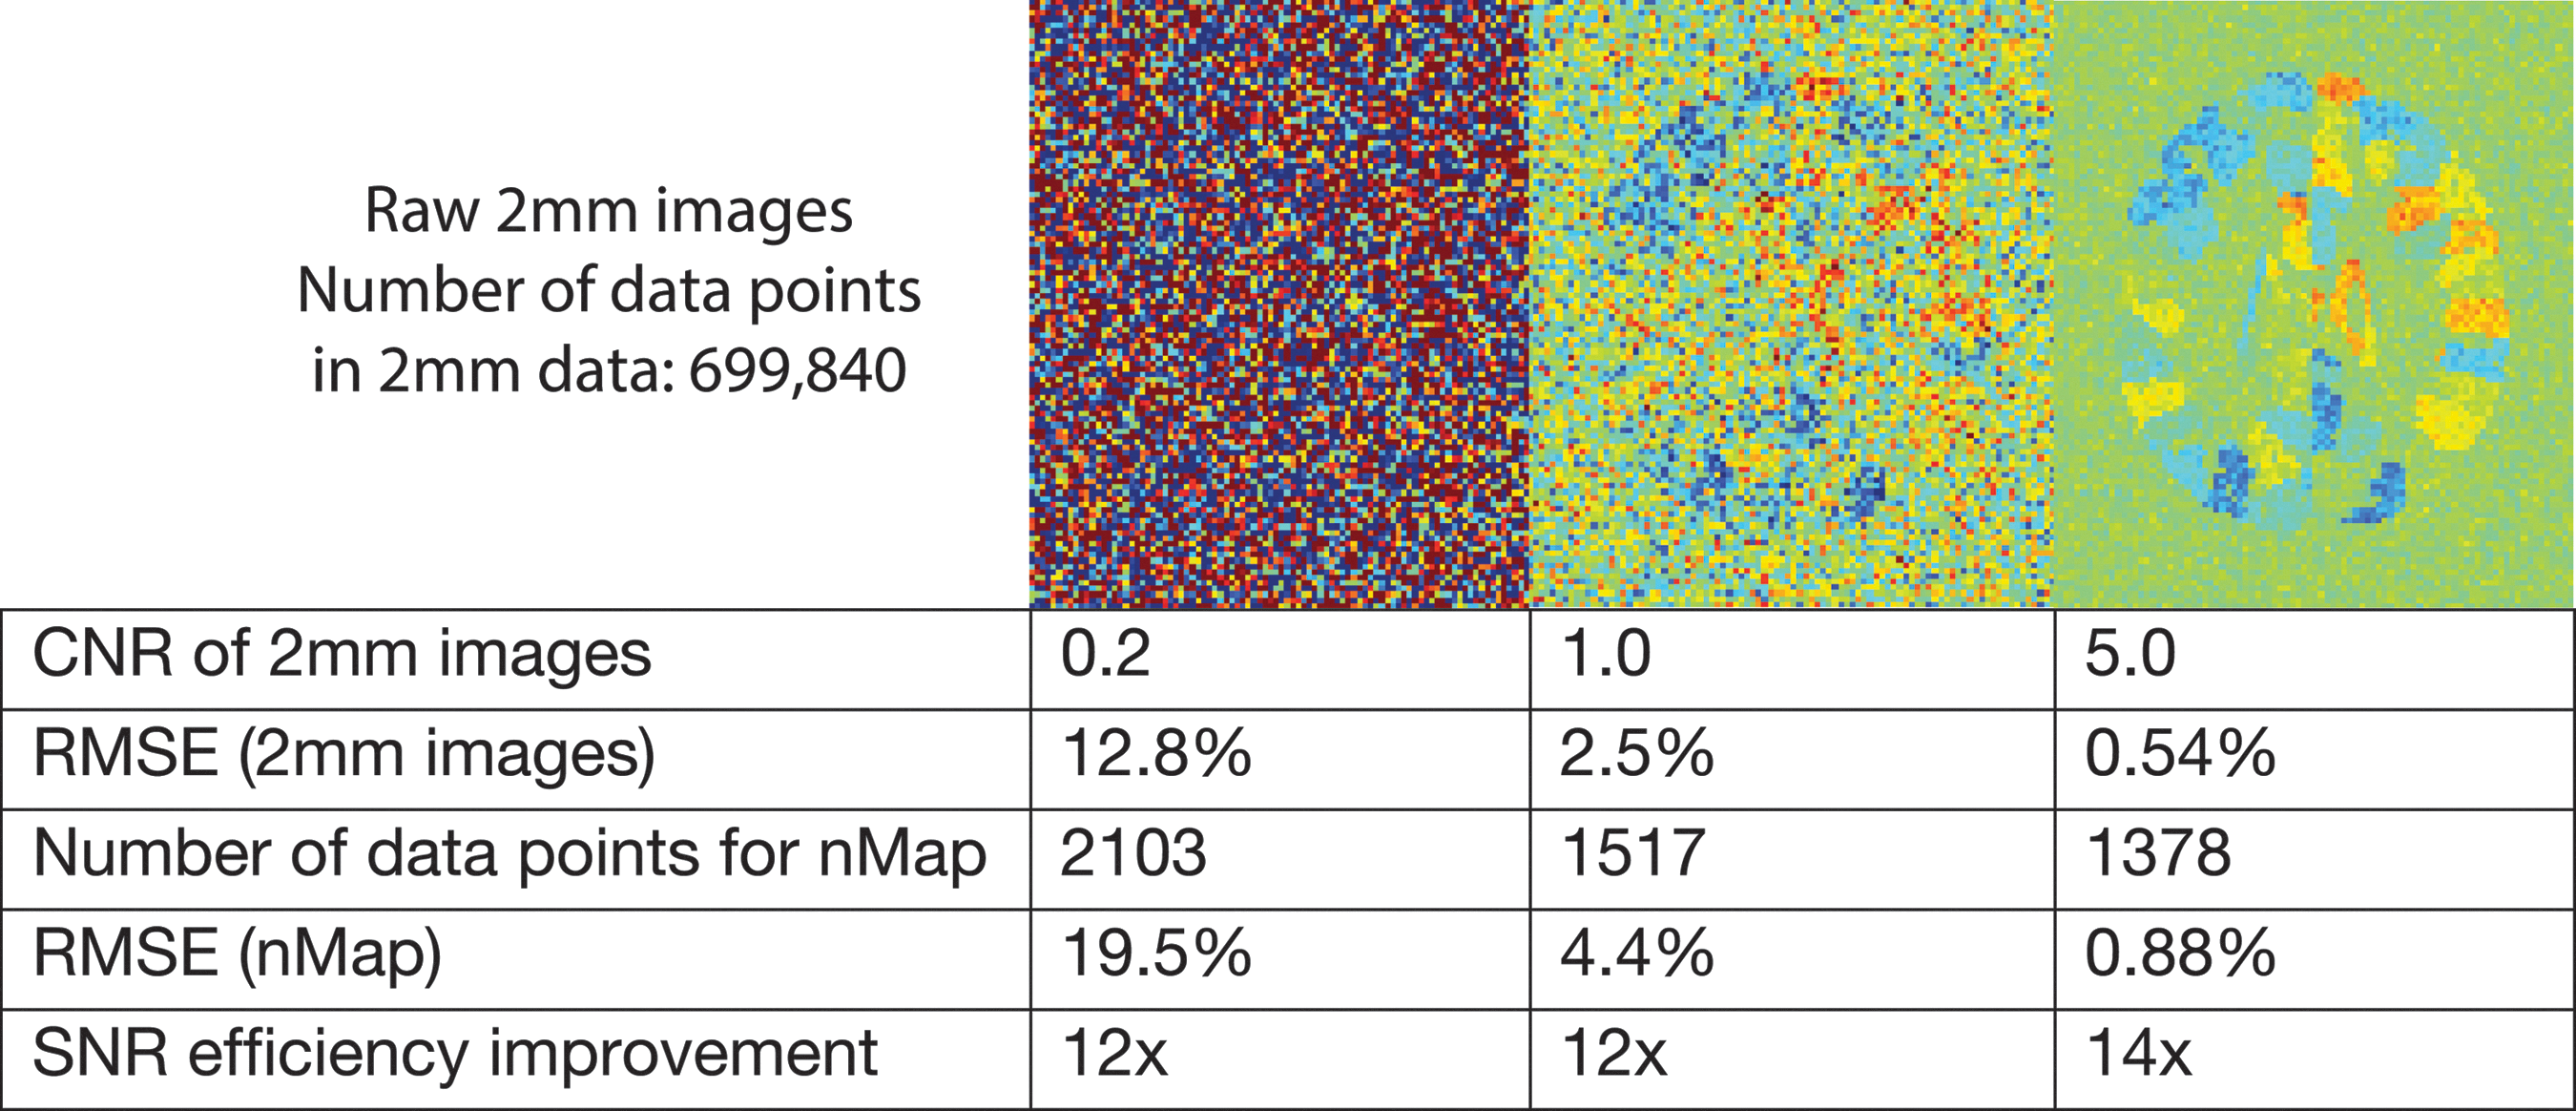
Relative performance of conventional reconstruction and nMap estimation at three levels of contrast-to-noise ratio (CNR).
We noted previously that when the voxel volume is N times smaller than the features of interest, there is a
Discussion
At this point in time, the core limitation in fMRI is still primarily SNR, rather than spatial or temporal resolution. Even for the relatively low resolution of several hundred networks or nodes, fMRI data are typically averaged not only across experiments, but often across subjects to provide statistically reliable information. With potential gains of two to three orders of magnitude in scan time for a given SNR, the direct-mapping approach may be able to enable a transformative step from multisubject averaging to near real-time in a single subject. This would in turn not only increase efficiency, but also allow for the study of much more complex and dynamic thought and behavior. Even within a single subject, a gain in SNR efficiency would allow for shorter scan times and/or the exploration of more or more subtle tasks. The nMap approach can be applied to either connectivity- or task-based experiments, limited primarily by the circumstances under which the network mappings used are expected to be valid.
The currency of higher SNR can also be spent to simultaneously acquire images with multiple forms of contrast. One possibility is to acquire multiple echoes, which can be used to separate BOLD from non-BOLD sources of contrast (Kundu et al., 2012, 2013). Another is to acquire BOLD and CBF contrast, which can be used to estimate CMRO2 and provide a more quantitative measure of brain metabolism (Blockley et al., 2013; Davis et al., 1998; Griffeth et al., 2013; Simon et al., 2013).
In the aforementioned SNR analysis, the calculated noise is thermal, rather than physiological, and is therefore not spatially encoded. In practice, both classes of noise are often important, and indeed the physiological sources of noise, such as subject motion, and cardiac- and respiratory-related modulations, tend to be dominant at lower spatial resolution (higher SNR). Physiological noise should therefore dominate the noise in nMap imaging. However, the higher temporal resolution afforded by the nMapping approach will also enable the use of a temporal sampling rate that is much higher than the cardiac frequency, and should therefore also allow for more effective removal of these noise sources in postprocessing.
In these examples, estimation of the nMap coefficients from the data was trivial, both conceptually and computationally, as it involved a direct least squares solution to the overdetermined set of equations, and the size of the problem (∼2000×300) was small enough that it could be solved using a simple pseudo-inverse of the encoding matrix in less than one second. We note that even with multichannel RF coil acquisition, the problem is likely to be small enough that direct least squares solutions are easy to compute.
One important feature of the proposed framework is the dependence upon the size of the features of interest. In our example (Fig. 2), the nMap had 288 parcels, each composed of ∼500 two-millimeter voxels, leading to a potential for acceleration by a factor of 150. This potential acceleration factor decreases with decreasing feature size, and vanishes when the feature size equals the nominal imaging resolution. However, we anticipate that significant increases in SNR are still available at relatively high resolution, and the resolution limits of this approach are important to characterize. It is also important to note that while a few hundred nodes or networks are at the low end of the resolution spectrum, it is still a larger number than most analysis methods are currently considering. Detailed understanding of the workings of several hundred components in the dynamic human brain in single subjects would already represent a dramatic breakthrough in the study of brain function, and high-quality data at this resolution are therefore highly desirable.
While the potential gains in SNR efficiency described here are large, the implementation of this approach will certainly introduce nonidealities that will reduce the achievable gains in real-world applications. The most obvious sources of these nonidealities are (1) the requirement of good estimates for the geometry of the parcels or networks, and (2) the presence of non-BOLD, non-Gaussian sources of signal fluctuations in the data, such as motion and pulsations. The development of methods to characterize and address these effects will likely be an important task in the initial implementations of the nMapping concept proposed here. To address motion, we note that motion parameters can be estimated from the data itself and used to correct the data as a first preprocessing step. The detection of at least rigid motion parameters can be done with very high accuracy using low k-space data, as evidenced by the low-resolution nature of many motion navigator schemes (Maclaren et al., 2013). After motion correction, we expect that the high temporal resolution nature of the data should be helpful in detecting cardiac- and respiratory-related waveforms with high accuracy for use as regressors in subsequent analysis.
Potential methods to define the geometry of the nMap
Parcellation from standard atlases
This is perhaps the most straightforward source for the definition of the nMap, though it is also likely the least accurate in terms of identifying brain regions that are truly homogeneous and well delineated in an individual subject. An atlas was used in the aforementioned example, but was assumed to be perfect. A test of this approach would be to use real fully sampled human data, and compare the measured functional activity to that calculated using the nMap approach with a fixed atlas and undersampled data. Conversely, this might also be a good way to compare the validity of different atlases.
Networks from ICA
Spatial ICA has historically been one of the most popular methods for detecting resting-state networks from fMRI data. A straightforward application in the context of nMap imaging is to use ICA on fully sampled data sets to determine the network structure for an individual, and subsequently assume that structure in the construction of the nMap bases and collect high-speed, high SNR data under those constraints.
Anatomical constraints
The use of purely anatomical constraints from high-resolution anatomical scans is another relatively straightforward application of the proposed methodology. One potential implementation of interest may be the use of anatomy to constrain the signal to gray matter. It has been shown that the width of the 2D PSF of the BOLD signal along the cortical surface at 3T is ∼4 mm (Parkes et al., 2005). In the HCP processing stream, the cortical surface and deep gray matter are described using ∼90,000 “grayordinates” at 2-mm resolution. This implies that at 4-mm sampling along the cortical surface, there are ∼22,500 parcels, each with dimensions 4×4×3 mm3 (3 mm is the approximate cortical thickness). If combined with parallel acquisition, then there may be enough data in a single 3D scan to estimate this nMap, and the possibility of single-shot nMapping of the whole brain at the resolution of the BOLD PSF would make an exciting goal.
Adaptive geometry
The use of a priori networks or nodes in the construction of the nMap basis may result in a poor fit to the data due to inaccuracy of the a priori information. Because the system is overdetermined, it may be possible to allow the data to adjust the geometry of the networks/nodes. A simple means of doing this would be to parameterize the geometry, and iteratively adjust these parameters to improve the quality of the fit to the data.
In the aforementioned examples, only spatial sparsity is exploited, and no use is made of sparsity in the temporal domain, such as that generated by temporal correlations. However, it is known that fMRI data are in fact sparse in the spatial-temporal domain, as demonstrated in the approximate low-rank nature of fMRI data in the K-T domain (K-T FASTER) (Chiew et al., 2013). In this approach, no basis functions are chosen to describe either spatial or temporal patterns, but low rank of the K-T matrix is assumed, and used to complete undersampled data. The nMap, as defined earlier, which has dimensions of network/node index and time, may also be of low rank, and the use of matrix completion methods may allow for further acceleration.
Finally, we note that similar concepts could apply to constrained reconstruction of nMaps from positron emission tomography (PET), magnetoencephalography (MEG), and electroencephalography (EEG) data, with the idea that predefined networks might in some cases bring the source reconstruction problem in these methods from underdetermined to overdetermined regimes.
Conclusions
We have introduced here the theoretical framework for direct imaging of brain networks. This approach is shown to have the potential to provide an order of magnitude increase in network imaging SNR, and thereby provide access to detailed dynamic imaging of complex brain activity in single subjects.
Footnotes
Author Disclosure Statement
No competing financial interests exist.