
Abstract
One of the major goals of the NIH Blueprint Human Connectome Project was to map and quantify the white matter connections in the brain using diffusion tractography. Given the prevalence of complex white matter structures, the capability of resolving local white matter geometries with multiple crossings in the diffusion magnetic resonance imaging (dMRI) data is critical. Increasing b-value has been suggested for delineation of the finer details of the orientation distribution function (ODF). Although increased gradient strength and duration increase sensitivity to highly restricted intra-axonal water, gradient strength limitations require longer echo times (TE) to accommodate the increased diffusion encoding times needed to achieve a higher b-value, exponentially lowering the signal-to-noise ratio of the acquisition. To mitigate this effect, the MGH-USC Connectom scanner was built with 300 mT/m gradients, which can significantly reduce the TE of high b-value diffusion imaging. Here we report comparisons performed across b-values based on q-ball ODF metrics to investigate whether high b-value diffusion imaging on the Connectom scanner can improve resolving complex white matter structures. The q-ball ODF features became sharper as the b-value increased, with increased power fraction in higher order spherical harmonic series of the ODF and increased peak heights relative to the overall size of the ODF. Crossing structures were detected in an increasingly larger fraction of white matter voxels and the spatial distribution of two-way and three-way crossing structures was largely consistent with known anatomy. Results indicate that dMRI with high diffusion encoding on the Connectom system is a promising tool to better characterize, and ultimately understand, the underlying structural organization and motifs in the human brain.
Introduction
Diffusion magnetic resonance imaging (dMRI) is a noninvasive method for measuring tissue microstructure that works by probing the MR signal attenuation due to the diffusion of water molecules (Stejskal and Tanner, 1965). Early diffusion images demonstrated the anisotropy of water diffusion in white matter, with increased diffusion along the principal axonal direction (Chien et al., 1990). Subsequently, diffusion tensor imaging was proposed by Basser and colleagues (1994) to more fully characterize the anisotropy of Brownian motion of water molecules in tissues and has been widely used to measure white matter structural properties in neuroimaging studies.
However, due to the underlying assumption of Gaussian diffusion, tensor-based methods cannot resolve intravoxel fiber crossings. To reveal the non-Gaussian diffusion profile stemming from crossing fibers, more complete angular sampling of the diffusion signal is necessary to resolve multiple crossing fibers. Furthermore, as the b-value is increased, the remaining signal becomes increasingly reflective of water diffusion in highly restrictive water compartments. Thus, it is commonly recognized that the improved diffusion contrast from higher b-values provides improved contrast in the angular domain (Alexander and Barker, 2005; Cho et al., 2008; Clark and Le Bihan, 2000; Descoteaux et al., 2009; Jensen et al., 2005; Jones et al., 2013; Tournier et al., 2004, 2008; Tuch, 2004; Yoshiura et al., 2001; Zhan and Yang, 2006). For example, Tournier modeled the voxel as multiple populations of stacked cylinders and showed that, as the b-value increases, the angular plots of the diffusion profile become narrower (Tournier, 2011). However, the question remains as to when the lower signal-to-noise ratio (SNR) of the higher b-value acquisition negates the benefit of this increased angular contrast.
To answer this question White and Dale (2009) modeled the fiber orientation estimate uncertainty as a function of b-value and spherical harmonic expansion order (L) using a tensor fiber model and concluded that a b-value of about 6200 sec/mm2 was needed for L=8 for their modeled SNR. More recently, Tournier et al. (2013) found that the L>0 content of the spherical harmonic series of diffusion weighted (DW) signal increases as b-value increases. Using their experimental conditions, it was suggested that the highest attainable angular contrast could be achieved with a b-value of 3000 sec/mm2. Since the tradeoff is between contrast and noise level, the optimum b-value was expected to increase if SNR could be improved by other means.
In this report, we experimentally study the effect of increasing b-value on the angular contrast and resultant detection of multiple fiber crossings, extending our preliminary analysis (Nummenmaa et al., 2014). We use a set of real spherical harmonics (Descoteaux et al., 2007) for the reconstruction of q-ball (Tuch, 2004) diffusion orientation distribution function (ODF) from high angular resolution diffusion imaging (HARDI) data collected on a scanner capable of obtaining very high gradient strengths up to 300 mT/m. This unique scanner was constructed by Siemens for the MGH-USC Human Connectome Project (HCP) consortium (McNab et al., 2013; Setsompop et al., 2013) and was based on their 3T Magnetom Skyra platform. With this scanner, very high b-values can be obtained at short echo times (TE), allowing us to assess the benefit of higher diffusion contrast with minimal loss of sensitivity from T2 decay. We quantify the number of resolved ODF peaks representing different fiber populations in each voxel while varying the b-value and angular sampling resolution. We also study the shape and quantify the angular frequency content of the ODF as a function of b-value. Finally, we perform tractography on some of the datasets to illustrate the potential implications of higher b-value acquisitions for mapping structural brain connectivity.
Materials and Methods
Data acquisition
The MRI data were acquired from three healthy adults on the 3T Siemens MGH-USC Connectom scanner. The participants gave written informed consent, and the experiments were carried out with approval from the institutional review board. The higher strengths of the Connectom gradients lead to proportionately larger eddy currents, and a more precise calibration of the eddy current pre-emphasis and B 0 compensation was performed by taking into account the second-order terms of eddy currents, so that eddy-current-induced distortions in the images would be low enough to be corrected with standard post-processing methods. A custom-made, 64-channel, phased array coil was used for signal reception (Keil et al., 2013). The diffusion acquisition was performed using a monopolar Stejskal-Tanner pulsed gradient spin echo, echo planar imaging (EPI) sequence. A fast low-angle-excitation echo train (Bhat et al., 2014; Polimeni et al., 2013) scan line correction technique allowed for acquisition of a stable autocalibration signal. Parallel imaging using generalized autocalibrating partially parallel acquisition (GRAPPA) method was combined with blipped-controlled aliasing in parallel imaging simultaneous multi-slice (SMS) EPI (Feinberg et al., 2010; Feinberg and Setsompop, 2013; Moeller et al., 2010; Setsompop et al., 2012a,b) to accelerate image acquisition.
Each dataset also included a high-resolution T1-weighted anatomical scan acquired with the magnetization-prepared rapid gradient echo (MPRAGE) sequence along with diffusion scans at multiple b-values. Two subjects were scanned with diffusion protocol No. 1 consisting of four different b-values of 1000 sec/mm2 (64 directions), 3000 sec/mm2 (64 directions), 5000 sec/mm2 (128 directions), and 10,000 sec/mm2 (256 directions). Different b-values were achieved by varying the diffusion gradient amplitudes. The gradient pulse duration (δ) and diffusion time (Δ) were fixed at 12.9 and 21.8 msec, respectively. Other scanning parameters included TE/repetition time (TR)=57/8800 msec, field of view (FOV)=21×21 cm2, 96 slices, 1.5 mm isotropic voxels, partial Fourier=6/8, GRAPPA iPAT factor=3, SMS=1, band width (BW)=1984 Hz/pixel, and echo spacing of 0.63 msec. The total acquisition time for each subject was ∼89 min.
To compare different b-value acquisitions with identical angular resolution, one subject was scanned with diffusion protocol No. 2 consisting of three different b-values: 3000 sec/mm2 (256 directions), 5000 sec/mm2 (256 directions), and 10,000 sec/mm2 (256 directions), and the 10k (i.e., b=10,000 sec/mm2) shell was averaged for two repetitions. Other imaging parameters included δ/Δ=11.4/27.2 msec, TE/TR=59/4500 msec, FOV=21×21 cm2, 98 slices, 1.5 mm isotropic voxels, partial Fourier=7/8, GRAPPA iPAT factor=3, SMS=2, shift factor=3, BW=1984 Hz/pixel, and echo spacing of 0.63 msec. The total acquisition time was ∼89 min. For both protocols, a non-DW image (b=0 image) was acquired every 14 images. As in diffusion protocol No. 1, different b-values were achieved by varying the diffusion gradient amplitudes.
Data preprocessing
Diffusion data preprocessing consisted of two steps: gradient nonlinearity distortion correction and motion/eddy current distortion correction. The gradient nonlinearity distortions were corrected using in-house developed MATLAB tools, which computed the nonlinear transformation from the distorted image to the undistorted image given the spatial map of gradient nonlinearity for the particular gradient coil used for imaging (Glasser et al., 2013; Jovicich et al., 2006). Image data were resampled using spline interpolation.
The b=0 images interspersed throughout the diffusion scans were used to estimate head motions with respect to the initial time point (first b=0 image), where the rigid transformations were calculated with the boundary-based registration tool in the FreeSurfer package version 5.3.0 (Greve and Fischl, 2009) using the MPRAGE anatomical data as a reference. For each b=0 image, this transformation was then applied to itself and the following 13 DW image volumes to correct for head movements. Eddy current distortions (as well as residual motion) were corrected using the “EDDY” tool in FSL version 5.0 (Andersson et al., 2012). The diffusion data were concatenated across different shells and corrected jointly for eddy current distortion. The gradient direction table was adjusted to account for rigid transformations resulting from motion and eddy current corrections.
q-Ball ODF comparison across b-values
Characterizing the shape of the ODF
The q-ball ODFs were reconstructed for each shell with maximum spherical harmonic order of eight and Laplace-Beltrami regularization weight parameter of 0.006 (Descoteaux et al., 2007), and the ODFs were normalized by subtracting the ODF minimum. First, in order to compare the shape of the ODF across different b-values, the ODFs of different b-values were overlaid for qualitative visual evaluation. Second, as a quantitative figure of merit, the ODF peak height, or quantitative anisotropy, was used to measure fiber-crossing properties (Yeh et al., 2010). In this study, up to three dominant peaks were considered, as illustrated in Figure 1. Particularly, in regions with known multiple crossing fibers, larger second and third peaks were desirable features for the purpose of resolving these crossing structures.
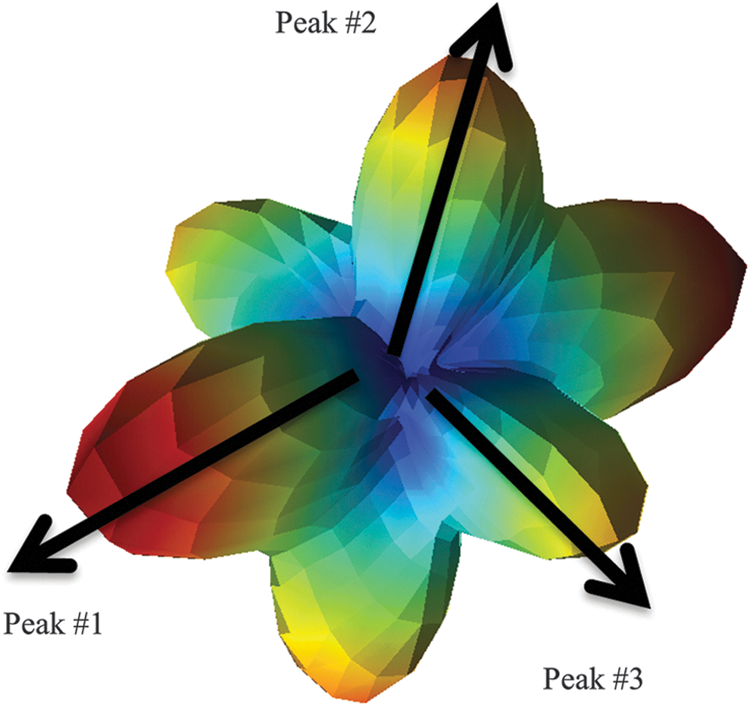
Illustration of the figure of merit based on peak height of the crossing-fiber orientation distribution function (ODF).
Power spectrum of the harmonic series of the ODF
Higher spherical harmonic orders correspond to higher angular frequencies in the harmonic series expansion, and thus can characterize the sharper features of the shape of ODF. To quantify the sharpness of the ODF reconstructions as a function of increasing b-value, the relative power contribution of order L in the spherical harmonic series of the ODF (EL
) was computed according to (Hess et al., 2006).
In the aforementioned equation, ET
is the total power of up to eighth-order spherical harmonic representation of all L≥2, such that
Estimating number of fibers in white matter voxels
To assess the ability to resolve crossing fibers, the number of voxels with single or multiple fibers in the white matter was counted and compared across b-values.
A white matter mask was obtained from the automated Freesurfer segmentation of the MPRAGE image. The transformation used to coregister the b=0 image and MPRAGE image was used to align the white matter mask with the diffusion data. To avoid partial volume effects from cerebrospinal fluid (CSF), the white matter mask was further thresholded based on the mean diffusivity (MD) of the voxels within the mask (Jeurissen et al., 2013). Briefly, the voxels with MD higher than [median (MD)+1.5×IQR (MD)] were removed, where IQR is the interquartile range over the white matter mask.
ODF peak orientations were found by searching 642 evenly distributed spherical sample points for local maxima. Subsequently, a series of thresholding criteria for the peaks was applied locally in each voxel, including (1) the amplitudes of the second and the third peaks needed to be ≥5% of the first peak to become a candidate and (2) a candidate peak was excluded if its orientation yielded a crossing angle smaller than 35° from any peak(s) with higher amplitude. Since ODF peaks with lower amplitudes have a higher chance of resulting from noise, setting thresholds on the amplitude of the peak was commonly adopted to remove spurious peaks (Cohen-Adad et al., 2011; Jeurissen et al., 2013). The angular threshold between candidate peaks was imposed because the angular resolution of the eighth-order spherical harmonic, calculated as the full width at half maximum of the main lobe, is ∼35° (Hess et al., 2006).
Additionally, a global threshold on the ODF peaks was derived as follows. The standard deviation of the DW signal across different gradient directions in CSF within the lateral ventricles was used to estimate the temporal noise fluctuations in the DW images, assuming isotropic diffusion in CSF. The level of noise fluctuation at each b-value was separately estimated using the mean temporal fluctuation in the mask of the lateral ventricles. The calculated standard deviation was then used to generate 50,000 instances of Gaussian-distributed random noise, which were used to generate synthetic ODFs. The maximum amplitude of fluctuation in each synthetic ODF was then determined. The distribution of these maximum amplitudes provided an estimate of the distribution of maximum peak amplitudes due to noise (hereafter referred to as noise peaks). The mean and standard deviation of the noise peaks were then calculated to provide global threshold values that could be applied to all the voxel-wise-calculated ODFs.
To explore the impact of the global thresholds on the ODF-based metrics, a range of threshold values were tested. Specifically, the threshold was calculated as N (N=0, 0.5, 1,…, 10) times the standard deviation above the mean of the noise peaks. N=2 was selected to report the spatial distribution of white matter voxels containing one, two, and three fibers.
Tractography
In addition to the crossing-fiber ODF metrics, we performed tractography using DSI studio (
Results
The shape of the ODF across b-values
The q-ball ODFs of different b-values from one subject scanned with protocol No. 1 are shown in Figure 2. In a region of interest near the centrum semiovale, the sharpness of the ODF is clearly found to increase as b-value increases (Fig. 2a). To facilitate visual comparison, the ODFs of different b-values are overlaid together to demonstrate any differences (Fig. 2b). The ODFs of the 10k shell are shown in opaque color, while the other shells are denoted in transparent color, with the 1k shell being the outmost layer, and the 3k and 5k shells being consecutive layers inward, respectively.
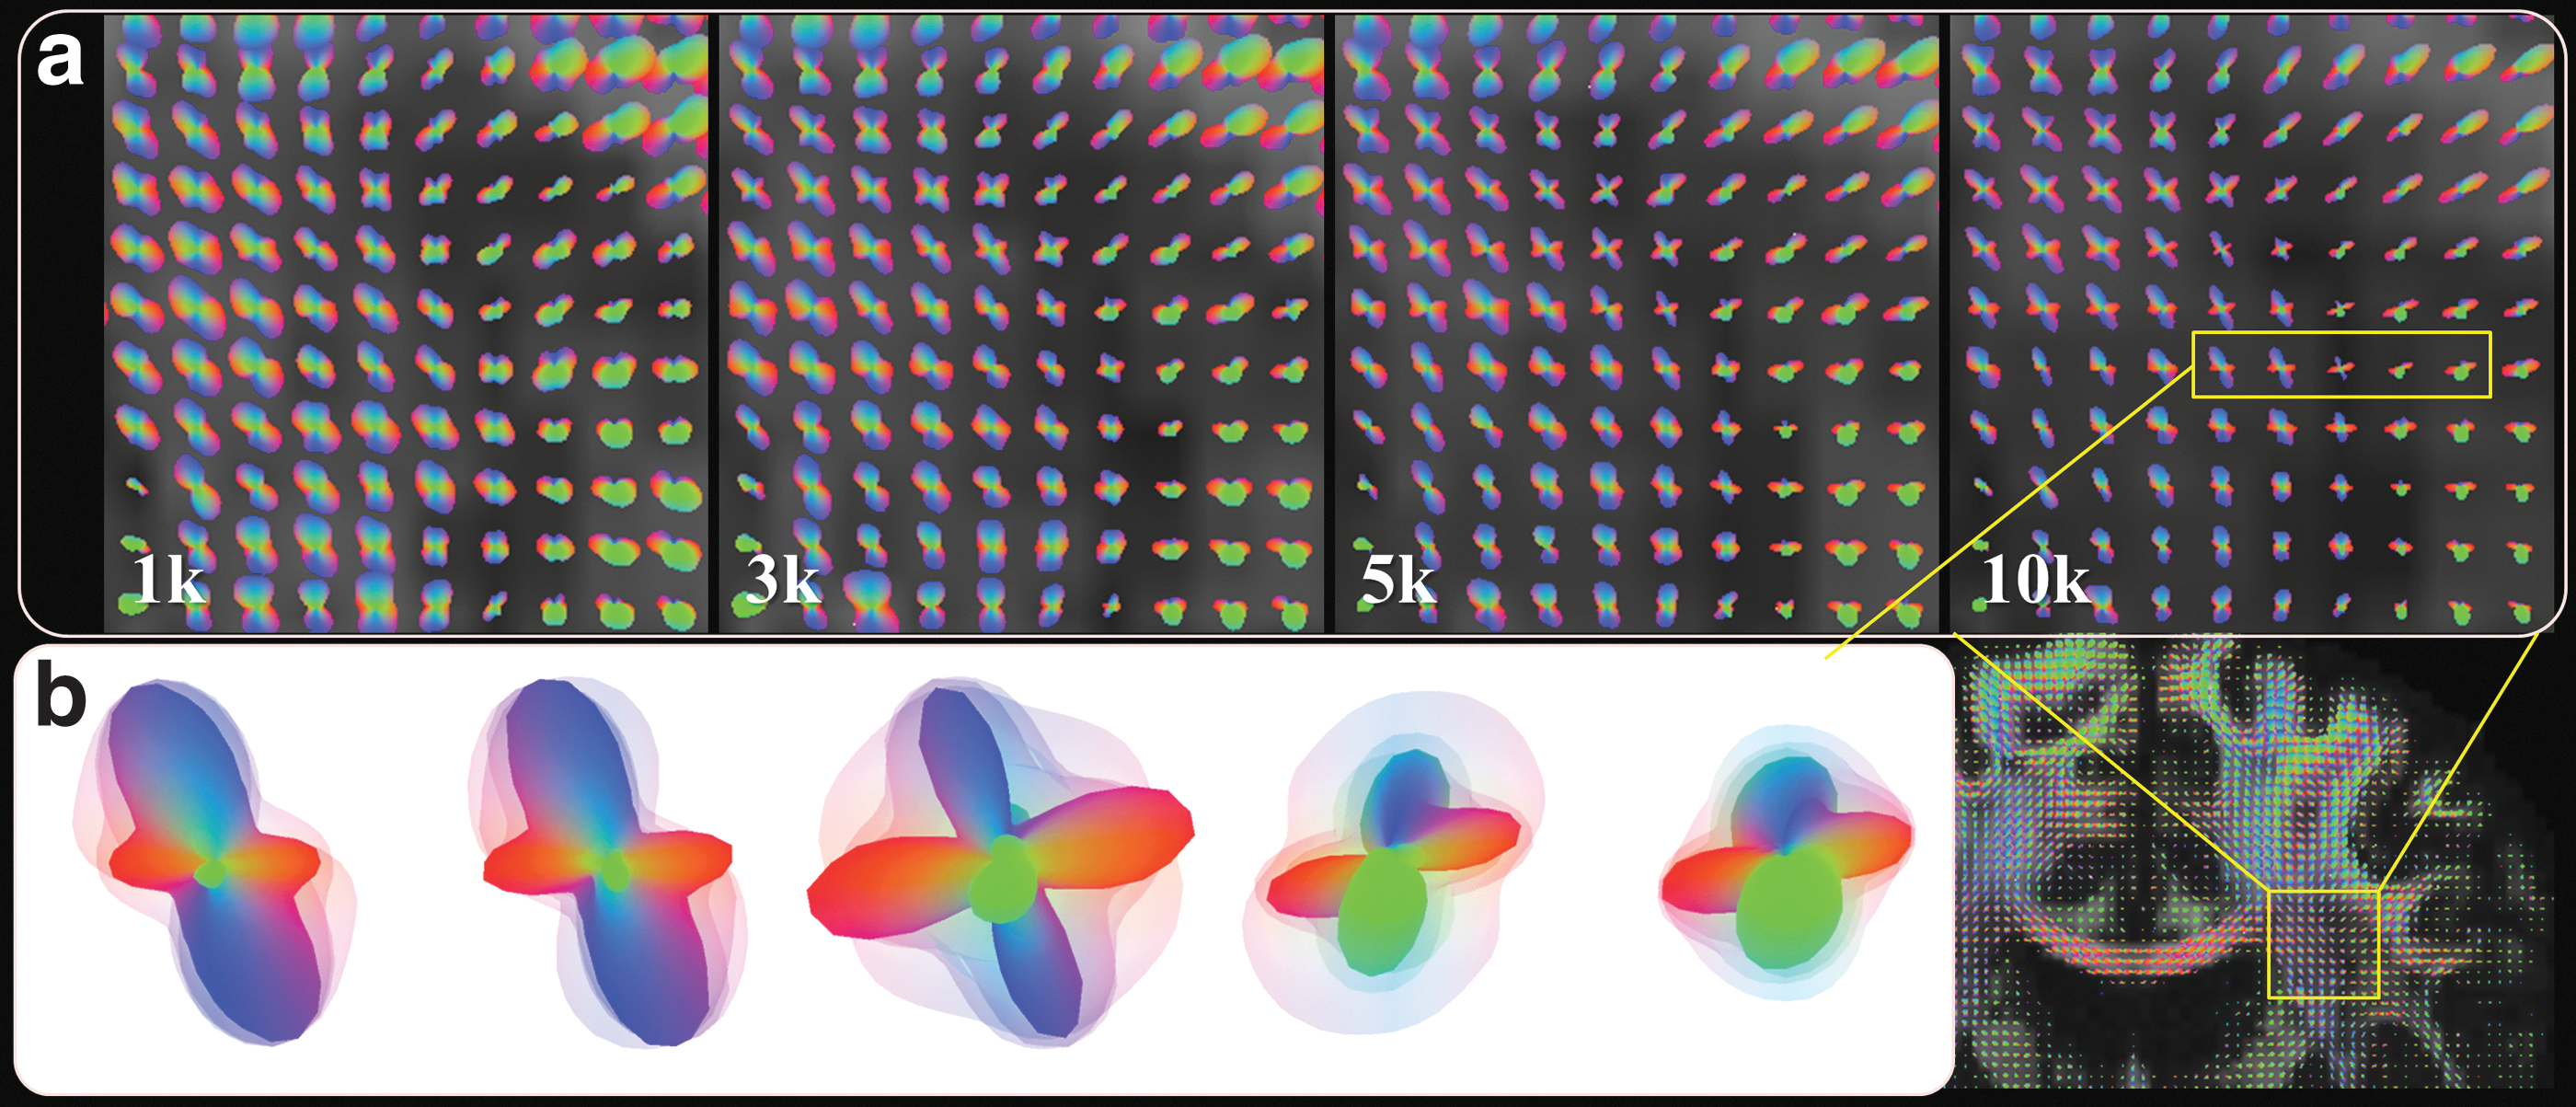
The q-ball ODF comparisons across b-values.
The ODF-peak-height metrics were calculated for each of the three dominant peaks and compared across b-values. In this analysis, the average of the largest ODF inside the white matter of each shell was globally scaled to one to prevent noise amplification, and then the ODF was normalized locally by subtracting the minimum. As shown in Figure 3a, when the gray scales were adjusted to reflect the full dynamic range of ODF-peak-heights for each b-value, the spatial maps of the heights of the most dominant ODF peaks (peak No. 1) were largely identical across different b-values. This indicates that the white matter structures represented by the most dominant ODF peak could be resolved identically across different b-values. For the peak No. 2, the 5k and 10k shells were able to resolve more crossing structures than the 1k and 3k shells, and the 10k shell showed somewhat improved continuity in the spatial maps than the 5k shell (Fig. 3b). Peak No. 3 was largely absent in the lower b-value data (i.e., 1k and 3k), while the 10k shell showed superior performance than the 5k shell in resolving crossing structures that were anatomically plausible (Fig. 3c). For each of the three peaks, the peak heights (relative to the overall size of the ODF) increased as b-value increased, mainly due to the decrease in the isotropic “baseline” in the ODF. Taken together, the results showed both qualitatively and quantitatively that the higher b-value acquisitions were able to capture finer details of the ODFs better, leading to improved delineation of more complex three-way fiber crossings.
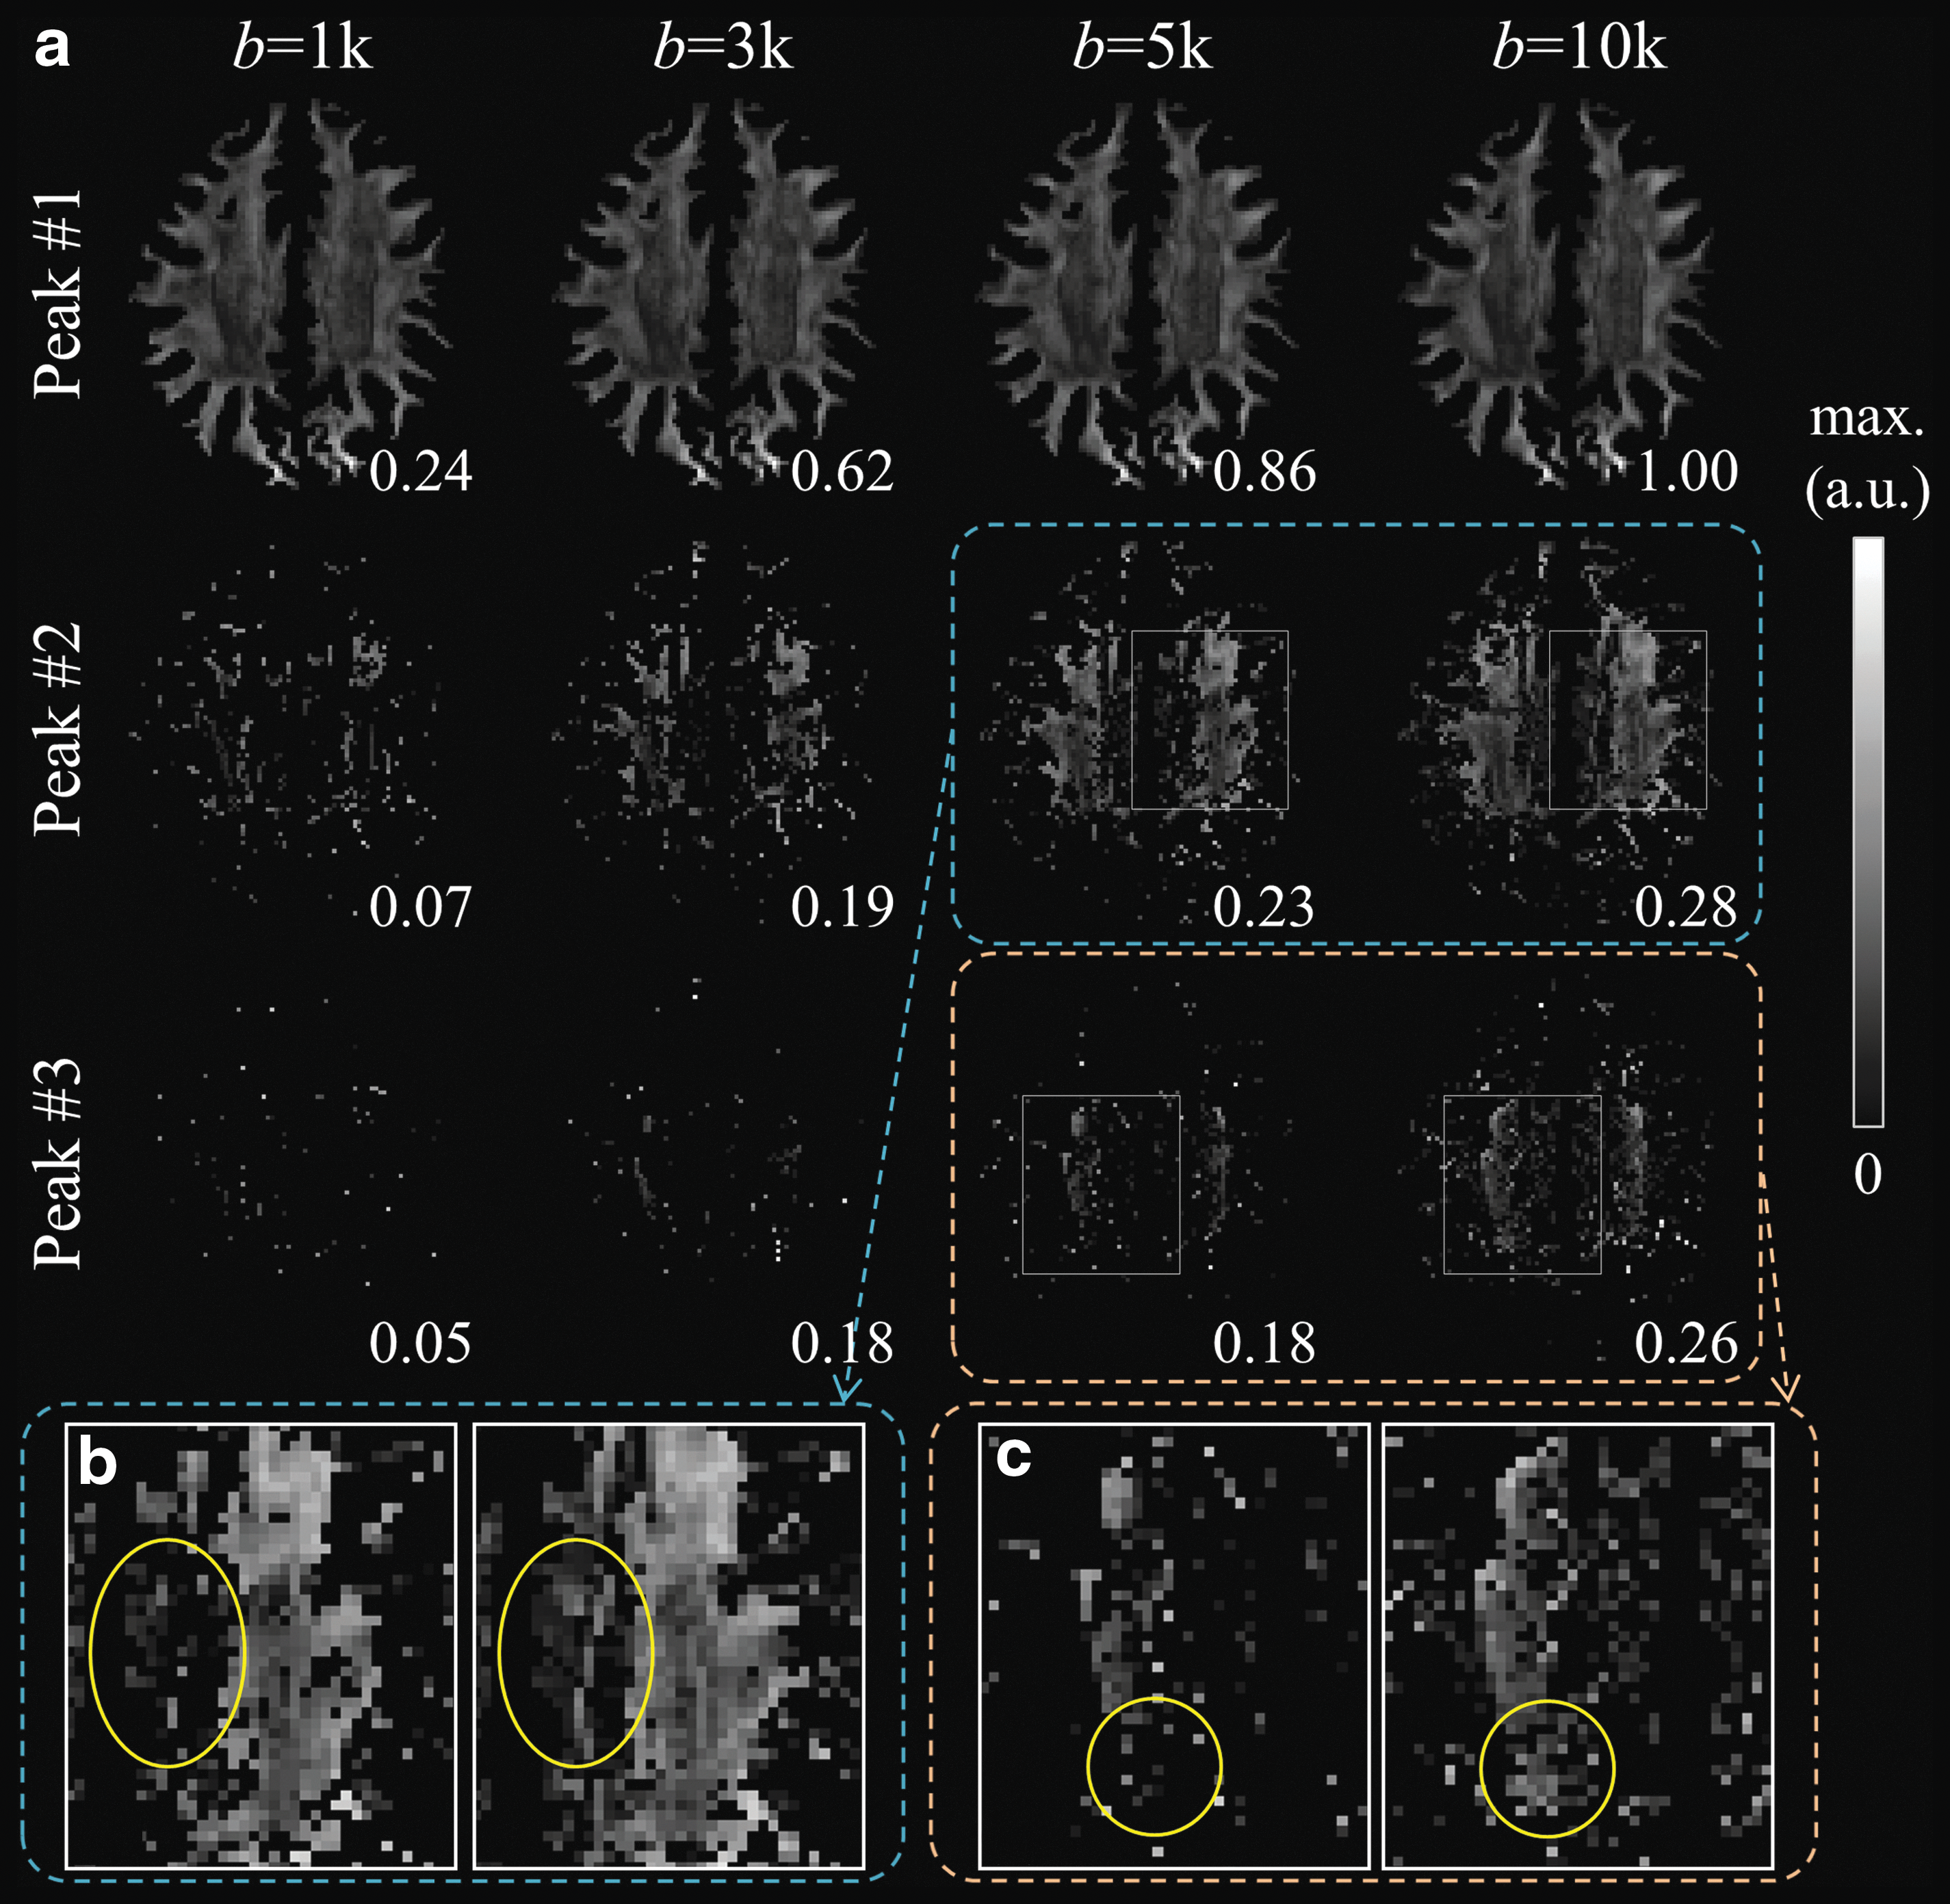
Comparison of the ODF peak heights.
The power spectrum in the harmonic series of the ODF
The relative power contributions of different angular frequencies to the ODF reconstruction are shown in Figure 4. The results demonstrate that the ODFs reconstructed from higher b-value data showed a larger fraction of energy in the higher harmonic orders. This was consistent with the qualitative ODF sharpening observed with increasing b-value. To investigate the potential influence of unmatched angular resolution in the different shells in protocol No. 1, the same figure of merit was calculated with the data acquired with protocol No. 2. The results show that while all the shells have identical 256 diffusion weighting directions (matched to the 10k shell of protocol No. 1), the same effect of increasing power fraction in the higher-order harmonics with increasing b-value was still observed. We can therefore conclude that the higher b-value data contained a higher degree of spatial detail in the ODFs.
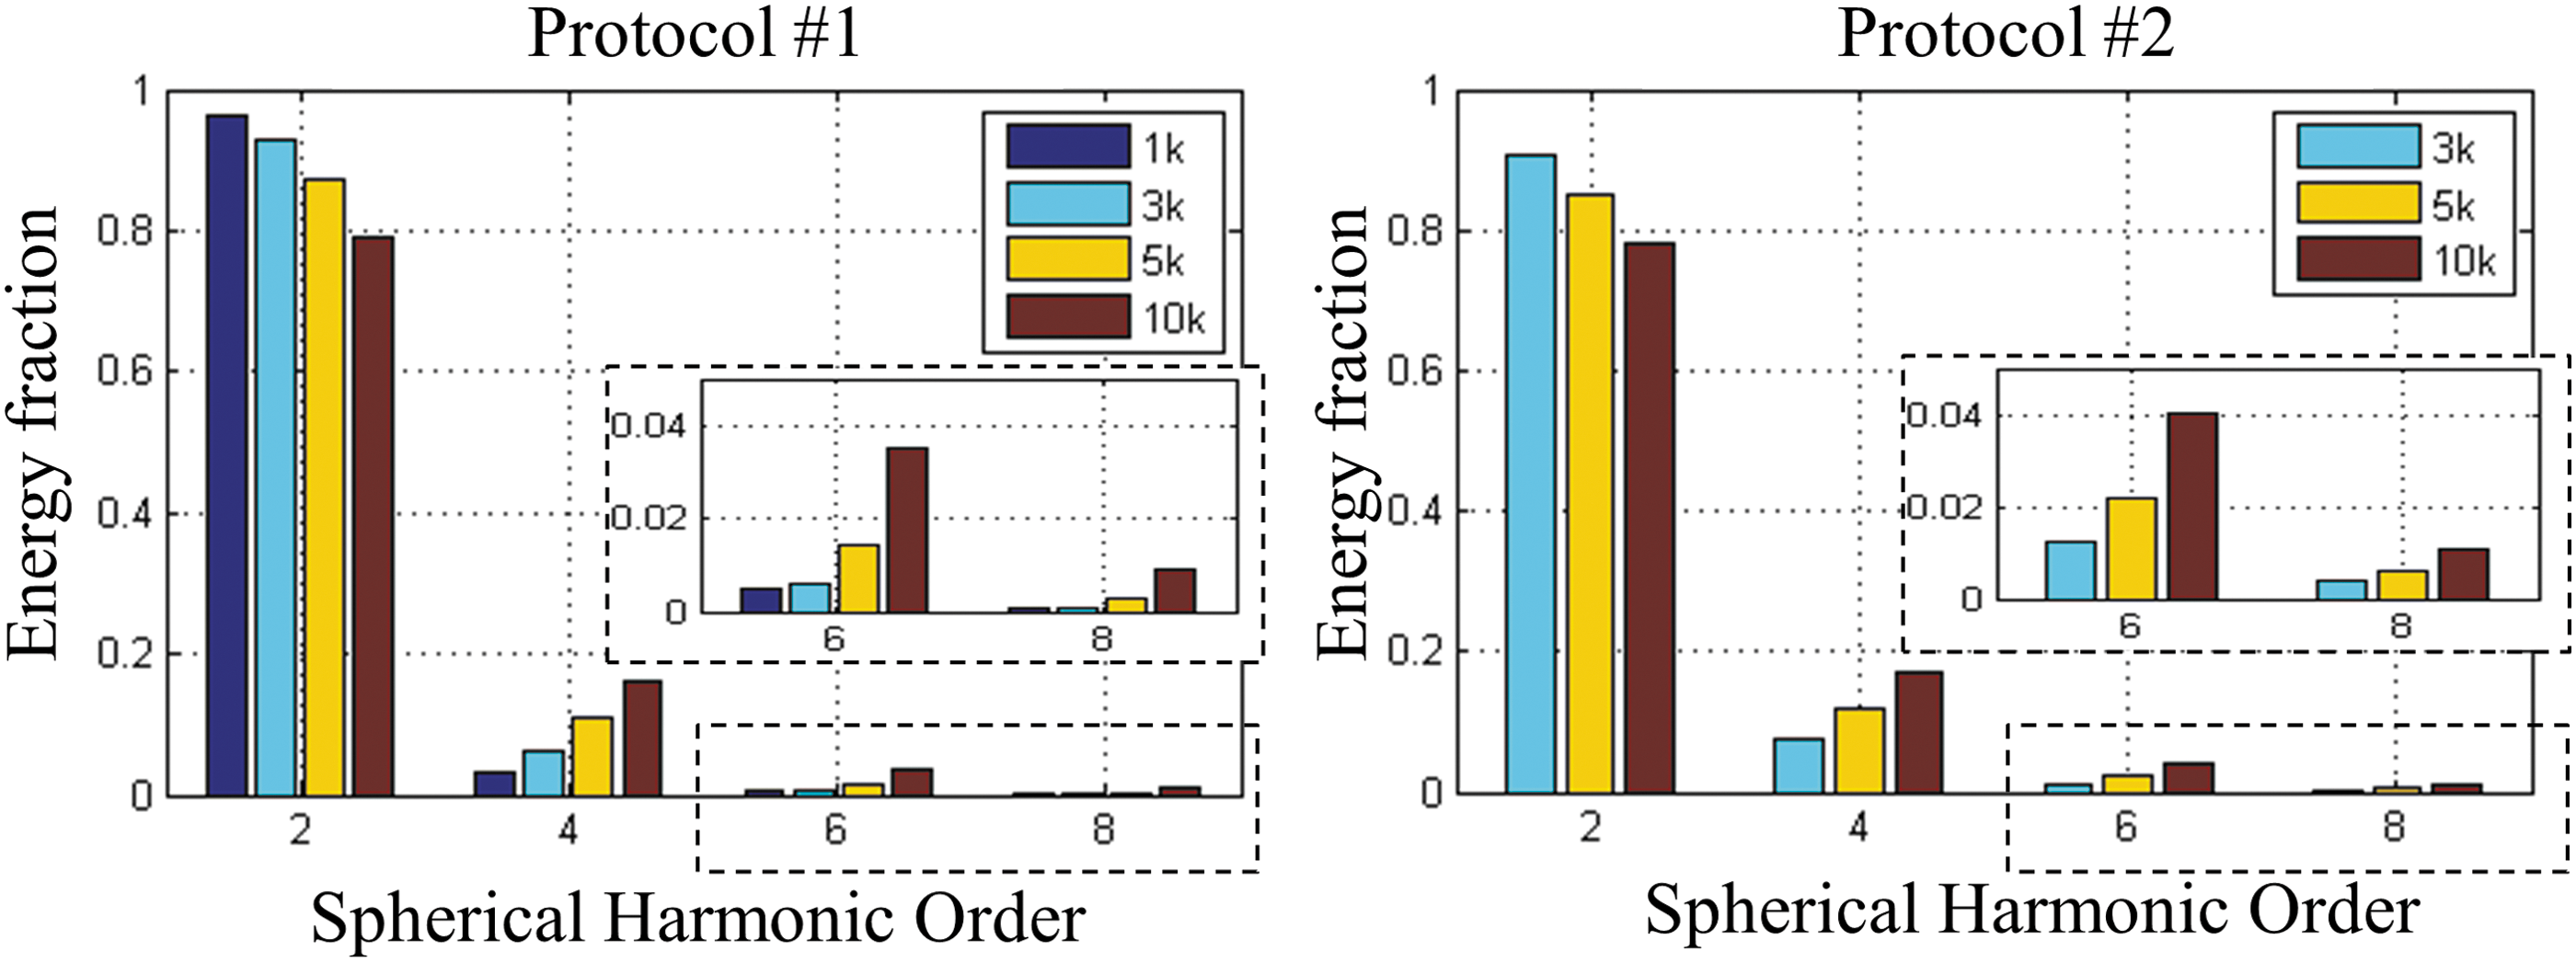
The power contribution to ODF anisotropy for b-values ranging from 1k to 10k sec/mm2. The left and right panels show the results for diffusion protocols No. 1 and No. 2, respectively.
Estimating number of fibers in white matter voxels
The relationship between threshold values and the fraction of the white matter voxels containing one, two, or three fibers was explored first (Fig. 5). As the threshold increased, the smallest ODF peaks (peak No. 3) lower than the threshold were removed, and thus the fraction of white matter voxels containing three-way crossings monotonically decreased. For voxels containing a single fiber (blue curve) and two-way crossings (red curve), two mechanisms simultaneously contributed to the observed changes. In the single-fiber case, (1) as the threshold increased, the voxels in which the peak No. 2 and peak No. 3 were removed became single-fiber voxels, thereby contributing to a positive change (i.e., the fraction of single-fiber voxels increased) and (2) when the threshold exceeded the largest peak in a particular voxel, this voxel was considered as containing no fiber at all, and this will consequently contribute to a negative change. The fraction of the sum of voxels containing at least one fiber (black curve) is a reflection of the degree of stringency of the threshold; that is, when the curve decreased from unity, it indicated that the threshold started to become overly stringent, assuming at least one fiber compartment exists in these white matter voxels. Figure 5 shows that with increasing b-values, a higher fraction of white matter voxels was identified as containing multiple fibers. This trend was not attributable to higher angular resolution in the shells with higher b-value, since similar results were found in the dataset acquired with protocol No. 2.
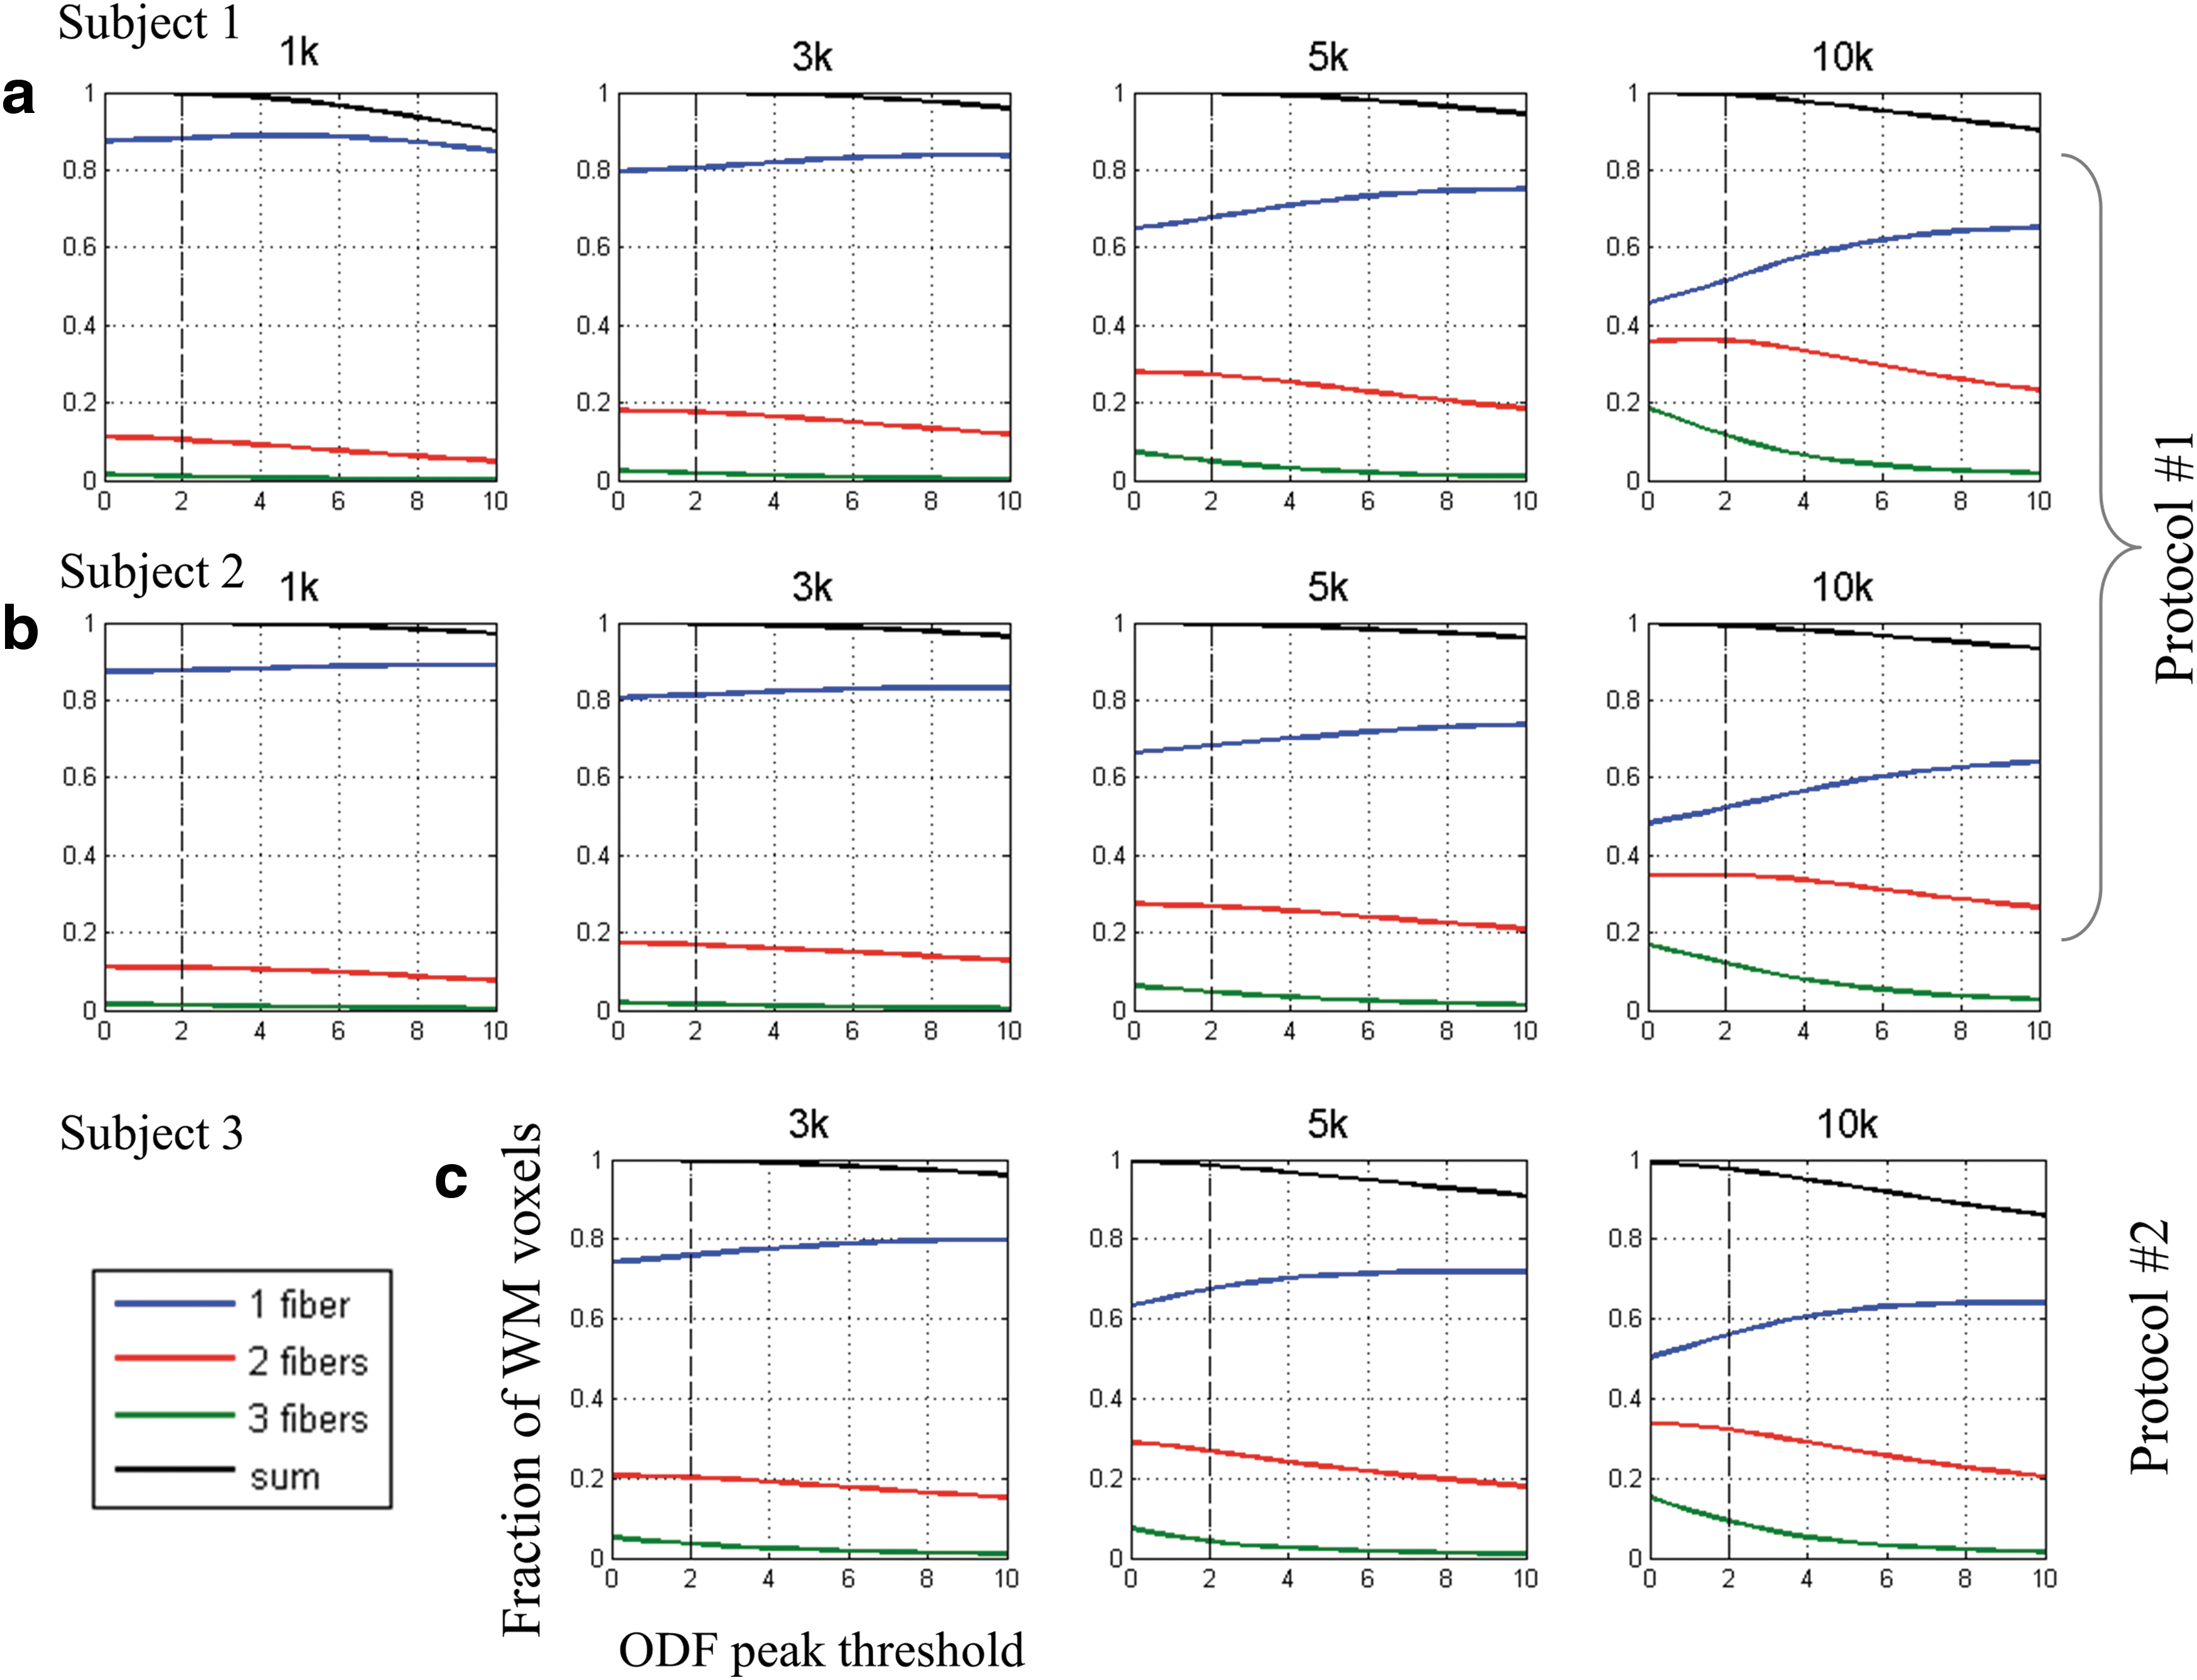
Fractions of white matter voxels with single and multiple fibers for different values of threshold. The ODF peak threshold was labeled as N (N ranges from 0 to 10) times standard deviation above the mean of the noise peaks. Data from subjects 1 and 2
The spatial distribution of the number of fibers is shown in Figure 6, where the ODF peak threshold was selected to be two times the standard deviation above the mean of the noise peaks. A higher percentage of white matter voxels was identified as containing crossing fibers (Fig. 6) as b-value increased. These maps of distribution are largely consistent with known anatomy. For instance, the centrum semiovale region, which is expected to contain voxels with three-way crossings of the cortico-spinal tract, superior longitudinal fasciculus, and the inter-hemispheric association fibers, was better delineated by the higher b-value acquisitions.
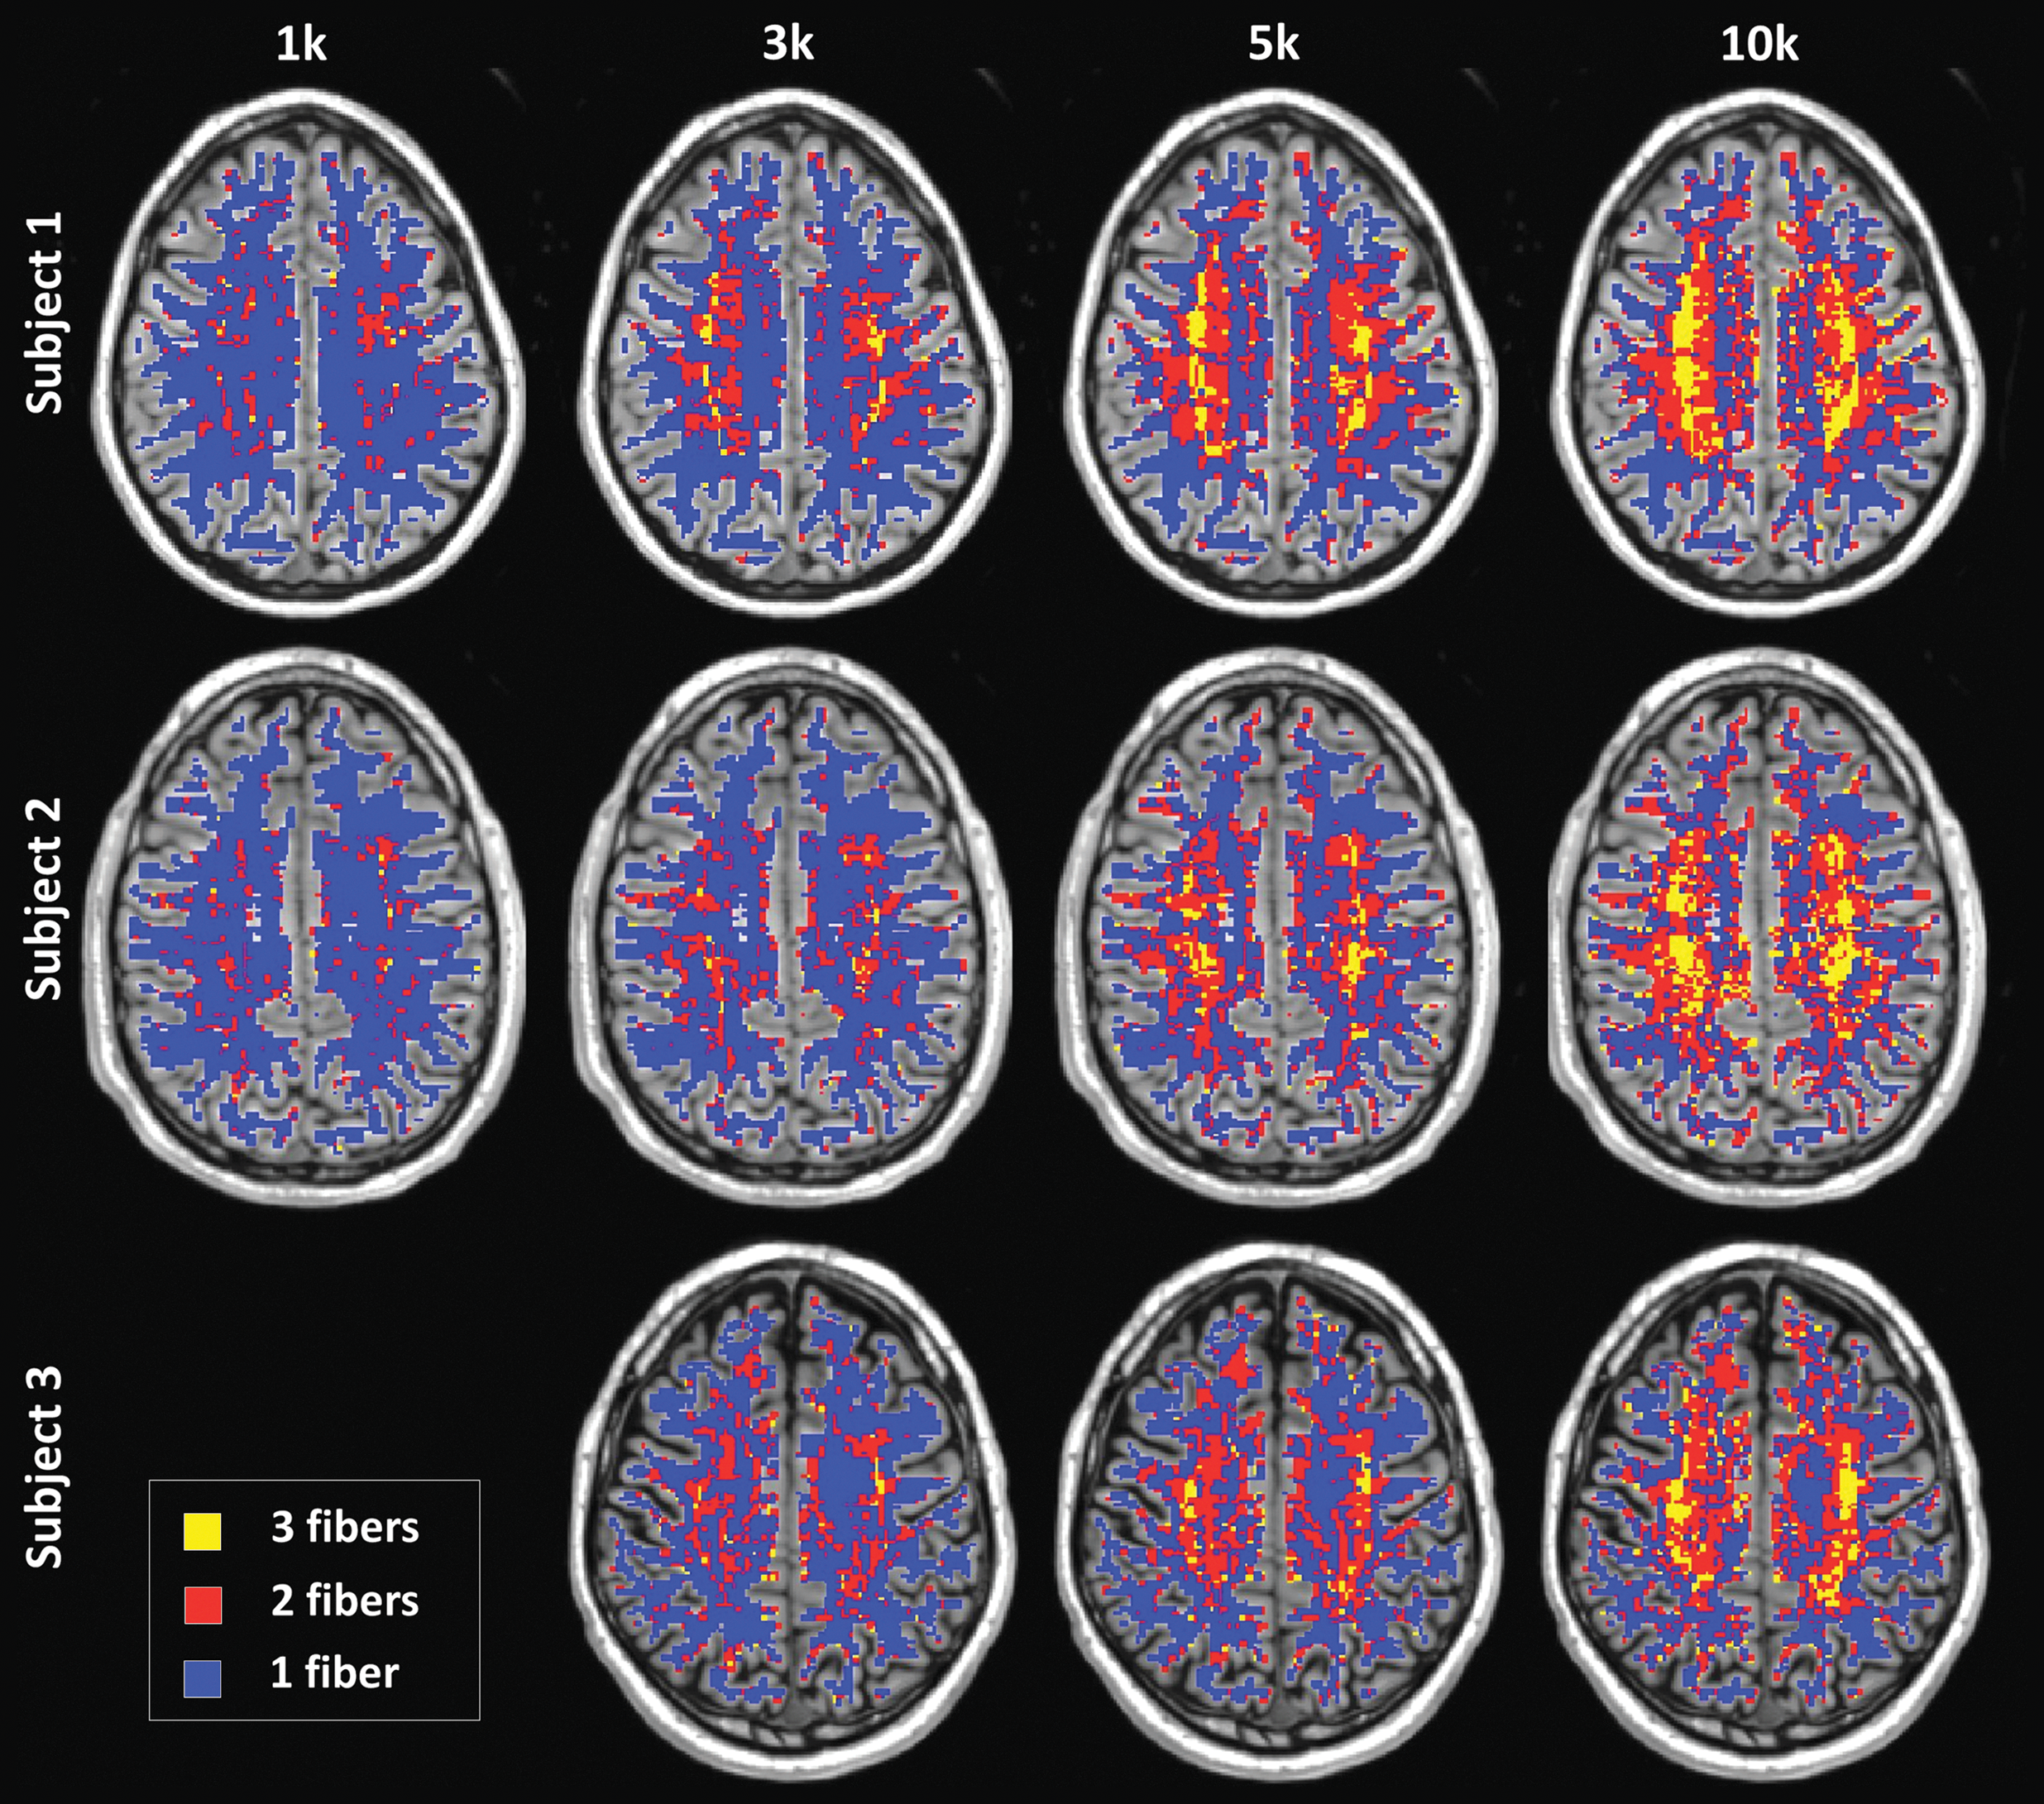
The number of fibers in each white matter voxel for different b-values (columns) and subjects (rows). Color coding: yellow, three or more fibers; red, two fibers; and blue, one fiber.
Impacts on the fiber tractography
As an outcome measure of the improved local ODF estimates due to higher b-value, the fiber tracts obtained from the 3k and 10k shells of the dataset acquired with protocol No. 2 are shown from the top view in Figure 7. By visual inspection, a greater number and more evenly distributed array of trans-callosal tracts were better captured by the 10k shell data than those at lower b-values. As known crosshemispheric connectivity predicts trans-callosal fibers tracking broadly to homologous cortex, the apparent loss of these fibers at lower b-values was indicative of greater difficulty in resolving tracts through this region. This may well arise because these tracts need pass through the region of three-way crossings in the centrum semiovale, and thus are highly sensitive to ODF quality in these regions.
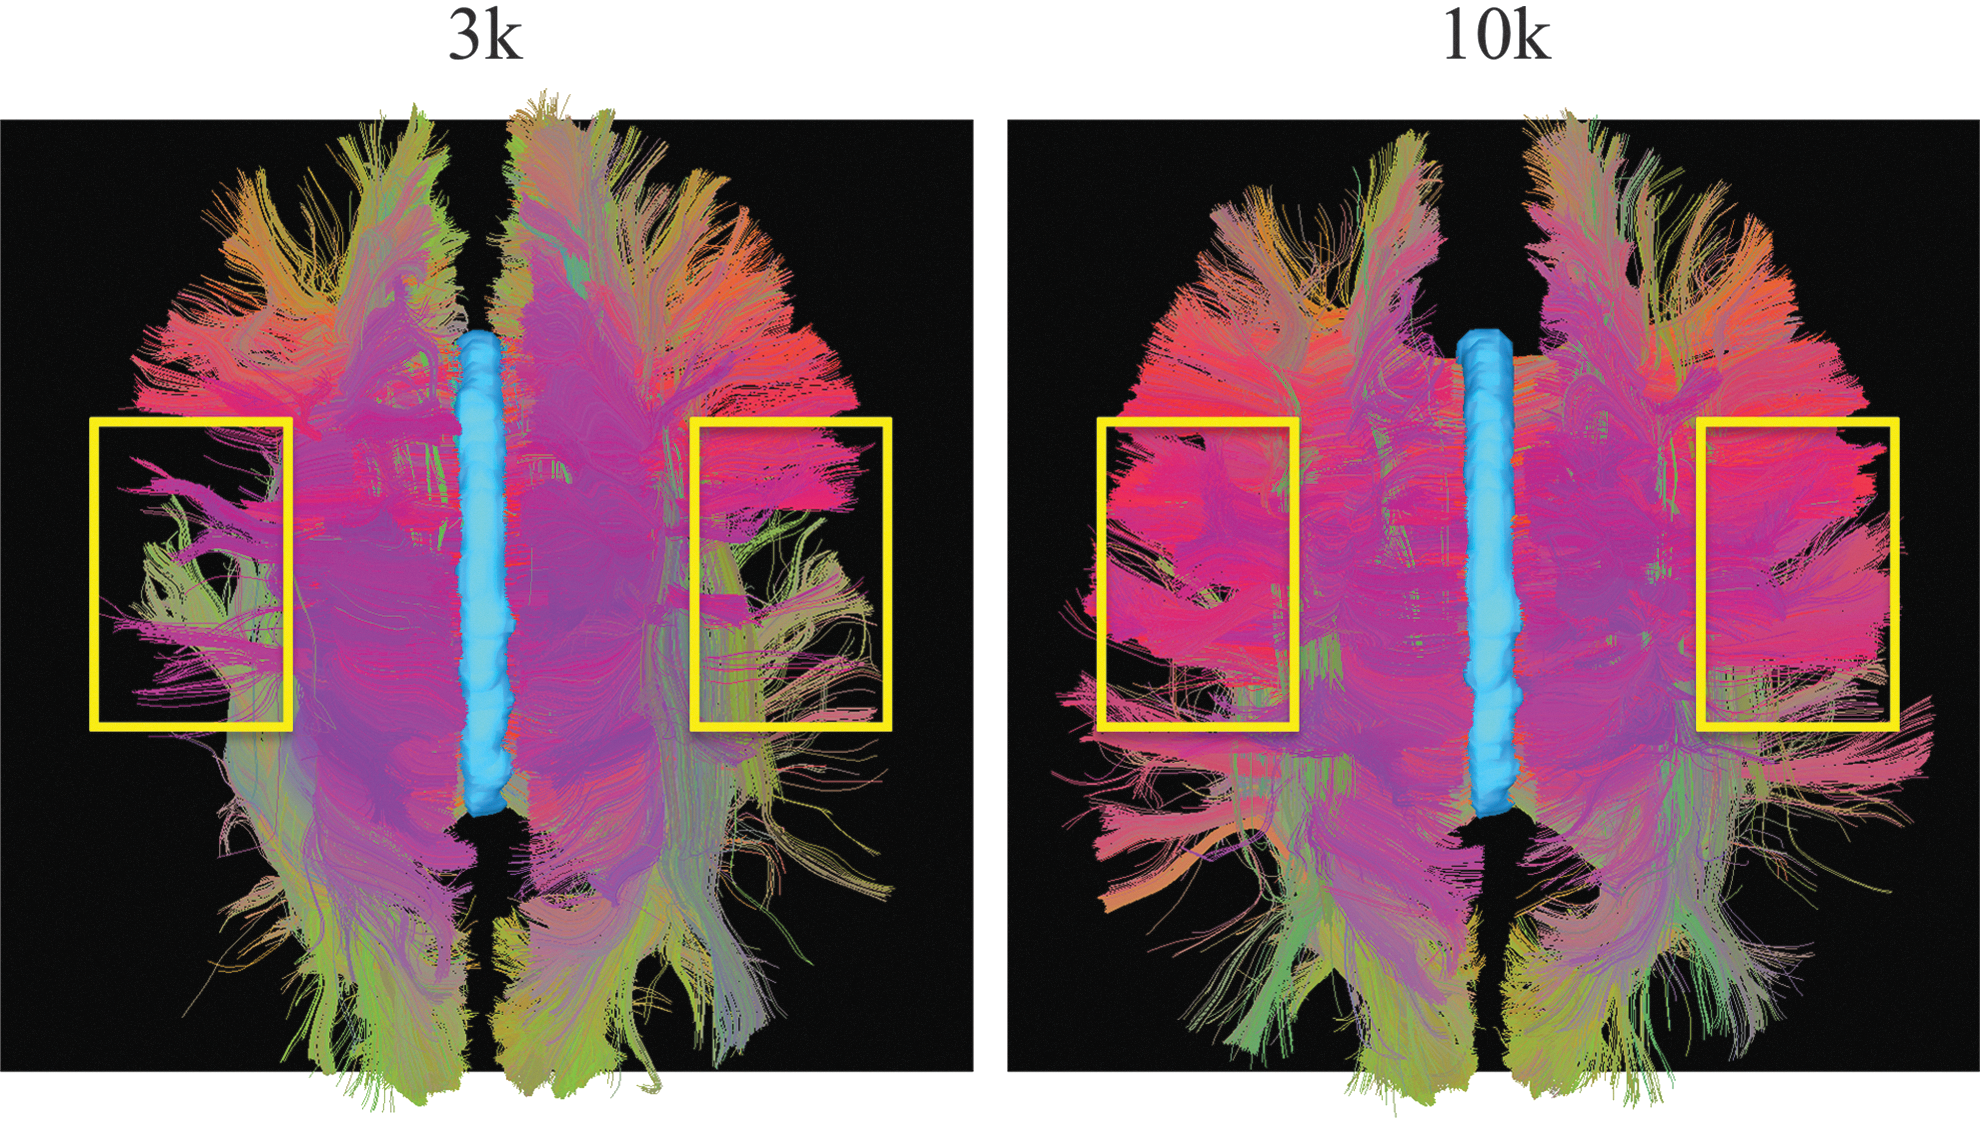
Fiber tractography comparison between the 3k and 10k shells. The fiber tracts passing through the corpus callosum (in light blue) were selected from the whole-brain tractography. In the region circled in yellow, the trans-callosal tracts were better captured by the 10k shell data, presumably due to the improved three-way-crossing ODF estimates in the centrum semiovale.
Discussion
The aim of this study was to investigate the potential of high b-value diffusion data in resolving complex white matter structures, such as two-way and three-way fiber crossings. In comparisons across b-values, we observed increased sharpness in the q-ball ODF reconstruction as b-value increased. This was quantitatively reflected in a larger energy fraction of higher-order terms in the spherical harmonic series of the ODF as the b-value increased, as well as an increased fraction of white matter with two-way or three-way fiber crossing structures resolved.
The q-ball approximation of the diffusion ODF was calculated by the means of the Funk-Radon transformation (FRT) of the diffusion signal (Tuch et al., 2003). The value of the ODF along certain direction was obtained by summing the diffusion signals along a circle perpendicular to that direction. Thus, a heuristic interpretation of the ODF-sharpening effect comes from angular specificity to fiber orientations in the DW signal. Specifically, with increasing diffusion weighting, the DW signal decays faster as the diffusion weighting direction deviates from the directions perpendicular to fiber orientations (Tournier et al., 2013). As a result, the much-reduced amplitude in DW signals that are not perpendicular to the fiber orientations contributes to the dampening of the lowest values between ODF peaks, giving rise to a sharper shape and less overlap between ODF peaks.
Since each of the spherical shells with different b-values had identical δ/Δ and varied only in gradient amplitude, we can also consider each of these shells as representing a spherical section of the Cartesian q-space (Callaghan, 1993). The ODF sharpening in the present case can therefore be alternatively explained in a more mathematical way using the q-space formalism (Callaghan, 1993; Wedeen et al., 2005). In brief, the “Bessel beam” kernel that the q-ball reconstruction implicitly incorporates when using the FRT to reconstruct the ODFs becomes narrower with increasing q-values, resulting in better angular resolution at the cost of reduced SNR [for further details see (Tuch, 2004; Tuch et al., 2003)].
In counting the number of fibers, the thresholds applied to the peak heights of the q-ball ODF may play a critical role in determining the fraction of white matter voxels containing one, two, or three fibers. For this reason, we provided the results of the metrics with a range of threshold values, aiming to illustrate this variation. The fraction of white matter voxels detected as containing crossing structures decreased as the value used for thresholding increased, but comparing between shells, higher b-value shells showed a superior performance of resolving more fiber crossings (i.e., two-way and three-way crossings), when the threshold value was fixed.
Given the tradeoff between diffusion contrast and SNR, the benefit of increasing diffusion weighting will gradually diminish due to decreasing image SNR. Thereby, the empirically optimal b-value varies with the specific experimental settings that may affect image SNR, such as the voxel size, the TE needed to achieve the gradient diffusion encoding and EPI readout parameters, the receiver coils, and the noise enhancement from acceleration factors. The optimal b-value to resolve complex white matter structures also depends on intrinsic tissue properties. For example, some regions in the brain may involve shallower crossing angles or a smaller volume fraction in one fiber component than others, and thus require enhanced angular separation of crossing structures with higher b-value. Thus, the problem of designing an optimal diffusion acquisition protocol is complex, both because the intrinsic properties of the fiber geometry vary considerably across the brain, and perhaps more fundamentally because this structure, in its details, is still unknown and indeed controversial (Catani et al., 2012; Wedeen et al., 2012a,b). It is also worth mentioning that, when higher diffusion encoding is applied, more directions need to be sampled in order to make use of the richer angular information in the DW signal. The optimal b-value has been studied previously by different groups; for example, 6200 sec/mm2 was proposed for minimized variance in FOD estimator (White and Dale, 2009), and 3000 sec/mm2 for highest achievable angular resolution in the DW signal in single-fiber voxels (Tournier et al., 2013). It is not surprising that the suggested optimal b-value will vary with the specific experimental scenarios. Our Connectom scanner benefited from the shorter TEmin and improved sensitivity of the 64-channel head coil. At high spatial resolution (1.5 mm isotropic), we observed increasing benefits in resolving complex white matter structures when the b-value increased from 1k to 10k sec/mm2.
To summarize, we performed comparisons with in vivo human diffusion data of up to b=10k sec/mm2 collected on the HCP MGH-USC Connectom scanner. We observed sharper q-ball ODF as the b-value increases. As a result, the crossing structures were detected in an increasingly larger fraction of white matter voxels and the map of two-way and three-way crossing structures grew with increasing b-value to cover much of the white matter. The results show that high b-value dMRI is beneficial for improving the angular resolution of HARDI methods and thus the capability of resolving complex white matter structures.
Conclusion
The results indicate that dMRI with high diffusion encoding on the Connectom system is a promising tool to better characterize, and ultimately understand, the underlying structural organization and motifs in the human brain.
Footnotes
Acknowledgments
The work is supported by the funding from the National Institutes of Health, NIH Blueprint Initiative for Neuroscience Research grant U01MH093765, NIH NIBIB grant K99EB015445, and the Instrumentation grants 1S10RR023401, 1S10RR019307, and 1S10RR023043.
Author Disclosure Statement
Dr. L.L.W. reports nonfinancial support from Siemens Healthcare. The remaining authors have no conflicts of interest to declare.