
Abstract
Many behavioral and cognitive processes are grounded in widespread and dynamic communication between brain regions. Thus, the quantification of functional connectivity with high temporal resolution is highly desirable for capturing in vivo brain function. However, many of the commonly used measures of functional connectivity capture only linear signal dependence and are based entirely on relatively simple quantitative measures such as mean and variance. In this study, the authors used a recently developed algorithm, the generalized measure of association (GMA), to quantify dynamic changes in cortical connectivity using steady-state visual evoked potentials (ssVEPs) measured in the context of a conditioned behavioral avoidance task. GMA uses a nonparametric estimator of statistical dependence based on ranks that are efficient and capable of providing temporal precision roughly corresponding to the timing of cognitive acts (∼100–200 msec). Participants viewed simple gratings predicting the presence/absence of an aversive loud noise, co-occurring with peripheral cues indicating whether the loud noise could be avoided by means of a key press (active) or not (passive). For active compared with passive trials, heightened connectivity between visual and central areas was observed in time segments preceding and surrounding the avoidance cue. Viewing of the threat stimuli also led to greater initial connectivity between occipital and central regions, followed by heightened local coupling among visual regions surrounding the motor response. Local neural coupling within extended visual regions was sustained throughout major parts of the viewing epoch. These findings are discussed in a framework of flexible synchronization between cortical networks as a function of experience and active sensorimotor coupling.
Introduction
There is a broad consensus in the cognitive neuroscience literature that major aspects of behavior and cognition are based on communications among populations of cortical neurons (Sporns, 2013). Dynamical interactions between cortical areas are well established in nonhuman mammalian models for fundamental cognitive domains, such as perception, action planning, learning, and memory (Schroeder, 2010; Womelsdorf et al., 2007). Currently, there is widespread interest in the development and assessment of in vivo measures of cortical communication that can noninvasively capture these interactive dynamics at high temporal fidelity (roughly, the scale of ∼100 msec).
In this study, the authors address this issue by applying a novel, parameter-free measure of spatial dependency, the generalized measure of association (GMA). The rank-based GMA has the advantage that it can be easily estimated from realizations of a given random variable, unlike statistical dependence (Seth and Príncipe, 2012). Furthermore, unlike conventional approaches, such as correlation or spectral coherence (Pereda et al., 2005), GMA can be reliably estimated when the number of digital time samples is limited and it is also sensitive to dependencies that affect quantitative signal properties other than the mean and the variance, for example, higher-order statistics of the signal (Seth and Príncipe, 2014). Since the electroencephalogram (EEG) can be modeled as a stochastic time series, GMA was modified to tGMA, which includes a preoptimization step to minimize the time correlation properties of stochastic processes (Fadlallah et al., 2012a). Previous work has established the reliability and discriminant power of tGMA as applied to a simple task of distinguishing EEG connectivity profiles evoked by different classes of visual stimuli—faces versus sinusoidal gratings (Fadlallah et al., 2012b). The goal of the present study was to study dynamic changes in functional EEG connectivity during an active avoidance paradigm involving visual cues.
The conditioned avoidance paradigm is a classical laboratory method for examining neural processes involved in escape and avoidance from harm (Anger, 1963; Sidman, 1953). In a typical conditioned avoidance experiment, participants first learn to associate a specific cue with an aversive outcome (e.g., an unpleasant blast of white noise). Subsequently, they are given the opportunity to perform an active response that reliably eliminates the occurrence of the harmful outcome. Pertinent to the present approach, experiments with rodents have demonstrated that active avoidance learning is accompanied by changes in neural activity, where initially local activity in brainstem regions that mediate simple defensive responses (e.g., freezing and defecation) over time extends to a more broadly distributed network of regions that enable active coping (LeDoux and Gorman, 2001). Successful avoidance therefore demands flexible interactions between neural systems mediating threat detection with those processing the avoidance cues and related motor plans.
Functional connectivity between cortical regions manifests across a broad range of frequencies in the spontaneous EEG ranging from the traditional delta (0.5–4 Hz) to the gamma (>30 Hz) EEG band. Hence, there is often no a priori reason to restrict one's analysis to a particular frequency range of interest, which subsequently makes the analysis very time-consuming and raises the risk of seriously inflating the probability of committing Type I errors. In this study, the authors capitalized on the desirable properties of steady-state visual evoked potentials (ssVEPs) to elicit entrained population responses that allow the authors to elucidate nonlinear interactions occurring between different regions. Steady-state EEG rhythms are evoked by a visual stimulus that is rapidly and regularly modulated in luminance or contrast. As a consequence, specific and large spatial scale modulatory responses are created within a very narrow frequency band (identical to the frequency at which the stimulus was modulated); as a result, the ssVEP response possesses excellent signal-to-noise ratio characteristics compared with traditional event-related potential components (Nunez and Srinivasan, 2005). The scalp-recorded ssVEP signal reflects frequency-following neuronal responses with contributions from cells in the primary visual cortex (V1) and extrastriate regions (Pastor et al., 2003; Williams et al., 2004) in response to the stimulus. Thus, using ssVEPs to estimate functional connectivity patterns provides researchers with a fixed spectral signature (the ssVEP driving frequency) and an empirically based neural generator location (visual cortex) that can serve as an a priori seed—properties that have been increasingly used in studies of large-scale brain function (Keil et al., 2012; Zhang et al., 2013). In the present study, the authors analyzed a published dataset of ssVEPs during active avoidance in terms of time-varying connectivity, using the GMA approach, with the goal of understanding and quantifying the dynamics of the functional connectivity with high temporal resolution.
In the previous study, the threat (CS+) was compared with the control (CS−) in terms of spectral amplitude modulation by averaging evoked changes over the entire trial, so no temporal resolution could be quantified (Miskovic and Keil, 2014). However, fluctuations in amplitude envelopes of evoked responses evolve on a relatively slow timescale compared to the speed of typical cognitive events. Likewise, when functional MRI (fMRI) is utilized for the same purpose (Britton et al., 2013), the intrinsic slow hemodynamic response is unable to quantify changes in functional connectivity shorter than 1 sec, which is the estimated capillary convolutional time (Lizier et al., 2011). In this study, however, the authors are interested in discriminating the expected changes in functional connectivity by analyzing the rich temporal evolution of EEG signals (Miskovic and Keil, 2014). The following hypotheses were examined: First, heightened connectivity among extended visual cortices was expected to accompany presentation of CS+ cues compared with CS− cues, paralleling earlier research (Miskovic and Keil, 2014). The authors expected that this connectivity would be most pronounced early in the viewing epoch, before action selection and the initiation of the overt avoidance response. Second, heightened connectivity between visual and motor/perimotor regions was expected in the time windows associated with preparation and execution of the avoidance response. To the extent that threat processing involves more widespread and more coherent processing than safety cue processing, it was predicted that transient coupling would be stronger when a motor response was motivated by terminating a motivationally aversive outcome compared with executing a motivationally neutral response in the context of CS− viewing.
Materials and Methods
Participants
A total of 18 participants were recruited from a pool of undergraduate students and they participated for course credit. Of these 18 participants, three were excluded because of noncompliance with the instructions (n=3) and lack of significant driving, tested by means of the circular T-square statistic (Victor and Mast, 1991). The remaining sample comprised 15 participants (8 females, 7 males, mean age=18.47 years, standard deviation [SD]=0.74 years).
Stimuli and procedure
All stimuli were generated using the Psychophysics Toolbox (Brainard, 1997; Pelli, 1997) for MATLAB. They consisted of gray and white Gabor gratings (Gaussian-windowed with maximal contrast at center) shown on a black background and subtending horizontal and vertical visual angles of 7°. The CS+ and CS− gratings had the same spatial frequency (1.4 cycles per degree) and differed from each other only in orientation: 45° clockwise tilt (CS+) or 45° anticlockwise tilt (CS−). A loud white noise burst (1.2 sec duration, 92 dB sound pressure level) was used as the unconditioned stimulus (UCS) and was played through free-field speakers placed next to the participant.
Each experimental session comprised collecting written informed consent as well as initial screening to rule out photic epilepsy/seizures. Participants were then seated in a comfortable chair in a dimly lit room and the EEG sensor net was applied. Participants were given instructions to fixate, avoid eye movements and blinks, and to expect occasional loud noises. Stimuli were displayed on a 23-inch LED monitor (Samsung S23A750D) with a 120 Hz refresh rate positioned at a distance of 1 m.
In this experimental implementation, the avoidance paradigm consisted of a compound stimulus array with distinct perceptual elements. The CS+ and CS− cues were simple grating stimuli that differed only in their relative degree of orientation offset. These cues were serially presented at the center of fixation and were flanked by additional simple shapes that signaled four distinct trial categories: The specific combination of the CS+ and surrounding shapes signaled either an active CS+ trial (in which a simple button press avoidance response cancelled the delivery of an aversive outcome) or a passive one (in which participants were helpless to prevent delivery of the aversive outcome). To create a fully balanced design, participants also completed active CS− trials (in which a button press was required in the context of a low motivational, simple color discrimination task) and passive ones (in which no overt response was required). An instructed differential conditioning design was used, in which one grating stimulus (the CS+) was paired with the loud noise and one grating with a different orientation (the CS−) was never paired. The avoidable versus unavoidable context was signaled by geometric shapes flickered at 12 Hz (the action cue). The gratings were displayed on a black background and flickered at 15 Hz.
Instructing participants about instrumental contingencies produces comparable levels of threat avoidance behaviors as when those behaviors are learned through direct experience (Dymond et al., 2012). Moreover, written instruction has been shown to accelerate acquisition of learned aversive responses (Moratti and Keil, 2005; Moratti et al., 2006). Participants first underwent an initial habituation phase during which they were passively exposed to 10 presentations of each grating. No UCS was presented during this phase and no response was required. Participants then entered the conditioning phase of the experiment during which the 10 CS+ trials were always paired with the UCS (i.e., 100% contingency). The 10 CS− trials were never paired. The avoidance phase followed the initial conditioning block and forms the basis of the present report (Fig. 1[A, B]).
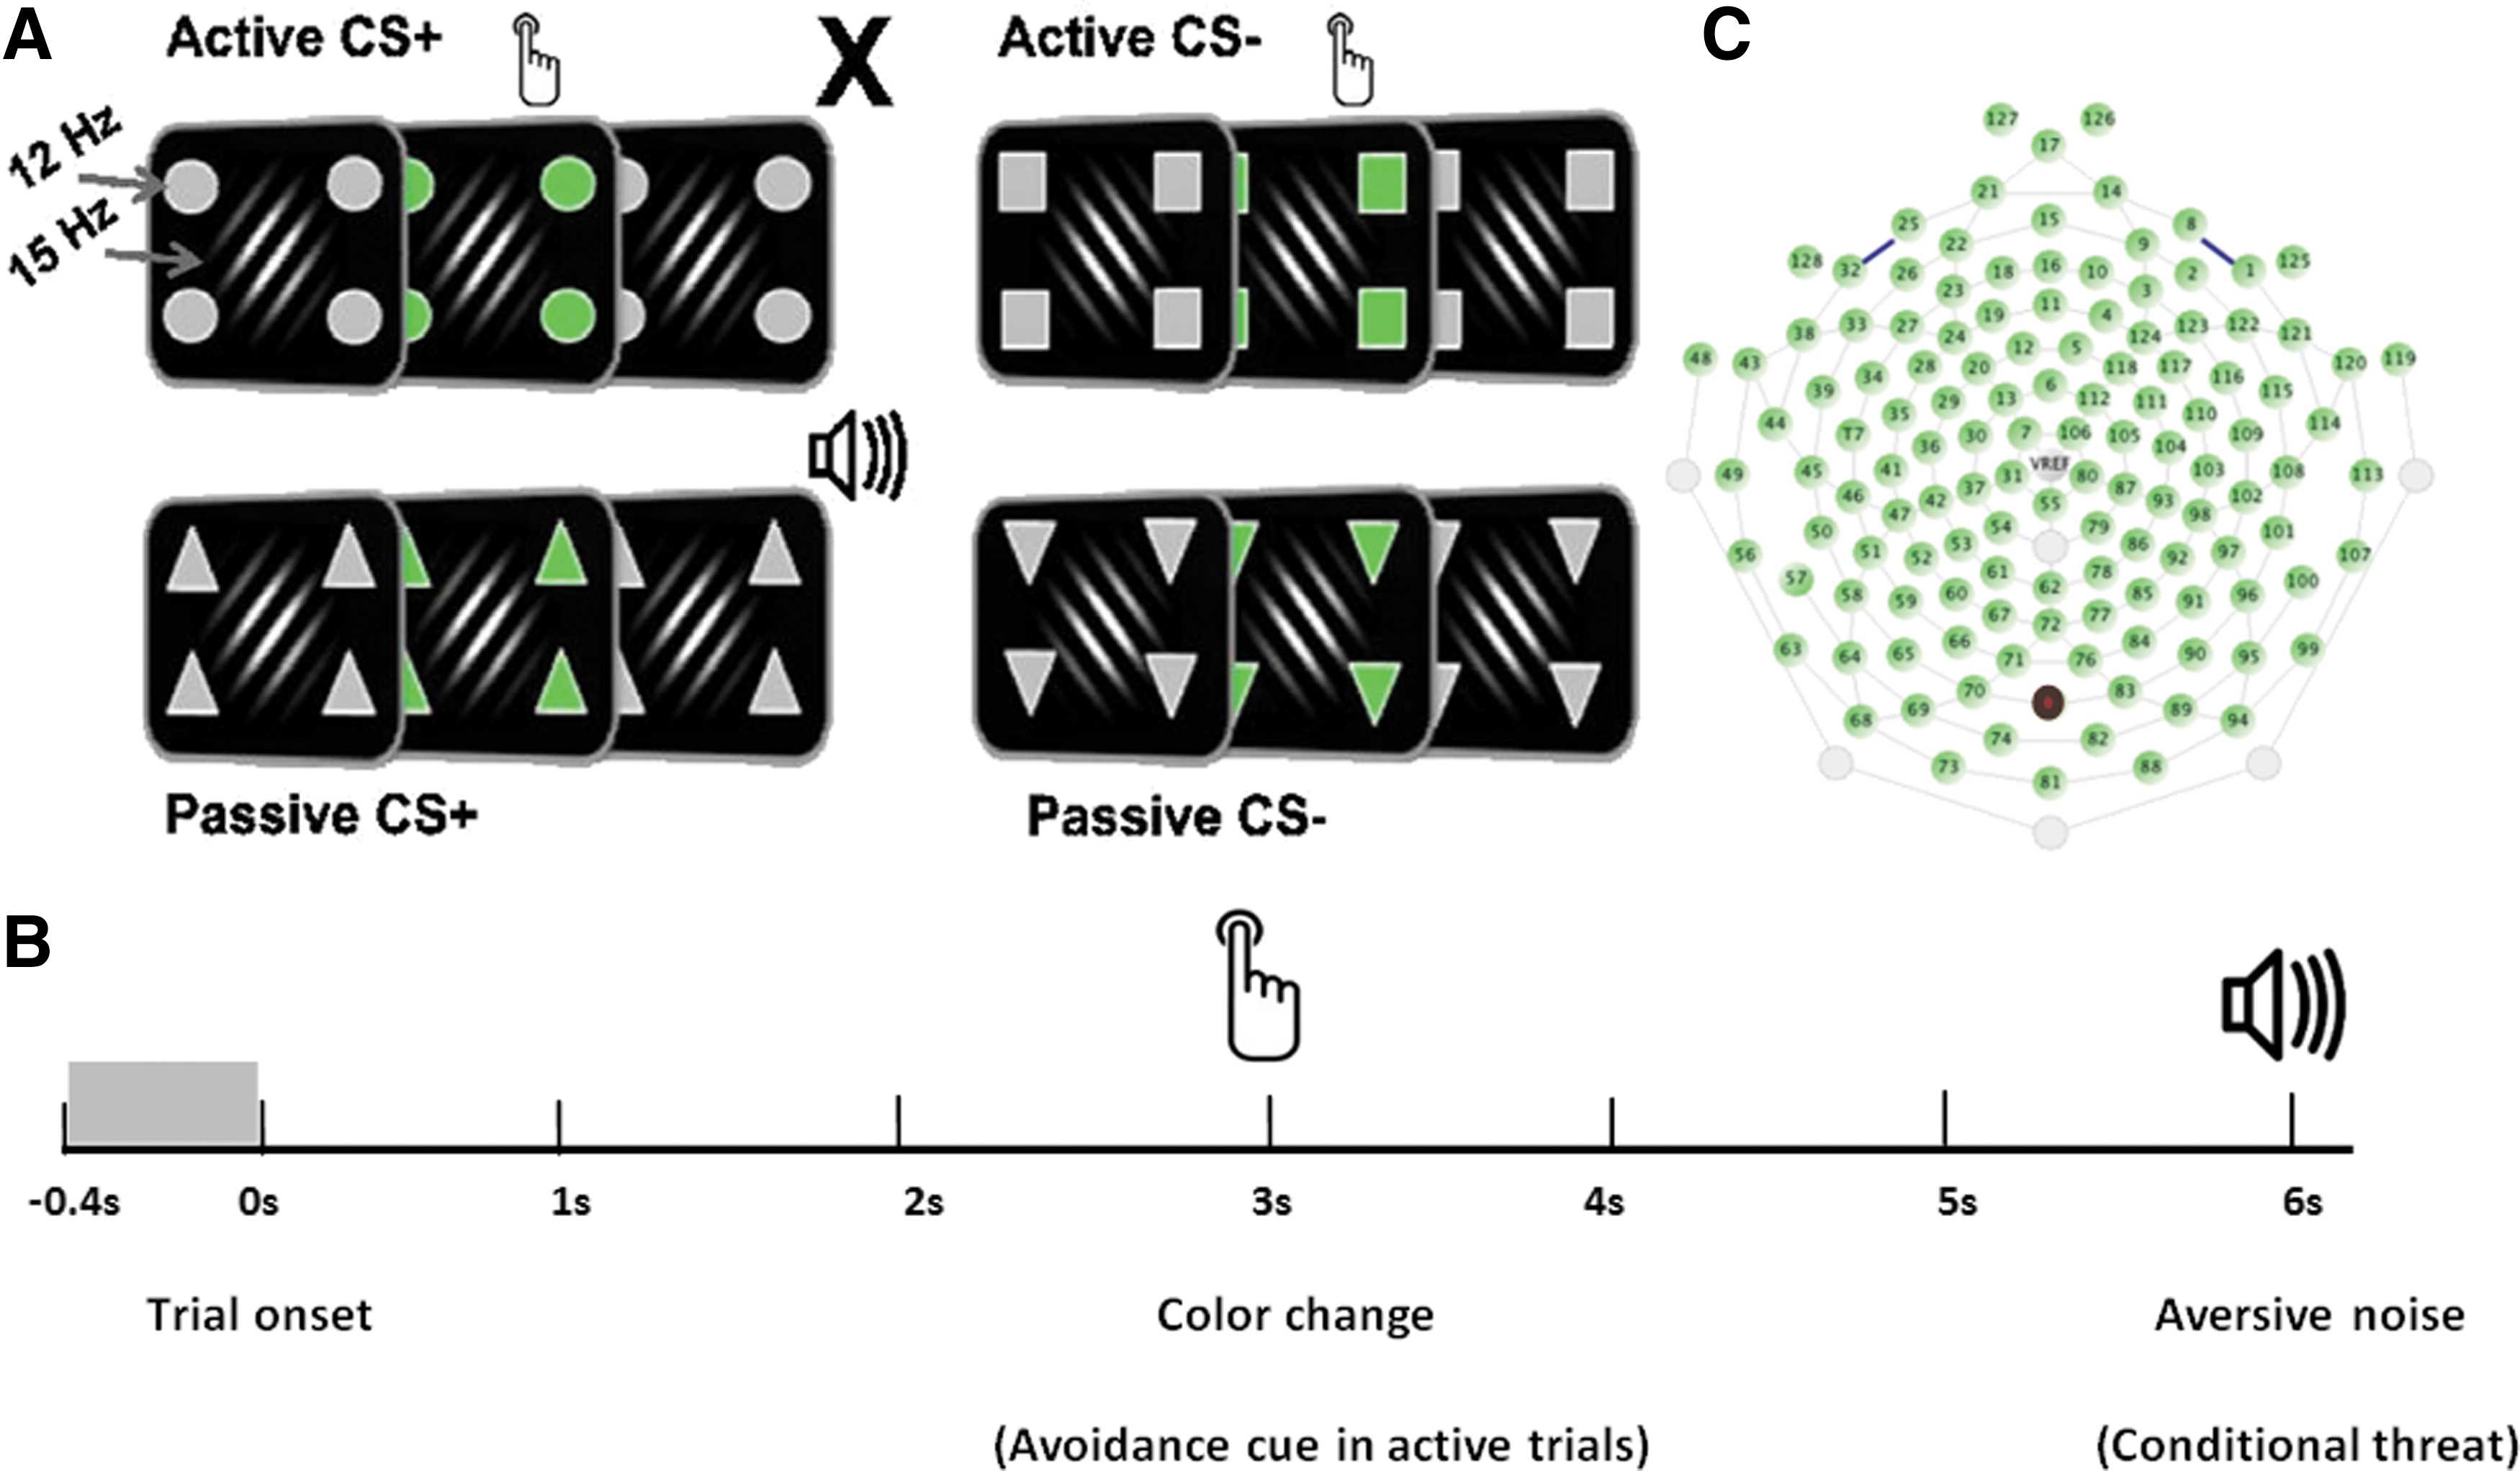
The geometric shapes flanked the centrally displayed conditioned stimuli, resulting in a full factorial (2 by 2) design of CS type and avoidance, with four conditions: CS+ active trials (appropriate motor response cancels UCS delivery), CS+ passive trials (no motor response is required and UCS delivery is inevitable), CS− active trials (appropriate motor response is required, but UCS is never delivered), and CS− passive trials (no motor response is required and UCS is never delivered). Stimulus presentation was pseudorandomized such that no more than two identical trial types were ever presented in succession. The intertrial interval varied randomly between 4 and 5 sec. Differently shaped cues signaled the trial type and flickered at a different fundamental frequency from the conditioned stimuli. A salient color change of the avoidance cues occurred halfway within each trial (3 sec from stimulus onset and persisting for an additional 2 sec). The color change signals the participant to respond on the active trials. Participants responded by button press with the dominant hand on a standard computer keyboard. For the response to successfully terminate UCS delivery, the response had to be emitted during the 2-sec time window, in which the cue's color was green. For the active CS− trials, participants were instructed to respond to the color change as well, but they knew that regardless of their response, the loud sound would never be presented. The use of the frequency tagging technique allowed the authors to examine additional questions of interest, related to competition for neuronal resources within the visual cortex, between the conditioned stimuli and the peripheral response-type (active vs. passive) cues. Peripheral cues were located ∼1.7° of visual angle away from the outer border of the central grating stimuli and subtended visual angles of 1.5°. Following completion of the avoidance phase, participants were asked to provide a subjective estimate of the amount of distress that they experienced when encountering each of the possible CS-type and peripheral cue combinations, using a computer mouse and visual analogue scale on a screen. A brief extinction phase followed the ratings, which involved eight unreinforced presentations of the CS+ grating. This phase was included to ensure extinction by the end of the session, but data are not included due to the low trial count.
Electroencephalogram data recording
EEG recording and preprocessing
EEG was continuously recorded from 129 sensors using an Electrical Geodesics™ HydroCel Geodesic Sensor Net (Fig. 1A) digitized at a rate of 250 Hz, using the vertex sensor (Cz) as the recording reference, with the online bandpass filter set at 50 Hz (low-pass). Sensor impedances were kept below 60 kΩ. Offline EEG analyses were implemented using MATLAB environment R2012a (ver. 7.14) and the ElectroMagneto-Encephalography (EMEGS) toolbox for MATLAB (Peyk et al., 2011). Relative to stimulus onset, epochs were extracted from the raw EEG that included 400 msec pre- and 6000 msec postonset for all conditions. As described by Junghöfer and colleagues (2000), statistical parameters were used to calculate distributions across trials and channels and interpolate artifact-contaminated channels. When more than 18 channels needed interpolation or the spatial location of the bad channels in a given trial did not allow accurate representation of the topography (measured as the standardized difference from a goal function, see Junghöfer et al., 2000), that trial was rejected. Rejection criteria included the maximum of the amplitude, SD, and first temporal derivate in a given trial-channel pair. The original recording reference (Cz) was first used to detect recording artifacts, and then the data were average referenced to detect global artifacts. For further processing, each EEG channel was band-passed with a 12 Hz center frequency (60 dB/octave, 10th order Butterworth) and a 15 Hz center frequency (60 dB/octave, 10th order Butterworth), and the data segmented in 1-sec segments with 80% overlap. The analysis was carried out on EEG segments of 1-sec length extracted from single trials. Finally, the tGMA values were averaged over trials for each subject.
In the previous work, it was shown that the tGMA method is most accurate when the quality factor of the filter is limited to the range of
Performing functional connectivity analyses on the basis of raw electrode signals can lead to spurious correlations due to the common source problem (Schoffelen and Gross, 2009). The authors addressed this issue by applying the Laplacian transform (i.e., the scalp current source density [CSD], Junghöfer et al., 1997). To avoid spurious connectivity indices reflective of volume conduction and related issues, the original EEG surface potentials were transformed to a CSD representation (Srinivasan et al., 2007). This step minimizes (but does not fully resolve) issues related to volume conduction, reference dependency, as well as spatial nonspecificity of scalp voltages. The CSD has a unique mathematical solution that does not depend on any a priori assumptions or constraints (Junghöfer et al., 1997). Specifically, the CSD approach described by Junghöfer and colleagues (1997) was used, which is based on spherical spline interpolation and well suited for dense array EEG montages.
Generalized measure of association
Association between two random variables, U and V, measures by how much large values of U are associated with large values of V, which can be measured by Pearson correlation (Pearson, 1931). GMA is a generalization of the concept of association where the amplitude values of the realizations are substituted by ordered distance. By definition, GMA is the area under the cumulative density function of the spread of ranks of two random variables. In fact, when the random variables are coupled in the high-order moments, methods such as correlation that only capture second-order interactions cannot extract all information in the data. The theory of GMA is fully explained (Seth and Príncipe, 2012) and applied to time series (Fadlallah et al., 2012a). In this study, the authors will be providing a very brief explanation.
Consider two random variables ui
and
Algorithm I: Generalized Measure of Association
For each data point ui
, the algorithm searches for the closest uj*
to ui
having the minimum Euclidean distance δ
u
in U.
Then, the spread of ranks between minimum ri,min
and maximum ri,max
rank values is calculated for all
For all rank values ri,min
<r≤ri,max
assign:
The area under cumulative distribution function (CDF) of the rank variable
For time-series data, GMA requires an additional preprocessing step to handle the naturally occurring temporal dependencies of random variables in a stochastic process (Fadlallah et al., 2012a). This modification is called tGMA and keeps all the advantages of GMA, but requires proper design of filters and adds one free parameter to GMA. As explained above, a filtering operation is also required for this experimental setup because the authors are using steady-state visual evoked responses (ssVEPs). Each data segment is mapped to an m-dimensional space based on the Takens embedding theorem (Takens, 1981), and then a delayed vector for the ith sample of kth channel Xk,i
is constructed as follows:
In this study, the authors applied tGMA on the filtered and segmented data to resolve the dynamic association that relates pairs of EEG channels. A sequence of tGMA values was calculated for each segment and each experimental condition. The authors filtered the ssVEPs by a set of 12 and 15 Hz bandpass filters and both tGMA values were computed for all four conditions (active CS+, active CS−, passive CS+, and passive CS−), but only a subset of these tGMAs was utilized in the validation. When the comparisons involve active versus passive, the authors employed 12 Hz filtered tGMA values; for the CS− versus CS+, the authors employed 15 Hz filtered tGMA values. Analyses of variances (ANOVAs) were conducted for each sensor and time point, with a repeated measures model of threat (safe, threat) and response (active, passive), separately for each stimulus as shown in the results. Because the present research focused on connectivity between visual cortex and other regions, tGMA was calculated relative to the mid-occipital recording site (channel 75 in Fig. 1[C] corresponding to site Oz in the international 10–20 system). This approach also takes into account that the ssVEP is primarily generated in lower-tier visual cortical areas with a typical maximum at sensor locations over the occipital pole. This constrains the space of potential connectivity values and thus the number of statistical comparisons needed to test the hypotheses. The first and last 0.4 sec were eliminated to minimize the effects of on and offset artifacts induced by the bandpass filter. Each window used for analysis has a duration of 1 sec, sliding by 0.2 sec (50 sample points) forward to generate a time series of tGMA values. Therefore, the minimum time resolution is 200 msec.
Statistical analysis
To capture the temporal as well as spatial changes of connectivity, a sequence of statistical procedure was pursued for each specific hypothesis. Since the hypotheses relate to the estimated spatial distribution of dependencies between CSDs at different regions of the cortical surface, the general approach consists of mapping statistical parameters to an approximated volume of the cortical surface. To quantify differences in the tGMA values between experimental conditions for each sensor location and time point, the authors applied the Signed-rank Wilcoxon test (also known as Mann–Whitney U test; Wilcoxon, 1945). Nonparametric Signed-rank tests were used because the tGMA values were not normally distributed. Nonparametric tests may also be considered more appropriate given the moderate size of the present sample.
Using this approach, the authors first evaluate the time-varying statistical difference of the tGMA maps for all active trials compared with all passive trials, across threat and safe conditions, for tGMAs calculated at the tagging frequency of the response cue, that is, at 12 Hz. Second, the authors compare tGMA maps for the threat versus the safety conditions, focusing on the tagging frequency of the threat and safety cues, that is, 15 Hz. Testing the hypothesis that any connectivity difference between threat and safe should be stronger for active than for passive trials, the authors also tested for an interaction effect between the two manipulations. To this end, 2 (passive vs. active) by 2 (threat vs. safe) ANOVAs were conducted at each sensor and F-values false discovery rate (FDR) controlled as described for the signed-rank tests described below.
To assess the statistical significance of these comparisons at a given scalp location and time, the authors corrected for multiple comparisons using the FDR approach (Benjamini and Hochberg, 1995). Using the FDR algorithm, a new critical p-value was determined for each connectivity map, and the corrected threshold was set to be equivalent to an uncorrected alpha of 0.05. For illustration, p-value distributions after applying the FDR-corrected threshold are plotted as topographical maps, drawn on a plane, or on a head volume.
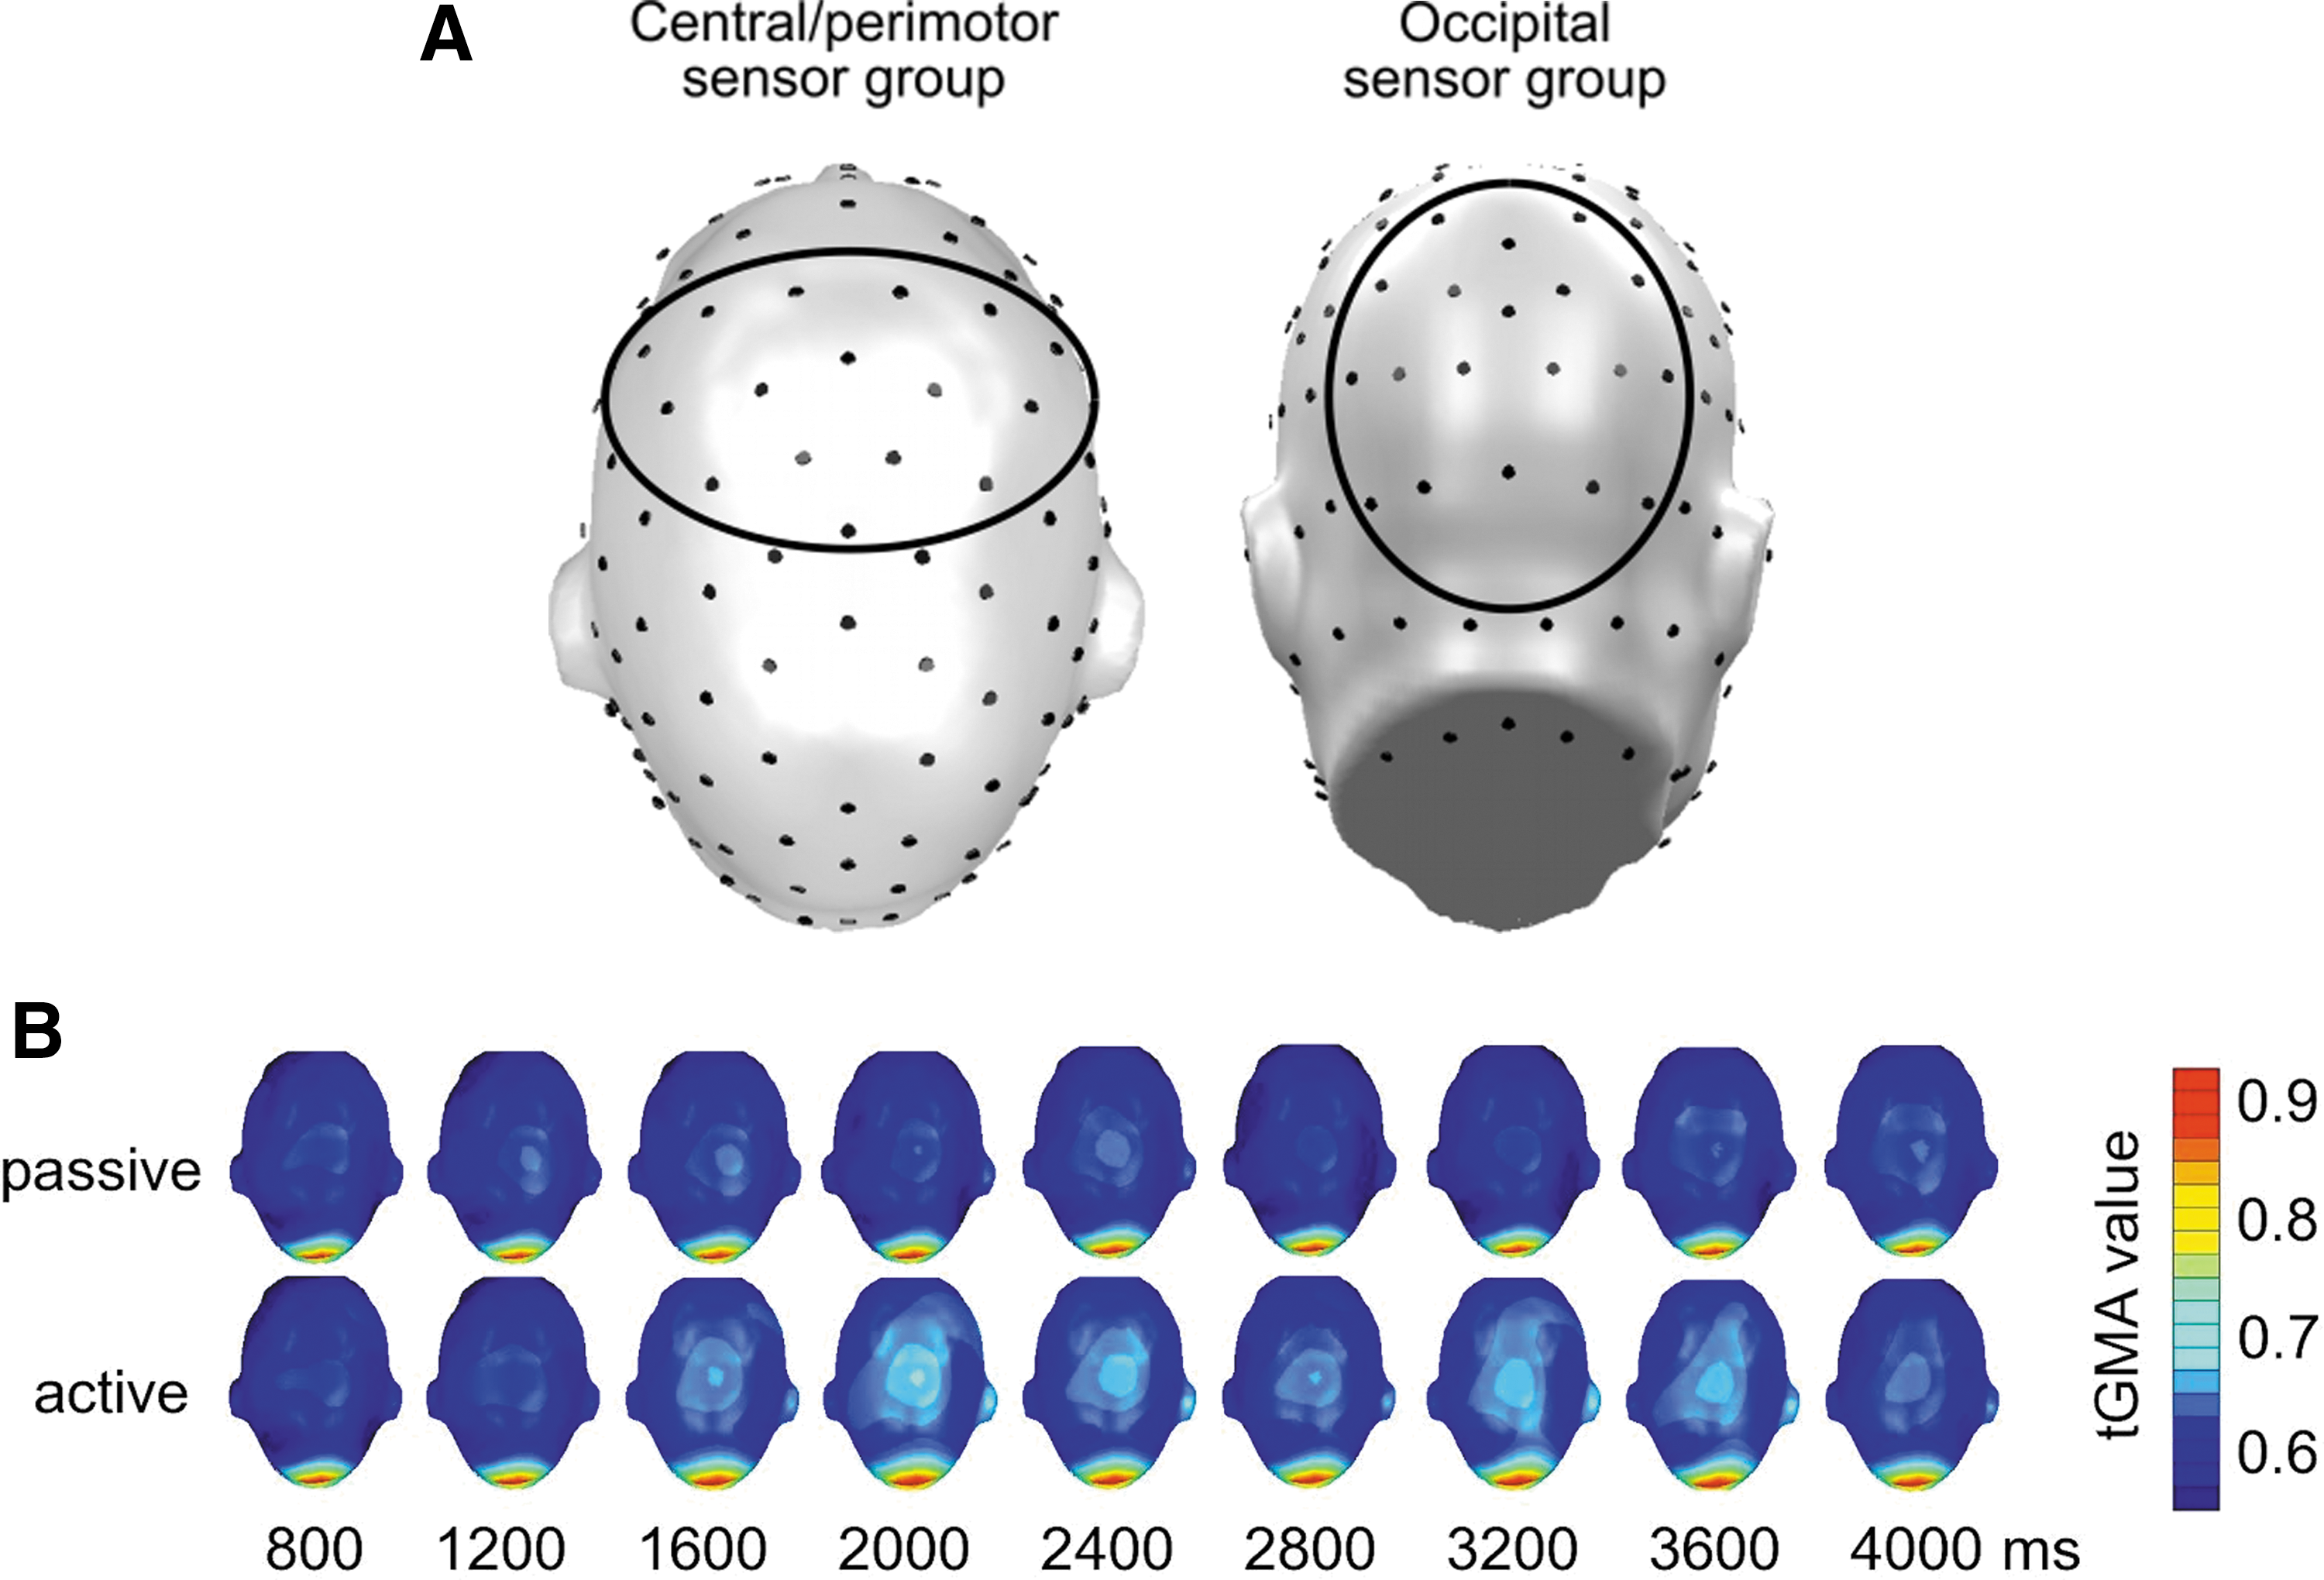
In addition to statistical parametric mapping, time courses of tGMA values were evaluated for averages across two scalp regions of interest: (1) tGMA between Oz and a central cluster of electrodes (FCz and its 15 nearest neighbors) was used to measure occipito-anterior connectivity, including connectivity with perimotor regions (Keil et al., 2009); (2) tGMA between site Oz/Poz and its own 17 nearest neighbors was used to quantify local visual connectivity (see Fig. 2A for an illustration of sensor groups). Paralleling time-varying tGMA maps, these averages were submitted to signed-rank tests for each time point and FDR controlled, then plotted as a time series, with the starting time of each moving analysis window (see Fig. 2B) serving as the time stamp provided in the figures. The central sensors were selected based on their topographical location for connectivity analysis. The choice of this broad sensor cluster was guided by the previous article on the same task, on fMRI studies showing SMA and perimotor engagement in active avoidance (Lizier et al., 2011). However, it was also data driven, based on examining the raw tGMA plots over time that showed coupling between visual and central sensor locations throughout time and for all conditions.
Results
Figure 2 illustrates the statistical dependence between channels estimated with tGMA for the average over all participants and all experimental trials (active vs. passive). At the tagging frequency of the action cue (12 Hz), the values reflect how the cue type (active vs. passive) affects the functional connectivity strength of other scalp regions with the extended visual cortex. As expected, the authors see dependence over the visual areas in both conditions since the brain is visually excited in both tasks. Notice that in this article the authors do not perform across flickering frequency tests.
Active versus passive conditions (peripheral cue at 12 Hz)
Group analyses began with a comparison of active and passive conditions for the 12 Hz tagging frequency, that is, the response to the action cues (referenced to Oz). Figure 3 shows the time course of tGMA values representing long-range connectivity between occipital and central (perimotor) sensors (top panel) as well as local connectivity between the occipital sensor location and its neighbors (bottom panel). Time courses for active and passive conditions as well as the p-values of signed-rank tests are shown, comparing both conditions. Results suggest greater occipito-central coupling for active compared with passive conditions starting around 1000 msec before the color change of the avoidance cue, with p-values falling below the FDR-corrected threshold of 0.012. Heightened coupling in active trials was sustained during the response window, but did not persist in windows later than 500 msec after the color change of the action cue, which prompted a motor response in the active trials.
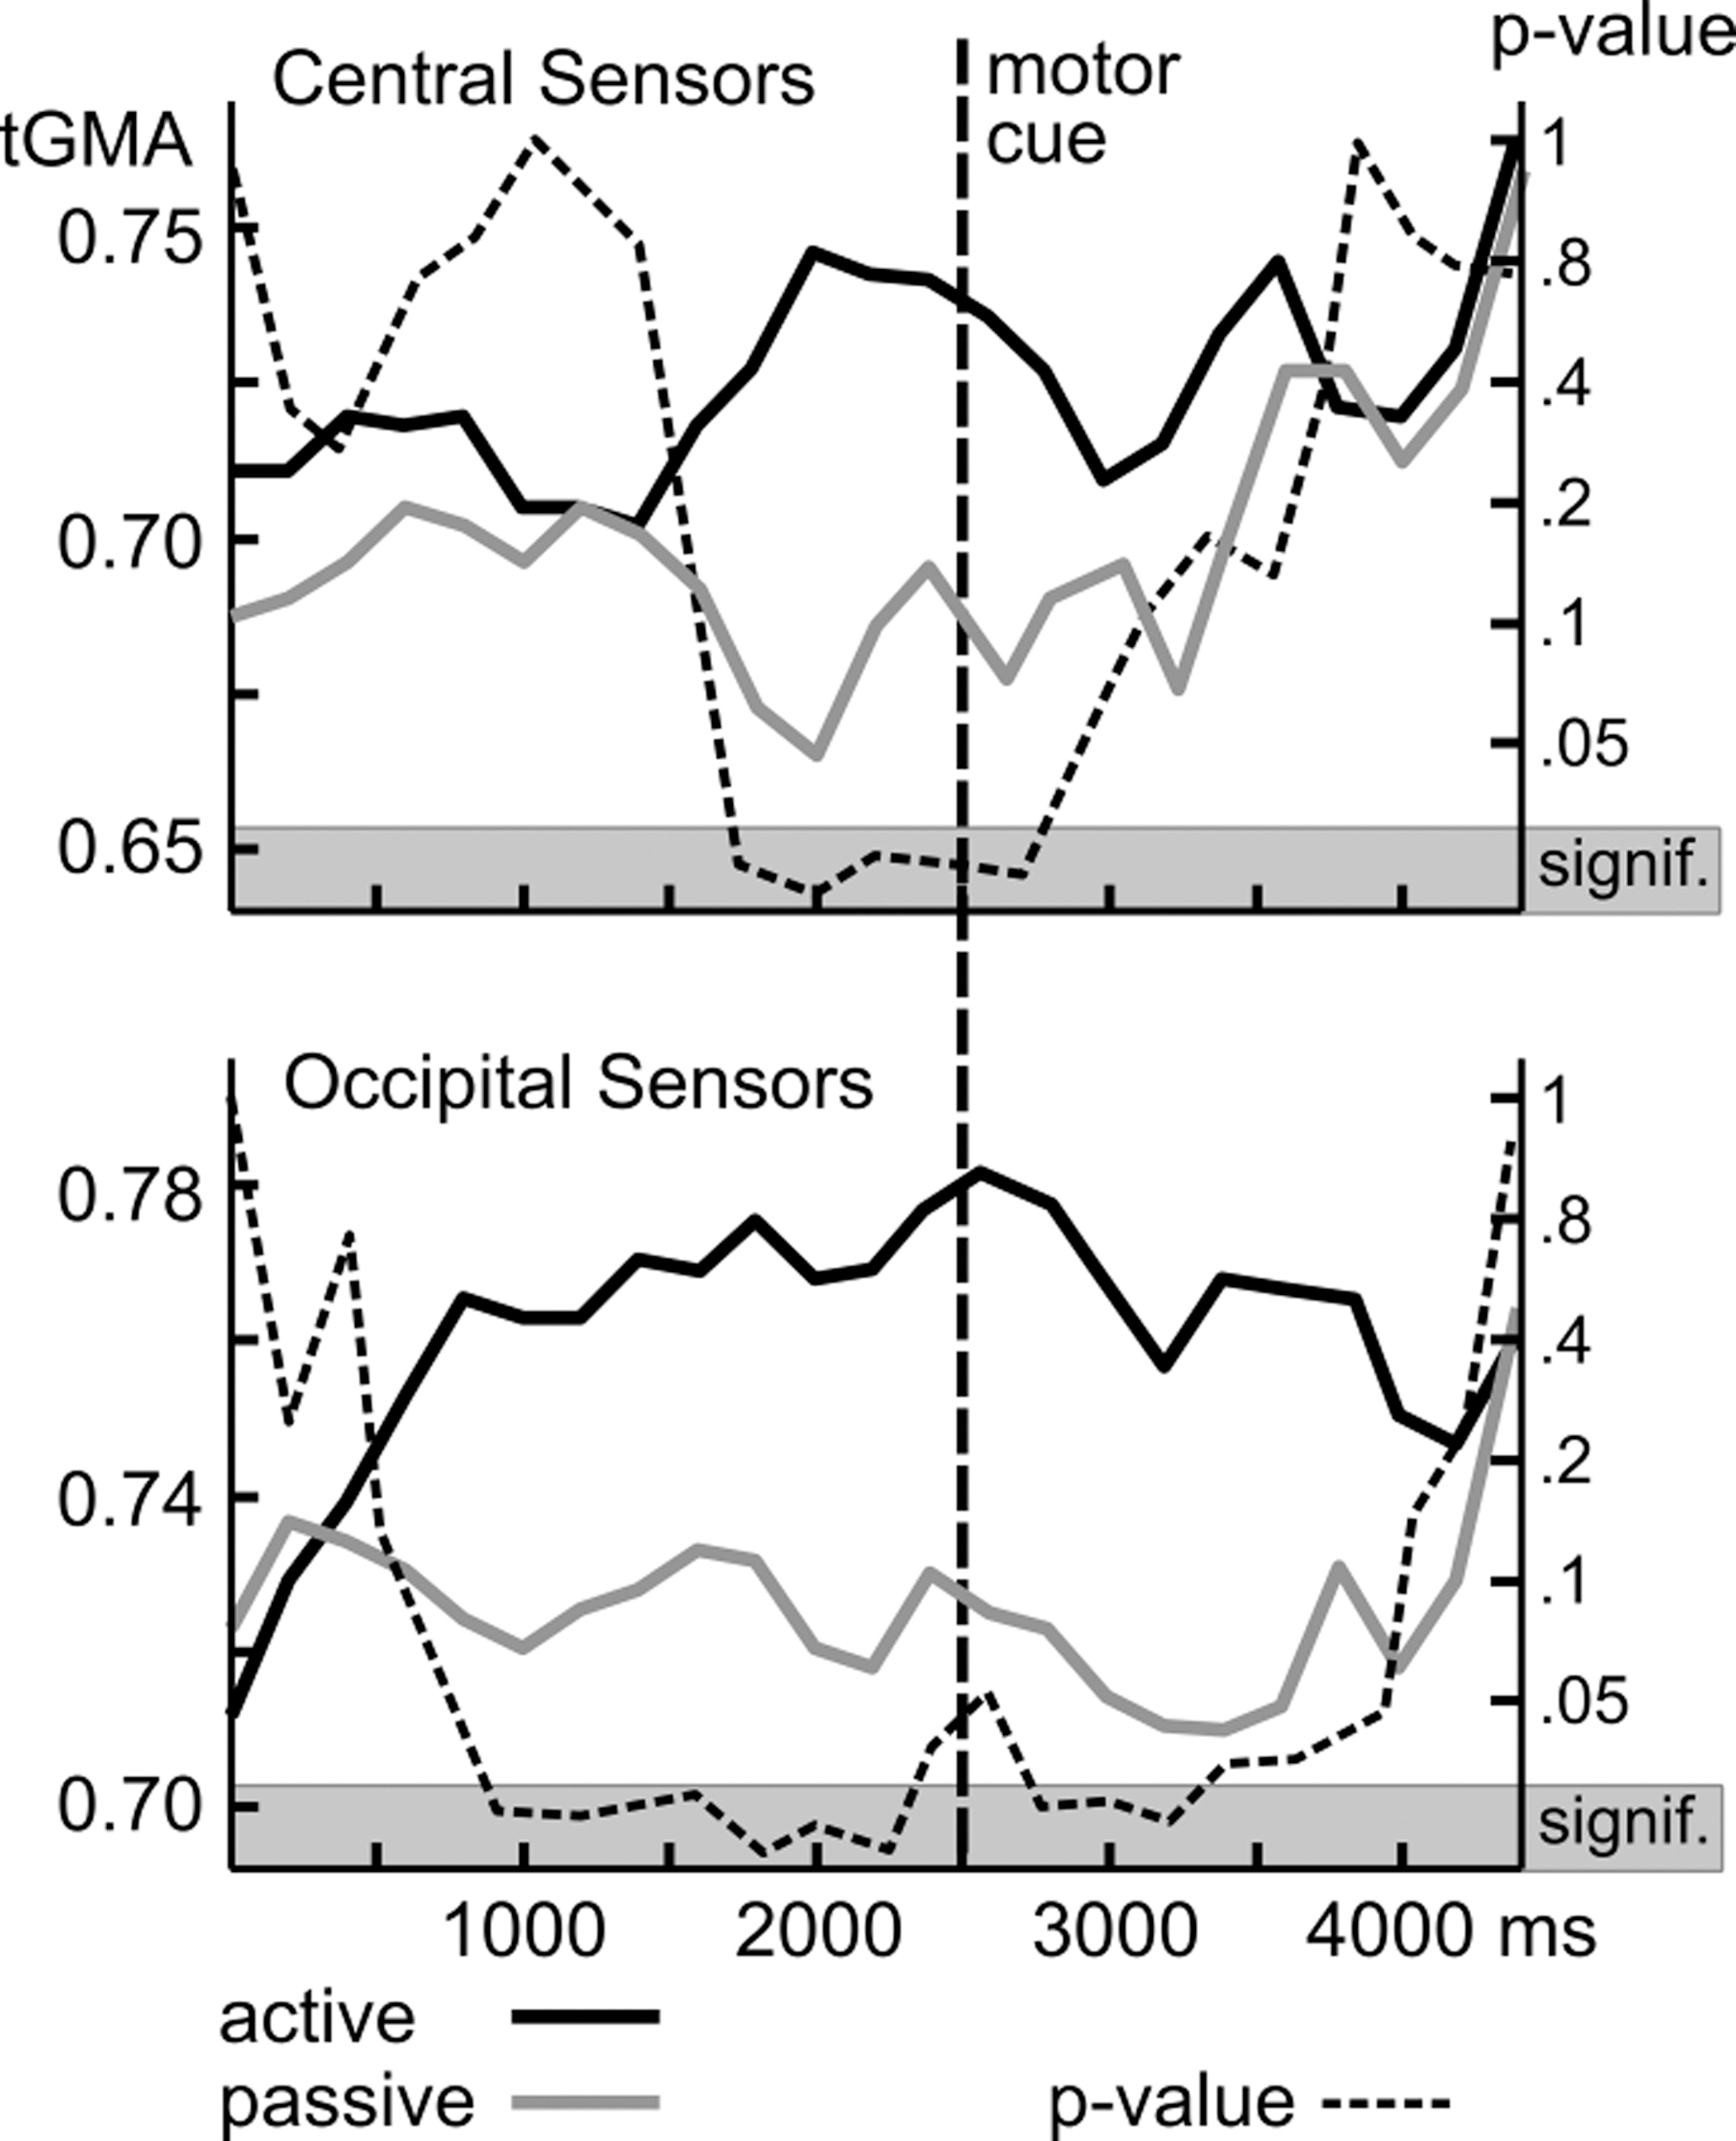
Grand average tGMA and p-value for all active trials versus all passive trials (both threat and safety conditions) at 12 Hz plotted separately for central sensors and occipital sensors. Time course of tGMA values representing long-range connectivity between occipital and central (perimotor) sensors.
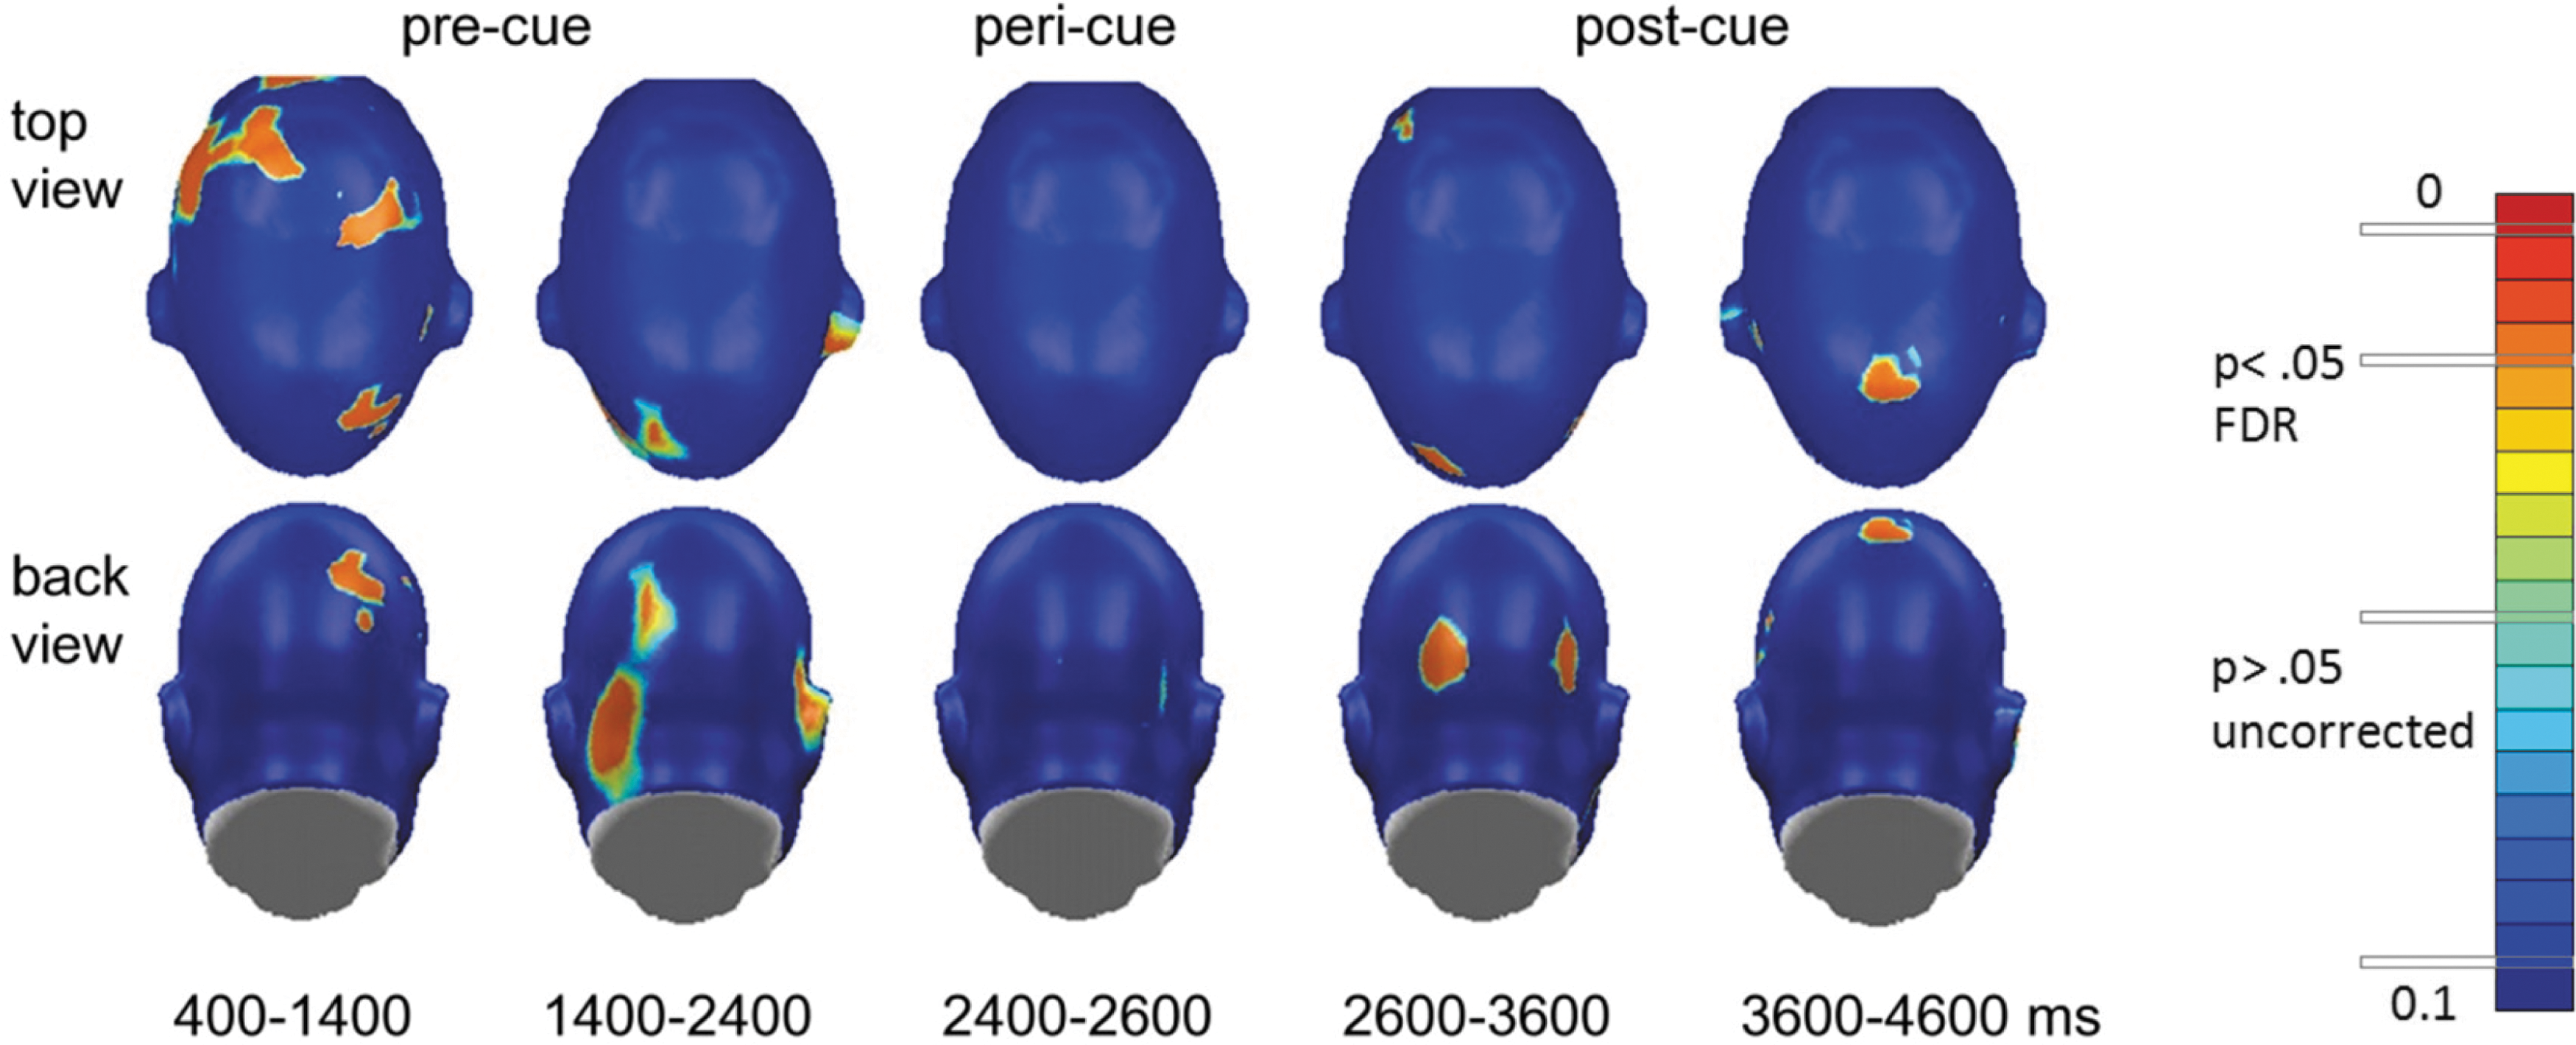
Figure 4 shows that these changes were widespread on the scalp, involving a range of central and frontal recording sites. Local occipital connectivity (Fig. 3, bottom panel) by contrast showed different temporal dynamics with a build-up of heightened connectivity for the active conditions, reaching a significance of 1000 msec after stimulus onset, and sustained until the color change (motor cue), during which the occipital tGMA difference failed to reach FDR-corrected significance threshold. After the motor cue, heightened occipital coupling was sustained for 1000 msec, but disappeared toward the end of the viewing epoch. Topographical mapping indicated (Fig. 4) that particularly the time window preceding the motor cue was characterized by widespread connectivity within and across visual cortices, consistent with cortical communication between areas in extended visual cortex and cortical regions mediating response selection and motor preparation.
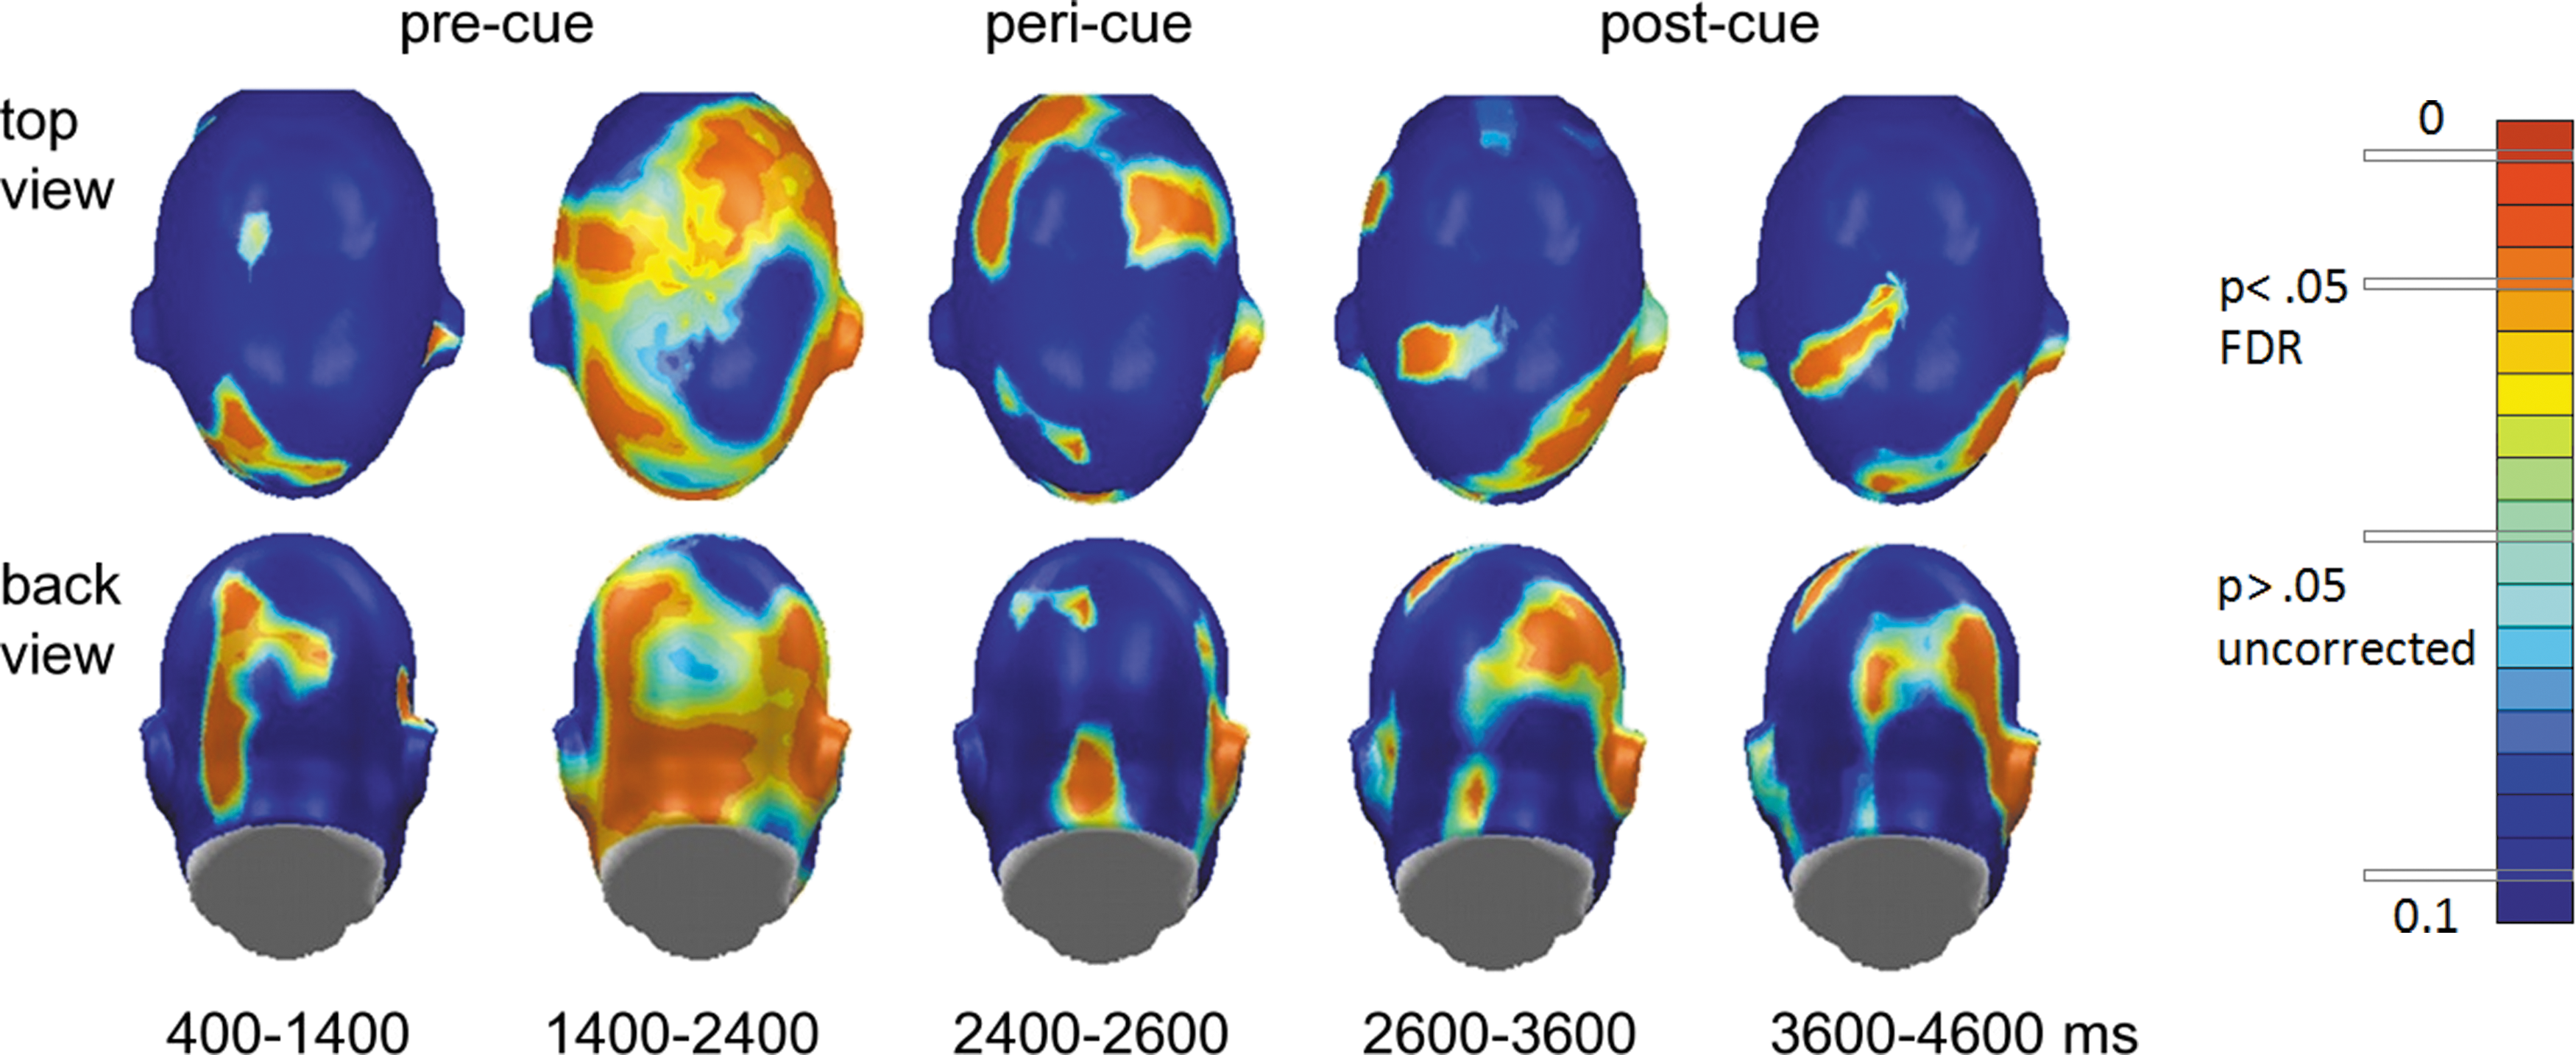
Topographical mapping of p-values (active vs. passive) in precue, pericue, and postcue intervals plotted for 5 consecutive seconds in trials. The 12 Hz action cue evoked functional connectivity. Color images available online at
Threat versus safe conditions (central grating stimulus at 15 Hz)
Time courses of grand averages of tGMA values and p-values for threat versus safe conditions are shown in Figures 5 and 6 for the tagging frequency of 15 Hz, which corresponds to the response to the central grating stimuli. Time courses for threat and safe conditions as well as the p-values of signed-rank tests comparing both conditions suggest greater long-range coupling between occipital and central sites for threat compared with safe conditions starting around 1000 msec after onset of the conditioned stimuli (the gratings), with p-values falling below the FDR-corrected threshold of 0.009, sustained only for the early period of the viewing epoch. In terms of local posterior connectivity, a similar pattern emerged as for the active-passive comparison, with threat cues associated with greater connectivity before and after, but not during the color change, prompting the motor response in active trials. Topographical mapping of the tGMA differences for individual sensors corroborated the sensor group analyses and showed robust early occipito-frontal connectivity as well as sustained bilateral posterior connectivity, which was greater for threat than safe conditions.
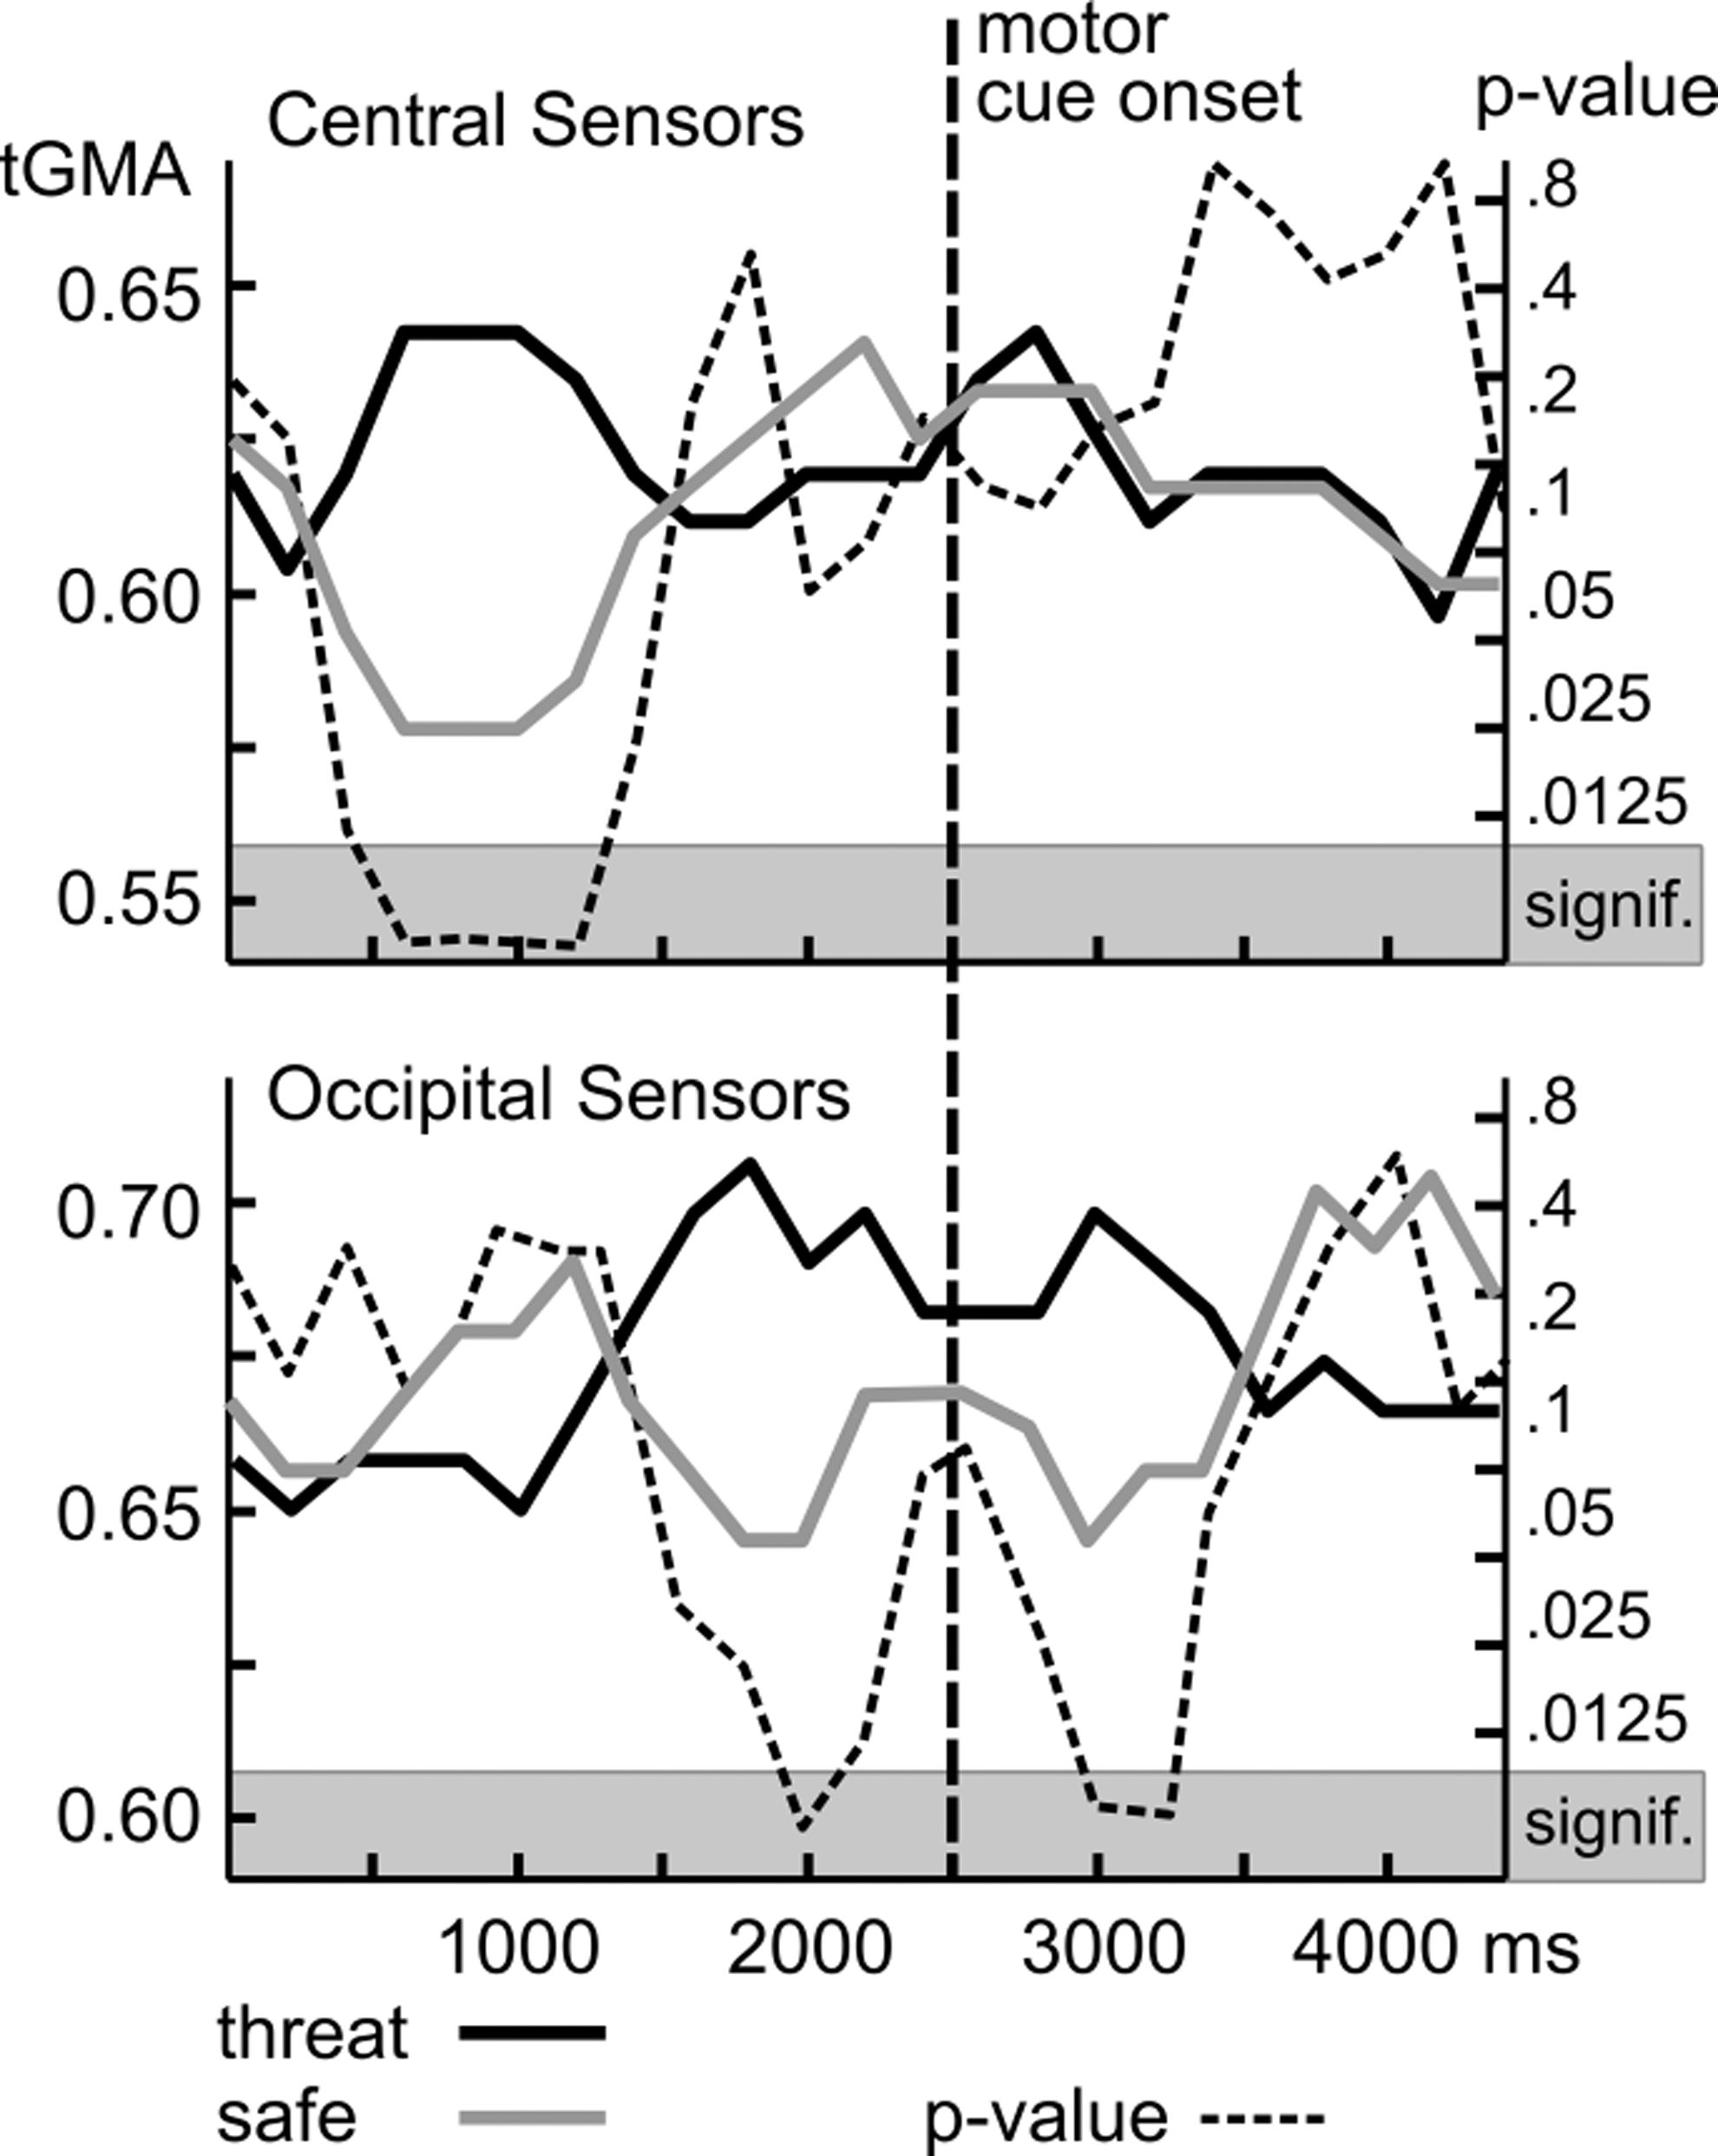
Time courses of grand averages of tGMA values and p-values for threat and safe conditions separately plotted for central sensors (top panel) and occipital sensors (bottom panel).
Topographical mapping of p-values (threat vs. safe) in precue, pericue, and postcue intervals plotted for 5 consecutive seconds in trials and the tagging frequency of 15 Hz, which corresponds to the response to the central grating stimuli. Color images available online at
Interaction between threat/safe and active/passive conditions
Interaction effects were quantified with ANOVAs on log-transformed (and as a control for nontransformed) tGMA data for each time point, sensor location, and two frequencies of interest. Repeated measures ANOVAs with 2 by 2 within-subjects factors of passive/active and threat/safe were applied to test for interaction at each sensor. Two types of interaction effects were tested: the effects between the conditions in the ANOVA models, and the interactions between the tagging frequencies per se. After FDR correction, none of the F-values showed significant interaction effects.
While a systematic comparison of tGMA with other algorithms is outside the scope of this article, the authors have previously done comparisons for discrimination of face versus Gabor patch images using ssVEPs. In short, tGMA is more sensitive than correlation, mutual information (Fadlallah et al., 2012b), and phase locking (Wan et al., 2013) and appears to possess greater discriminant validity. Results in these data set to be published confirm the previous findings and show that phase synchrony and mutual information are able to reveal regions with an acceptable level of discriminability among conditions, but this comes at the expense of sacrificing time resolution. Correlation was unable to distinguish between conditions.
Discussion
Empirical and computational work suggests that the dynamic formation of widespread neuronal assemblies into large-scale functional networks has a key role in cognition and behavior (Sporns, 2013). In this study, the authors quantified the spatio-temporal dynamics of large-scale neural population activity during active, sensorimotor coupled harm avoidance. Specifically, these findings revealed that a novel index of time-varying dependency (tGMA) exhibited sufficient sensitivity to reveal rapid fluctuations in the establishment of visual-motor functional connectivity. Moreover, by employing an electrophysiological technique with high-frequency specificity in combination with an experimental design that explicitly requires sensorimotor information transfer, the authors aimed to minimize the contribution of confounding factors such as signal noise and volume conduction. At the current point of research, source localization was not considered appropriate in the validation of the new tGMA algorithm as it would add an additional processing step with an independent set of mathematical assumptions. As a compromise, the authors settled for CSD maps, which have the benefit of being relatively assumption free.
These findings suggest that the tGMA algorithm is sufficiently sensitive to detect relatively rapid (on the order of ∼200 msec) changes in the establishment of functional links between distinct cortical regions. Action selection in the context of the avoidance of an aversive outcome may be presumed to evoke neurocomputational processes that require cross-regional information transfer between sensory and motor regions, which are necessary to avoid the aversive outcome. The observed fluctuations in the strength of functional connectivity were in the hypothesized direction: Connectivity between visual and perimotor/frontal regions was greater selectively for the active compared with the passive visual stimuli, specifically during those time segments that were most proximal to the onset of the motor cue. The increased coupling of central and visual regions upon presentation of an action cue is in line with a body of work using psychophysiological (Brunia, 1993) as well as functional imaging studies (Hanson et al., 2007; Lizier et al., 2011). Previous studies of conditioned fear avoidance in humans (Delgado et al., 2009) and nonhuman animals have demonstrated that a network of brain regions is recruited during active coping situations (LeDoux and Gorman, 2001). To the extent that participants responded with the right hand, the left hemispheric bias of visual to left vertex coupling is also plausible. Furthermore, local connectivity within visual regions was heightened for threat versus safety cues. This finding is consistent with predictions from the animal model (Amaral et al., 2003) as well as conceptual (Pessoa and Adolphs, 2010) and empirical work (Miskovic and Keil, 2012) on threat perception. Previous studies that have explicitly quantified cortical motor excitability in the context of emotional perception have demonstrated that viewing cues with emotional relevance leads to decreased thresholds for motor evoked potentials (Coombes et al., 2009; Hajcak et al., 2007). The findings in this study extend this work by capturing the dynamic functional connectivity between perceptual and motor regions that is necessary to mediate adaptive behavioral responses in the context of simple cues with acquired emotional relevance.
To the extent that the peripheral cues (the motor cues) in the present task carry information that is partly redundant with the central threat cue, the question may arise if the central cues are processed differentially. The previous study with this dataset examined behavioral and spectral power data during the present task: Both indices suggested that the stimuli were processed in a compound manner, consistent with previous similar work. Specifically, the spectral power at the 12 Hz frequency tag of the peripheral cues did not evidence significant discrimination between the threat versus safe trials (p>0.36)—rather, all spectral power effects at 12 Hz were dominated by the main effect of active/passive motor components (i.e., the motor trials lead to enhanced amplitude of 12 Hz responses compared with the passive trials). The effects of threat/safety exhibited frequency specificity to the tag of the central grating, suggesting that participants were indeed processing these trials as compound mixtures rather than focusing on isolated elements, potentially due to the specific task instructions that they were given to this effect.
The minimum discriminant segment length obtained was ∼200 msec in duration. Importantly, this temporal scale compares quite favorably with estimates of fMRI functional connectivity, where the peak of a BOLD response occurs after up to 2 sec. In general, therefore, EEG (and MEG) methods have the capacity to reveal the formation (and presumably, the dissolution) of functional brain networks in cognitive real time. Varela (1999) has postulated the existence of different temporal orders/scales of neurocomputation: the 1/10 scale (tens of milliseconds) corresponds to the most basic sensorimotor neural events, the 1 scale (hundreds of milliseconds) corresponds to the cognitive realm requiring large-scale neural integration, and the 10 scale involves temporally extended memory schemas. The tGMA technique as applied to measures of scalp EEG therefore appears to have the requisite sensitivity to index the level of cortical processing that is most germane to the cognitive and affective neurosciences. In addition, the tGMA approach, since it is rank based and independent of the time-series scale, may be uniquely suited for exploring the integration of different imaging and measurement modalities (each with its own spatiotemporal resolution). Current efforts in the laboratories explore the use of this property in integrating EEG and hemodynamic imaging data. Such integration is of interest because tGMA is capable of using the oscillatory signature of scalp EEG and thus reflects neural dynamics in ways that are not feasible with hemodynamic measures.
Although the properties of the ssVEP are desirable for validation studies (Vialatte et al., 2010), EEG functional connectivity estimates are often pursued in paradigms that involve ongoing or spontaneous brain activity during longer periods of measurement (Ben-Simon et al., 2008). The application of the tGMA algorithm to these problems will be systematically examined in future studies. Furthermore, given that the spectrum of available functional connectivity estimates is considerable, a comprehensive comparison of connectivity algorithms is still needed, ideally using a wide range of experimental paradigms as well as data with known connectivity profiles, such as synthetic data, which would serve as the ground truth.
The tGMA algorithm still has a free parameter that potentially affects the results and so it has to be selected carefully for the goals of the experiment. The authors found that there is a broad range of delays that provide very similar tGMA values. However, in this study, the authors only considered data from the same flickering frequency. When the experiment requires different flickering frequencies, the same value of the delay should not be employed because the time correlation of the filtered ssVEP changes with the frequency, but can be partially compensated by the delay. In conclusion, tGMA is applicable to empirical data collected in the human electrophysiology laboratory and sensitive to experimental manipulations. The validity and spatial accuracy of scalp-based connectivity indices will remain a question of substantial interest given that EEG measurements at high channel counts are increasingly available, inexpensive, and highly compatible with clinical and translational research settings.
Footnotes
Author Disclosure Statement
No competing financial interests exist.