
Abstract
Individuals with nonspecific low back pain (NSLBP) show a decreased sit-to-stand-to-sit (STSTS) performance. This dynamic sensorimotor task requires integration of sensory and motor information in the brain. Therefore, a better understanding of the underlying central mechanisms of impaired sensorimotor performance and the presence of NSLBP is needed. The aims of this study were to characterize differences in sensorimotor functional connectivity in individuals with NSLBP and to investigate whether the patterns of sensorimotor functional connectivity underlie the impaired STSTS performance. Seventeen individuals with NSLBP and 17 healthy controls were instructed to perform five consecutive STSTS movements as fast as possible. Based on the center of pressure displacement, the total duration of the STSTS task was determined. In addition, resting-state functional connectivity images were acquired and analyzed on a multivariate level using both functional connectivity density mapping and independent component analysis. Individuals with NSLBP needed significantly more time to perform the STSTS task compared to healthy controls. In addition, decreased resting-state functional connectivity of brain areas related to the integration of sensory and/or motor information was shown in the individuals with NSLBP. Moreover, the decreased functional connectivity at rest of the left precentral gyrus and lobule IV and V of the left cerebellum was associated with a longer duration of the STSTS task in both individuals with NSLBP and healthy controls. In summary, individuals with NSLBP showed a reorganization of the sensorimotor network at rest, and the functional connectivity of specific sensorimotor areas was associated with the performance of a dynamic sensorimotor task.
Introduction
Both the sit-to-stand and the stand-to-sit movements are common and essential activities of daily living (Dall and Kerr, 2010). These movements require control of the vertical and horizontal center of mass displacement (Kralj et al., 1990; Reisman et al., 2002). Therefore, a successful sit-to-stand-to-sit (STSTS) performance needs an optimal pelvic and lumbosacral control, which requires an integration of sensory and motor information in the brain (Hall et al., 2010). This is particularly important during the change of movement direction, which is inherently linked to the STSTS task (Claeys et al., 2012).
Previous studies have shown that the sit-to-stand movement is a more energy demanding and less efficient task for individuals with nonspecific low back pain (NSLBP), which in turn further exacerbates the back pain symptoms (Shum et al., 2009). Consequently, individuals with NSLBP need significantly more time to perform five consecutive STSTS movements compared to healthy controls (Claeys et al., 2012). It was suggested that this decreased STSTS performance in individuals with NSLBP is related to peripheral mechanisms such as reduced trunk and hip motion (Shum et al., 2005, 2007), decreased leg muscle strength (Hughes et al., 1996), and/or impaired proprioceptive afference from the lumbopelvic region (Claeys et al., 2012). Nevertheless, a better understanding of central mechanisms that underlie impaired sensorimotor control, particularly during the STSTS movement, and that underlie the presence of NSLBP is needed.
A valuable technique to evaluate central (neural) mechanisms is resting-state functional magnetic resonance imaging (RS-fMRI). The evaluation of resting-state functional connectivity is relevant for the understanding of human behavior (Solesio-Jofre et al., 2014; Wu et al., 2007). In individuals with NSLBP, RS-fMRI research has mainly focused on the effect of chronic pain on brain dynamics, and these studies typically found aberrant functional connectivity of the default mode network in individuals with chronic low back pain compared to healthy controls (Baliki et al., 2008; Tagliazucchi et al., 2010). However, no study investigated the relationship between the functional connectivity of the sensorimotor network and sensorimotor disabilities in individuals with NSLBP using RS-fMRI. Only a few studies in aging (Solesio-Jofre et al., 2014; Wu et al., 2007) and frontal lobe epilepsy patients (Woodward et al., 2014) have already investigated such relationships. For example, age-related increases in functional connectivity between interhemispheric dorsal and ventral premotor areas seemed to be associated with poorer performance on a bimanual visuomotor task (Solesio-Jofre et al., 2014).
The current study had two main hypotheses. (1) Individuals with NSLBP display an altered pattern of functional connectivity in the sensorimotor network compared to healthy controls. The study aimed to characterize functional connectivity differences in NSLBP at a multivariate level using both functional connectivity density mapping and independent component analysis. (2) The patterns of decreased functional connectivity underlie the impaired performance of the STSTS task. In other words, a correlation between a decreased sensorimotor resting-state connectivity and longer duration of the STSTS task was expected.
Materials and Methods
Participants
Seventeen individuals with NSLBP (11 women and 6 men) and 17 age-matched (±2 years) healthy individuals (12 women and 5 men), aged between 20 and 50 years, voluntarily participated in this study. The individuals with NSLBP had at least 6 months of disabling NSLBP (Oswestry Disability Index, version 2 [Fairbank and Pynsent, 2000] [adapted Dutch version]>12%). The healthy individuals had no history of NSLBP and reported a score of 0% on the Oswestry Disability Index, version 2. The exclusion criteria for both groups included a history of specific vestibular and/or balance problems, cardiovascular and/or neurological disorders, neck problems (Neck Disability Index [Vernon and Mior, 1991] >6%), and previous major trauma and/or surgery of the spine or lower limbs. In addition, each individual had to meet the criteria for RS-fMRI-related research and none of the participants was treated with opioid medication. All participants provided their written informed consent before their inclusion in the study. The study conformed to the principles of the Declaration of Helsinki (1975) and its later amendments, was approved by the local Ethics Committee of Biomedical Sciences, KU Leuven, Belgium (s53802), and was registered at
STSTS task
The participants were instructed to sit barefoot on a stool that was placed on a six-channel force plate (Bertec Corporation, OH) with their arms relaxed along their body and their vision occluded by means of nontransparent goggles. Vision was occluded to exclude vision as a potential compensation strategy for impaired proprioceptive postural control. The stool height was adjusted for each participant to assure an angle of 90° in both hips and knees. After 15 sec of usual sitting (no instructions on posture were given), participants were asked to perform five consecutive STSTS movements, with a full range of motion and as fast as possible. An investigator stood near the participant to prevent actual falls. The force plate registered anterior–posterior center of pressure displacements. The center of pressure displacements was sampled at 500 Hz using a Micro1401 data acquisition system and Spike2 software (Cambridge Electronic Design, United Kingdom). This protocol was performed both with the feet placed on a stable and on an unstable support surface (50 cm length×41 cm width×6 cm thickness, Airex balance pad elite) on the force plate. The unstable support surface enforces an additional reweighting of proprioceptive signals due to the decreased reliability of proprioceptive information from the ankle region (Kiers et al., 2011). Therefore, potential impaired proprioceptive postural control will be particularly prominent in this unstable condition. A similar setup was used in previous studies (Claeys et al., 2012; Janssens et al., 2014). The total duration of the five consecutive STSTS movements was calculated based on the anterior–posterior center of pressure displacement. The starting and end point of the task was defined by the mean value of the center of pressure during usual sitting before and after the task.
RS-fMRI acquisition
A Philips 3 T Achieva scanner (Philips, Best, The Netherlands) and a standard 32-channel head coil were used for data acquisition. High-resolution whole-brain T1-weighted anatomical scans were obtained with a 3D-TFE sequence (voxel size of 0.98×0.98×1.2 mm3, repetition time of 9.59 ms, echo time of 4.6 ms, a flip angle of 8°, 182 coronal slices, field of view of 250×250×218 mm3, matrix of 256×256 mm2, and an acquisition time of 6.22 min). In addition, echo-planar images were acquired. The participants were instructed to fixate their eyes on a white cross in the middle of a darkened screen and were asked not to move or fall asleep. In addition, they were asked not to think about or concentrate on anything in particular. The RS-fMRI protocol had a slice thickness of 4 mm, a repetition time/echo time of 1700/33 ms, a flip angle of 90°, a field of view of 230×230×124 mm3, an acquisition matrix of 64×64 mm2, and an acquisition time of 7.12 min.
Preprocessing
To avoid data in the analysis that were collected before reaching signal equilibrium, the first four images were discarded. The acquired data were corrected for time of acquisition of each slice, realigned, and spatially normalized to the stereotactic space of the Montreal Neurological Institute with the statistical parametric mapping package SPM8 (Wellcome Trust Centre for Neuroimaging, London, United Kingdom). To improve the signal-to-noise ratio, spatial smoothing was performed using a spatially stationary Gaussian filter with a kernel width of 8 mm (full width at half maximum [FWHM]). Afterward, the REST toolbox (Song et al., 2011) was used to perform the preprocessing steps detrending and filtering (0.01 Hz<f<0.1 Hz) to reduce the low-frequency drift and physiological high-frequency respiratory and cardiac noise. To control for the effect of subject's motion on functional connectivity measures, the authors computed the voxel-specific mean framewise displacement (FD) (Power et al., 2012, 2014). The default threshold of acceptable FD is 0.5. FD in healthy controls was 0.1398±0.0446, and FD in individuals with NSLBP was 0.1332±0.0486. Therefore, FD values were below the traditionally acceptable limits of subject motion. In addition, no group difference in motion was present and the motion time series were not correlated with the blood oxygen level dependent (BOLD) time series. Therefore, no motion correction was applied in the subsequent analysis.
Independent component analysis of the sensorimotor network
GIFT software (Calhoun et al., 2004) was used to perform independent component analysis to investigate potential differences in resting-state characteristics of the sensorimotor network in individuals with NSLBP compared to healthy controls. The preprocessed data of both groups were decomposed into spatially independent resting-state networks. All data of the participants with NSLBP were combined in the temporal domain (fast independent component analysis approach) and 20 components were extracted. The same was done for the healthy individuals. The identification of the networks was performed visually based on previously defined templates (Beckmann et al., 2005; Mantini et al., 2007). Only the sensorimotor network (Mantini et al., 2007), an anatomical a priori identified network of interest defined by a sensorimotor mask (Thomason et al., 2011), was retained for further second-level examination in the statistical parametric mapping package SPM8.
Functional connectivity density mapping of the sensorimotor network
The strength of the short-range and long-range functional connectivity density of the sensorimotor network, an anatomical a priori identified network of interest (Thomason et al., 2011), was calculated with an ultrafast graph theory method for computing local and global functional connectivity density maps, defined as functional connectivity density mapping (Tomasi and Volkow, 2010, 2011). This method was used to map the distribution of functional connectivity in the human brain and allows the identification of functional hubs (regions that are densely connected) with high density. Pearson correlations between the time series at voxel x0 and the time series of the other voxels of the sensorimotor network in the brain were calculated. To define the number of functional connections between voxels, a threshold of r=0.6 (p<0.05) was used. In other words, two voxels were considered to be connected if the correlation coefficient between the two voxels exceeded r>0.6. The short-range functional connectivity density was defined as all voxels that belonged to a local cluster of functionally connected voxels to voxel x0. A voxel xy was added to the functionally connected cluster of voxel x0, if it was adjacent to a voxel that was linked to x0 by a continuous path of functionally connected voxels and if the correlation between x0 and xy was r>0.6. This calculation was repeated until no new voxels could be added to the cluster, and the whole process was performed for all N voxels. The strength of the long-range functional connectivity density was computed as the total number of functional connections minus all connections that belonged to the local cluster (Tomasi and Volkow, 2010, 2011).
Statistics
The unpaired t-test was used to calculate group differences in the characteristics of the participants. Differences in the STSTS performance were analyzed with a factorial between and within repeated measures analysis of variance. A one-way analysis of variance in SPM8 was performed to examine group differences in short- and long-range functional connectivity density (familywise error, a threshold of p<0.05 and cluster size of five voxels were used for statistical group analysis [Friston et al., 1996]) and group differences in functional connectivity, which were calculated with the independent component analysis (AlphaSim was used to correct for multiple comparisons on the T-maps resulting in a threshold of p<0.05 and a cluster size of 9 [Song et al., 2011]).
Based on the outliers labeling rule (with a g-factor of 2.2) (Hoaglin and Inglewicz, 1987), three participants with NSLBP were defined as outliers in the STSTS data (two participants in the stable support surface condition and one in the unstable support surface condition). In addition, in the data of the independent component analysis of the sensorimotor network, three outliers (two individuals with NSLBP and one healthy control) were defined in the right middle frontal gyrus and the right superior frontal gyrus. These values were excluded pairwise from the correlation analysis. Because the STSTS data were not normally distributed (p>0.05), Spearman's correlations were calculated to investigate the association between the duration of five consecutive STSTS movements and the RS-fMRI characteristics, which were calculated both with functional connectivity density mapping and independent component analysis. The significance level for correlation analysis was set at p<0.05 uncorrected. The statistical analysis was performed with SPSS 19.
Results
Characteristics of the participants
Characteristics of the participants are shown in Table 1. No significant differences in demographic characteristics were found between groups (p>0.05), except for weight (p=0.036). The weight of the participants and the total time needed to perform the STSTS task on stable and unstable support surface were not significantly correlated (p>0.05), and weight was therefore not included in the analysis. Because no age difference between groups was observed (p>0.05), age was not included in the statistical analysis. In addition, the pain characteristics of the individuals with NSLBP, defined by the back pain scores on the numerical rating scale during the last month and at the moment of testing, were not correlated with the performance of the STSTS task (p>0.05).
Characteristics of the Participants
Data are presented as mean±standard deviation.
Significance level (p<0.05).
BMI, body–mass index; N/A, not applicable; NRSback current, back pain score on the numerical rating scale (0–10) at the moment of testing; NRSback usual, back pain score on the numerical rating scale (0–10) during the last month; NS, not significant; NSLBP, nonspecific low back pain; ODI-2, Oswestry Disability Index, version 2 (adapted Dutch version).
STSTS task
No interaction effect between group and support surface was present (p>0.05). However, the main effect of group showed that individuals with NSLBP needed significantly more time to perform five consecutive STSTS movements on stable and unstable support surface compared to healthy controls (p=0.002). Moreover, the main effect of surface showed a significant decrease in duration of the STSTS task on unstable support surface compared to the stable condition, irrespective of group (p=0.017) (stable, NSLBP: 18.1±6.9 sec, healthy: 12.9±2.5 sec; unstable, NSLBP: 16.8±5.9 sec, healthy: 11.5±2.0).
Independent component analysis of the sensorimotor network
Table 2 shows significant group differences of the independent component analysis of the sensorimotor network. Clusters with increased values of functional connectivity at rest in individuals with NSLBP compared to healthy controls were found in the right middle frontal gyrus, the right superior frontal gyrus, and in lobule VI of the vermis. In contrast, the clusters, in which the functional connectivity at rest was significantly higher in the healthy control group compared to the individuals with NSLBP, were found in the left supplementary motor area, the left precentral gyrus, and in lobule IV and V of the left cerebellum.
Group Differences in Functional Connectivity of the Sensorimotor Network (Calculated with the Independent Component Analysis)
Data are presented as mean±standard deviation.
Functional connectivity density mapping of the sensorimotor network
Individuals with NSLBP showed a significantly lower long-range functional connectivity density at rest of the left supplementary motor area compared to healthy controls (NSLBP: 34.6±29.5, healthy: 57.8±31.3; p=0.001, t=4.21). In addition, a significantly lower short-range functional connectivity density at rest of the left postcentral gyrus was observed in individuals with NSLBP compared to healthy controls (NSLBP: 29.9±15.0, healthy: 54.2±28.9; p=0.001, t=4.76).
Association between the RS-fMRI parameters of the sensorimotor network and the performance of the STSTS task
Cleaned data without outliers showed that the functional connectivity at rest of the left precentral gyrus, as part of the sensorimotor network, correlated significantly with the duration to perform five consecutive STSTS movements on unstable support surface in both individuals with NSLBP and healthy controls (r=−0.356, p=0.042; Fig. 1). In addition, the functional connectivity at rest of the left cerebellum lobule IV and V of this sample was associated with the performance of the STSTS task on stable and unstable support surface (stable: r=−0.357, p=0.045, Fig. 2A; unstable: r=−0.371, p=0.034; Fig. 2B). In other words, a decreased functional connectivity at rest of the left precentral gyrus and the left cerebellum lobule IV and V was associated with an increased duration to perform the STSTS task. The other regions of the sensorimotor network that showed significant functional connectivity differences between groups were not correlated with the STSTS task (p>0.05).
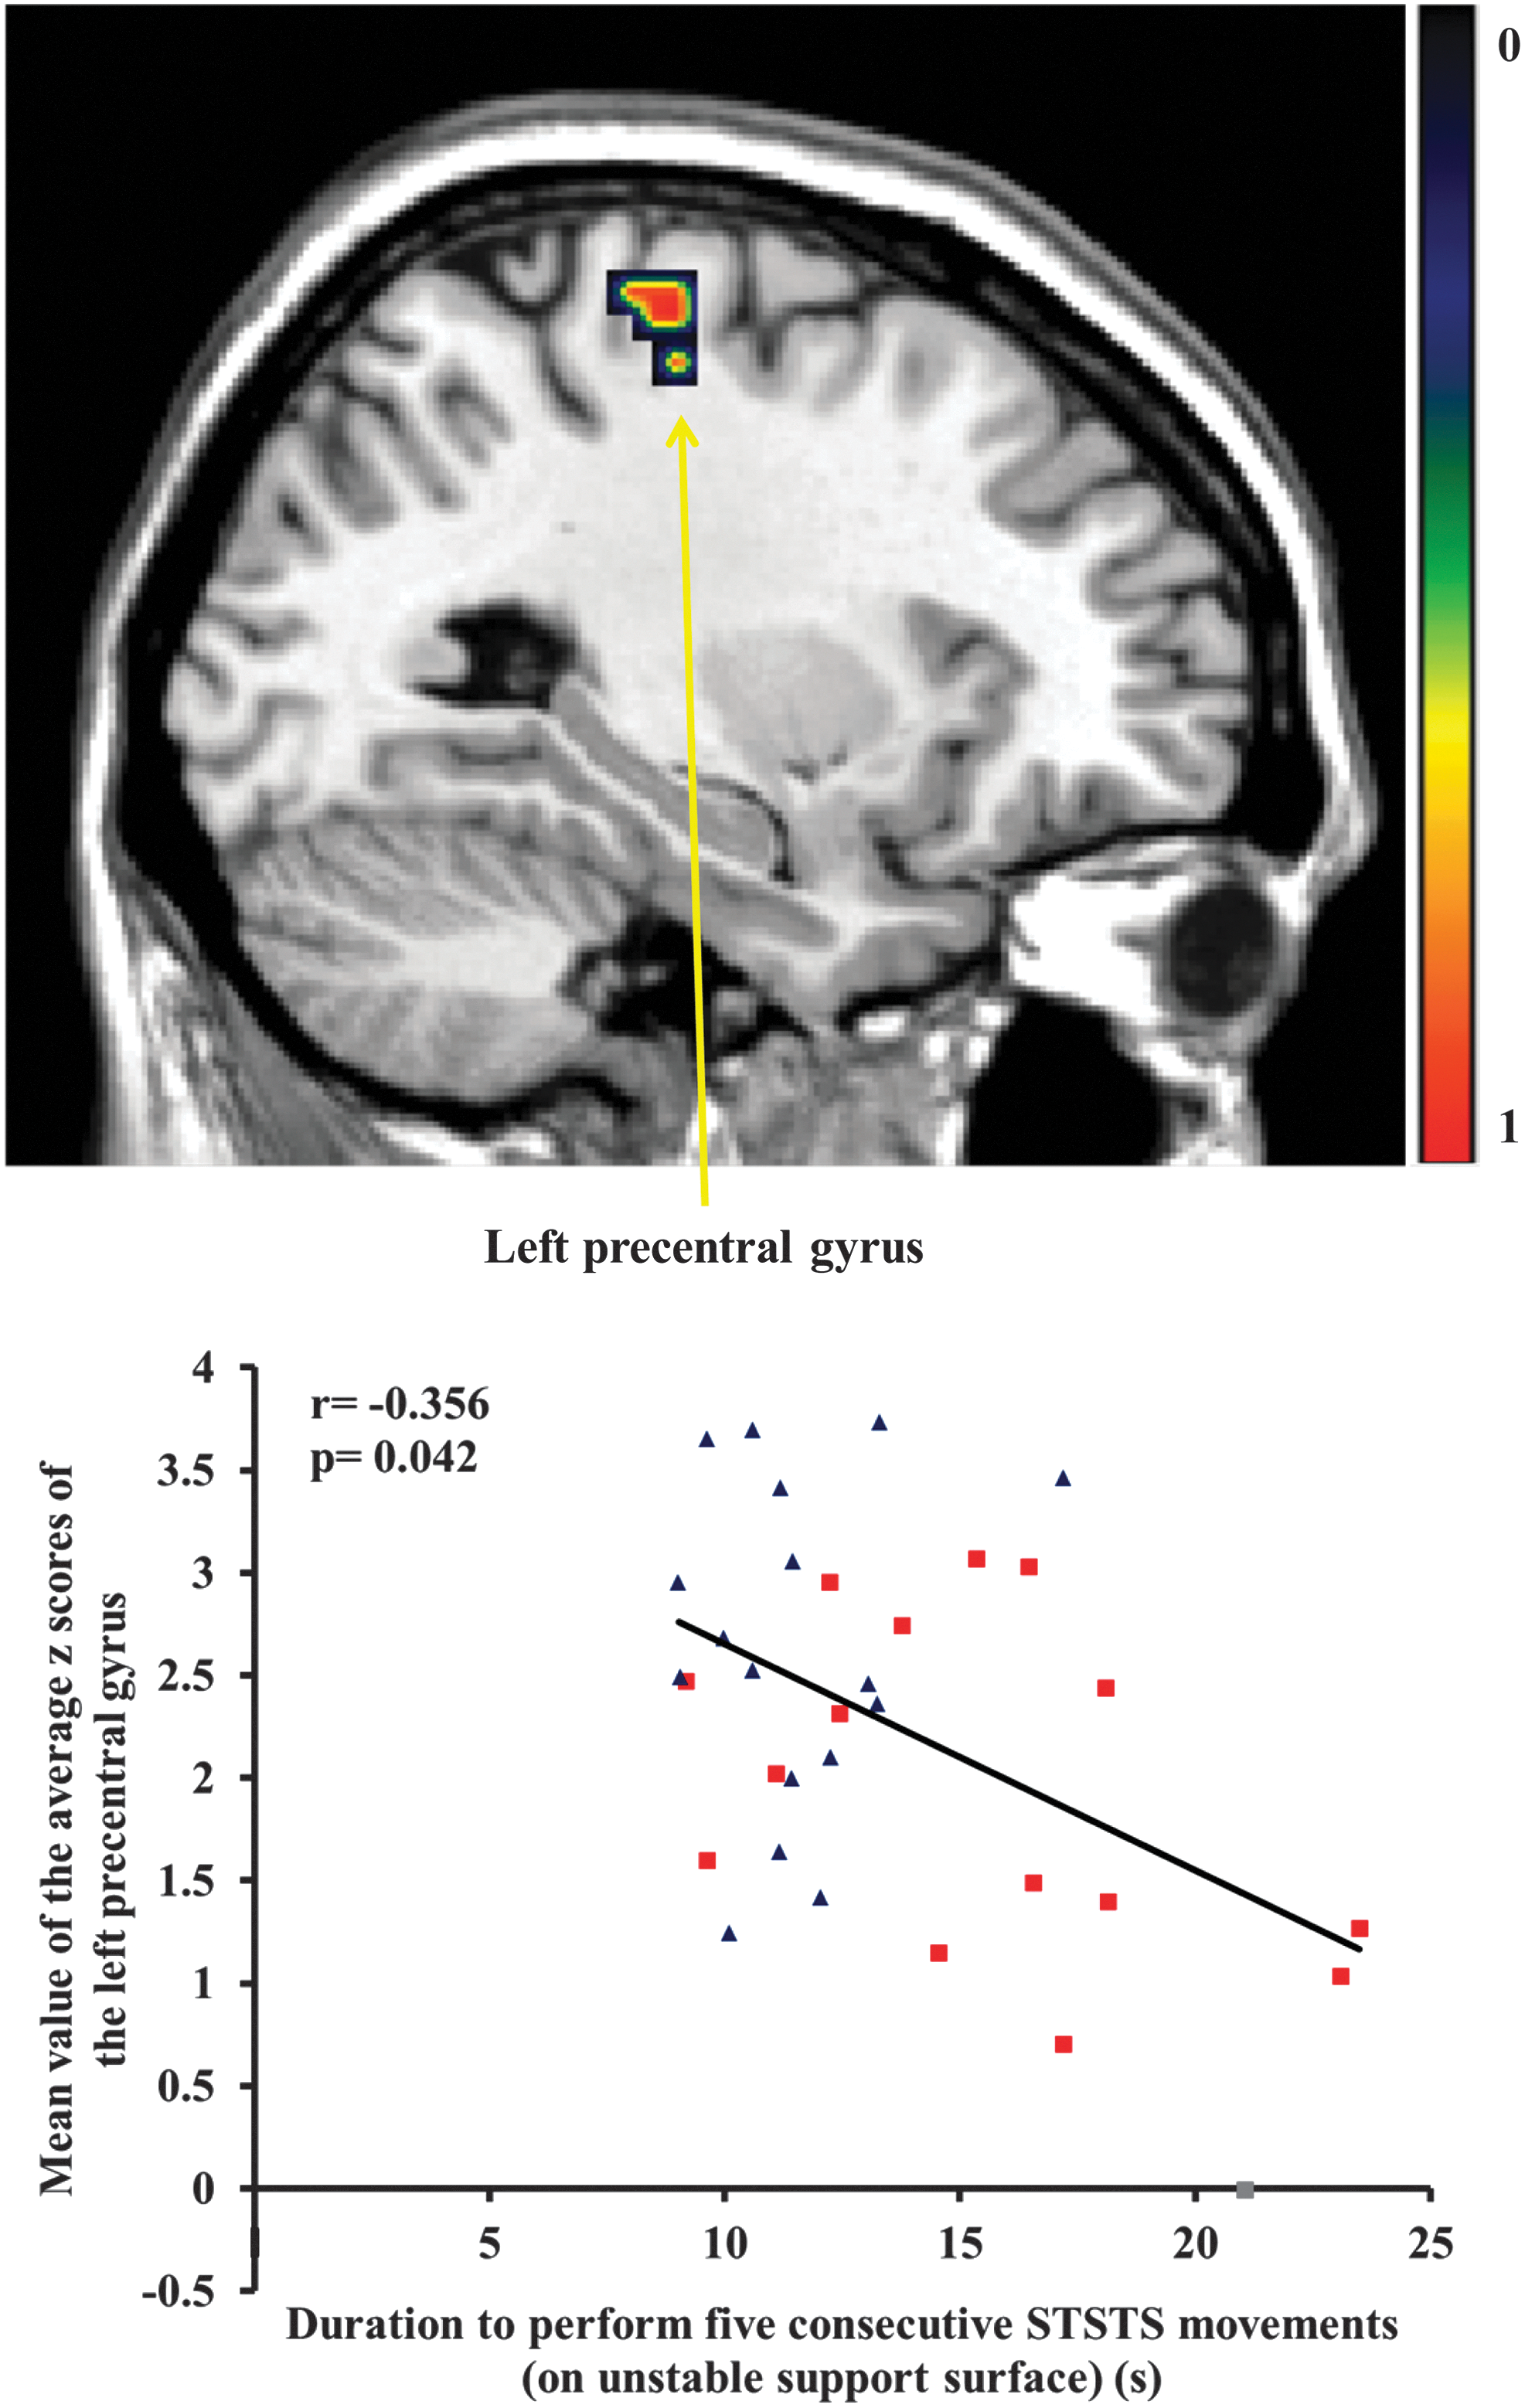
Representation of decreased functional connectivity of the left precentral gyrus in individuals with nonspecific low back pain (NSLBP) compared to healthy controls. Scatter plot of the association between the functional connectivity of the left precentral gyrus and the duration to perform five consecutive sit-to-stand-to-sit (STSTS) movements on unstable support surface in both individuals with NSLBP (■) and healthy controls (▲). Color images available online at
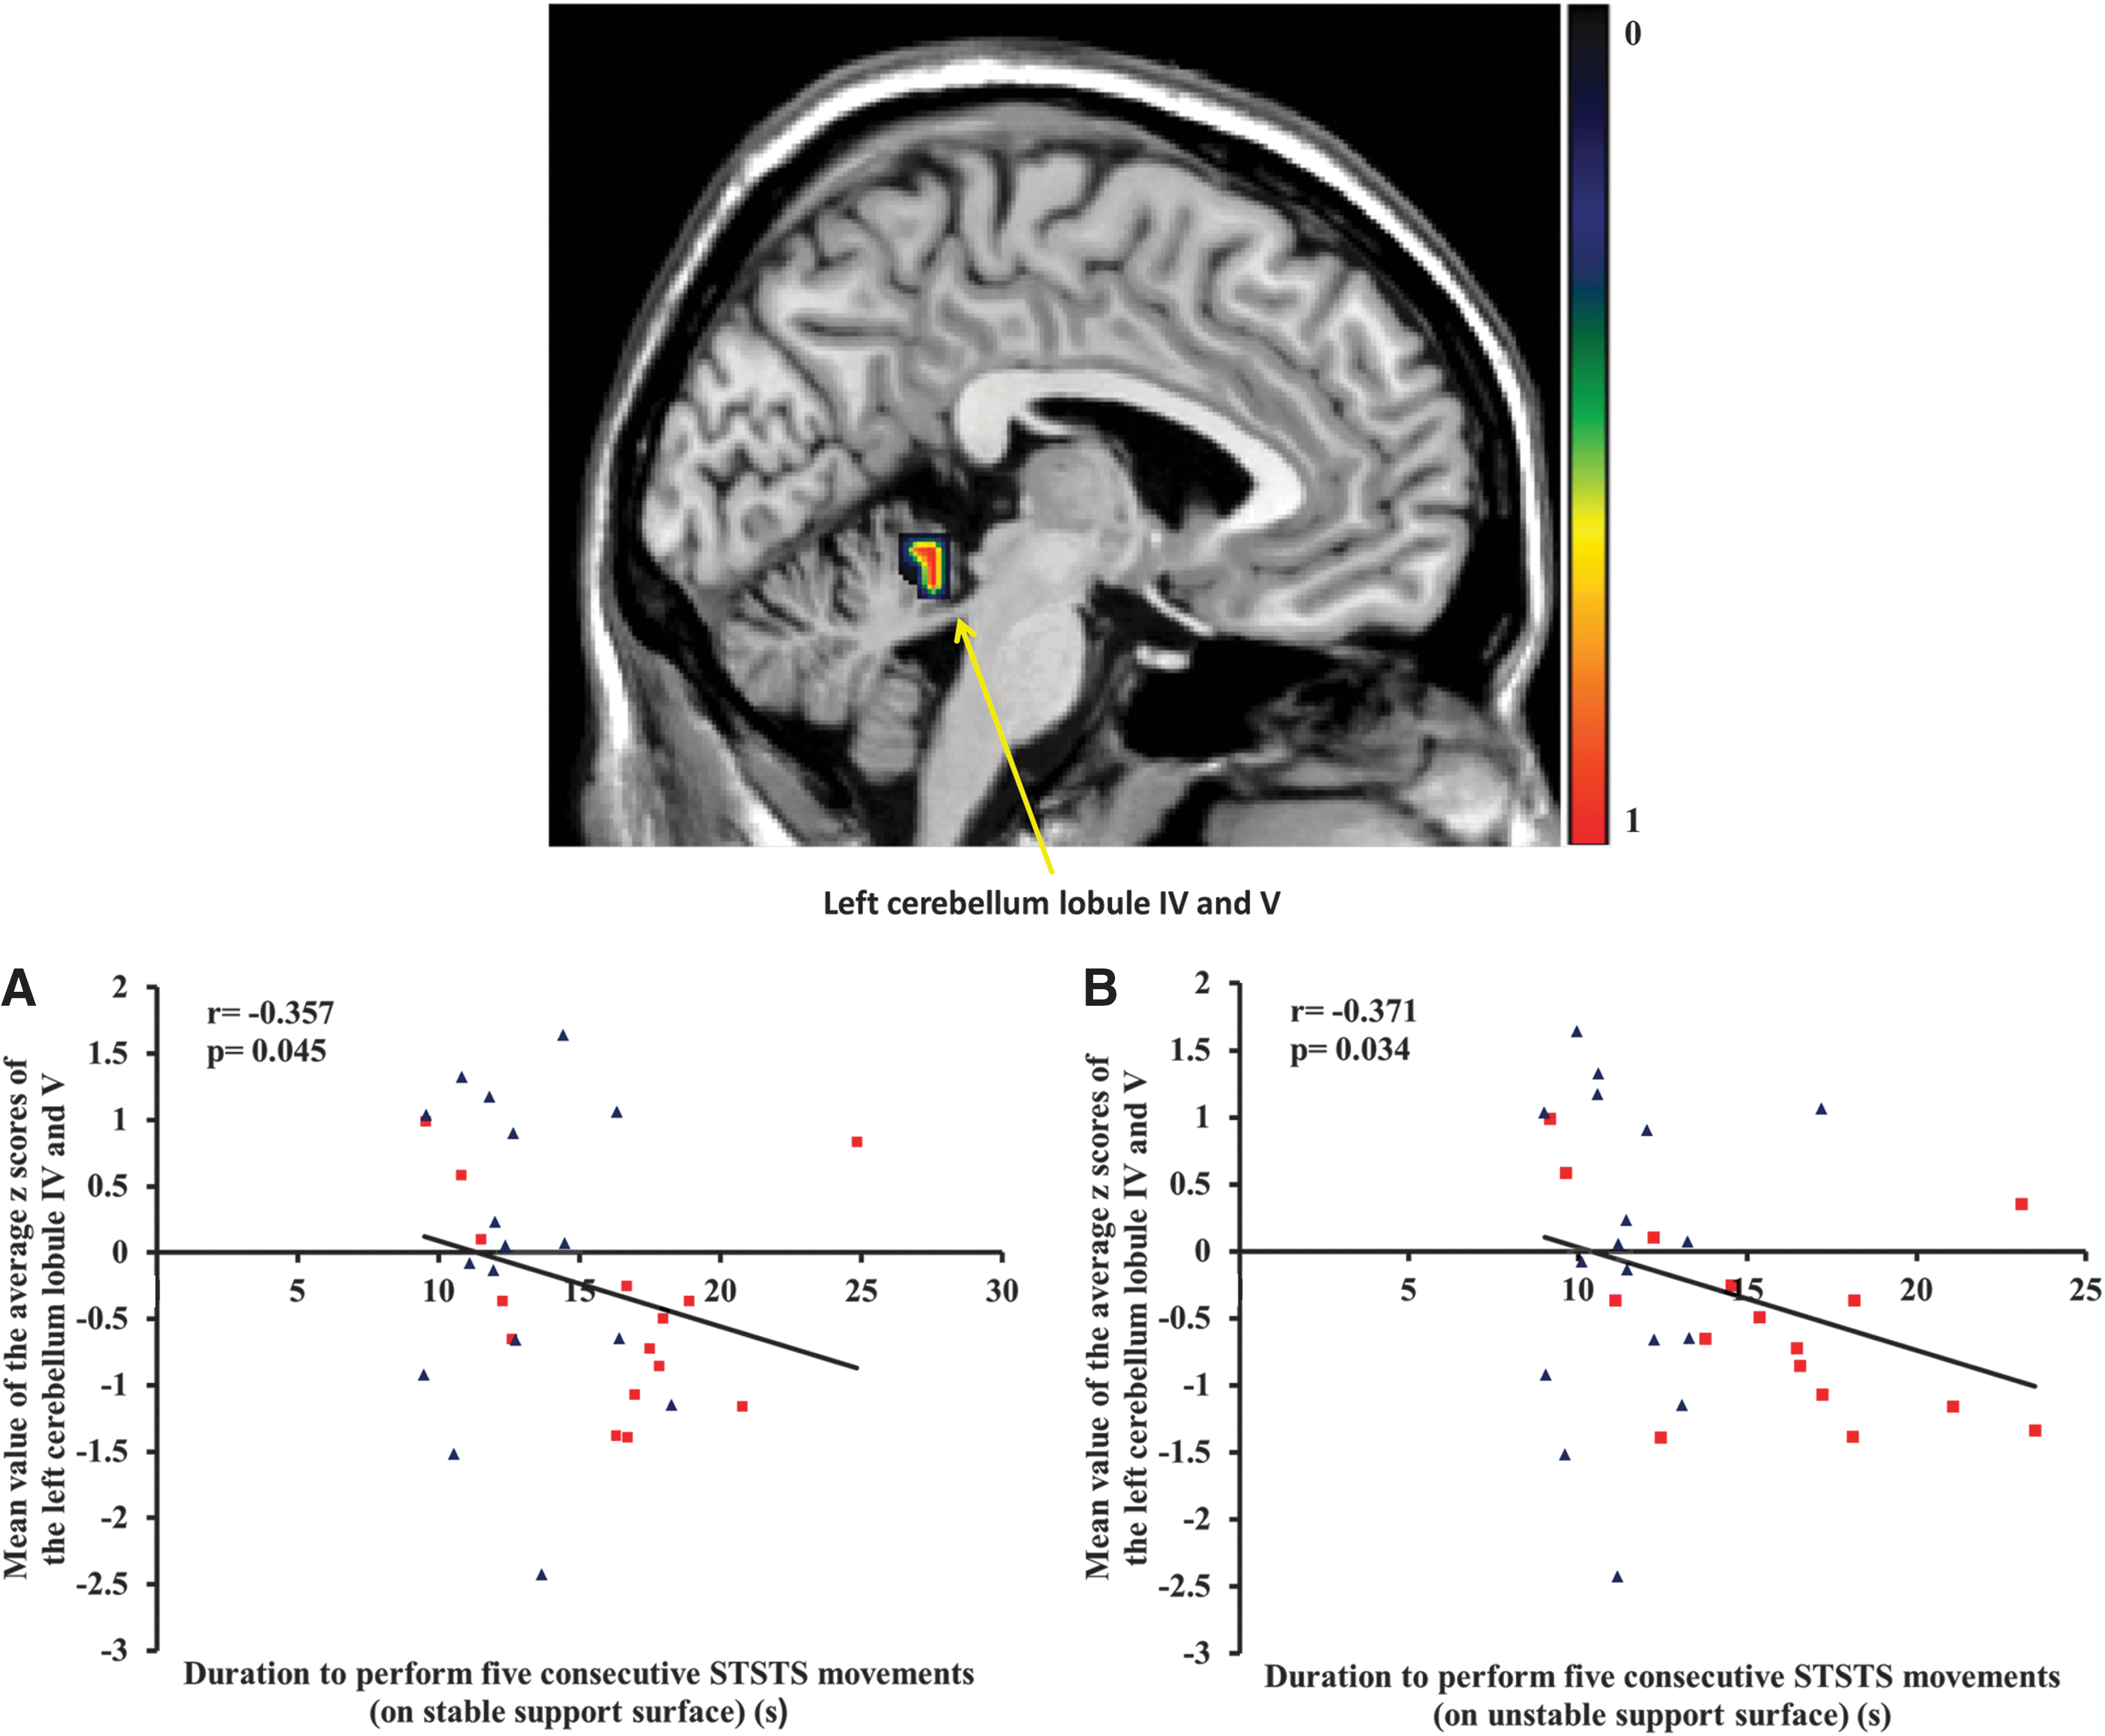
Representation of decreased functional connectivity of lobule IV and V of the left cerebellum in individuals with NSLBP compared to healthy controls.
Discussion
Individuals with NSLBP needed significantly more time to perform five consecutive STSTS movements compared to healthy controls. In addition, both independent component analysis and functional connectivity density mapping of the sensorimotor network revealed a decreased functional connectivity at rest of brain areas related to the integration of sensory and/or motor information in individuals with NSLBP. The functional connectivity at rest of the left precentral gyrus and lobule IV and V of the left cerebellum was associated with a longer duration of the STSTS task in both individuals with NSLBP and healthy controls. To the authors' best knowledge, this is the first study showing this association.
STSTS task
The finding that individuals with NSLBP needed significantly more time to perform the STSTS task compared to healthy controls is in accordance with a previous study in individuals with a milder level of NSLBP (Claeys et al., 2012). The STSTS task requires the integration of both sensory and motor signals for optimal pelvic and lumbosacral control (Hall et al., 2010). Because of the decreased reliability of sensory signals from the ankle region on unstable support surface (Kiers et al., 2011), an integrated reweighting of sensory signals is necessary in this condition. This reweighting requires cortical and subcortical processing, which is demonstrated by the association between the microstructural integrity of a sensorimotor white matter pathway and the proprioceptive reweighting capacity for postural control in individuals with NSLBP (Pijnenburg et al., 2014). Therefore, the unstable condition is considered to represent a more complex sensorimotor task compared to the stable condition. In the current study, the functional connectivity of both the left precentral gyrus and lobule IV and V of the left cerebellum was associated with the performance of the STSTS task on unstable support surface, indicating increased neural processing in this condition. Although considerable research has been devoted to potential peripheral mechanisms, this was the very first study shedding light on the central (neural) mechanisms of this decreased STSTS performance.
In individuals with NSLBP, previous RS-fMRI research mainly focused on pain-related brain reorganization (Baliki et al., 2008, 2012; Tagliazucchi et al., 2010). Findings revealed that the pain-related resting-state reorganization includes several areas of the sensorimotor network (Mantini et al., 2007) such as the middle frontal gyrus (Tagliazucchi et al., 2010), left postcentral gyrus (Baliki et al., 2012), and the cerebellum (Moulton et al., 2010). However, in the current study, no significant correlation between the performance of the STSTS task on a stable support surface and pain characteristics in individuals with NLBP was observed. Therefore, the authors assume that the pain factor is less likely the main contributor for the longer duration of the STSTS task.
Independent component analysis of the sensorimotor network
Both increased and decreased levels of functional connectivity at rest of the sensorimotor network were found in this sample of individuals with NSLBP. On the one hand, decreased functional connectivity in the individuals with NSLBP was observed in areas related to the integration of sensory and/or motor signals. More specifically, the left supplementary motor area and lobule IV and V of the left cerebellum are closely associated with sensorimotor control (supplementary motor area: Nachev et al., 2008; Zhang et al., 2012; lobule IV and V of the cerebellum: Manto et al., 2012; Stoodley and Schmahmann, 2009; Stoodley et al., 2012). Furthermore, these areas are observed to play an important role in postural control (Ferraye et al., 2014; Morton and Bastian, 2004; Zwergal et al., 2012), which is required for an optimal STSTS performance (Lord et al., 2002). In addition, the primary motor cortex, which is located on the precentral gyrus, is responsible for voluntary movements. Taken together, the observed decreased functional connectivity of these areas could possibly be linked to sensorimotor deficits in the NSLBP population, such as the impaired proprioceptive weighting capacity for postural control (Brumagne et al., 2008; Claeys et al., 2011) and/or the decreased performance of the STSTS task. The association between this decreased performance of the STSTS task and the functional connectivity of the sensorimotor network has been observed for the first time in this study.
The duration to perform five consecutive STSTS movements was significantly correlated with the functional connectivity of the left precentral gyrus and the cerebellum lobule IV and V in both individuals with NSLBP and healthy controls. A lower degree of functional connectivity of these regions at rest was associated with a longer duration of the STSTS task, which is defined as a lower sensorimotor performance. This preliminary result suggests that areas involved in the integration of sensory information and the processing/generation of motor signals might play an important role in the performance of this sensorimotor dynamic task. In addition, all regions of decreased functional connectivity in individuals with NSLBP were left lateralized, which confirms the more prominent association between the left hemisphere and motor actions, irrespective of the body side involved (Caeyenberghs and Leemans, 2014; Serrien et al., 2006).
On the other hand, individuals with NSLBP showed increased connectivity in the right superior and the right middle frontal gyrus, areas that are activated during balance tasks (Jahn et al., 2004; Karim et al., 2014). More specifically, the superior frontal gyrus is suggested to guide movements based on visual feedback (Karim et al., 2014), while the middle frontal gyrus is suggested to have its role in inhibition and error detection (Karim et al., 2014; Picton et al., 2007; Rodrigo et al., 2013; Vollm et al., 2006). Increased functional connectivity of these areas in the individuals with NSLBP compared to healthy controls could be explained by the higher reliance on visual input (Mok et al., 2004) and the greater need for error detection because of the impaired postural control in this population (Brumagne et al., 2008; Claeys et al., 2011). In addition, the middle frontal gyrus is observed to show increased coactivation at rest with regions of the default mode network in individuals with NSLBP (Tagliazucchi et al., 2010). The superior frontal gyrus and the vermis are observed to be activated during imagined standing (Jahn et al., 2004). Higher functional connectivity of these areas can indirectly refer to or may be a consequence of the need for increased cognitive attention for sensorimotor control in individuals with NSLBP.
Functional connectivity density mapping of the sensorimotor network
A decreased long-range functional connectivity density of the left supplementary motor area was observed in individuals with NSLBP. Disturbed communication between this area, which has an important role in sensorimotor and postural control (Ferraye et al., 2014; Nachev et al., 2008; Zhang et al., 2012; Zwergal et al., 2012), and other brain regions could have impaired the integration of sensory and motor signals. However, no significant correlation between the decreased long-range functional connectivity and the performance of the STSTS task was found.
The postcentral gyrus is the location of the primary somatosensory cortex, which has a major role in the integration of somatosensory signals for sensorimotor control (Goble et al., 2012). Previous research already showed decreases in gray matter density and functional reorganization in this area in individuals with NSLBP (Baliki et al., 2012; Henry et al., 2011; Kong et al., 2013). The degree of reorganization of the primary somatosensory cortex seemed to be related to pain intensity (Flor et al., 1997). However, it was suggested that also the postural and tactile impairments in specific populations (Baliki et al., 2012) or the decreased use of the painful region itself (Gustin et al., 2012) may affect the organization of the primary somatosensory cortex. In contrast, no significant correlation between the functional connectivity density of the left postcentral gyrus and the STSTS task, which can be assumed as a dynamic postural task (Lord et al., 2002), was found in this study.
Limitations
The STSTS task on stable and unstable support surface was only performed once. To increase reliability, task repetitions are usually recommended. However, the authors were interested in the spontaneous performance of this task as it is performed in daily living, which supports the choice of a single repetition of this task. In addition, the inclusion of more repetitions will probably also evaluate the learning capacity of the individual, which was not the research question of the current study.
This was the first study that investigated potential alterations in the sensorimotor network in individuals with NSLBP on a multivariate level and the subsequent association with the STSTS movement. Because of the exploratory character of this study, no corrections for multiple comparisons were performed. In addition, because the authors did not expect large brain lesions in this NSLBP sample, relatively small results are already of important interest.
Clinical relevance
The STSTS task has good test–retest reliability (Simmonds et al., 1998; Smeets et al., 2006) and can be easily used in clinical practice to evaluate the functionality of individuals with NSLBP over time (Andersson et al., 2010; Smeets et al., 2006). Moreover, functional connectivity is a method to describe functional integration between regions in the brain by finding statistical patterns of their interaction. In this study, the integration of sensorimotor brain regions at rest was observed. The results of the functional connectivity density analysis demonstrated the importance of the integration of sensory and motor information for this sensorimotor STSTS task. More research into this domain is warranted, since understanding of the underlying central mechanisms of NSLBP is crucial to develop more effective treatments, especially since the causality between brain functional connectivity parameters and sensorimotor control is still unknown.
Conclusion
The results of the current study demonstrated significant reorganization of the sensorimotor resting-state network in individuals with NSLBP compared to healthy controls. The NSLBP sample showed decreased functional connectivity (both from independent component analysis and functional connectivity density mapping) in areas related to the integration and processing of sensory and motor signals for adequate movement. This decreased functional connectivity of the sensorimotor network was associated with the performance of a dynamic sensorimotor task, more specifically, a longer duration of five STSTS movements.
Footnotes
Acknowledgments
This work was supported by the Agency for Innovation by Science and Technology–Flanders (IWT) (PhD fellowship Madelon Pijnenburg) (
Author Disclosure Statement
No competing financial interests exist.