
Abstract
Major depressive disorder (MDD) is a significant contributor to lifetime disability and frequently emerges in adolescence, yet little is known about the neural mechanisms of MDD in adolescents. Dynamic causal modeling (DCM) analysis is an innovative tool that can shed light on neural network abnormalities. A DCM analysis was conducted to test several frontolimbic effective connectivity models in 27 adolescents with MDD and 21 healthy adolescents. The best neural model for each person was identified using Bayesian model selection. The findings revealed that the two adolescent groups fit similar optimal neural models. The best across-groups model was then used to infer upon both within-group and between-group tests of intrinsic and modulation parameters of the network connections. First, for model validation, within-group tests revealed robust evidence for bottom-up connectivity, but less evidence for strong top-down connectivity in both groups. Second, we tested for differences between groups on the validated parameters of the best model. This revealed that adolescents with MDD had significantly weaker bottom-up connectivity in one pathway, from amygdala to sgACC (p=0.008), than healthy controls. This study provides the first examination of effective connectivity using DCM within neural circuitry implicated in emotion processing in adolescents with MDD. These findings aid in advancing understanding the neurobiology of early-onset MDD during adolescence and have implications for future research investigating how effective connectivity changes across contexts, with development, over the course of the disease, and after intervention.
Introduction
Major depressive disorder (MDD) is a leading world contributor to lifetime disability (Ustün et al., 2004) and frequently emerges during adolescence (Kessler et al., 2005). Because early interventions for mental illness could impact lifetime trajectories, a deeper understanding of the neural mechanisms of MDD during adolescence is sorely needed. The adolescent period is notable for significant ongoing brain maturation (Giedd et al., 1999; Raznahan et al., 2011); therefore, the brain mechanisms underlying MDD in adolescents may differ from those in adults. Advances in understanding mechanisms of adolescent MDD will have important implications for early intervention.
Current theory holds that MDD involves a complex network of frontal and limbic brain regions that subserve emotion expression and regulation (Drevets, 1999; Mayberg, 1997; Phillips et al., 2003a,b). Functional magnetic resonance imaging (fMRI) can be used to examine functional connectivity within neural networks either during rest (Biswal et al., 1995) or a task (Friston et al., 1997). Task fMRI can also be used to model effective connectivity or the influence that one neural system has on another (Friston, 2011). An innovative method for examining effective connectivity using task fMRI is dynamic causal modeling (DCM) (Friston et al., 2003). DCM aims to estimate, and make inferences about, the coupling among brain areas and how that coupling is influenced by changes in experimental context (Friston et al., 2003).
An advantage of DCM over some other methods such as psychophysiological interaction (Friston et al., 1997) is the ability to test connectivity direction (region A exerts influence on region B, or vice versa, or both) while avoiding some of the limitations of other methods such as Granger causality (Granger, 1969; Friston et al., 2011). DCM begins with a simple neural model of brain activity during a task that is used to derive directional connectivity parameters: intrinsic connectivity (a measurement of synchrony between two brain regions in the baseline state) and modulation (the extent to which the task increases or decreases this connectivity). DCM compares several hypothesized neural models and identifies the optimal neural model for the dataset in hand, that is, the model that best fits the data (Friston, 2011). Thus, DCM offers several types of information that can be used to supplement other types of connectivity analyses: direction of neural connections, influence of external stimuli, and model testing.
Although numerous studies have examined resting-state functional connectivity in adolescents with MDD (Connolly et al., 2013; Cullen et al., 2009, 2014; Gabbay et al., 2013; Pannekoek et al., 2014), no DCM studies in this population have yet been published. However, a few small studies comparing adults with MDD and healthy controls (HCs) have shown promise that DCM will advance understanding of the neurobiological underpinnings of depression. Two studies have reported that adults with MDD fit different optimal neural models than HCs (Desseilles et al., 2011; Goulden et al., 2012).
Several studies that compared effective connectivity within one model selected for the whole group have implicated MDD-related abnormalities in numerous frontolimbic connections involving the amygdala, anterior cingulate cortex (ACC) (subgenual and supragenual regions), and prefrontal cortex (ventromedial and dorsolateral regions) (Almeida et al., 2009, 2011; Lu et al., 2012; Schlösser et al., 2008). In particular, Almeida et al. found significantly different connection strengths between MDD and HCs for the connection from the amygdala to prefrontal cortex for both hemispheres, but not for the connection from the prefrontal cortex to amygdala. Such a result underlines the ability of DCM to differentiate connectivity directionality.
The goal of this study was to use DCM to examine effective connectivity in MDD and HC adolescents using DCM. Using an fMRI task that elicits negative emotion (Hariri et al., 2002), we examined frontolimbic neural circuitry guided by previous work delineating effective connectivity networks underlying visual and emotional processing of faces comprising supraACC, sgACC, amygdala, inferior occipital gyrus (IOG), and fusiform gyrus (FG) (Dima et al., 2011; Fairhall and Ishai, 2007; Stein et al., 2007).
To expand on previous DCM work in adult MDD, we examined this circuitry in both hemispheres. Taking advantage of DCM capability to select the optimal model between competing model architectures, we delineated eight hypothesized neural models representing iterations of connections among these regions, varying by how the task impacts the connections in the network. Based on past DCM research in adult MDD (Almeida et al., 2011; Goulden et al., 2012; Lu et al., 2012) and on the theory that proneness to psychopathology in adolescents stems from a developmental imbalance between the subcortical limbic and higher-order regulatory cortex (Casey et al., 2008), we predicted that intrinsic connectivity in adolescents with MDD would show stronger connectivity in bottom-up (limbic-to-cortical) connections, but impaired connectivity in top-down (cortical-to-limbic) connections. The first study aim explored whether the best-fitting neural model would be the same for the two groups. We then selected the across-groups best-fitting model.
The second aim examined the across-groups best-fitting model's validity by testing the significance of its intrinsic and modulation values in each group separately. Our third aim tested group differences for the model parameters that were significantly different from zero. Based on previous connectivity findings in adolescent MDD (Cullen et al., 2009, 2010), we predicted that patients would show impaired sgACC intrinsic connectivity. Given the variance in findings and tasks used across previous DCM studies, we viewed our evaluation of group differences for modulation as exploratory. Finally, we explored the potential links between DCM results and depression severity.
Materials and Methods
The study protocol was approved by the University of Minnesota (UMN) Institutional Review Board. Thirty-seven unmedicated adolescents, aged 12–19 years, with MDD were recruited from inpatient and outpatient services at UMN, by referral from community clinics, and through local postings. Twenty-six HCs were recruited to match the MDD group by age and sex. Exclusion criteria for either group included major medical conditions, history of seizure disorder or head trauma, and MRI contraindications (e.g., ferrous metal in the body or claustrophobia). Inclusion in the MDD group required meeting criteria for a current episode of MDD; patients who had taken psychotropic medications in the past 30 days or who had current or past substance use disorders were excluded. Exclusion criteria for the HC group included a current or past diagnosis of any DSM-IV psychiatric diagnosis or history of a first-degree relative with MDD, bipolar disorder, or schizophrenia.
For adolescents aged 17 years and younger, parents provided informed consent and adolescents provided assent. Adolescents aged 18 and 19 years provided their own informed consent. Clinical assessment included separate adolescent and parent interviews using the Kiddie Schedule for Affective Disorders and Schizophrenia, Parent and Lifetime version (Kaufman et al., 1997), and the Children's Depression Rating Scale-Revised (CDRS-R) (Poznanski et al., 1985). Adolescents completed the Beck Depression Inventory-II (BDI-II) (Beck et al., 1996). We measured socioeconomic status with the Hollingshead Index (Hollingshead, 1975). Final diagnosis was determined in a consensus meeting that incorporated information from interviews, rating scales, and, if available, medical records.
Emotion face matching paradigm
All participants completed a 6.5-minute fMRI task (Hariri et al., 2002) during the scan that had two matching conditions: emotion (facial expressions of fear and anger [six images each of gender and emotion]) or neutral objects (geometric shapes). The task included thirteen 24-second counterbalanced blocks (three fixation, five shape, and five emotion). Emotion and shape blocks consisted of six consecutive five-second trials. Fixation blocks (2 sec) were presented at the beginning, after five blocks of randomly assigned shape or face blocks, and at the task's conclusion.
Image acquisition
Brain imaging took place at the UMN Center for Magnetic Resonance Research on a 3 Tesla Siemens TIM Trio scanner (Erlangen, Germany) using a 12-channel radiofrequency head coil. The task, programmed using E-Prime software (
Functional image preprocessing
We used software tools from the FMRIB software library (FSL;
Activation analyses
The primary purpose of the brain activation analyses described here was to enable selection of voxels within our prespecified regions of interest (ROIs) that were activated during the task and therefore were of particular relevance to our questions about emotion circuitry. The procedure for combining these activation results with the ROIs used for DCM is described below.
Activation analyses for each dataset comprised conducting a regression of the task model onto the fMRI data at each voxel of the brain using the FSL FMRI Expert Analysis Tool (FEAT) with two explanatory variables (emotion and shape) and motion parameters from preprocessing as covariates of no interest. We also created and included an additional motion covariate of no interest for volumes where motion (relative to the preceding volume) exceeded 1.5 mm. For each subject, Z statistical images were created for emotion>fixation contrast and the emotion>shape contrast. With the goal of being more inclusive, we chose a liberal threshold of p<0.05 (uncorrected) for these individual analyses.
Although not directly relevant to the DCM analysis, but instead more relevant to understanding the DCM results within a broader context, we also conducted higher-level analyses to test for group differences based on these individual-level activation results using FMRIB's Local Analysis of Mixed Effects (FLAME). The resulting z statistical images were thresholded using clusters determined by Z>2.3 and a (corrected) cluster significance threshold of p=0.05.
Specification of the neural models
We prespecified the family of neural models using the core ROIs previously implicated in emotion processing (supraACC, sgACC, amygdala) (Stein et al., 2007) and in face processing (IOG and FG) (Dima et al., 2011; Fairhall and Ishai, 2007) (Table 1). We created spherical masks (8 mm radius) in the MNI space around the coordinates listed in Table 1 and registered them to each subject's functional data. To ensure that the DCM analysis was focused on brain areas relevant to emotion processing, we only used voxels within these spherical ROIs that were significantly activated during the task using the criteria described above. To do this, the thresholded Z statistical images from the emotion>fixation contrast were binarized to create a mask for each person's activated voxels. We chose the Z statistical images from the emotion>fixation contrast because these were more inclusive than the emotion>shape contrast and because the latter resulted in too many subjects with zero activated voxels in at least one of the ROIs of the model. Then, each of the spherical ROIs was overlaid onto the masks of significantly activated voxels, yielding the final set of voxels to be used for extracting the time series for that ROI. Finally, we extracted the mean BOLD signal time series for that final set of voxels for each ROI and these were used as input to the DCM. DCM requires each subject to have time series information for all regions present in a model; when a participant had one or more ROIs with no voxels showing significant activation within a hemisphere, the hemisphere's dataset was excluded from the analysis. The left hemisphere analysis included 27 MDD and 21 HCs, and the right hemisphere analysis included 26 MDD and 21 HCs.
Central Locations of Regions of Interest
MNI, Montreal Neurological Institute; ROI, region of interest; supraACC, supragenual anterior cingulate cortex; sgACC, subgenual anterior cingulate cortex; IOG, inferior occipital gyrus; FG, fusiform gyrus.
DCM of effective connectivity
DCM was employed for each model within the family of eight neural models (as defined in Fig. 1) using Matlab tools, including SPM8 (a Matlab neuroimaging toolbox) and Matlab R2013a (
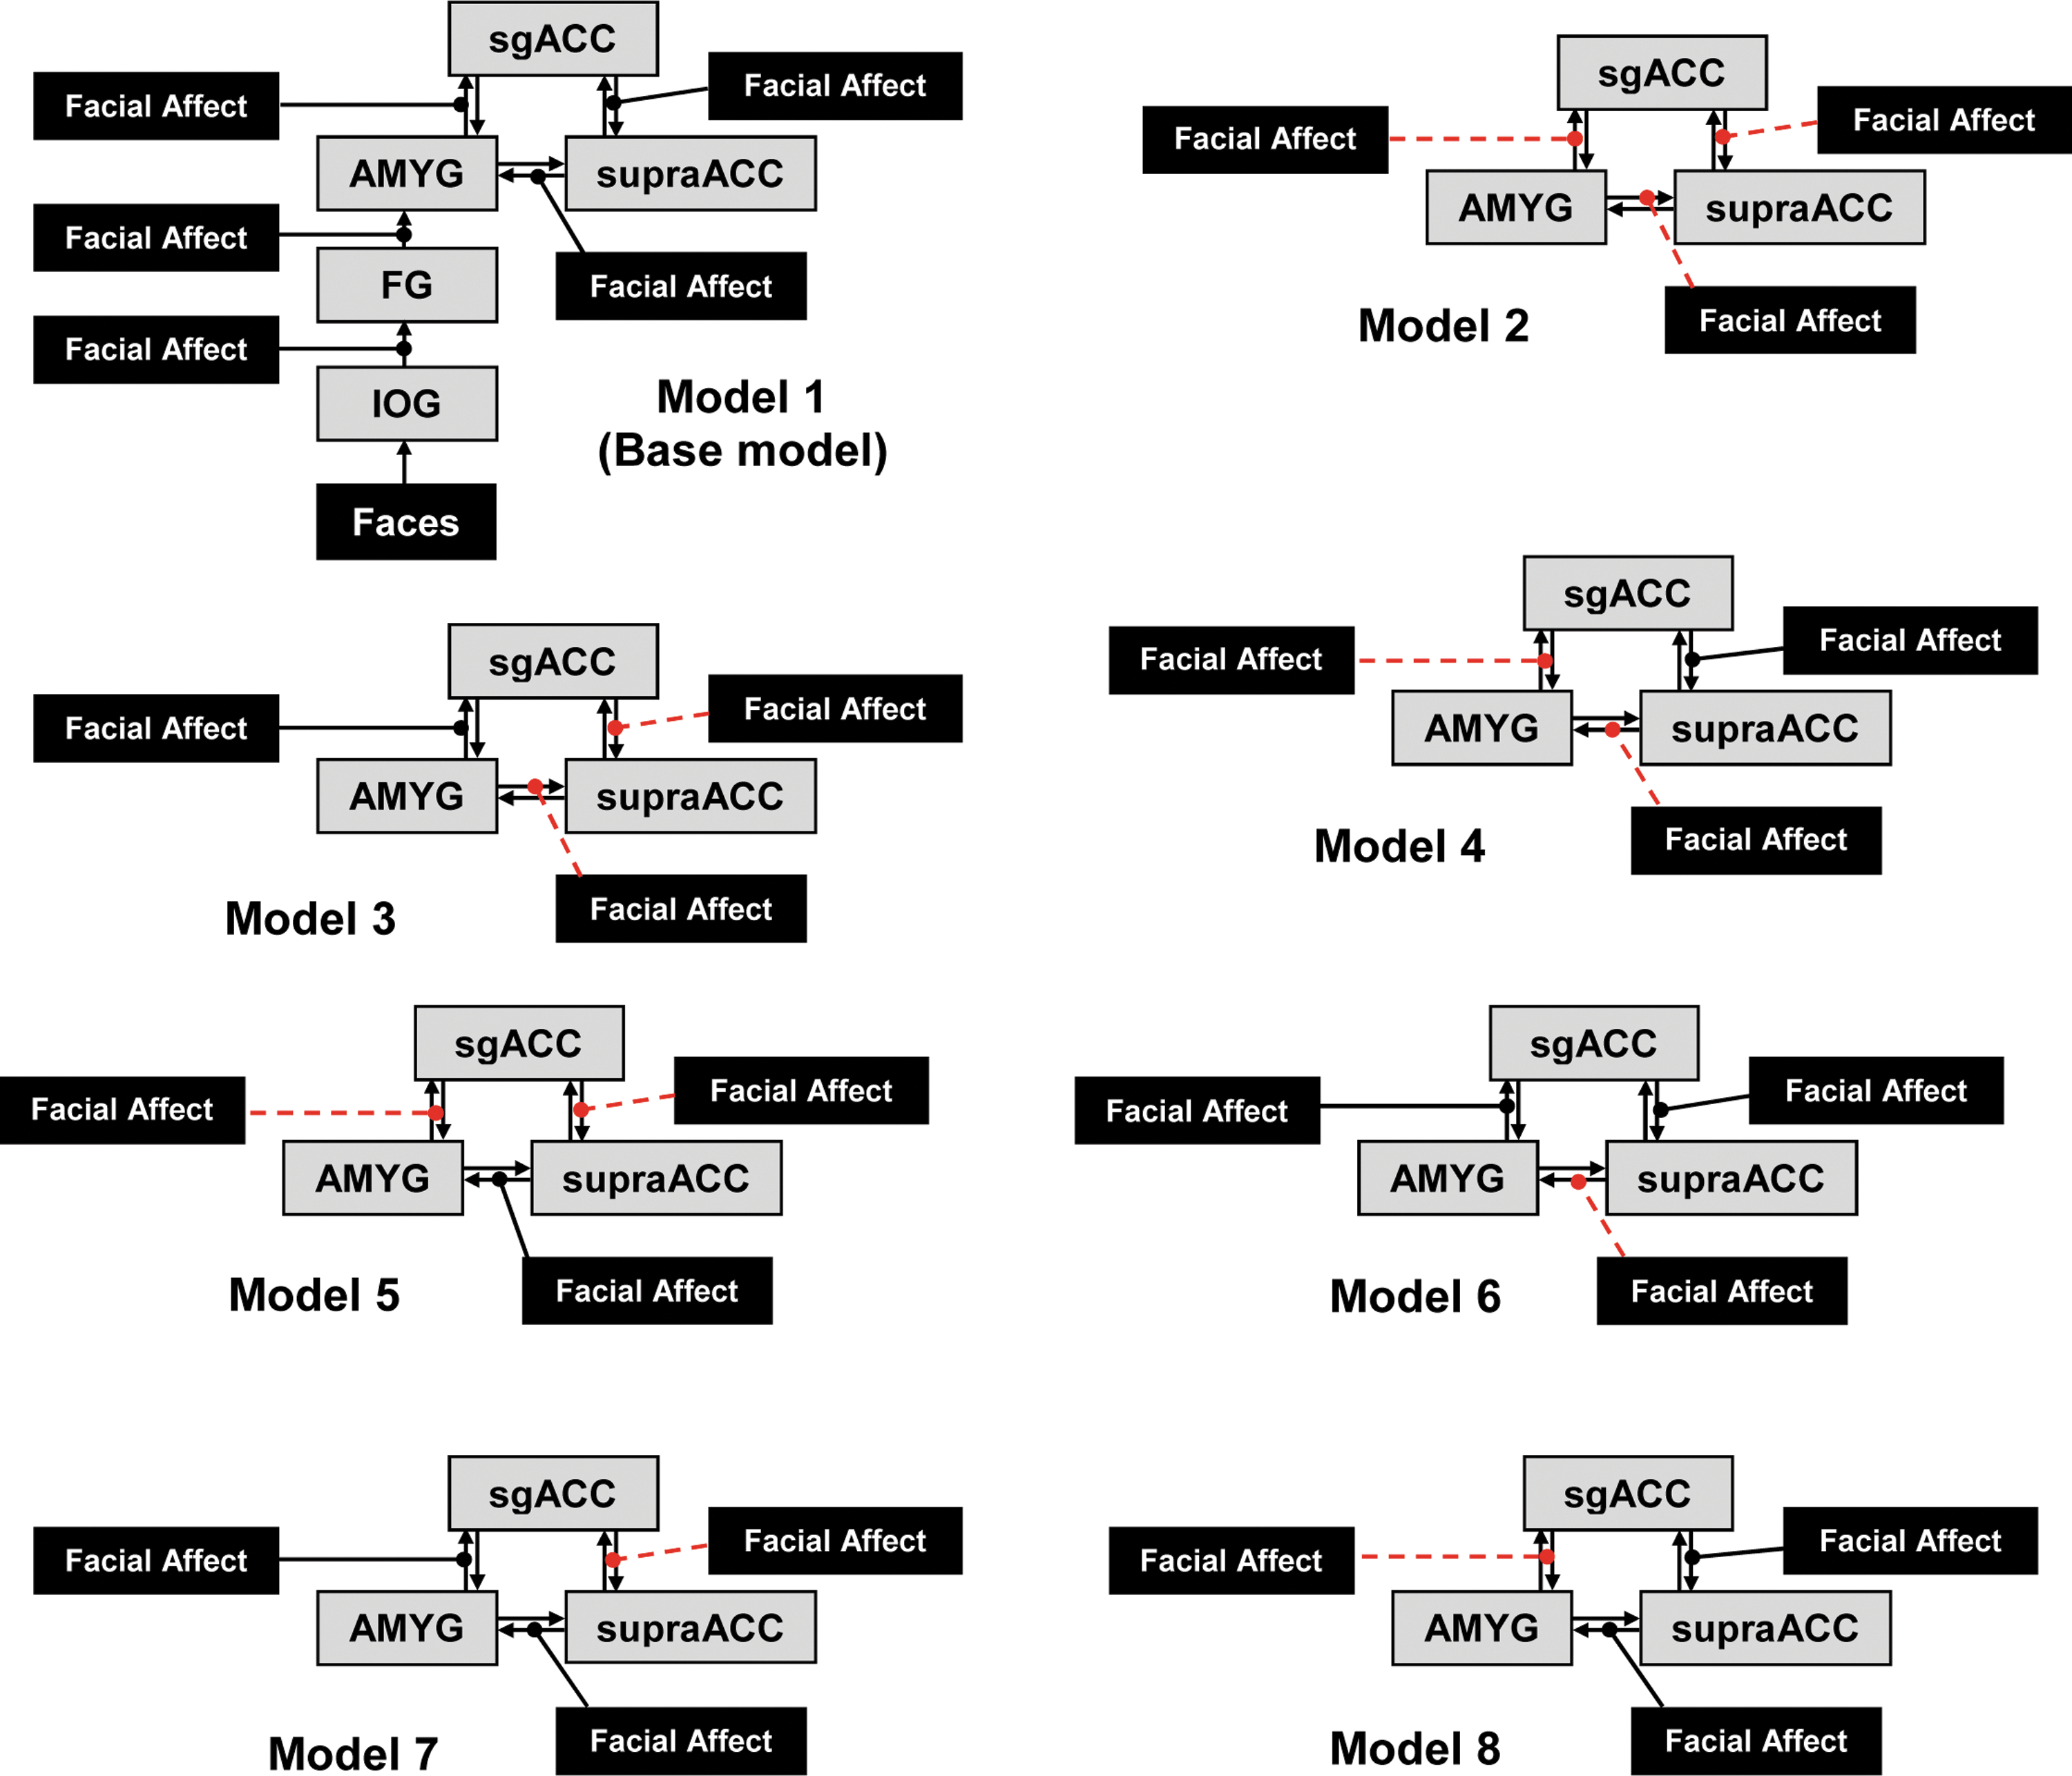
Schematic for each of the eight models tested on each hemisphere in the current study. Facial affect squares denote modulatory input; gray squares represent the brain regions involved in the networks; arrows between regions represent intrinsic connectivity. Modulation is denoted by lines with circled end-points; dashed lines with circled end-points denote bidirectional modulation. Models 2 through 8 include the IOG and FG connectivity as in Model 1; red lines denote model differences from Model 1. IOG, inferior occipital gyrus; FG, fusiform gyrus; AMYG, amygdala; sgACC, subgenual anterior cingulate cortex; supraACC, supragenual ACC. Color images available online at
Aim 1
Group Bayes factors for each model were computed as the product across individuals of their model-specific Bayes factors. We identified the within-group best-fitting model as the model that had the largest group Bayes factor within each of the MDD and HC groups separately. We then identified the across-groups best-fitting model as the model that was the most prevalent best-fitting model across all participants in both groups.
Aim 2
We tested whether intrinsic and modulation parameters in the across-groups best-fitting model were different from zero for each group separately using one-sample t-tests. Bonferroni corrections for multiple comparisons were conducted by comparing each uncorrected p-value to 0.05 divided by the number of parameters per class of comparisons (left intrinsic, left modulation, right intrinsic, right modulatory): 0.05/8=0.00625.
Aim 3
We tested the across-groups best-fitting model for significant differences in network parameters between groups using independent sample t-tests. To limit the number of comparisons, we only tested parameters that had been significantly different from zero in the one-sample tests, again using a Bonferroni approach to correct for the number of tests per family of connections. Finally, for any parameters that showed a group difference, we conducted exploratory correlation analyses with depression severity as measured by the BDI-II and CDRS-R (MDD group only).
Results
Participant characteristics
Baseline characteristics are summarized in Table 2. There were no significant differences between groups with respect to age, IQ, or SES. Groups differed significantly on depression severity measures. MDD was the primary diagnosis for all participants in the MDD group. Comorbid diagnoses included generalized anxiety disorder (N=6), panic disorder (N=1), social phobia (N=4), obsessive compulsive disorder (N=1), attention deficit hyperactivity disorder (N=2), and oppositional defiant disorder (N=1).
Baseline Demographic and Clinical Characteristics by Group
p-Values obtained by independent samples t-test.
p-Values obtained by Fisher's exact test.
MDD, major depressive disorder; IQ, intelligence quotient as measured by the Wechsler Abbreviated Intelligence Index; SES, socioeconomic status; BDI, Beck Depression Inventory II; CDRS, children's depression rating scale.
Brain activation in response to the task
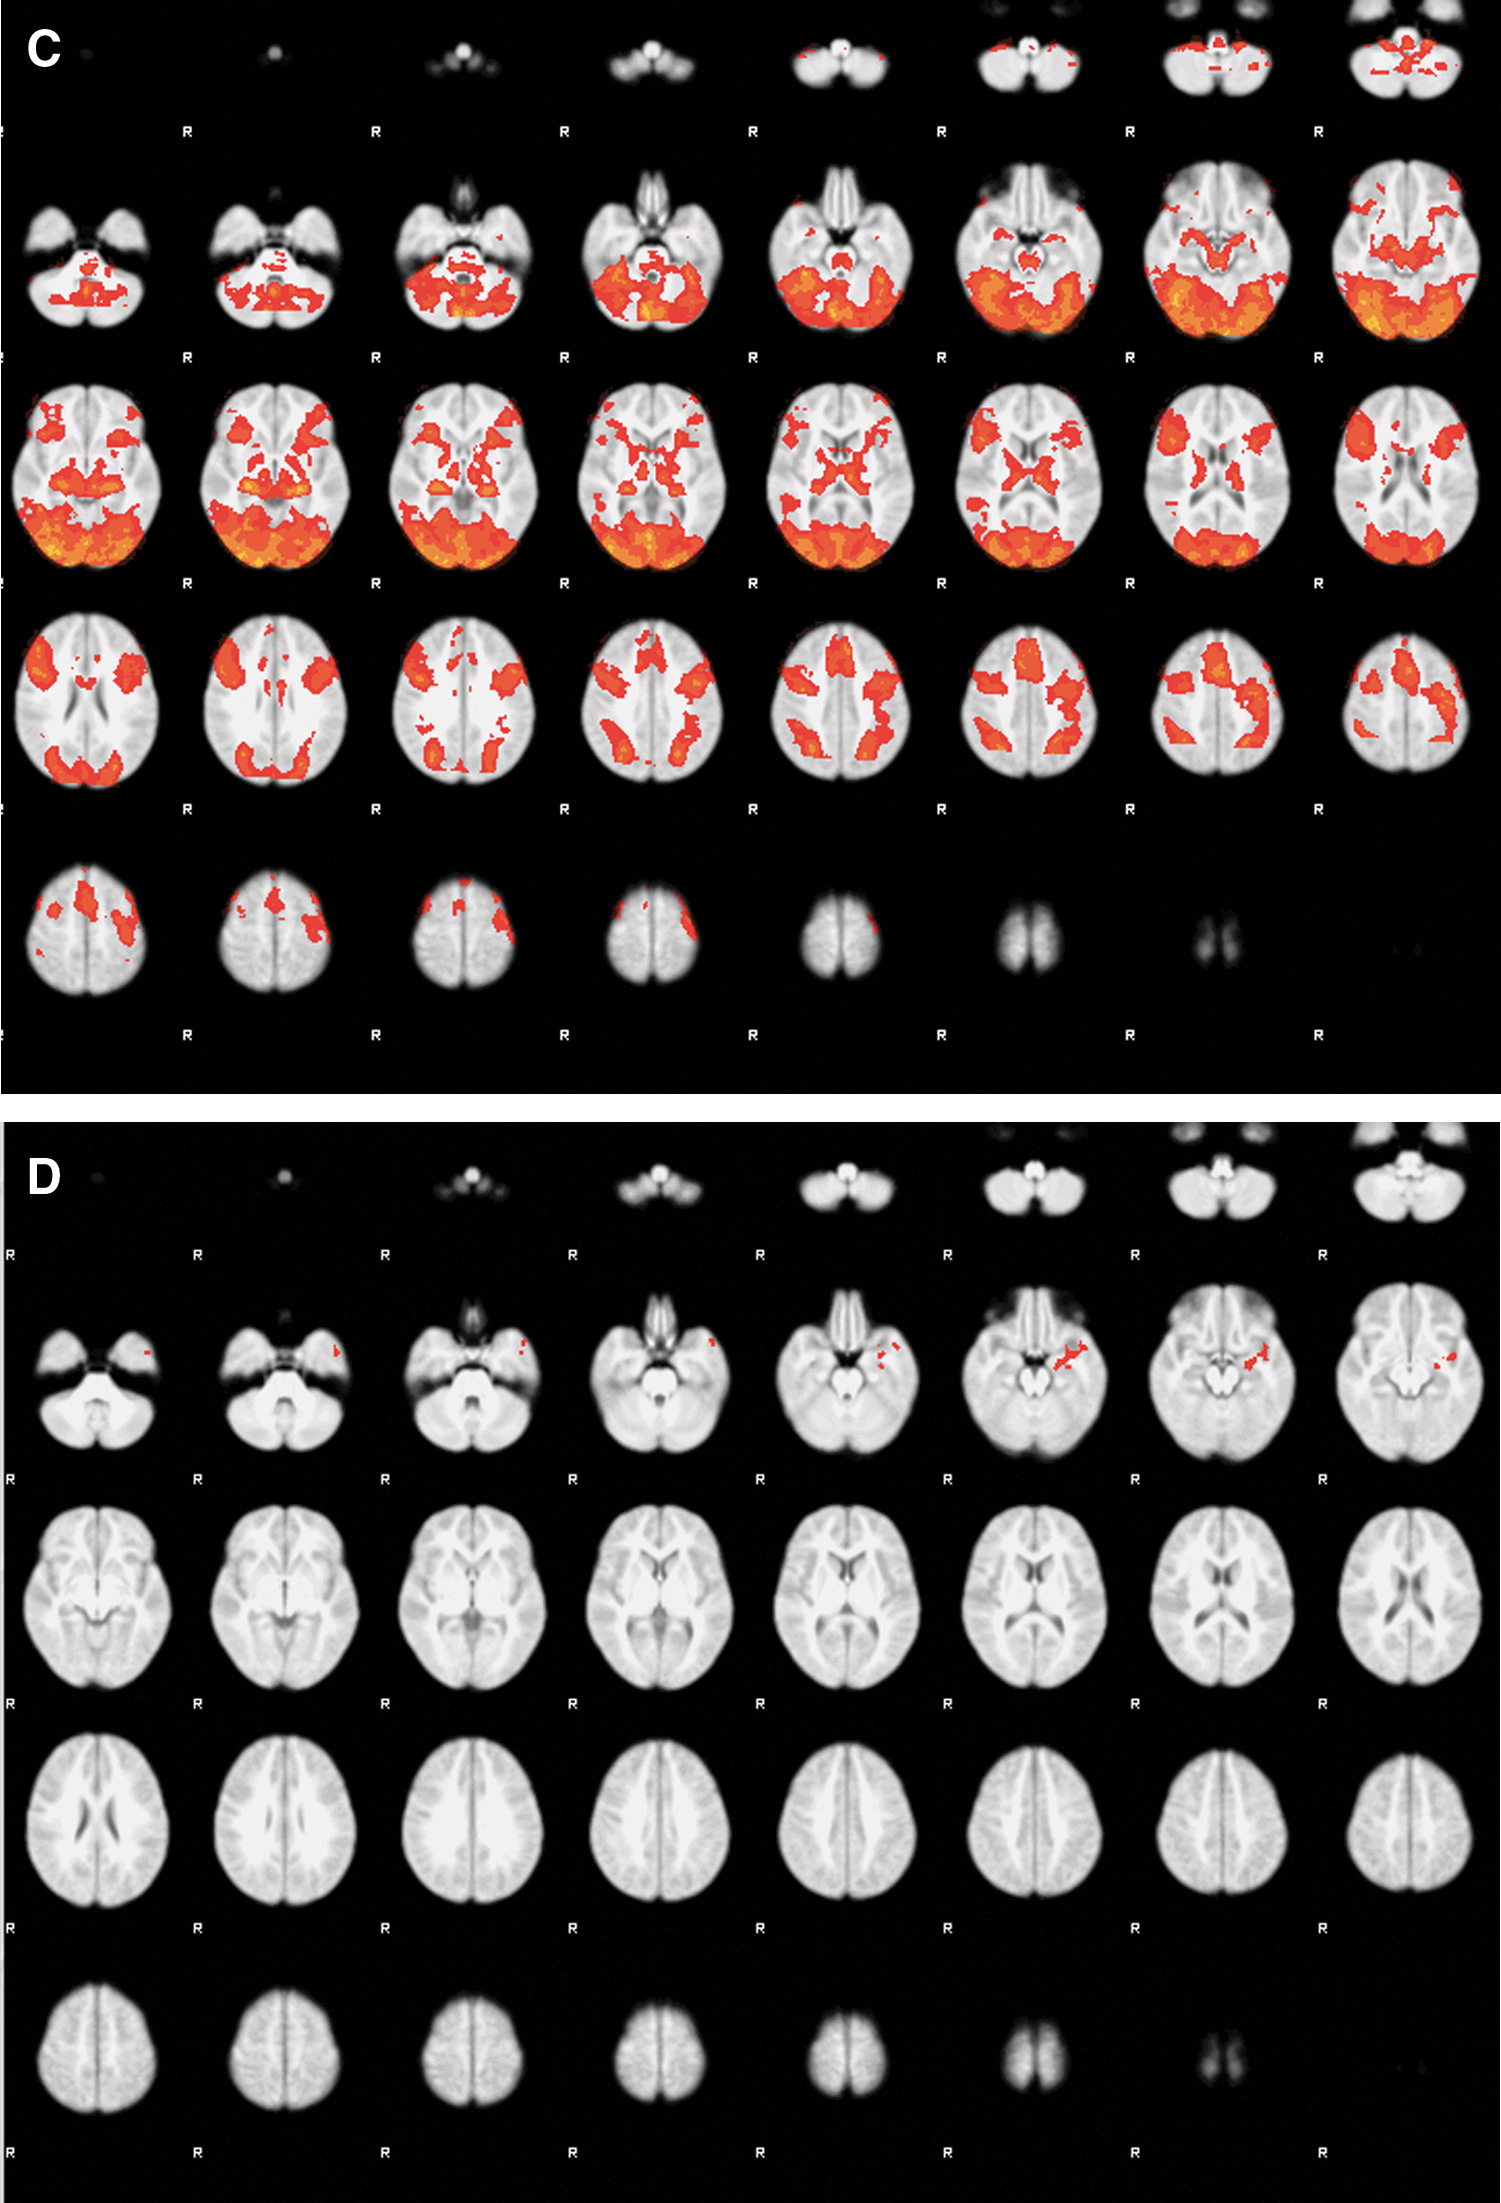
Brain activation in response to the emotion task for the contrast emotion>fixation for all participants is shown in Figure 2 (A, whole sample; B, MDD group mean; C, Control group mean; D, group differences [MDD>HC]). The MDD group showed greater activation in a cluster involving the left amygdala, hippocampus, parahippocampus, and temporal pole. There were no significant clusters for the HC>MDD contrast. These results are consistent with results from this sample that were previously published, showing that using an ROI approach to examine amygdala activation, the MDD group had greater activation in the emotion>fixation contrast than HCs (Klimes-Dougan et al., 2014).
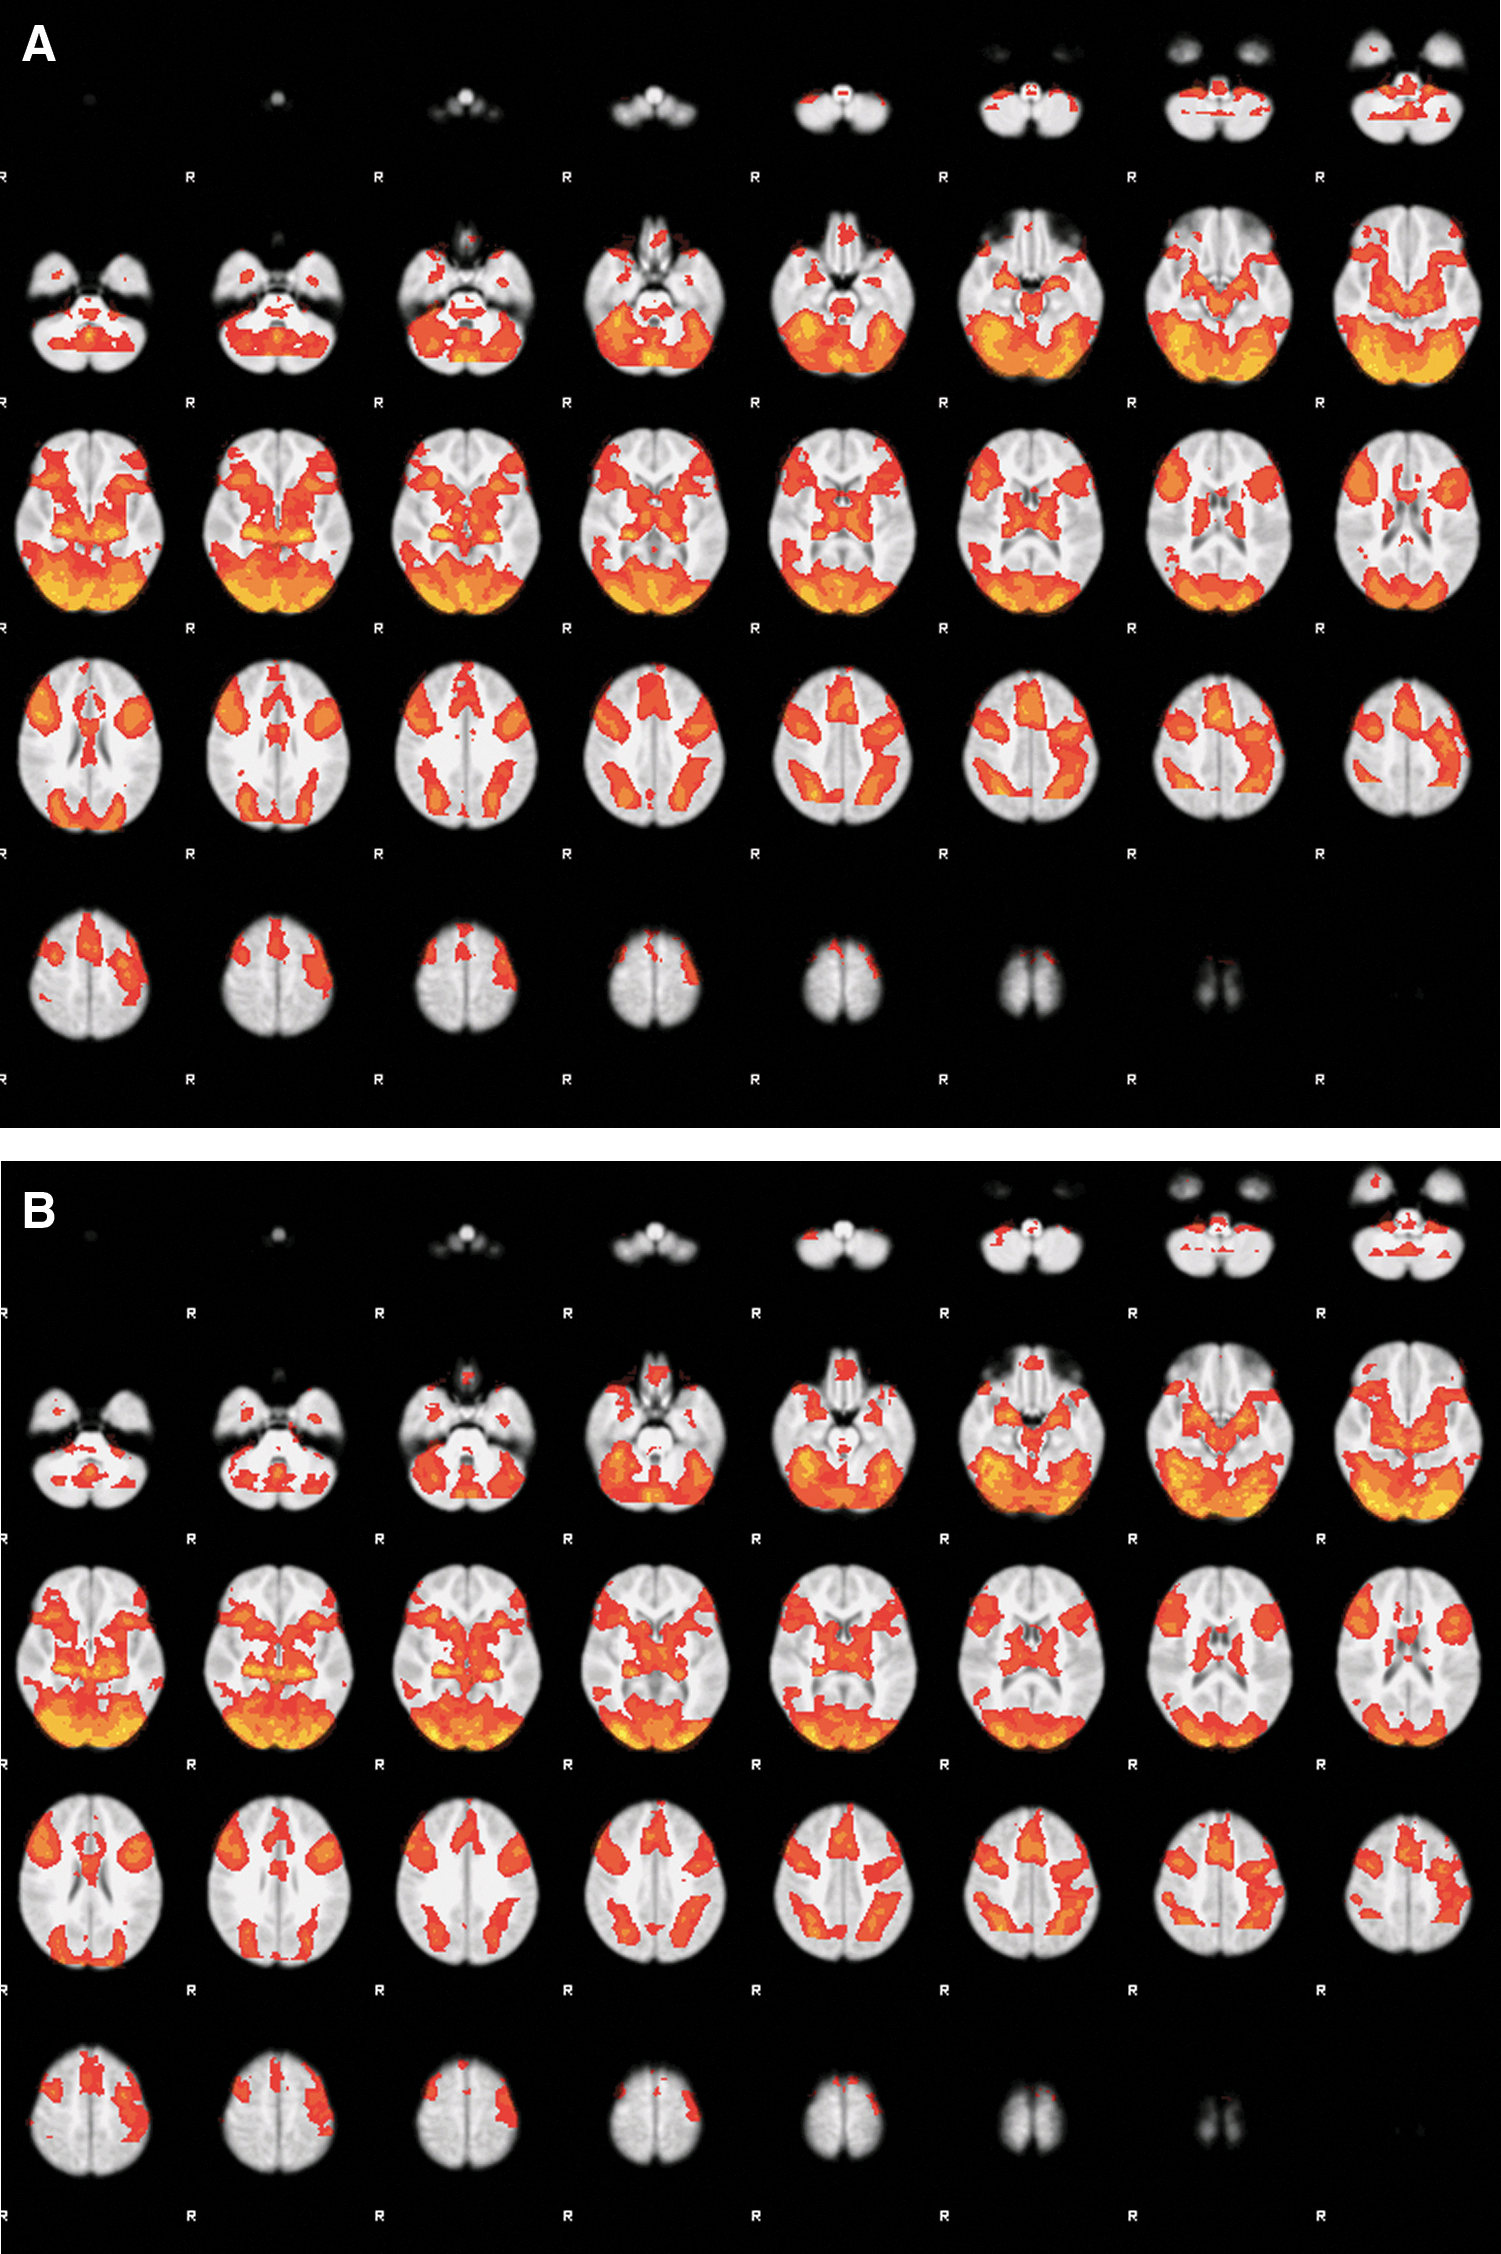
Group level activation map for the matching fMRI task.
Aim 1. Identifying the best-fit models
The histograms of the best-fitting model are shown in Figure 3, separately for each hemisphere and group; each adolescent contributes one best-fitting model to each hemisphere's graph for his/her group. Model 2 was preferred over other models in both hemispheres for HCs, whereas Models 2 and 5 were equally preferred for both hemispheres in patients. Since Model 2 was at least one of the top models in both groups in both hemispheres, we selected it as the across-groups best-fitting model for further analyses.
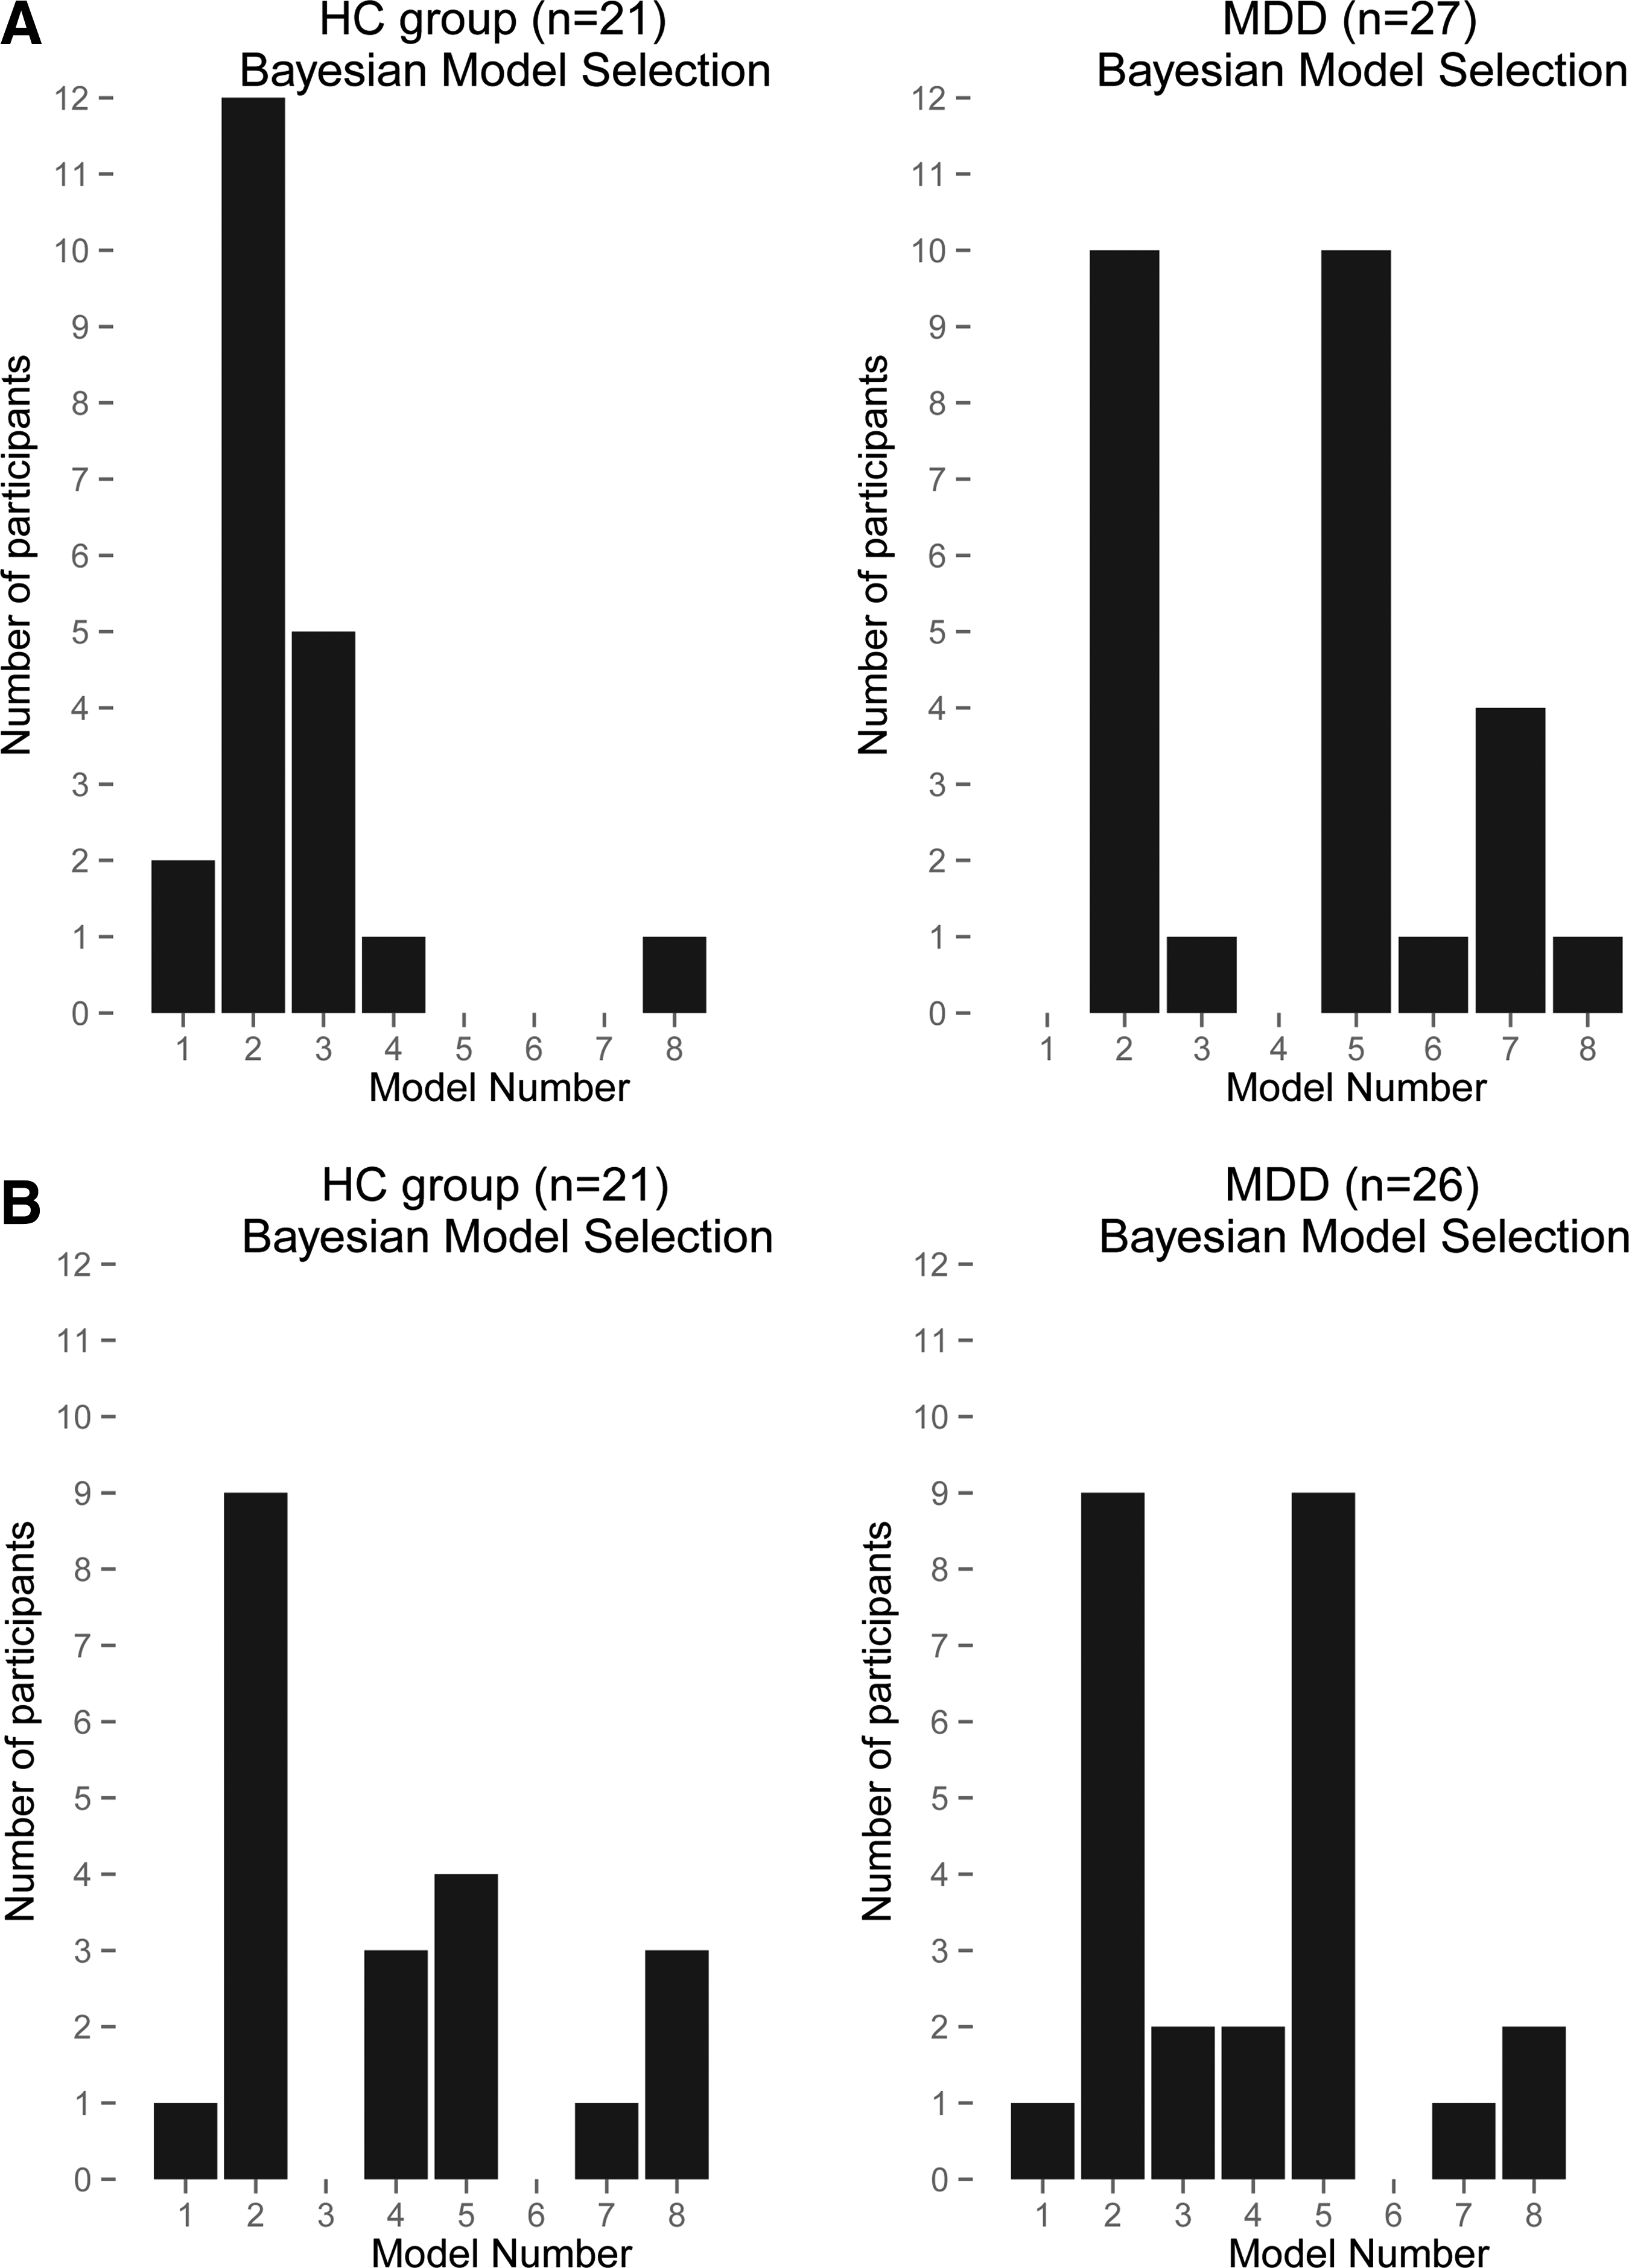
Bayesian model selection: vertical bars represent the number of participants for whom each model (shown on the horizontal axis) was the best-fitting model. Results for the left hemisphere
Aim 2. Within-group tests for the best-fitting across-groups model
We tested the parameters of Model 2 (the best-fitting across-groups model) to confirm the model's relevance in each group (Table 3). Figure 4 shows Model 2 and highlights where each group had connectivity levels that were significantly different from zero.
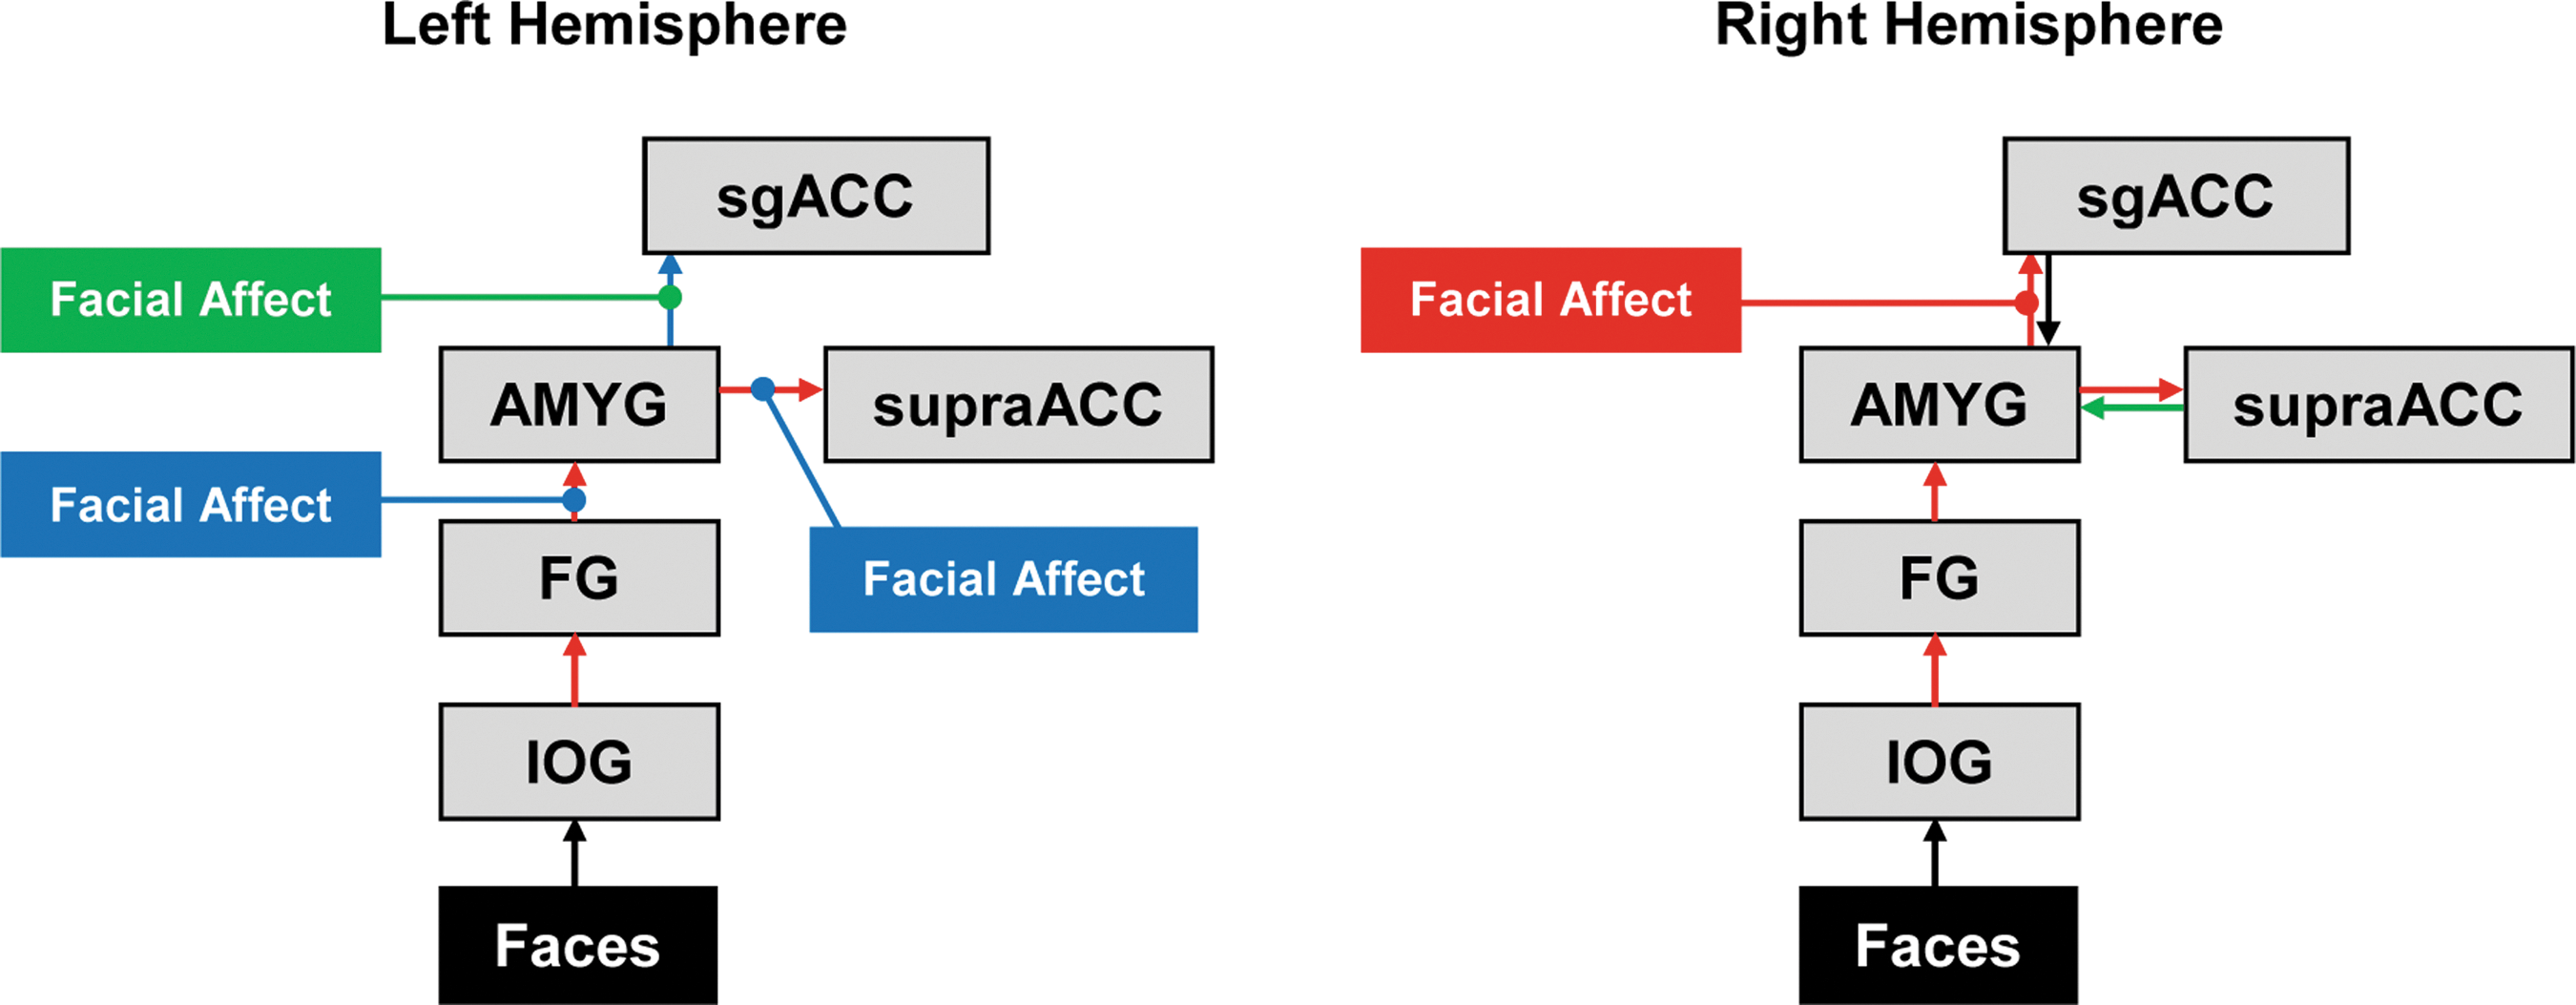
Best-fitting model (Model 2) depicting which DCM parameters (intrinsic connectivity and modulation) were significantly different from zero in the one-sample t-tests of Table 3. Colored boxes and lines signify modulation effects that were significantly different from zero. Colored arrows signify intrinsic connectivity values that were significantly different from zero. Green boxes, lines, and arrows indicate connections that were significant only for the MDD group; blue boxes, lines, and arrows indicate connections that were significant only for HCs; red boxes, lines, and arrows indicate connections that were significant for both MDD and HCs. DCM, dynamic causal modeling. Color images available online at
Left and Right Hemisphere Mean Intrinsic and Modulation Parameter Estimates, Standard Errors, and One-Sample t-Tests for Model 2 by Group for Each of the Network Connections
t-Test null hypothesis: true parameter value is zero for that group in that hemisphere. Bold values denote p < 0.00625 (Bonferroni corrected).
For intrinsic connectivity, across groups, significant connections were all noted to be positive. Intrinsic connections of IOG→FG, FG→amygdala, and amygdala→supraACC were significant within left and right hemispheres in both groups. For modulation, no parameters were significant after Bonferroni correction.
Aim 3. Group differences and correlation results
The only significant group difference was that MDD had lower amygdala→sgACC intrinsic connectivity in the right hemisphere than HCs (T=2.8, p=0.008), which survived our threshold of p<0.0125 (0.05 divided by four significant intrinsic right hemisphere connections tested).
There were no significant correlations between right amygdala→sgACC intrinsic connectivity and either BDI-II or CDRS-R in the MDD group.
Since there was equal preference for Models 2 and 5 in the MDD group, we considered the possibility that there may be clinically relevant subgroups based on the model fit. Thus, we compared demographic and clinical characteristics in MDD patients who fit best with Model 2 and versus those who fit best with Model 5, but failed to find any significant differences. We also tested the subgroup of patients who were excluded from DCM because of lack of activated voxels in the ROIs (n=10), but did not find any clinical or demographic differences from those who were included.
Discussion
This is the first study to examine effective connectivity using DCM of task fMRI BOLD signals to interrogate emotion-relevant neural networks in adolescents with MDD. This approach advances our understanding of the neural architecture of the adolescent brain by providing information about the direction of neural connections and how they are directly and indirectly modified by an external stimulus. We constructed and tested eight models in each hemisphere based on relevant networks previously described in the literature. The results show that (1) MDD and HCs fit similar optimal neural models; (2) within the winning model, for both groups, several bottom-up connections were found to be significant, but no top-down connections were significant; and (3) only the amygdala-to-sgACC connection was significantly different between groups.
Interpretation of results from aim 1: identifying the optimal neural model
We found tentative evidence that the MDD and HC groups fit similar optimal neural models. HCs clearly demonstrated an optimal fit with Model 2 in both hemispheres, whereas Models 2 and 5 were equally preferred in MDD. These two models are highly similar; the key feature distinguishing these two models from the others is that they include bidirectional modulation of connections between amygdala and sgACC and between supraACC and sgACC. Although our second aim results revealed that bidirectional task modulation of these connections was not significant in either group, the model fit results indicate that inclusion of bidirectional modulation of these connections in the model is important in our sample.
The equal preference in MDD for Models 2 and 5 could suggest something about the variance in neural circuitry across these patients. The difference between Models 2 and 5 hinges on bidirectional task modulation of connections between amygdala and supraACC (Model 2 included bilateral task modulation; Model 5 included only top-down modulation). Our findings might indicate that modulation by the task of bottom-up amygdala→supraACC connectivity does not have the same importance for emotion processing in at least some MDD as it has for HCs. Furthermore, the equivocal preference for Models 2 and 5 within MDD raised the question of whether these models represent a neural basis for subgroups in our sample. However, there was no evidence that any clinical characteristics differentiated the patients that preferred Model 2 versus 5. Therefore, an understanding of the relevance of amygdala→supraACC modulation (or lack thereof) for classifying subgroups of adolescents with MDD may require additional research with larger samples.
Our findings regarding the model fit differ from research with depressed adults, which have generally found evidence that MDD and HCs fit different optimal neural models. For example, Desseilles et al. (2011) examined visual attention systems and found that in the HC best-fit model, attention load was associated with increased modulation of intraparietal sulcus on the visual area, but this was not present in the MDD group's model. These results are difficult to compare with those of our study since both the tasks and brain regions were quite different. Goulden et al. (2012) utilized a task more similar to the one presented here, involving emotion faces: the best-fit model for HCs involved modulation by happy faces of FG→orbitofrontal cortex, whereas the MDD optimal model involved modulation of this connection by sad faces. In our study, fear and angry faces were presented at the same time in the context of a matching task, so we were unable to parse out the impact on circuitry from separate emotions. Furthermore, it is likely that the developmental phase plays a critical role in understanding directional and bidirectional neural pathways. Future work applying DCM to fMRI data using a task similar to that used by Goulden et al. could potentially differentiate adolescent groups based on optimal network models.
Interpretation of results from aim 2: validating the across-groups best-fitting model
To explore the validity of the across-groups best-fitting model, we tested whether each of connectivity parameters was significantly different from zero. The DCM results confirmed the proposed intrinsic connectivity of IOG→FG, FG→amygdala, and amygdala→supraACC in both hemispheres for both groups. Surprisingly, the network testing showed that in contrast to previous work in adults (Stein et al., 2007), the sgACC→supraACC and reverse supraACC→sgACC connections were not significantly greater than zero in either group, in either hemisphere. In other words, our network testing revealed strong evidence for a bottom-up pathway in this sample of adolescents, in which information is brought in through initial visual processing areas to limbic and then to higher-order cortical areas, but limited evidence for top-down pathways in either group. These results may shed light on the neural architecture of emotion circuitry in adolescents in general and the explanation for them may be developmental. Brain connections are known to undergo ongoing development and refinement through the adolescent period (Burghy et al., 2012; Fair et al., 2007; 2008; Giedd et al., 1999; Kelly et al., 2009; Langeslag et al., 2013; Simmonds et al., 2014; Sowell et al., 2002). It is possible that the lack of significant nonzero values for supraACC→amygdala and sgACC→amygdala intrinsic connectivity in this sample may reflect the relative immaturity of these connections in these adolescent participants. However, given the small sample, this interpretation should be considered speculative, requiring additional evidence in future cross-sectional and longitudinal developmental studies.
Aim 3: Testing between-group differences in connections of best-fitting model
Focusing on the connectivity parameters that were found to be significant in the Aim 2 testing, we conducted tests to evaluate differences between groups on these parameters. We found that the only significant group difference was that MDD had lower sgACC→amygdala intrinsic connectivity than HCs. Again, it is likely that a developmental explanation might be useful. Given research in animals suggesting that amygdala–medial prefrontal connections continue to mature into early adulthood (Cunningham et al., 2002), this finding suggests that adolescent MDD could involve a maturational abnormality in this connection. Prior studies using other methodologies have also implicated this connection in adolescents with MDD, with some variation as to whether the circuit is underconnected or overconnected in different contexts. In line with our findings, two diffusion tensor imaging studies have shown lower structural connectivity for white matter connecting these regions in adolescents with MDD (Cullen et al., 2010; LeWinn et al., 2014). However, another study found that adolescents with MDD showed evidence of greater structural integrity in that connection (Aghajani et al., 2013). Furthermore, another study in adolescents with MDD showed greater resting-state functional connectivity between sgACC and amygdala than HCs (Connolly et al., 2013), and the same group showed greater connectivity in this circuit in adolescents with MDD using emotion face task fMRI and psychophysiological interaction (Ho et al., 2014). The variation in findings could stem from heterogeneity across the samples and/or methodological differences. However, it is also important to recognize that each of these approaches brings distinctly valuable aspects of connectivity information. Moving forward, multimodal approaches to examining brain connectivity that are applied to the same sample promise to provide complimentary types of information that could yield a richer understanding of the neural abnormalities of MDD in adolescents.
Our findings add to previous results from adult DCM studies that have consistently implicated connections between amygdala and medial frontal regions in MDD; however, there has been variability in adult studies with respect to the frontal location, whether the connection is bottom-up or top-down, and with respect to the direction of the findings (i.e., greater in patients or HCs). For example, one study found that adults with MDD showed enhanced top-down connectivity from the left sgACC and from left ventromedial prefrontal cortex to the amygdala to fearful faces; enhanced bottom-up amygdala→ventromedial prefrontal cortex connectivity to angry faces; but impaired connectivity both in bottom-up and top-down in these circuits to sad faces (Almeida, 2011). Another study also reported lower bottom-up amygdala→orbitofrontal cortex connectivity in adults with MDD (Goulden et al., 2012), while greater bottom-up amygdala→ACC in patients versus HCs has been shown in a DCM study using magnetoencephalography in the context of various emotions (Lu et al., 2012). The mixed results regarding directionality raise new questions about the pathophysiology of MDD. It may be that abnormalities in amygdala–medial frontal connections are a final common pathway to depression pathophysiology, and that across individuals, a large number of heterogeneous causal mechanisms impact these core connections to lead to the depressed state. Larger samples with uniform methods would be necessary to confirm this hypothesis and begin to tease apart the heterogeneous mechanisms leading to this purported final common pathway.
Study limitations
Several study limitations should be noted. First, the sample size was relatively modest. Because we required the model ROIs to have activated voxels in each node of the entire proposed network, we had to exclude 10 MDD and 5 HC datasets, further limiting power and raising the risk of identifying spurious findings. Future work is needed to replicate these findings and next steps may consider selecting a task that activates the hypothesized brain regions more consistently across adolescent subjects. Furthermore, since DCM relies heavily on hypothesis-driven Bayesian model selection, model misspecification is a risk with this method (Stephan et al., 2010). That is, we set out to determine which plausible model best explains the data. If the set of models does not include the true model, results may be biased toward the most complex model. In our case, the across-groups best-fitting model was the most complex model. It is possible that by including even more complex potential models, we would have identified a more optimal one (closer to the true nature). However, our software had a maximum of 10 regions to include in the model. Thus, we included regions that we considered to be centrally implicated in MDD; however, numerous other regions have also been implicated across studies and deserve further investigation. For example, two recent resting-state fMRI studies that explored whole-brain connectivity of the amygdala in adolescents with depression found that the significant group differences from HCs lay in regions not included in the current model (brainstem, temporal, parietal, and occipital lobes) (Cullen et al., 2014; Pannekoek et al., 2014). Therefore, future work utilizing software with computational capabilities for more complex modeling may be indicated to expand the preliminary work presented here. Because our sample was small and the proportion of boys in both groups was particularly small, we were unable to examine the impact of sex on these findings; this should be explored in future research. A final limitation is the inclusion of both fear and anger in a single negative valence construct; modeling fear and anger separately may result in different connectivity patterns.
Conclusion
Our DCM analysis suggests that adolescents with MDD have similar emotion-related frontolimbic effective connectivity structure as HCs, validated bottom-up connections in this circuitry for both groups, and identified impaired amygdala-sgACC connectivity during emotion processing in adolescents with MDD. The application of DCM using task data extends previous findings regarding aberrant frontolimbic connectivity in MDD by describing the circuitry in adolescents with and without MDD and providing information about the direction of the neural connections and how they are influenced in the context of negative emotion. Given the small sample and the contrast between our findings in adolescents with those discussed above in adults, these findings should be viewed as preliminary. To address the disparities, studies with larger samples and longitudinal design are needed to determine when in development and in what context neural connectivity abnormalities emerge, how they change with development and course of illness, and whether normal developmental trajectories can be restored with appropriate intervention.
Footnotes
Acknowledgments
The authors first thank the patients and families who contributed to this study. The study was funded by the National Institute of Mental Health grant K23MH090421 (Dr. Cullen) and Biotechnology Research Center grant P41 RR008079 (Center for Magnetic Resonance Research), the National Alliance for Research on Schizophrenia and Depression, the University of Minnesota Graduate School, and the Minnesota Medical Foundation. This work was carried out, in part, using computing resources at the University of Minnesota Supercomputing Institute.
Author Disclosure Statement
No competing financial interests exist.