
Abstract
This systematic review aimed to assess the reproducibility of graph-theoretic brain network metrics. Primary research studies of test-retest reliability conducted on healthy human subjects were included that quantified test-retest reliability using either the intraclass correlation coefficient (ICC) or the coefficient of variance. The MEDLINE, Web of Knowledge, Google Scholar, and OpenGrey databases were searched up to February 2014. Risk of bias was assessed with 10 criteria weighted toward methodological quality. Twenty-three studies were included in the review (n=499 subjects) and evaluated for various characteristics, including sample size (5–45), retest interval (<1 h to >1 year), acquisition method, and test-retest reliability scores. For at least one metric, ICCs reached the fair range (ICC 0.40–0.59) in one study, the good range (ICC 0.60–0.74) in five studies, and the excellent range (ICC>0.74) in 16 studies. Heterogeneity of methods prevented further quantitative analysis. Reproducibility was good overall. For the metrics having three or more ICCs reported for both functional and structural networks, six of seven were higher in structural networks, indicating that structural networks may be more reliable over time. The authors were also able to highlight and discuss a number of methodological factors affecting reproducibility.
Introduction
Graph theory has recently been applied to brain imaging data and shows promise as an interpretable and generalizable way to model brain networks (Bullmore and Sporns, 2009; Park and Friston, 2013). In graph theory, a graph is a mathematical construct used to model the relationships between objects, in which the objects are called vertices and their interconnecting links are called edges. In terms of brain networks, regions of interest (ROIs) can be represented by the vertices in a graph, and some measure of connectivity between those ROIs can be represented by the edges. One of the main advantages to this model is that simple, numerical summary descriptors of graph organization can be derived, which describe the graph structure or topology in terms of the whole network (Rubinov and Sporns, 2010). The most common descriptors are characteristic path length (a measure of how easy it is to traverse the whole graph), clustering coefficient (a measure of local connectivity), and small-worldness (the state of being highly clustered, yet having a short average path (Watts and Strogatz, 1998)) considered to be a highly efficient structure (Latora and Marchiori, 2001). These metrics provide a way to characterize the underlying functional and structural brain networks and allow comparisons across time, subjects, or groups of subjects.
There has been a trend toward applying these techniques in studies of patient populations to investigate how, on the level of whole-brain networks, symptoms may emerge from the underlying neurological injury or psychopathology. Studies have demonstrated significant differences in metrics derived from graphs of brain networks between diseased and healthy groups as well as in normal development (Supekar et al., 2009), for example, in multiple sclerosis (He et al., 2009), Alzheimer's (Buckner et al., 2009; Stam et al., 2009), Parkinson's (Göttlich et al., 2013), epilepsy (Quraan et al., 2013), and body dysmorphic disorder (Arienzo et al., 2013) [for reviews see Bassett and Bullmore (2009); Menon (2011); Wang et al. (2010)], and have offered various interpretations of these findings. With this wave of positive results, some authors have suggested the use of graph metrics as surrogate markers in clinical trials (Petrella, 2011) and even suggested that they have potential as diagnostic tools (Quraan et al., 2013; Schoonheim et al., 2013). However, such applications are dependent, alongside validity, on evidence of reliability and responsiveness to intervention.
Several recent studies have aimed to meet this need by measuring the test-retest reliability of graph metrics (Andreotti et al., 2014; Bassett et al., 2011; Braun et al., 2012; Buchanan et al., 2014; Cao et al., 2014; Cheng et al., 2012; Dennis et al., 2012; Deuker et al., 2009; Duda et al., 2014; Fan et al., 2012; Faria et al., 2012; Guo et al., 2012; Jin et al., 2011; Liang et al., 2012; Liao et al., 2013; Niu et al., 2013; Owen et al., 2013; Park et al., 2012; Parker et al., 2012; Schwarz and McGonigle, 2011; Telesford et al., 2010; Vaessen et al., 2010; Wang et al., 2011; Weber et al., 2013). To achieve this, graphs of brain networks derived from healthy volunteers at two or more time points were analyzed to determine their organizational properties, and the level of agreement between the measurements quantified using an intraclass correlation coefficient (ICC). Most studies employed a variation on this design; for example, a common secondary aim was to identify the data preprocessing and graph construction strategies, which resulted in the most reproducible graph metrics. While many of these studies concluded that graph metrics were reliable enough for wider application in future translational research, heterogeneity in their methods and quality and the occurrence of some conflicting results mean that no consensus view is apparent.
In this study, the authors aimed to systematically review and summarize the published literature describing the test-retest reliability of graph-theoretic brain network metrics. Specifically, the authors ask the following: (1) What is the test-retest reliability of graph metrics in brain networks? (2) Based on reliability data, which graph metrics show the greatest promise for translation into clinical neuroscience research? And (3) how do methodological factors in data analysis impact the test-retest reliability of graph metrics?
Materials and Methods
Search strategy
A systematic literature search was performed independently by two researchers (T.W. and D.A.K.) on the 9th of February, 2014, in the MEDLINE (
In the first phase of screening, articles were identified that attempted to measure the test-retest reliability of summary graph metrics in human brain networks based on the title and abstract. In the second phase of screening, the authors excluded any articles that did not meet all of the following criteria: (1) to avoid the confounding effect of any disease process, the study must use data only from healthy human subjects; (2) to make simple comparisons between studies, the study must measure reproducibility using either the ICC (Shrout and Fleiss, 1979) or coefficient of variance (CV); (3) the article must not be a review or meta-analysis; and (4) the full text of the article must be available.
Qualification of researchers
The literature search was performed by T.W. (who has expertise in computer science and radiological science) and D.A.K. (who has expertise in medicine and radiological science). Both were supervised and trained in the conduct of systematic reviews by the authors D.P.A. and R.A.D., each holding PhDs and experienced in neuroimaging research and systematic review.
Data extraction and synthesis
From each article, the authors recorded and tabulated the number of subjects, the type of scan, the interscan interval, and the conclusions drawn about the reliability of graph metrics. From each article reporting reliability measurements derived from structural networks, the authors also recorded the software tools used for parcellation, registration, diffusion modeling, fiber tracking, and the edge weight definition used. Data were extracted independently by two researchers (T.W. and D.A.K.) and then merged to reduce the chance of data being missed or reported incorrectly. In the case of a conflict, the article in question was reviewed and discussed by both researchers together until an agreement was reached. Because the acquisition protocol used may be a factor translating into graph retest performance, results for structural and functional data were tabulated separately. A qualitative synthesis based on the included articles' findings and about how they relate to reliability was written for each of the following recurrent or important themes identified in the literature: choice of density threshold, type of ICC used, ROI size, retest interval, preprocessing strategy, type of graph metric, and fiber tracking algorithm. The software used for graph thresholding and calculating metrics was assumed to be equivalent; most studies used custom software with the Brain Connectivity Toolbox (Rubinov and Sporns, 2010) and the algorithms for the different graph metrics are well defined.
Risk of bias assessment
To assess the quality of each included study, the authors rated each article using a set of 10 criteria based on previous quality checklists (Downs and Black, 1998; West et al., 2002; Von Elm et al., 2007). Each criterion was assigned a weight of 1, 2, or 3 such that the emphasis was placed on quality of methodology rather than reporting. The highest possible score was 20 and the lowest, 0. The quality of each article was assessed independently by two researchers (T.W. and D.A.K.) and then finally determined by consensus. Low-scoring articles were not omitted, but their conclusions carried less influence within the review.
Results
Literature search
The database search returned 202 results, of which 73 were excluded for being duplicates. In the first phase of screening, 105 of the remaining 129 articles were excluded for not measuring the reliability of graph metrics in brain networks. In the second phase of screening, 1 of the remaining 24 articles (Faria et al., 2012) was excluded for analyzing the test-retest reliability of individual edge weights instead of summary graph metrics, leaving 23 articles to be included in the review. Figure 1 shows the results of the literature search process at each stage.
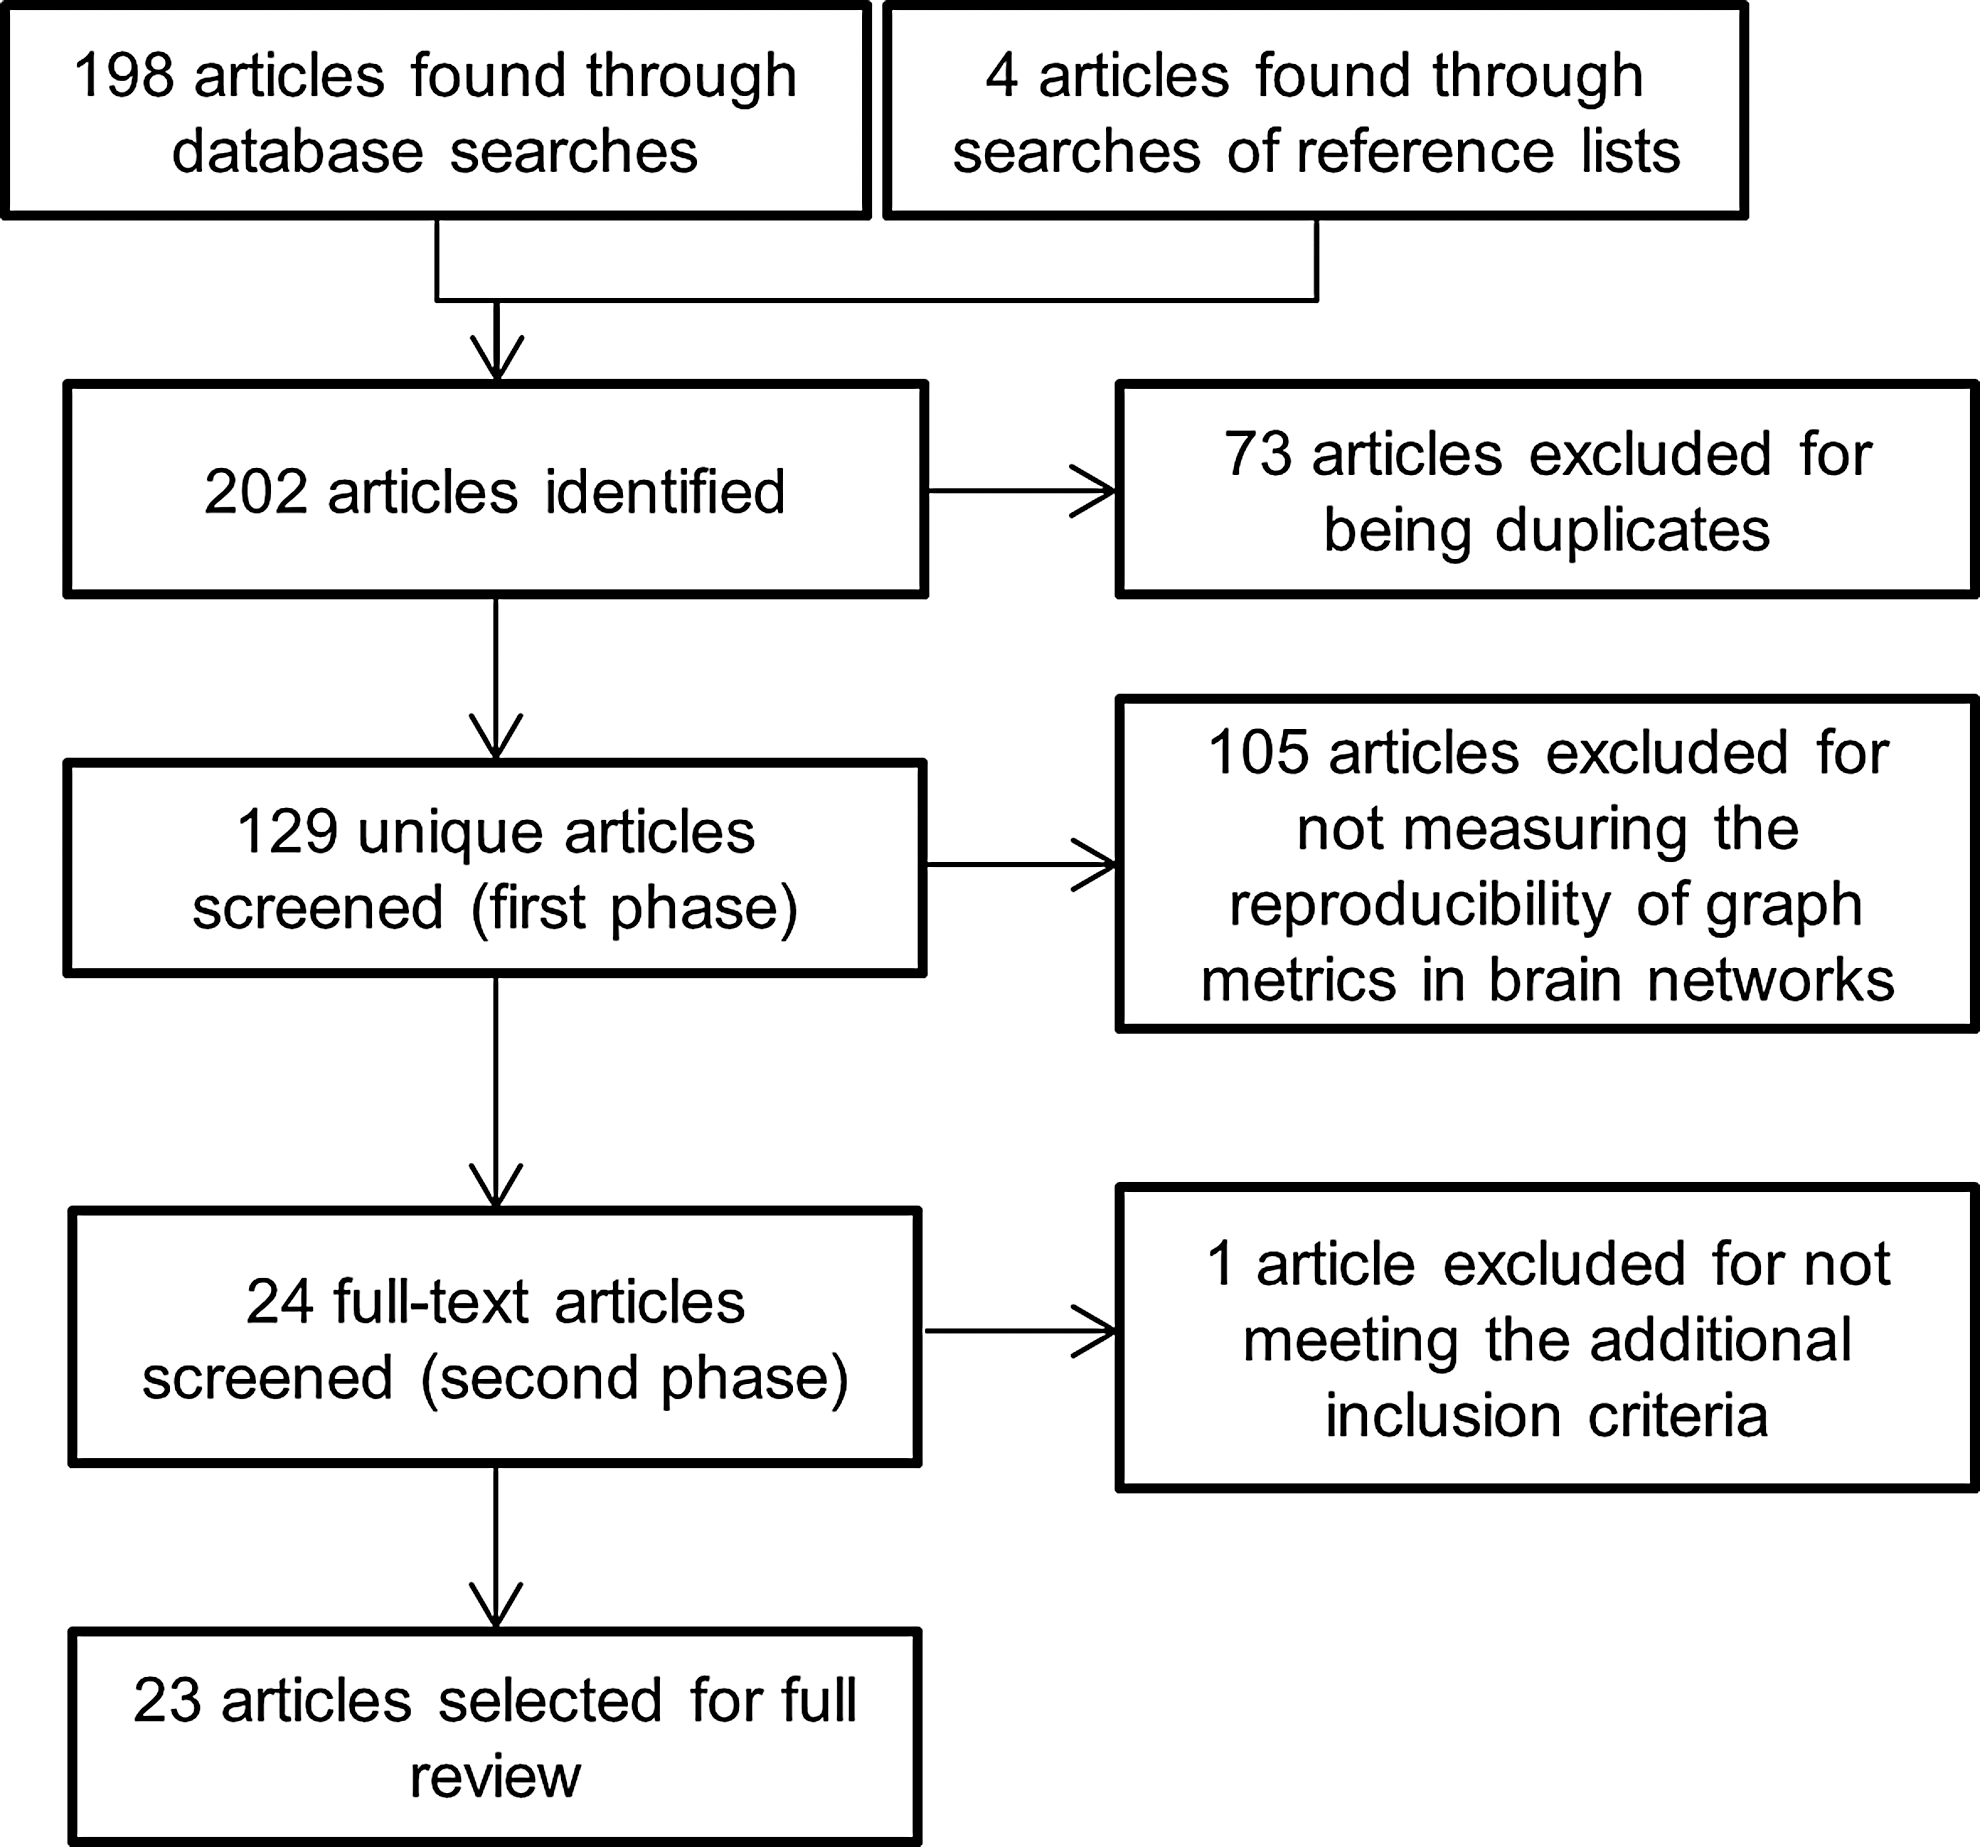
Flowchart describing the number of results at each stage of the literature search.
Risk of bias
The criteria used for quality assessment and the quality scores for each study are shown in Supplementary Table S1 (Supplementary Data are available online at
Frequent limiting factors in the methodological quality of the reviewed studies were not using a scanner with field strength of greater than 1.5 T (lower signal-to-noise ratio than higher strength magnets) and using small sample sizes. Some of the penalties incurred were due to inadequate reporting, such as failure to describe the type of ICC used or inadequate characterization of the sample. Particular strengths of the included studies were their appropriate choosing of acquisition, processing and graph construction methods, and clarity when reporting them.
Study characteristics
Table 1 gives a summary of each study's design and conclusions. The number of subjects in the studies ranged from 5 to 45 and numbered 499 in total. The most frequent image acquisition methods were functional magnetic resonance imaging (fMRI; 11 instances; 48% of 23) and diffusion tensor imaging (DTI; 10 instances; 43% of 23), but there were also two studies using magnetoencephalography data (10% of 23), one using functional near-infrared spectroscopy (fNIRS) and one using arterial spin labeling (each 5% of 23). The test-retest interval ranged from being shorter than 1 h to being longer than 1 year.
Summary of Included Studies
ASL, arterial spin-labeling perfusion functional magnetic resonance imaging; DSI, diffusion spectrum imaging; DTI, diffusion-tensor imaging; fMRI, blood oxygenation level-dependent functional magnetic resonance imaging; fNIRS, functional near-infrared spectroscopy; MEG, magnetoencephalography; ROI, regions of interest; RS, resting state.
Within each study using functional data, at least one metric reached the excellent range in nine studies (Braun et al., 2012; Deuker et al., 2009; Guo et al., 2012; Liao et al., 2013; Niu et al., 2013; Park and Friston, 2013; Telesford et al., 2010; Wang et al., 2011; Weber et al., 2013) (ICC>0.74; 64% of 14), the good range in three studies (Cao et al., 2014; Jin et al., 2011; Schwarz and McGonigle, 2011) (ICC 0.60–0.74; 21% of 14), the fair range in one study (Liang et al., 2012) (ICC 0.40–0.59; 7% of 14), the poor range in none of the studies (ICC<0.40; 0% of 14), and one study did not fully report ICC data (Fan et al., 2012).
Within each study using structural data, at least one metric reached the excellent range in seven studies (Andreotti et al., 2014; Buchanan et al., 2014; Cheng et al., 2012; Duda et al., 2014; Owen et al., 2013; Parker et al., 2012; Vaessen et al., 2010) (78% of 9), the good range in two studies (Bassett et al., 2011; Dennis et al., 2012) (22% of 9), the fair range in none of the studies (0% of 9), and the poor range in 0 studies (0% of 9).
Tables 2 and 3 list the highest ICC measurements from the studies that reported the exact ICC values for those metrics. Table 4 draws a comparison between the methods employed in studies of the test-retest reliability of graph metrics in structural brain networks.
Reported Intraclass Correlation Coefficient Values for Various Metrics in Each Study That Reported Exact Intraclass Correlation Coefficients from Functional Data
The studies not listed did not report exact ICC values. The highest values were chosen so that the values reported below represent the most reliable method tested within each study. These values could act as a guide for approximate expected values of ICC given different methodological choices. As a rule of thumb, ICC scores are interpreted as follows: <0.40, poor; 0.40–0.59, fair; 0.60–0.74, good; >0.74, excellent (Fleiss et al., 2013) (shown in bold).
ICC, intraclass correlation coefficient.
Reported Intraclass Correlation Coefficient Values for Various Metrics in Each Study That Reported Exact Intraclass Correlation Coefficients from Structural Data
The studies not listed did not report exact ICC values. The highest values were chosen so that the values reported below represent the most reliable method tested within each study. These values could act as a guide for approximate expected values of ICC given different methodological choices. As a rule of thumb, ICC scores are interpreted as follows: <0.40, poor; 0.40–0.59, fair; 0.60–0.74, good; >0.74, excellent (Fleiss et al., 2013) (shown in bold).
Comparison of the Approaches Taken in Studies of Graph Metrics' Reliability in Structural Networks
The edge weight is given by the number of connecting streamlines between two ROIs.
The edge weight is given by the sum of the connecting streamlines divided by the mean of the two ROIs' volumes.
As (a), but correcting for streamline length.
The number of fibers connecting the two ROIs normalized to the volume of the selected ROI.
The mean FA value along interconnecting streamlines.
As (c), divided by the sum number of streamlines started from the ROIs, multiplied by the sum size of the two ROIs.
Twice the sum of the connecting streamlines between the two ROIs, divided by the sum volume of the 2 ROIs.
AAL, Automated Anatomical Labeling; ANTs, Advanced Normalization Tools; CATNAP, Coregistration Adjustment and Tensor Solving, A Nicely Automated Program; DKT31, Desikan–Killiany–Tourville; FACT, Fiber Assignment by Continuous Tracking; FSL, FMRIB Software Library; HOA, Harvard–Oxford Atlas; LPBA40, LONI Probabilistic Brain Atlas; RK4, Fourth-order Runge-Kutta; TEND, Tensor Deflection; WFUpick, Wake Forest University Pick.
Synthesis of results
Acquisition method
The method used to acquire the test-retest data is one factor influencing reproducibility due to the differences in sensitivity to different physical properties of the brain between methods. Of the metrics for which three or more ICCs were reported for both functional and structural groups, six of seven were higher in the metrics based on structural data (Tables 2 and 3). This difference may have been expected, given the brain's dynamic and rapidly fluctuating hemodynamic state, even at rest, compared with its relatively static structure (Biswal et al., 1995). None of the included studies made a comparison between reliabilities of graph metrics derived from different acquisition methods.
Graph thresholds
In graphs of functional networks, edges are weighted by the correlation coefficient between the time series of two ROIs. In graphs of structural networks, edges are weighted by the number of streamlines connecting two ROIs. Typically, before calculating graph metrics, an arbitrary threshold is chosen below which edge weights are set to zero. Several different approaches were taken when thresholding weighted graphs. The most common was to threshold the graph at a range of densities (the density of a graph is given by the ratio of existing edges in the graph to the number of possible edges). Other approaches were fixed thresholding (Fan et al., 2012), mean degree thresholding (Owen et al., 2013), average path length thresholding (Telesford et al., 2010), and calculating weighted variants of graph metrics (Jin et al., 2011). While no study attempted to isolate the range of density threshold used to determine its effect on reproducibility, one study (Guo et al., 2012) compared the use of a fixed threshold (based on the edge weight alone) with soft and proportional thresholding techniques, but found neither to be significantly more reliable.
ROI size
Three studies looked at the effect of the ROI size on reproducibility. One tested the relationship between the ROI size (from within a single structural parcellation) and test-retest reliability of local DTI-based graph metrics over time (Andreotti et al., 2014). Another used three different structural atlases (based on anatomical, as opposed to functional regions) and upsampled them by dividing each region into two, thereby doubling the resolution, and tested the reproducibility of the resulting global DTI-based graph metrics over time (Bassett et al., 2011). These two studies found that graphs based on larger structural ROIs and derived from DTI data produced metrics that were more reliable than those based on upsampled or more finely grained parcellation schemes. By contrast, the third study, which used fMRI data, found metrics derived from graphs based on a high-resolution functional atlas to be more reproducible than those of a lower resolution structural atlas (Cao et al., 2014); however, these results were based on ICCs averaged over three types of tasks, within which there were significant differences in reproducibility. It is unclear whether the reported difference in reliabilities associated with atlas resolution would have retained significance when compared within each task condition or at rest.
Preprocessing strategy
All included studies used different strategies and tools for data preprocessing. One study (Parker et al., 2012) tested two entirely different DTI pipelines, finding differences in CV and ICC values between them; however, interpretation of the results is limited by not being able to identify which of the steps were responsible for the greatest differences in reliability. Another study (Braun et al., 2012) tested seven fMRI pipelines, varying one step of a standard pipeline at a time, and found that including a broader frequency band from the fMRI time series and using global signal regression yielded the most reliable graph metrics. A third study (Cao et al., 2014) tested five different task regression methods and two atlases on fMRI data, identifying two approaches to regression as being the most effective and finding that neither the functional nor the structural atlas produced significantly more reproducible metrics than the other.
Type of graph metric
Of the many summary measures of graph organization, several classifications can be made; for example, global and local metrics or weighted and binary metrics. All of the included articles gathered reliability measurements for different metrics, and many of them drew a direct comparison between the test-retest reliability of different metrics or types of metrics. Two studies (Andreotti et al., 2014; Cao et al., 2014) distinguished between local and global metrics, each finding global metrics to be more reproducible, with local metrics being more variable. One (Braun et al., 2012) noted that first-order metrics (those derived directly from the graph) were less reproducible than second-order metrics (those derived from the first-order metrics). Four studies, each with different acquisition types, focused on the relative reproducibility of individual metrics. The first (Dennis et al., 2012), which acquired DTI data, found that modularity was the most reproducible metric. The second (Niu et al., 2013), which acquired resting-state fNIRS (RS-fNIRS), and the third (Telesford et al., 2010), which acquired fMRI during performance of an executive task, found that the clustering coefficient and global efficiency were both the most reproducible metrics, with the third noting that degree was the least reproducible. In contrast, the fourth study (Wang et al., 2011), which acquired RS-fMRI data, found that degree was the most reproducible metric.
Fiber tracking algorithm
Eight different fiber tracking algorithms were used by the included studies (Table 4). There were two instances where different algorithms were compared within-study to test the reproducibility of graph metrics derived from each. In one (Buchanan et al., 2014), the authors found that for gray matter seeds, neither the FMRIB's diffusion toolbox (FDT) nor fiber assignment by continuous tracking (FACT) algorithms produced significantly more reproducible graph metrics than the other when run with any weighting or waypoint length threshold. The second study (Duda et al., 2014) compared four different algorithms and found that none was consistently more reproducible than the others for any graph metric.
Retest interval
The two studies looking at the effect of the length of the interscan interval on graph metrics' test-retest reliability had divergent conclusions. The first found that the reproducibility of graph metrics measured over a short interval was greater compared with those measured over a long interval (Schwarz and McGonigle, 2011). Despite both using the same publicly available RS-fMRI dataset, the second study found the opposite—that reproducibility was greatest when measured between the scans separated by a long retest interval (Wang et al., 2011). The most overt methodological difference between these studies was that the first measured its long interval between scans >5 months apart, whereas the second measured it between the first scan (>5 months from the second) and the average of the second and third scans (<1 h apart). The two studies also used different atlases for parcellation and removed different sets of confound signals, which could have impacted the result.
ICC type
There are six main types of ICCs, each one of which has a subtly different interpretation (Müller and Büttner, 1994); therefore, choosing the most appropriate version of ICC is an important yet difficult task, which must take into account the aim of the study. In this review, nine studies (Dennis et al., 2012; Fan et al., 2012; Liang et al., 2012; Liao et al., 2013; Niu et al., 2013; Schwarz and McGonigle, 2011; Telesford et al., 2010; Wang et al., 2011; Weber et al., 2013) used the ICC(1,1) version, which is a measure of absolute agreement and is sensitive to differences in means between raters. One study (Cao et al., 2014) used the ICC(2,1) version, which treats raters as random effects and emphasizes interchangeability between raters. Eight studies (Andreotti et al., 2014; Bassett et al., 2011; Braun et al., 2012; Buchanan et al., 2014; Duda et al., 2014; Guo et al., 2012; Jin et al., 2011; Park et al., 2012) used the ICC(3,1) version, which treats raters as a fixed effect and emphasizes inter-rater consistency, that is, association between a finite set of scanners, but is not generalizable beyond those scanners. Other methods used to quantify the test-retest reliability were the CV and Bland–Altman plots. No study compared ICC types or discussed the effect of their choice of statistical test on the interpretation of their results.
Discussion
The authors have reviewed and summarized the published literature that investigates the test-retest reliability of graph-theoretic brain network metrics. The primary aim was to establish the reproducibility of graph metrics of brain networks. The authors find that reported ICC scores were often in the good and excellent ranges, indicating that the test-retest reliability can be adequate under certain conditions. These scores varied between functional and structural networks. For example, across the studies of functional networks, six metrics (the clustering coefficient, characteristic path length, small-worldness, global efficiency, assortativity, and local efficiency) had median ICCs across three or more studies in the good or excellent ranges (Table 2). In the studies of structural networks, seven metrics (the clustering coefficient, characteristic path length, degree, global efficiency, modularity, local efficiency, and betweenness centrality) met the same criteria (Table 3). These were the most reproducible metrics and therefore may be the most promising for future use in clinical neuroscience research. For the metrics having three or more ICCs reported for both functional and structural networks, six of seven were higher in structural networks, indicating that structural networks may be more reliable over time.
Another aim was to understand how different methodological factors affect the reproducibility of graph summary measures. There was limited evidence that, when using structural data, larger ROIs may be preferable, and that when using functional data, smaller ROIs may be preferable. The authors also find that global metrics are more reproducible than local metrics and second-order metrics are more reproducible than first-order metrics. Different metrics are more or less reproducible depending on both the acquisition type and the state of the test subject; for example, Wang and coworkers (2011) show that for resting-state fMRI data, degree was the most reproducible metric, whereas for Telesford and associates (2010), under an executive task fMRI scan, degree was the least reproducible. There was some evidence that the specific fiber tracking algorithm used with DTI data had little effect on graph metrics' reproducibility, and that the preprocessing steps taken can significantly alter metrics' reproducibility. The optimal graph threshold type, retest interval, and ICC type were not clear from the existing literature due to conflicting results, and the sample size and number of gradient directions had no clear correspondence to ICC scores (Table 3).
However, this analysis of methodological factors identifies some important issues to be addressed. A major issue is that the breadth of approaches and the range of reported ICC types in the included articles prevented meta-analysis and complicated the identification of any consensus view. For example, even studies using the same dataset and performing relatively similar analyses report drastically different results (Schwarz and McGonigle, 2011; Wang et al., 2011). There are still many unknowns in the methods being applied, such as the ideal density threshold or range, necessary fMRI scan length (known to affect reliability (Birn et al., 2013; Whitlow et al., 2010), type of atlas, and ROI size; furthermore, the most reproducible of these is not necessarily the most biologically plausible. Variability in the research designs of the individual studies prevented any clear analysis strategy from standing out as superior, so when testing multiple preprocessing pipelines or analysis strategies, the authors recommend that researchers isolate one variable at a time and study its effect on reproducibility rather than varying multiple aspects of the method at once. In this respect, two articles stand out as good examples of research upon which future studies could be modeled (Braun et al., 2012; Cao et al., 2014). Individual processing steps can have a large impact on results; for example, the use of global signal regression has been shown to obscure the findings of increased cortical power and variance in schizophrenia (Yang et al., 2014). The authors also suggest that replication studies are performed to establish further the generalizability of the ICC measurements across cohorts and across more than one repeat scan (four of the datasets used in the included studies are freely available to download (Buchanan et al., 2014; Duda et al., 2014; Liang et al., 2012; Schwarz and McGonigle, 2011; Wang et al., 2011)).
Previous studies have suggested the use of graph metrics in clinical trials (Petrella, 2011) and as diagnostic tools (Quraan et al., 2013; Schoonheim et al., 2013). There is clear appeal to this approach. Metrics are well defined in terms of the graph itself, and studies in disease populations have reported changes in the direction of metric score that are consistent in relation to the disease status; for example, in schizophrenia where clustering is consistently lower than in healthy people (Anderson and Cohen, 2013; He et al., 2012; Liu et al., 2008; Lynall et al., 2010; Rubinov et al., 2009). However, in addition to the uncertainties regarding the contextual validity of graph summary measures (i.e., why they correlate with some disease processes, and whether some metrics hold any biological significance at all), the issue of reproducibility is critical to address before graph metrics are used in clinical trials or for clinical diagnosis. Several studies have concluded that the reproducibility of this approach is sufficient to allow application in clinical research populations (Bassett et al., 2011; Braun et al., 2012; Niu et al., 2013; Owen et al., 2013; Tomasi and Volkow, 2011), but others have suggested the opposite (Andreotti et al., 2014; Deuker et al., 2009). On the findings of this review, in which the authors have collated the evidence of graph metric reproducibility as identified by systematic review, the authors cannot draw conclusions about clinical relevance. While reproducibility studies have often demonstrated good ICC measurements, reproducibility is not the only criterion for suitability for use in clinical trials; to the authors knowledge there have been no studies examining the responsiveness of brain network properties to intervention. This review of test-retest reproducibility studies of GT metrics has also identified a lack of studies assessing multicenter or multiplatform reproducibility, which will be important to establish if GT metrics are to be adopted in future multicenter treatment trials. Although one of the included studies used data from two different scanners, no comparison was made between them (Braun et al., 2012).
This review is also the first to systematically review data processing strategies used in graph-theoretic analysis of brain networks in the context of test-retest studies. Andreotti and colleagues (2014) performed a short qualitative review, in which they tabulate several parameters of the graph analysis, but only included six studies and did not compare or discuss the table in depth. Zuo and Xing (2014) conducted a qualitative review of the test-retest reliability of resting-state fMRI measurements in human brain networks, but did not focus on graph metrics.
This study was limited primarily by incomplete reporting. The original aim was to meta-analyze the published literature to provide summarized test-retest reliability data for the various graph theory metrics, but it became apparent that meta-analysis was not possible without full reporting of the variances. Additionally, meta-analysis would be severely limited by the heterogeneity of the methods employed in individual studies. To allow future meta-analysis, the authors recommend that studies report the data fully in terms of variances (standard deviation or range depending on normal or nonnormal distribution) as well as the type of ICC calculated. The authors would also warn other authors to take care when interpreting results based on a mixture of imaging modalities.
Conclusion
The authors have identified the graph metrics, which show the most promise for future research use. Reproducibility for these metrics was frequently good and excellent. Methodological factors impact upon reproducibility, and researchers need to take these into account when planning their analyses.
Footnotes
Acknowledgment
This work was supported by a PhD studentship grant from the UK Multiple Sclerosis Society (registered charity 1139257).
Author Disclosure Statement
No competing financial interests exist.
References
Supplementary Material
Please find the following supplemental material available below.
For Open Access articles published under a Creative Commons License, all supplemental material carries the same license as the article it is associated with.
For non-Open Access articles published, all supplemental material carries a non-exclusive license, and permission requests for re-use of supplemental material or any part of supplemental material shall be sent directly to the copyright owner as specified in the copyright notice associated with the article.