
Abstract
Meditation induces a distinct and reversible mental state that provides insights into brain correlates of consciousness. We explored brain network changes related to meditation by graph theoretical analysis of resting-state functional magnetic resonance imaging data. Eighteen Taoist meditators with varying levels of expertise were scanned using a within-subjects counterbalanced design during resting and meditation states. State-related differences in network topology were measured globally and at the level of individual nodes and edges. Although measures of global network topology, such as small-worldness, were unchanged, meditation was characterized by an extensive and expertise-dependent reorganization of the hubs (highly connected nodes) and edges (functional connections). Areas of sensory cortex, especially the bilateral primary visual and auditory cortices, and the bilateral temporopolar areas, which had the highest degree (or connectivity) during the resting state, showed the biggest decrease during meditation. Conversely, bilateral thalamus and components of the default mode network, mainly the bilateral precuneus and posterior cingulate cortex, had low degree in the resting state but increased degree during meditation. Additionally, these changes in nodal degree were accompanied by reorganization of anatomical orientation of the edges. During meditation, long-distance longitudinal (antero-posterior) edges increased proportionally, whereas orthogonal long-distance transverse (right-left) edges connecting bilaterally homologous cortices decreased. Our findings suggest that transient changes in consciousness associated with meditation introduce convergent changes in the topological and spatial properties of brain functional networks, and the anatomical pattern of integration might be as important as the global level of integration when considering the network basis for human consciousness.
Introduction
Meditation is a distinct and reversible state of consciousness that entails attentional and emotional regulatory processes and is correlated with altered local activation of specific brain regions (Austin, 1999; Davidson et al., 2003; Kozasa et al., 2012; Lazar et al., 2000; Lutz et al., 2008a; Newberg et al., 2001). Higher blood flow has been reported in the dorsolateral prefrontal cortex (DLPFC) and anterior cingulate cortex during meditation states (Cahn and Polich, 2006; Newberg et al., 2003).
A meta-analysis of functional magnetic resonance imaging (fMRI) and position emission tomography (PET) studies of meditation reported replicable evidence for activation of the basal ganglia (caudate body), limbic system (entorhinal cortex), and medial prefrontal cortex (MPFC) during meditation compared to rest (Sperduti et al., 2012). But since consciousness is thought to involve integrative processing across large-scale distributed brain systems (Massimini et al., 2005), the brain functional changes associated with meditation are likely to be better understood by a focus on connectivity and networks rather than on regional activation.
Some previous resting-state fMRI studies have demonstrated changes in functional connectivity related to meditation. For example, a region of interest analysis using the MPFC as a seed region reported greater functional connectivity within the default mode network (DMN) in regular practitioners of meditation (scanned at rest) compared with nonmeditators (Jang et al., 2011). Other seed-based analyses have suggested a stronger anticorrelation between DMN and attentional systems during meditation (Josipovic et al., 2012); decreased functional connectivity between MPFC and insula in mindfulness meditators (Farb et al., 2007); and increased functional connectivity between regions of an attentional system (Froeliger et al., 2012; Hasenkamp and Barsalou, 2012; Pagnoni, 2012) or between regions of the DMN (e.g., between right inferior parietal lobule (IPL) and dorso-medial prefrontal cortex (PFC), ventro-medial PFC, and posterior cingulate cortex [PCC], respectively) (Brewer et al., 2011; Taylor et al., 2012).
Multivariate pattern recognition approaches have also enabled the classification of regular meditators and controls on the basis of different patterns across the whole brain (Sato et al., 2012). In terms of the topology of brain functional networks, one study has reported that integrative body-mind training (IBMT) was associated with greater nodal efficiency of anterior cingulate cortex (Xue et al., 2011). Moreover, sometimes these effects of meditation on brain functional connectivity have been correlated with greater experience (Brewer et al., 2011).
In this study, we took advantage of graph theoretical methods' ability of analyzing a complex system (Bullmore and Sporns, 2009, 2012) and used a within-subjects design to explore brain functional network changes during meditation compared to rest in the same subjects, scanned twice using fMRI. We focused on the intrapersonal large-scale network changes rather than group differences demonstrated by comparison between meditators and control groups (Allen et al., 2012; MacCoon et al., 2012; Rosenkranz et al., 2013). We measured meditation-related changes in network organization at global and nodal levels of network organization.
Based on prior data showing that clinically altered level of consciousness [in comatose patients (Achard et al., 2012)] was associated with a disruption of nodal degree in the context of normal global network topology, we predicted hypothetically that the changes in consciousness induced by meditation, although relatively subtle, would also be associated with changes in nodal degree. We further hypothesized that such changes in the degree of hub nodes might be related to changes in the anatomical orientation and distance of connections or edges between nodes.
Materials and Methods
Sample
Eighteen meditators (8 males; mean age = 52.6 ± 13.5 years) were recruited. All participants were regular practitioners of Taoist meditation with levels of experience ranging from 0.5 to 19.9 years (mean = 7.4 ± 6.9 years) (Table 1). Regarding this specific Taoist meditation, it was also named “Chinese Original Quiet Sitting” by Liou et al. (2010), and it has been demonstrated that these meditators had significantly increased nighttime salivary melatonin levels at various times post nighttime meditation (Liou et al., 2010). In addition, a preliminary electroencephalogram (EEG) study has shown that there was increased theta wave activity, especially around 30 min after practicing this kind of meditation (Chen et al., 1997). All participants were screened to exclude a current or past history of neurological or psychiatric disorder and gave informed consent in writing. The study protocol was ethically approved by the National Taiwan University Institutional Review Board.
Demographic Data
n.a., not available.
Experimental design
To counterbalance the comparison between resting and meditation states for the order of scanning, the first nine subjects were scanned first in the resting state and then while they were meditating; the last nine subjects were scanned first during meditation and then again in the resting state. The first and second cohorts were matched for sex (chi-square test, χ 2 (1, N = 18) = 0.23, p = 0.64), age (two-sample t (16) = 0.56, p = 0.58), and years of meditation experience (two-sample t (16) = 0.27, p = 0.79).
Participants were asked to keep their eyes closed during both the resting and meditation states (Jao et al., 2013). Each meditation session lasted for 12 min in both cohorts and only the last 9 min of data were analyzed. Each resting session lasted for 9 min in the first cohort and 12 min in the second cohort, and only the first 9 min of resting-state data in both cohorts were analyzed.
During each 12-min meditation session, participants first recited a simple mantra quietly, and then stopped recitation and pressed a pneumatic ball in their right hand as soon as they felt that they were going to enter a real meditative state. One subject did not press the pneumatic ball because she felt that she was unable to enter the meditative state as satisfactorily as usual. This subject was not excluded in further analysis because she did adhere to our instruction and meditate during the set time.
Subjects then practiced (intentionally) relaxed to-do-nothing and to-think-nothing meditation, also known as Chinese Original Quiet Sitting (Liou et al., 2010), which is not exactly the same as but analogous to silent illumination of traditional Chinese Zen practice (Yen, 2008) or integrated Buddhist meditative techniques of śamatha and vipaśyanā (Zelazo et al., 2007). No other specific physical exercise or cognitive task was performed before or during the meditation. We focused on within-subjects comparisons of brain networks derived from 9 min data in the resting state and 9 min of data in the relaxed to-do-nothing and to-think-nothing meditation states.
After the scanning, each practitioner, except the aforementioned one who felt that she was unable to enter a satisfactory meditative state, rated the depth of meditation they had achieved on a 10-point scale (the higher the score, the better the subject feels). The mean score for the remaining 17 subjects was 5.6 ± 2.0, indicating that most participants achieved an intermediate depth of meditation during scanning (Table 1).
Data acquisition
Resting-state fMRI data were acquired using a gradient-echo echo-planar imaging (GE-EPI) sequence sensitive to blood oxygenation level dependent (BOLD) contrast on a 3.0 Tesla Medspec S300 scanner and T8826 quadrature head coil (Bruker Medical). Images were collected parallel to the AC-PC (anterior commissure–posterior commissure) plane to cover the whole brain, from vertex to cerebellum, with the following parameters: number of slices = 24 (interleaved); slice thickness = 4.0 mm; interslice gap = 0 mm; matrix size = 64 ×64; in-plane resolution = 4.0 × 4.0 mm2; flip angle = 87°; repetition time (TR) = 2000 msec; and echo time (TE) = 28 msec. For the resting-state session of the first cohort, we acquired 270 volumes, and for all other sessions in both cohorts, we acquired 360 volumes.
Anatomical MRI data were also acquired from all subjects using a modified driven equilibrium Fourier transform imaging sequence with the following parameters: matrix size 256 × 256 × 192; in-plane resolution = 1.0 × 1.0 × 1.0 mm3; flip angle = 8°; inversion time (TI) = 1000 msec; repetition time (TR) = 25.5 msec; and echo time (TE) = 4.9 msec.
fMRI data preprocessing and parcellation
For the resting-state scans of the first cohort, the first 4 volumes of each fMRI dataset were discarded to allow for T1 saturation effects. For the resting-state scans of the second cohort, and the meditation scans of both cohorts, the first 94 volumes were discarded. Thus, an equal number of images (266) were available for further analysis on all participants under both experimental conditions.
All data sets were preprocessed using SPM8 software (Wellcome Trust Center for Neuroimaging, University College London,
Each voxel time series was then regressed on the time series of rotations and translations in 3D and their first derivatives; and on time series recorded from representative regions of white matter and cerebrospinal fluid (CSF) and their first derivatives. White matter and CSF signals were obtained using the REST software based on SPM software (Resting-State fMRI Data Analysis Toolkit,
The images were then anatomically parcellated into 288 regions of interest, covering the bilateral cerebral hemispheres and cerebellum, using an in-house template image derived by subsampling the regions defined by the automated anatomical labeling template image (Tzourio-Mazoyer et al., 2002). The in-house template defined a finer-grained parcellation with all nodes comprising an approximately equal number of voxels (Zalesky et al., 2010), and it had already discarded regional nodes located in areas prone to susceptibility artefact including the bilateral orbitofrontal cortex, inferior temporal cortex, and brainstem.
Then, for each individual preprocessed dataset, we calculated the nodal mean time series by averaging the voxel time series in each parcel. No regional nodes had to be further excluded due to low EPI intensity and/or low time series variance (defined operationally as variance of mean time series <30). Consequently, there were quality controlled, preprocessed regional mean time series at each of n = 288 nodes for each participant under both experimental conditions.
Wavelet decomposition
Wavelet decomposition is suitable for analysis of endogenous oscillations in fMRI time series (Achard et al., 2006; Bullmore et al., 2004; Jao et al., 2013; Maxim et al., 2005). We used the WMTSA wavelet toolkit in Matlab (Cornish, 2006) (
We focused mostly on wavelet scale 3 data because this frequency band has been particularly associated with brain functional networks (Achard et al., 2006; Jao et al., 2013). For each pair of nodes [i,j], we estimated the correlation between their wavelet coefficients to compile an [288 × 288] association matrix of pair-wise wavelet correlations.
Network topological metrics
The absolute association matrix for each participant in each experimental condition was then thresholded to construct a binary undirected graph, as previously described (Jao et al., 2013). For calculating network topological metrics mentioned in this section, the minimum spanning tree has been used as the backbone for each of the graph to prevent networks from becoming disconnected at very low connection density (Alexander-Bloch et al., 2010; Hagmann et al., 2008; Jao et al., 2013).
Briefly, each pairwise wavelet correlation, wi,j , was compared to an arbitrary threshold, τ. If wi,j > τ, then the corresponding element of the adjacency matrix, ai,j , is equal to 1; whereas if wi,j < τ then ai,j = 0. The adjacency matrix thus defined is equivalent to a binary graph, which has an edge between nodes i and j if ai,j = 1 and no edge between i and j if ai,j = 0. By varying the threshold applied to the association matrix, we constructed graphs with varying numbers of edges or connection densities. The connection density of a graph is the number of edges divided by the maximum possible number of edges in a graph of n nodes = (n × (n − 1) / 2).
Global metrics of network topology were estimated for each graph using the Brain Connectivity Toolbox (see Rubinov and Sporns, 2010;
In brief, clustering amount was measured by the so-called local efficiency metric, and it can be regarded as a measure of information transfer in the immediate neighbourhood of an index node (Achard et al., 2012; Latora and Marchiori, 2001). Global efficiency is a measure of the integrative topology of the network: high global efficiency (close to 1) is equivalent to a short characteristic path length, meaning that it is possible to define a direct connection between any pair of nodes by a short series of edges (Latora and Marchiori, 2001). Small-worldness was measured as the ratio of clustering divided by path length. A small-world network has the characteristic combination of high clustering and short path length that is summarized by the small-worldness ratio σ > 1 (Humphries et al., 2006; Watts and Strogatz, 1998). Modularity is a measure of how nearly decomposable the system is, or how completely it can be decomposed into a set of modules, each of which comprises a number of densely inter-connected nodes that are sparsely connected to nodes in other modules (Newman, 2004).
Additionally, we compiled a histogram of the degree of each node in each graph and fitted an exponentially truncated power law distribution to the empirical degree distribution (Achard et al., 2006). This enabled us to summarize the form of degree distribution in terms of the two parameters of the exponentially truncated power law.
Here, we focus on the set of graphs constructed with connection densities in the range 1–10%, in 1% increments. Each of the global topological metrics was estimated in each graph at each connection density and averaged over connection densities 1–10% to facilitate comparison between graphs while ensuring that every graph had been measured over the same range of connection densities. For illustrative purposes, we also occasionally focused on graphs sparse enough to facilitate visualization of individual edges (Achard et al., 2012; Alexander-Bloch et al., 2013).
Nodal degree and the hub disruption index
In addition to these global measures of network topology, we considered the degree of each node in more detail. Specifically, we compared nodal degree between experimental conditions using a measure called the hub disruption index, κ (Achard et al., 2012). The hub disruption index is a method for comparing the degree distribution between two networks; in this case we used it to compare the nodal degrees of the resting-state network to the degrees of the meditation networks. To estimate the hub disruption index, the mean degree of each node in the resting-state condition is plotted (<Degree(i) rest >, x-axis) versus the difference in degree of each node in the meditation state compared to the resting state (<Degree(i) meditation > −< Degree(i) rest >, y-axis). Linear regression was used to fit a straight line to these data and the gradient of the fitted regression line was equivalent to the hub disruption index, κ.
If the nodal degrees of the resting state and the meditation state were exactly the same then the fitted line would be horizontal, with zero gradient or κ = 0. However for example, if nodes that have high degree in the resting state have reduced degree during meditation (and nodes that have low degree in the resting state have increased degree during meditation), then the fitted line will have a negative gradient or κ < 0 (Achard et al., 2012). Taking advantage of the within-subjects experimental design of this study, this index can be used to compare nodal degrees between the group-averaged meditation network versus the group-averaged resting network (Fig. 1), or to compare an individual meditation network to the resting network of the same individual (Fig. 2).
Nodal degree and the effects of meditation.
Effects of meditation state on the hub disruption index (k) in 18 healthy Taoist meditators.
Direction and distance of network edges
In addition to investigating brain functional networks in terms of topological network metrics, we introduced new spatial metrics of the direction and length of each edge in physical (anatomical) space. Each edge in the functional brain networks was considered as an Euclidean vector whose magnitude was the length of the edge and whose orientation could be further defined and quantified relative to a set of three dimensional (3D) orthogonal axes: transverse (left to right), longitudinal (anterior to posterior), and vertical (top to bottom) axes. For each axis we defined a 3D cone shaped area around it (based at the origin), so that every edge could be categorized as a “transverse,” “longitudinal,” or “vertical” edge (or none of these, the “oblique” edges) according to which axis-orientated cone it was aligned with.
Besides, at each connection density, the global mean connection distance or wiring cost was calculated as the average Euclidean distance over all pairs of connected nodes in the network. The nodal mean connection distance was the average Euclidean distance over all edges connecting the node to the rest of the network (Alexander-Bloch et al., 2013; Bullmore and Sporns, 2012). Furthermore, we also calculated the nodal mean connection distance of each of the transverse, longitudinal, vertical, and oblique edges.
Statistical analysis
We used paired t-tests to examine the significance of group differences for each metric at the global (whole brain) and nodal (regional) levels of analysis. A one-sample t-test was used to test the statistical significance of the hub disruption index with the null hypothesis that κ = 0. For global network topology metrics we used an uncorrected threshold p < 0.05. For nodal (regional) measures we controlled type I error by using the probability threshold corrected for the number of comparisons involved in nodal analysis (p < 1/N = 1/288 = 0.0035) (Jao et al., 2013; Lynall et al., 2010). We also verified the results of parametric testing by conducting nonparametric tests based on random permutation of the observed data (Jao et al., 2013; Moore and Bruce Craig, 2011).
All computations, statistical analyses, and graphics were carried out in Matlab (Mathworks, Inc.,
Results
Global network topology and connection distance
We first compared the resting and meditation states on a set of topological network metrics representing functional segregation and integration at global level. We focused on wavelet scale 3 (0.03–0.06 Hz) data, and there were no significant differences between resting and meditation states on the following metrics: clustering (resting state mean =0.58, meditation state mean = 0.57, t (17) = 1.95 p = 0.07); global efficiency (resting state mean = 0.32, meditation state mean = 0.33, paired t (17) = 1.57, p = 0.14); small-worldness (resting state mean = 3.1, meditation state mean = 3.0, t (17) = 0.38, p = 0.71); and maximum modularity (resting state mean = 0.50, meditation state mean = 0.49, t (17) = 0.72, p = 0.48). In addition, there were also no significant differences in terms of average global wiring cost as estimated by mean connection distance over the whole network (resting state mean = 54.6 mm, meditation state mean = 56.1 mm, t (17) = 1.94, p = 0.07).
These results were consistent across different wavelet scales: except scale 1 (0.13–0.25 Hz) data that might have been contaminated by physiological noise and were not used for analysis; scale 2 (0.06–0.13 Hz), scale 3 (0.03–0.06 Hz), and scale 4 (0.02–0.03 Hz) all showed similar trends of networks changes (Table 2).
Changes in Scale-Dependent Network Topological Metrics
Wavelet scale 2 (0.06–0.13 Hz); scale 3 (0.03–0.06 Hz); scale 4 (0.02–0.03 Hz). Scale 1 (0.13–0.25 Hz) data were not used for analysis because at this specific frequency band they were usually contaminated by physiological noise.
Nodal degree centrality and the hub disruption index
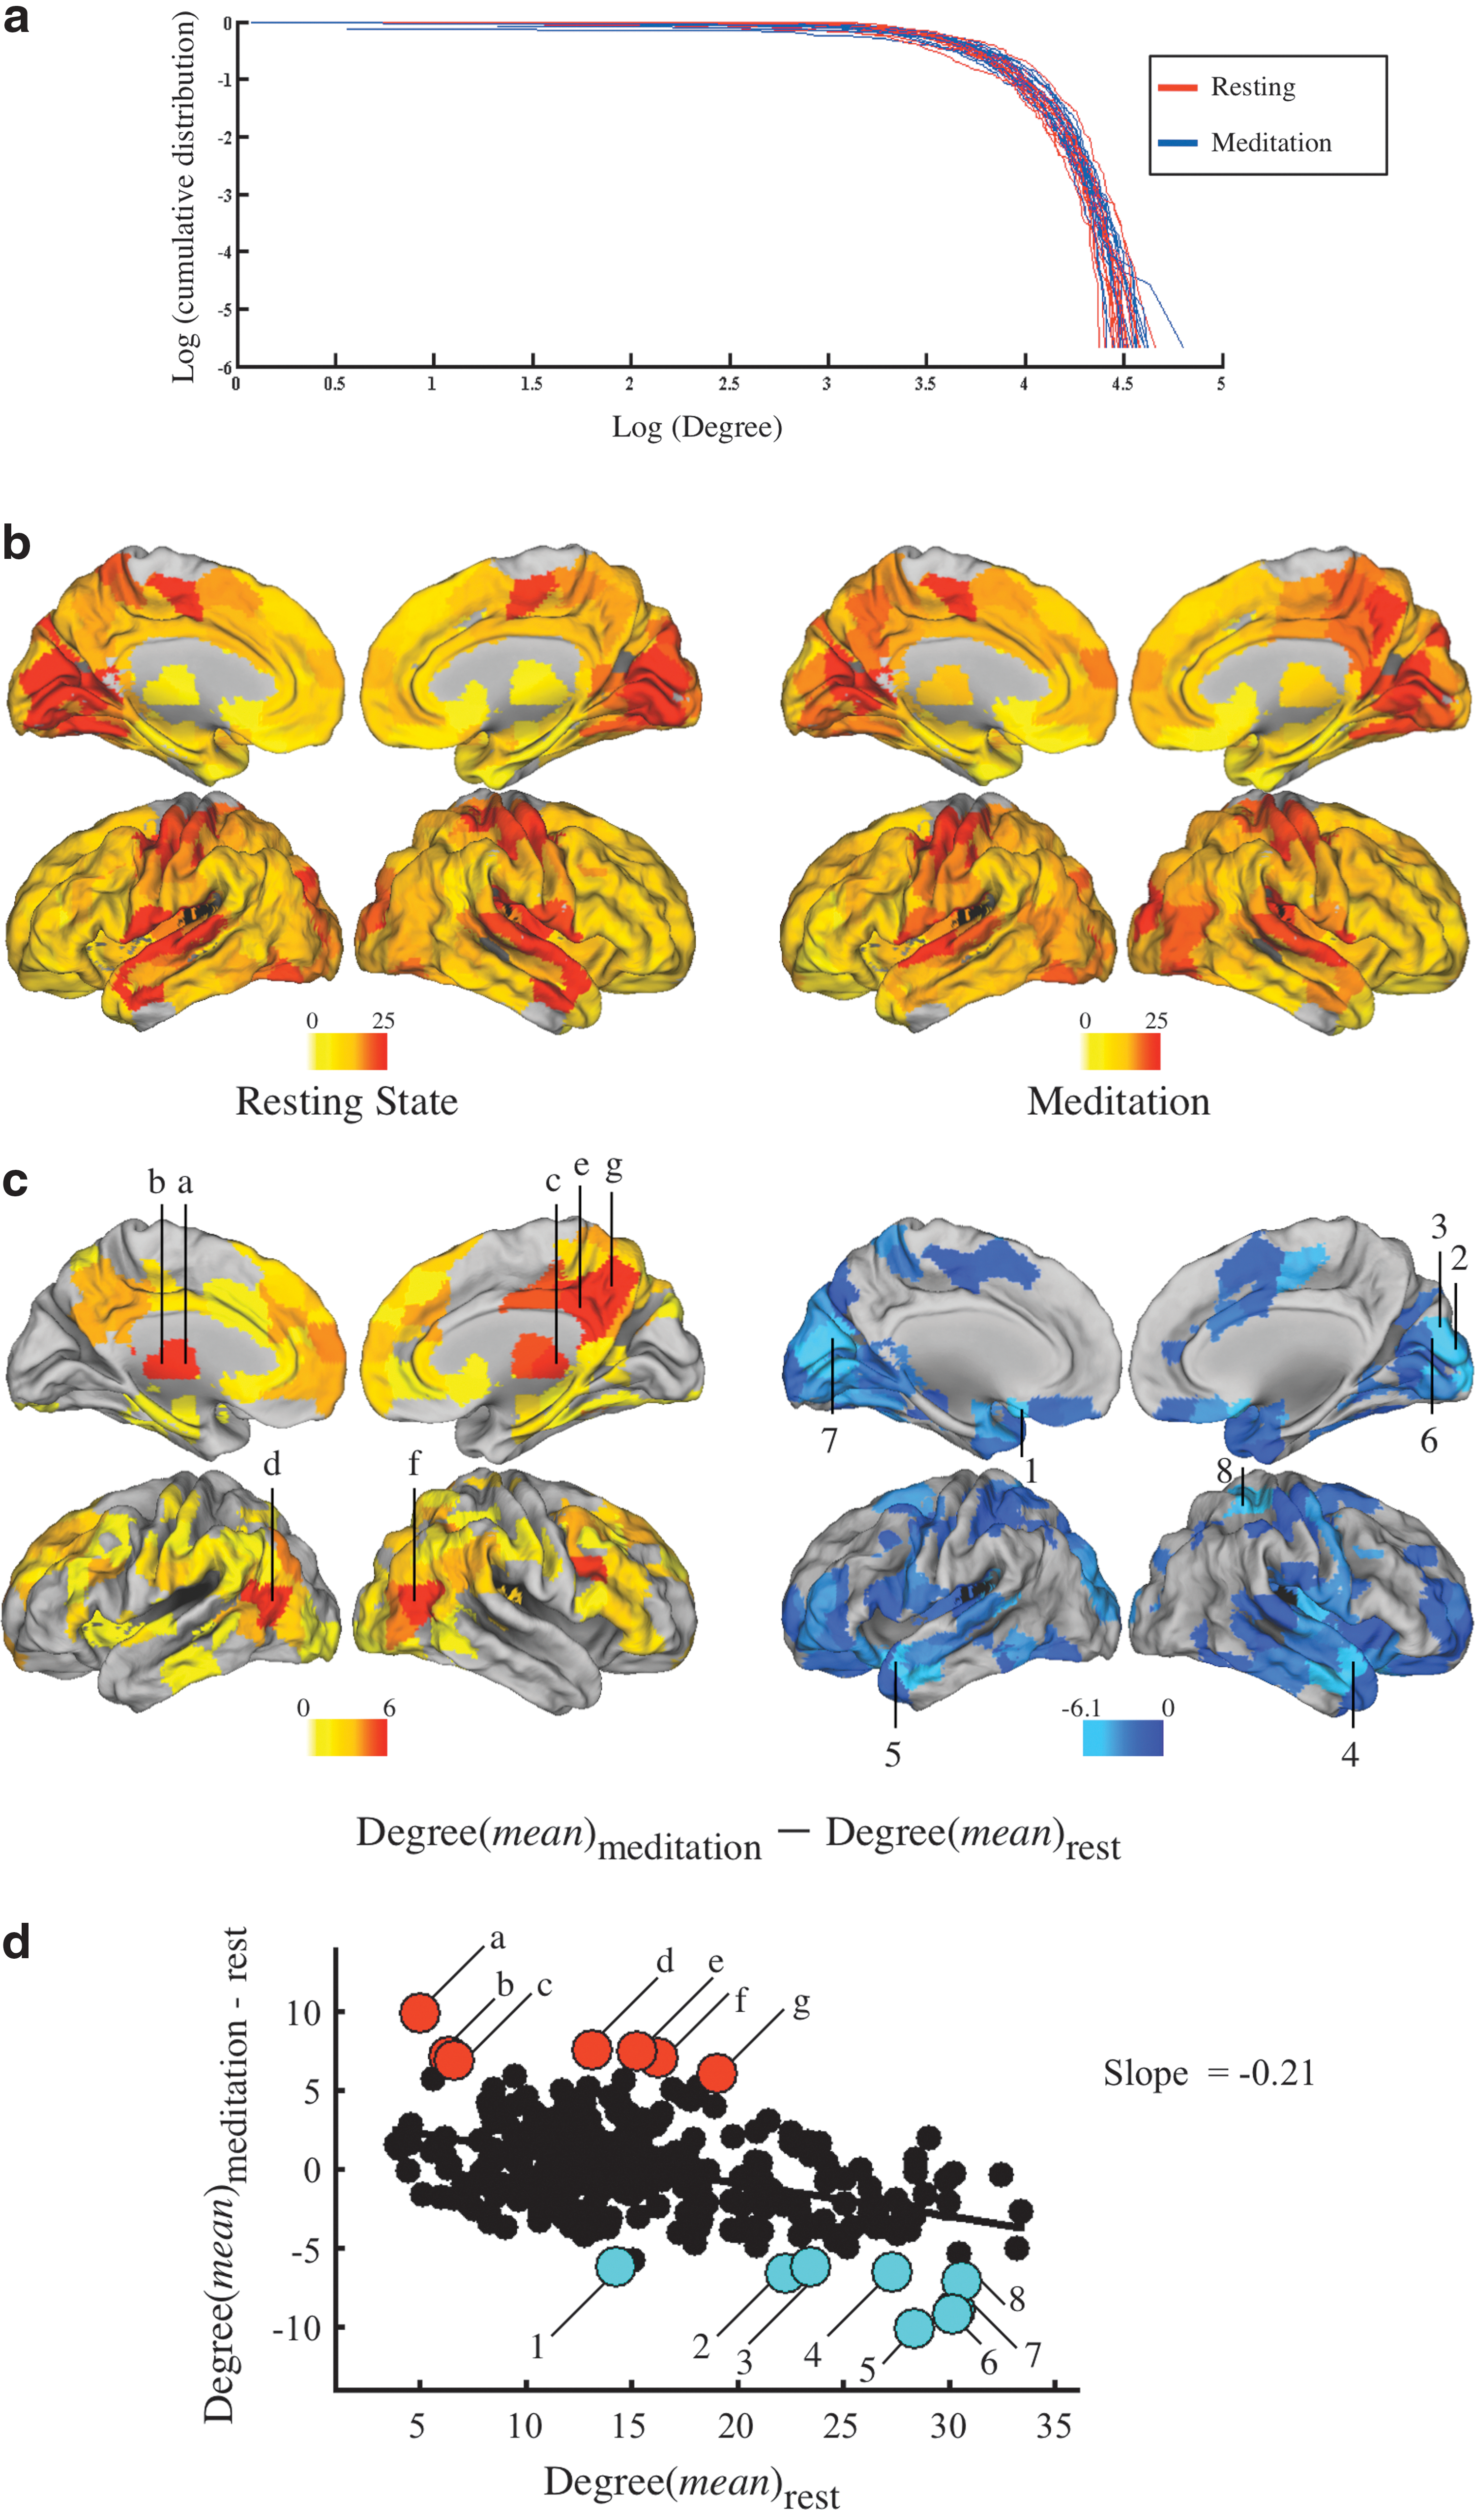
At the nodal level, we first compared resting and meditation states in terms of degree (the number of edges connecting each node to the rest of the network), and both states had similar nodal degree distribution (Fig. 1a, b). It is clear that in both states, regions with high nodal degree were located at primary cortical regions including primary sensory-motor cortex, primary visual cortex, and primary auditory cortex.
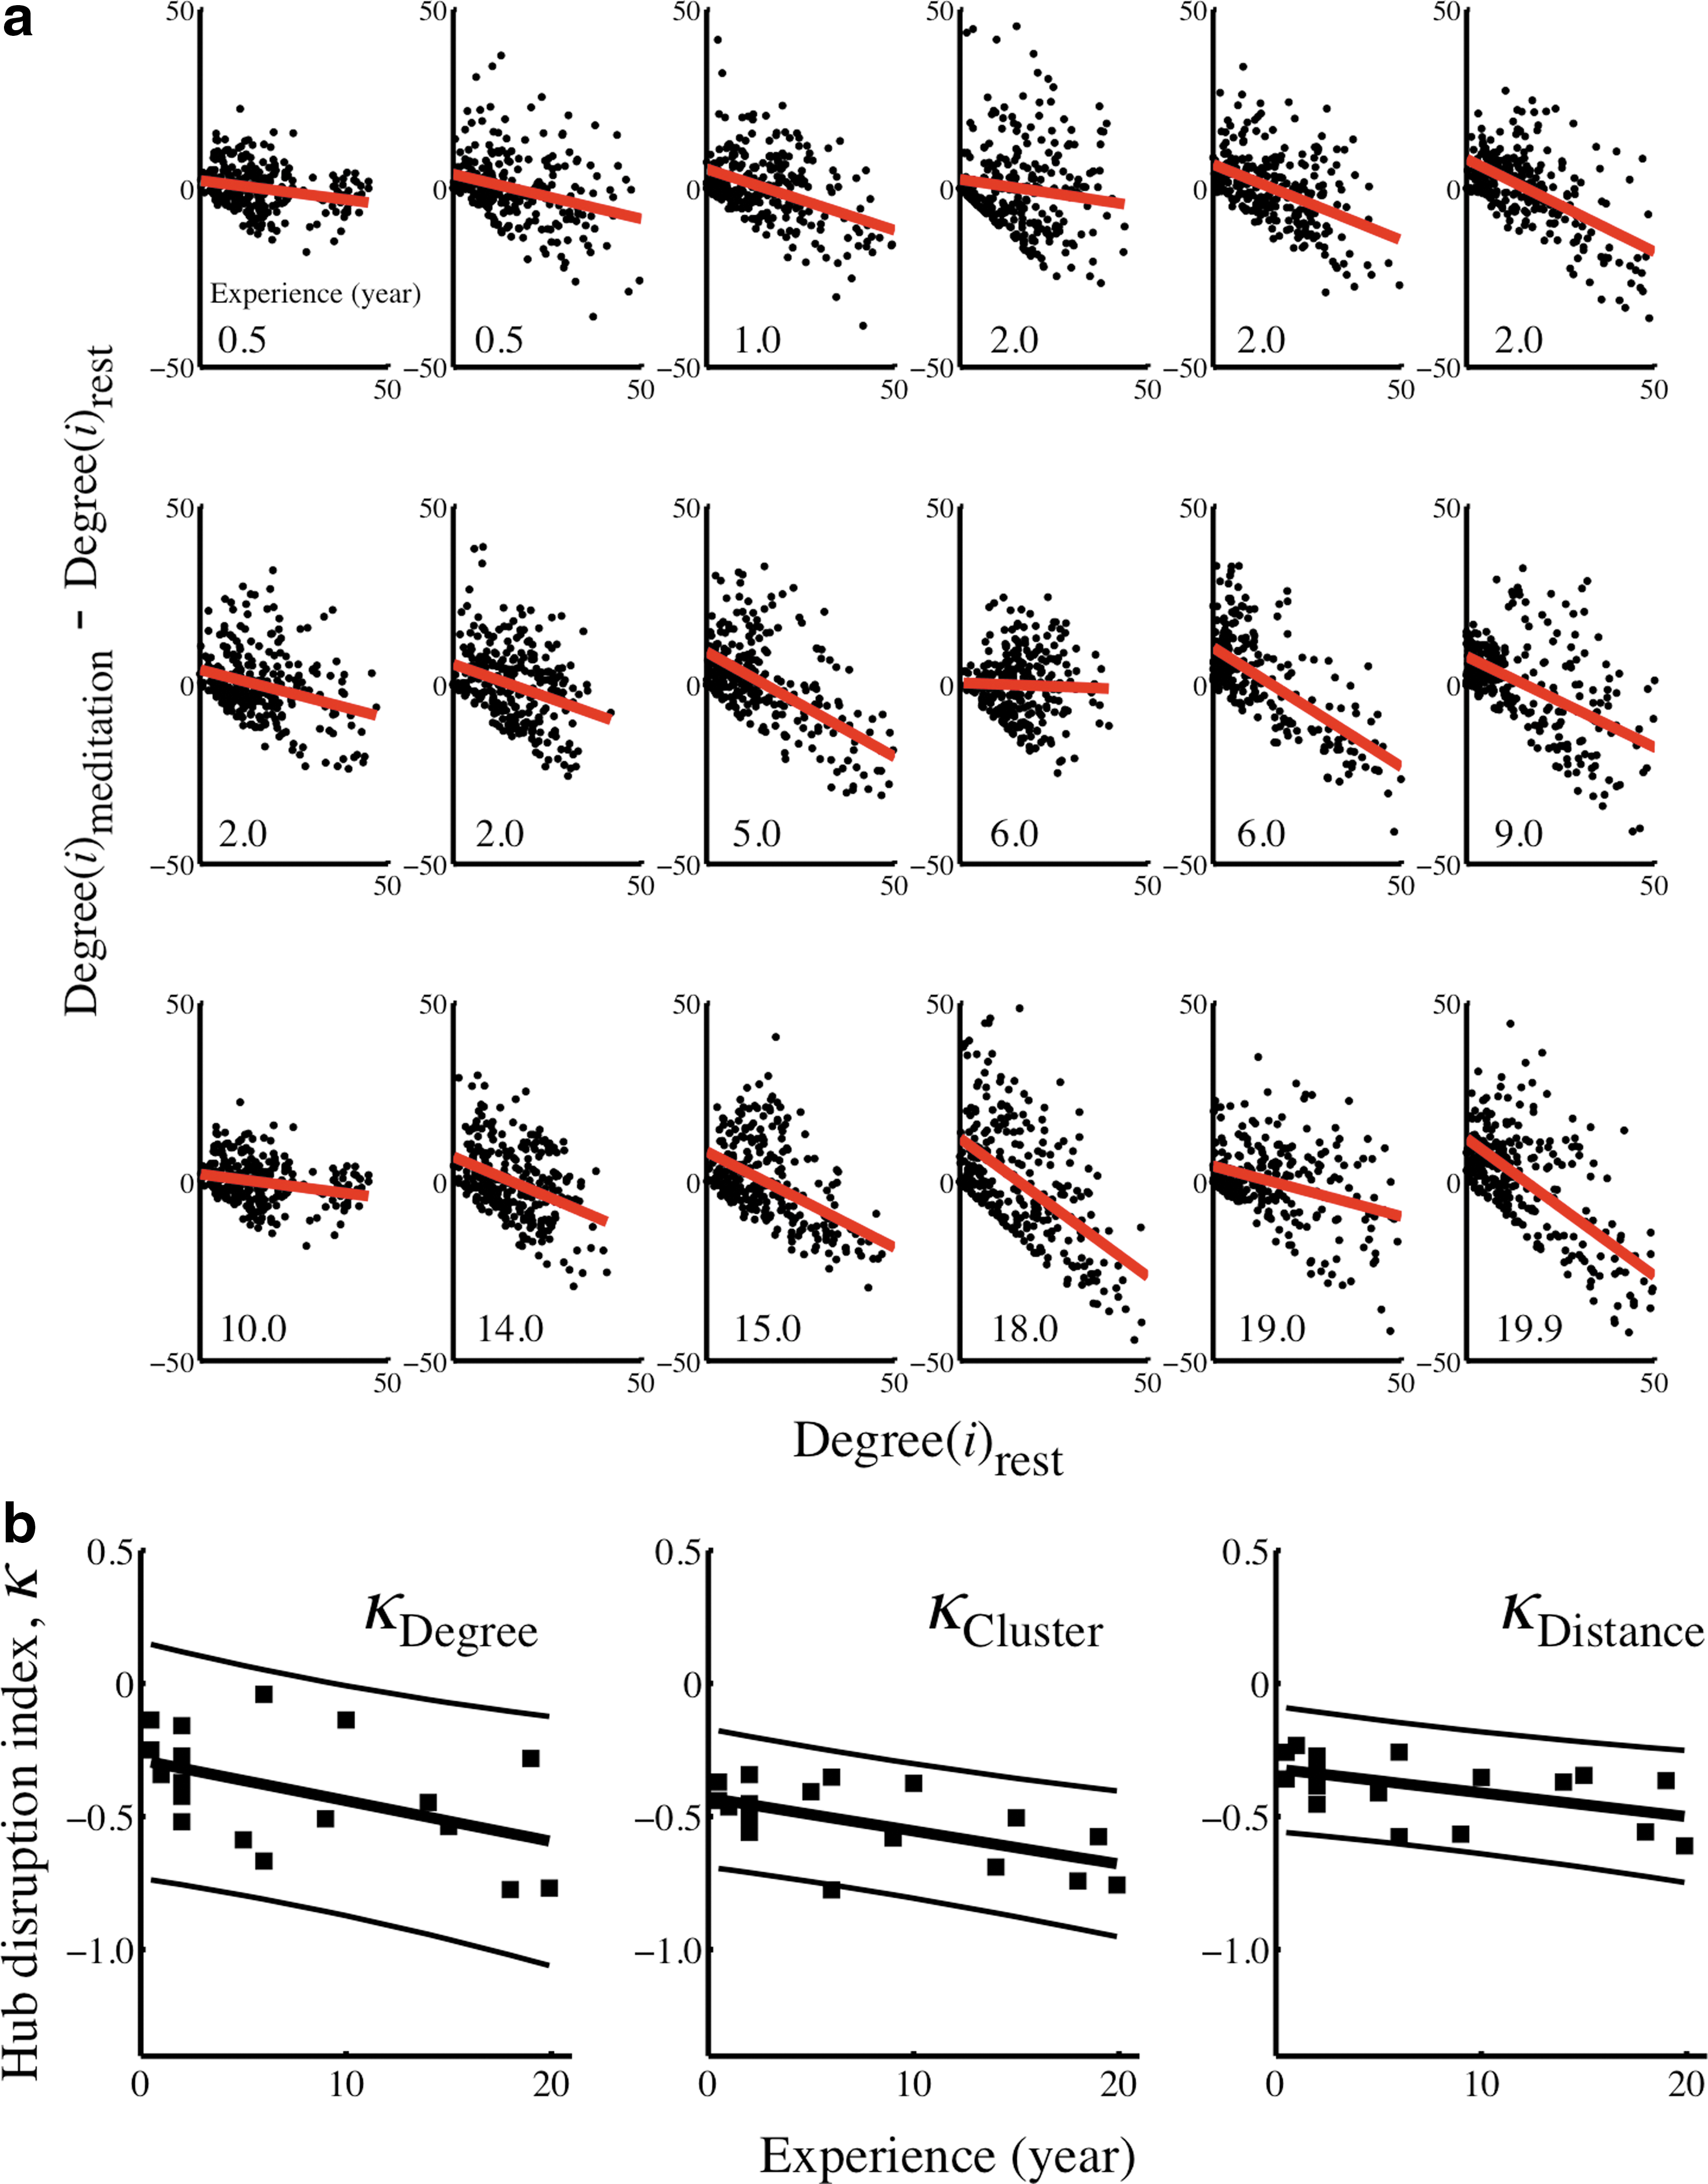
When comparing the mean nodal degree in the meditation state with that of the resting state directly, however, we observed that the bilateral thalamus, bilateral PCC, bilateral precuneus, bilateral MPFC, bilateral IPL, and bilateral DLPFC all had increased nodal degree in the meditation state (Fig. 1c). The hub disruption index, κ, was then used to measure the relationship between the degree or “hubness” of brain regional nodes in the resting state and the difference in degree of each node in the meditation state compared to the resting state. We found that there was a negative linear relationship indicating that some nodes that were high degree hubs of the network in the resting state, that is, primary sensory cortex, tended to lose degree, or to become less strongly connected, in the meditation state. Conversely, some nodes that were relatively low degree non-hubs in the resting-state network tended to win degree, or become more strongly connected, in the meditation state (Fig. 1d). This phenomenon was also clear when we examined each individual subject (Fig. 2a).
One-sample t-test (observed mean k = −0.41, one-sample t (17) = 8.01, p = 3.6e-7 under the null hypothesis that k = 0) demonstrated that this reconfiguration of hubs and non-hubs was significantly greater than expected under the null hypothesis that there is no difference in organization of network hubs attributable to the difference between resting and meditation states. In addition, there were significant correlations between the hub disruption index and the meditator's level of experience (r (16) = −0.48, p = 0.04; r = −0.48 after regressing out the effect of age), and their self-reported score of the depth of meditation achieved during scanning (r (15) = 0.50, p = 0.04). There was no significant correlation between the hub disruption index and the meditator's age (r (16) = −0.06, p = 0.83) (Fig. 2b).
Applying the hub disruption index to other nodal network metrics, we found a similar trend of extensive hub reorganization in the ranking of brain regions. The hub disruption index of nodal clustering was − 0.52 (one-sample t (17) = 15.72, p = 1.5e-11), meaning that nodes that had relatively high clustering in the resting state tended to have lower clustering in the meditation state and vice versa. There was again a significant correlation between the hub disruption index and meditator's experience (r (16) = −0.61, p = 0.01; r = −0.63 after regressing out the effect of age); but the hub disruption index was not correlated with their self-reported score of the depth of meditation achieved during scanning (r (15) = 0.23, p = 0.37) or their age (r (16) = 0.14, p = 0.57).
The hub disruption index of connection distance was − 0.39 (one-sample t (17) = 13.85, p = 1.1e-10), meaning that nodes that had relatively long-distance connections (on average) to other nodes in the resting state tended to have relatively short distance connections in the meditation state and vice versa. Again, there was significant correlation between the hub disruption index for connection distance and meditator's experience (r (16) = −0.52, p = 0.03); but not for the self-rated score of the depth of meditation achieved during scanning (r (15) = 0.10, p = 0.70) nor for age (r (16) = −0.04, p = 0.86) (Fig. 2b).
Orientation and distance of functionally connected edges
In each network, we estimated the Euclidean distance of each edge and its orientation in the 3D space of the image volume. Visual inspection of sparse brain networks of resting and meditation states suggested certain key differences in these parameters. In the resting state, most of the long-distance edges were in the transverse orientation, connecting right and left sides of the brain (often contralateral homologous regions); whereas, in the meditation state, there was a higher frequency of long-distance edges in an orthogonal longitudinal orientation, connecting anterior and posterior regions of the brain (usually ipsilaterally).
This relative shift from transverse to longitudinal orientation of long-distance connections can be seen by inspection of the resting- and meditation-state networks of a single subject (the most experienced meditator in the group). Meditation-related shifts in nodal degree were anatomically related to shifts in the orientation of edges indicating that the increase in degree or hubness of some nodes was due to the formation of more long-distance longitudinal connections in the meditative state at the expense of long-distance, transverse connections (Fig. 3).

Meditation-related changes in brain network configuration of the most experienced meditator in the sample.
We translated all edges from their original locations to a given central point (the origin) (Fig. 4a) and then examined the changes of edge directionality over a range of connection densities from a global perspective (Fig. 4b). It is clear that the most important network edges—the edges that are the most highly ranked—comprise transverse long-range edges and multidirectional short-range edges. In contrast, long-range longitudinal edges appear to be more characteristic of the meditation state; they appeared later at sparse connection density and their angle of deviation from the midline is quite small. Although we defined principal axes in a 3D anatomical space, the transition of axes happened mainly in the two-dimensional axial plane. Interestingly, long-range oblique edges remained sparse until higher connection densities, at which point connections with nearly all possible directions were included in the graph (Fig. 4b).

Mean meditation-related changes in the spatial orientation of edges in functional brain networks.
To quantify these qualitative observations, we assigned each edge to be “transverse,” “longitudinal,” or “vertical” according to whether or not it was orientated within a specific angle (30°) from one of the three corresponding principal axes (Fig. 5); similar results were obtained when the angle threshold for categorization was 15° or 45° (Fig. 6). Edges were considered as “oblique” when they didn't fall in any of these three classes. After all edges were categorized, we calculated and compared the ratio of edge numbers in each category of orientation.
Mean meditation-related differences in relative degree and connection distance of transverse and longitudinal edges as a function of connection density.
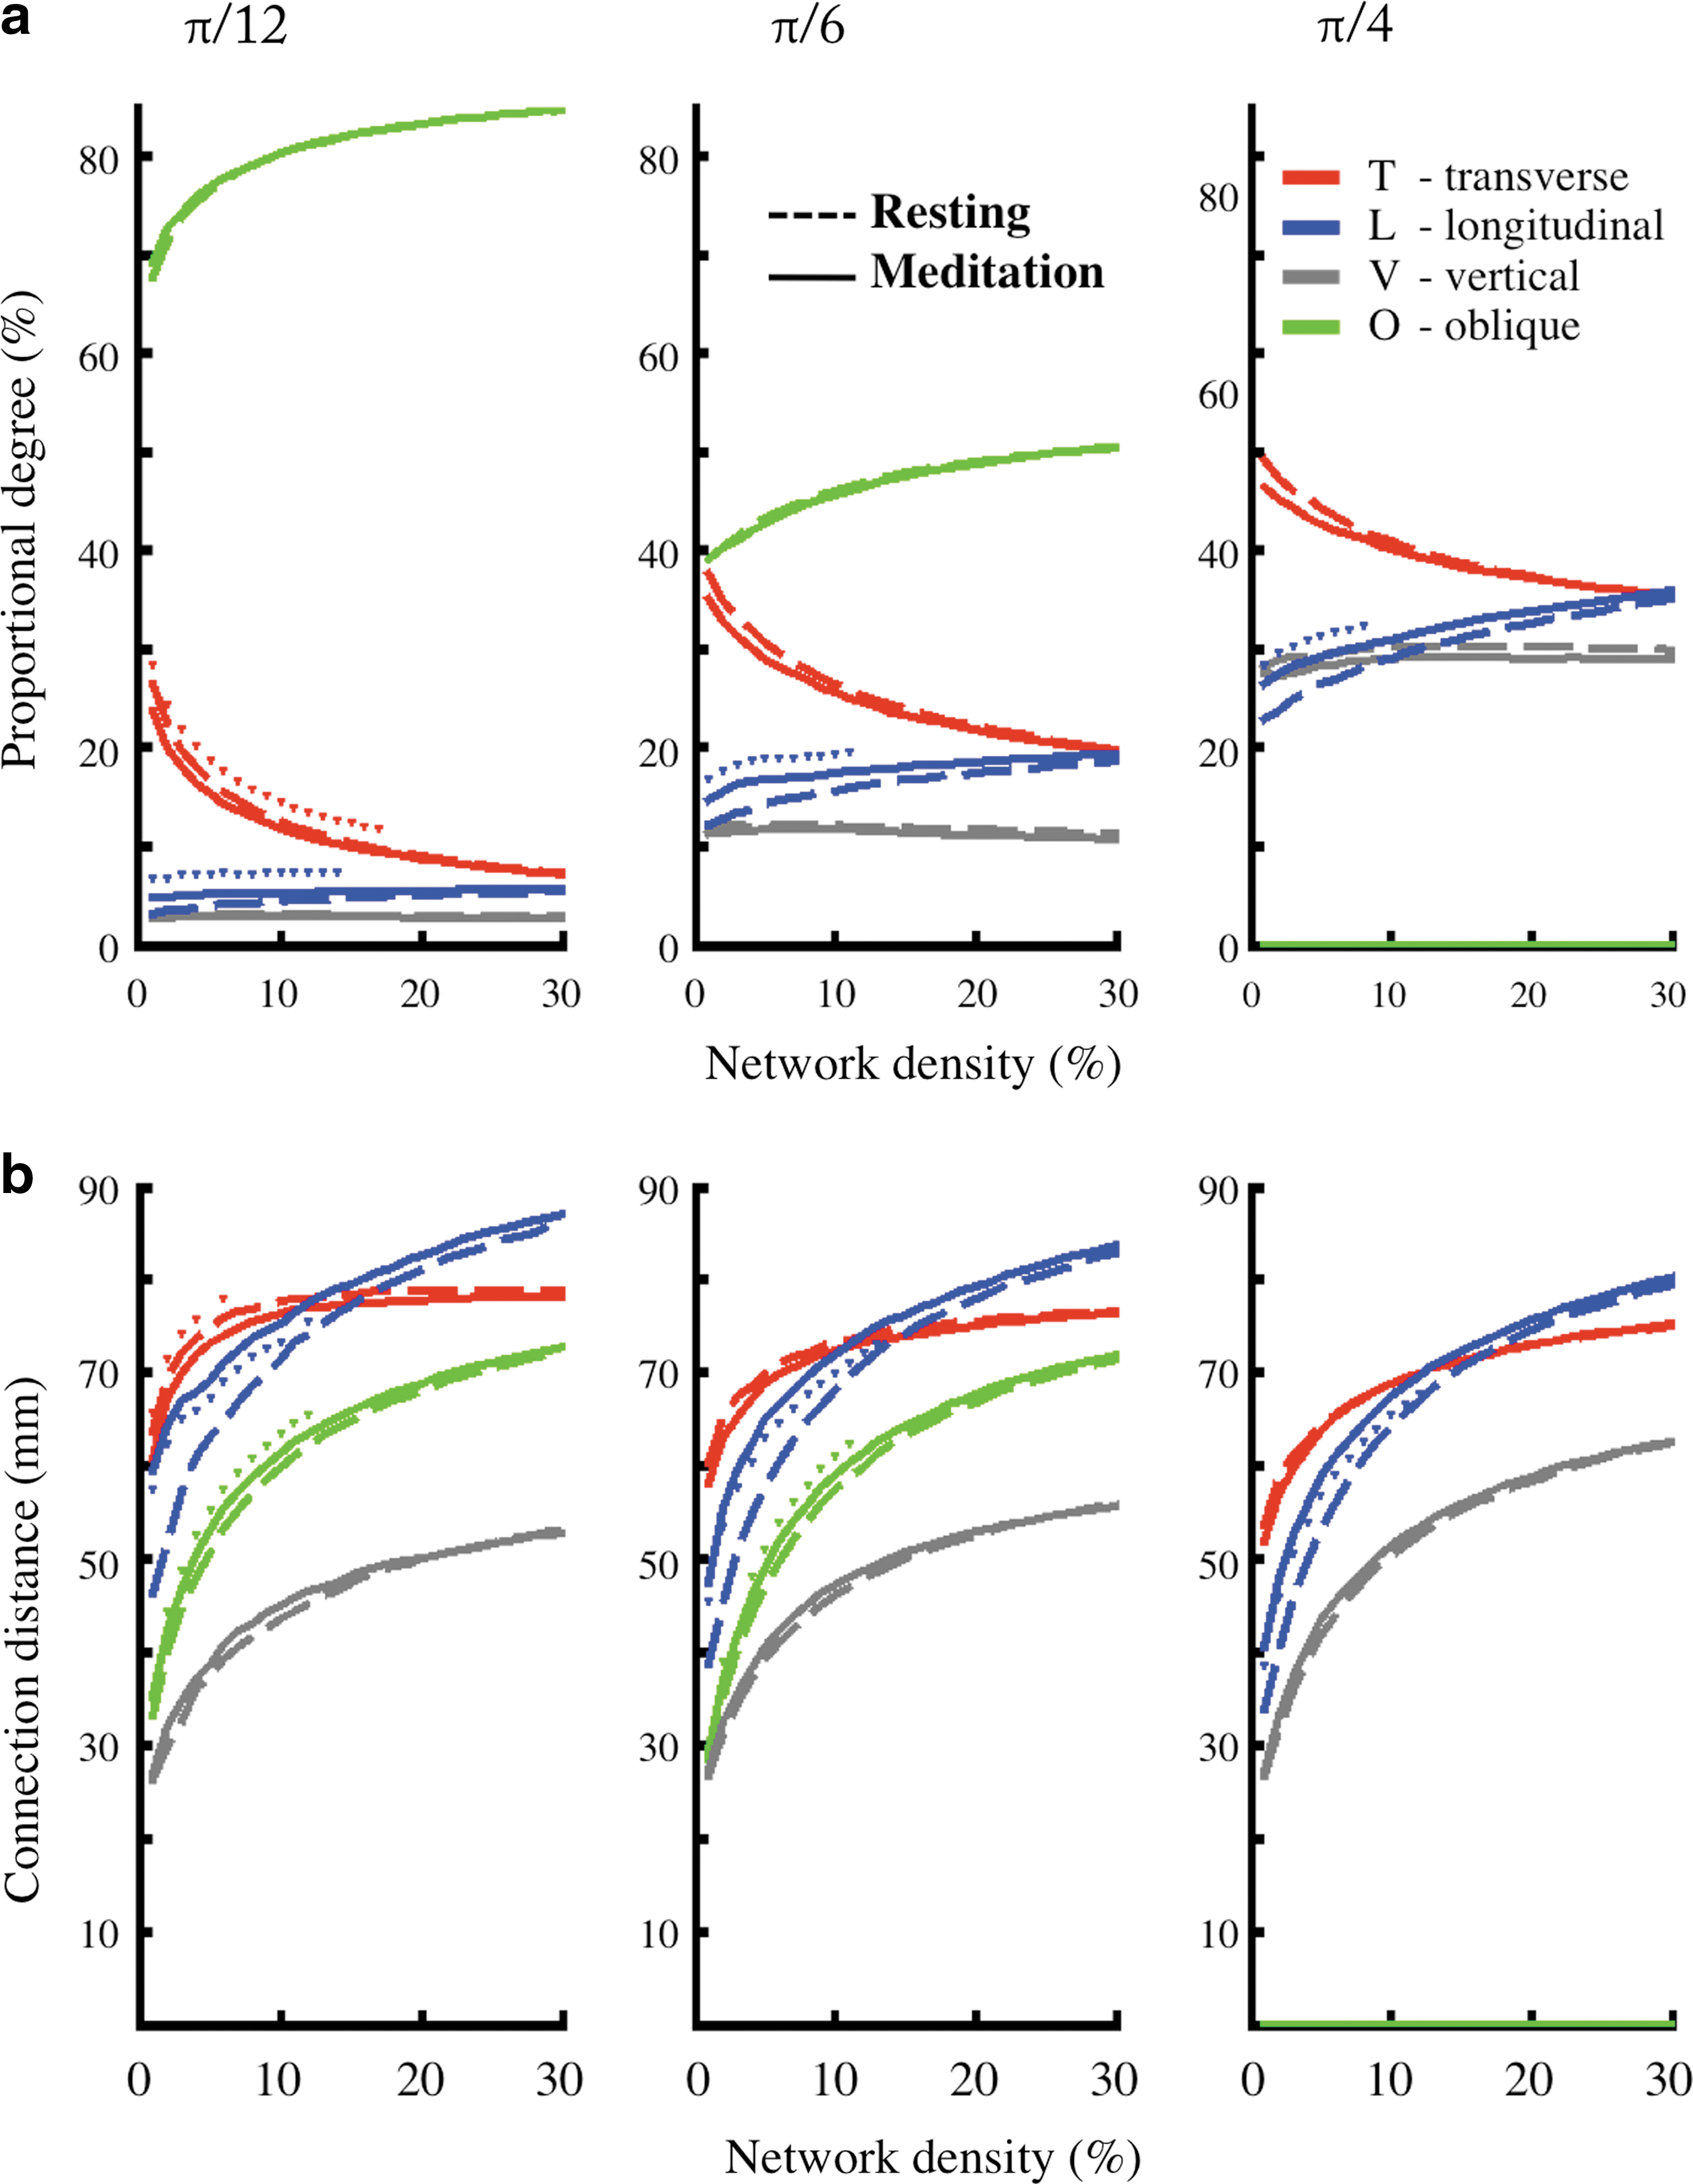
Meditation-related differences in relative degree and connection distance of transverse, longitudinal, vertical, and oblique edges. There were similar results when the angle threshold for categorization was 15°, 30°, or 45°.
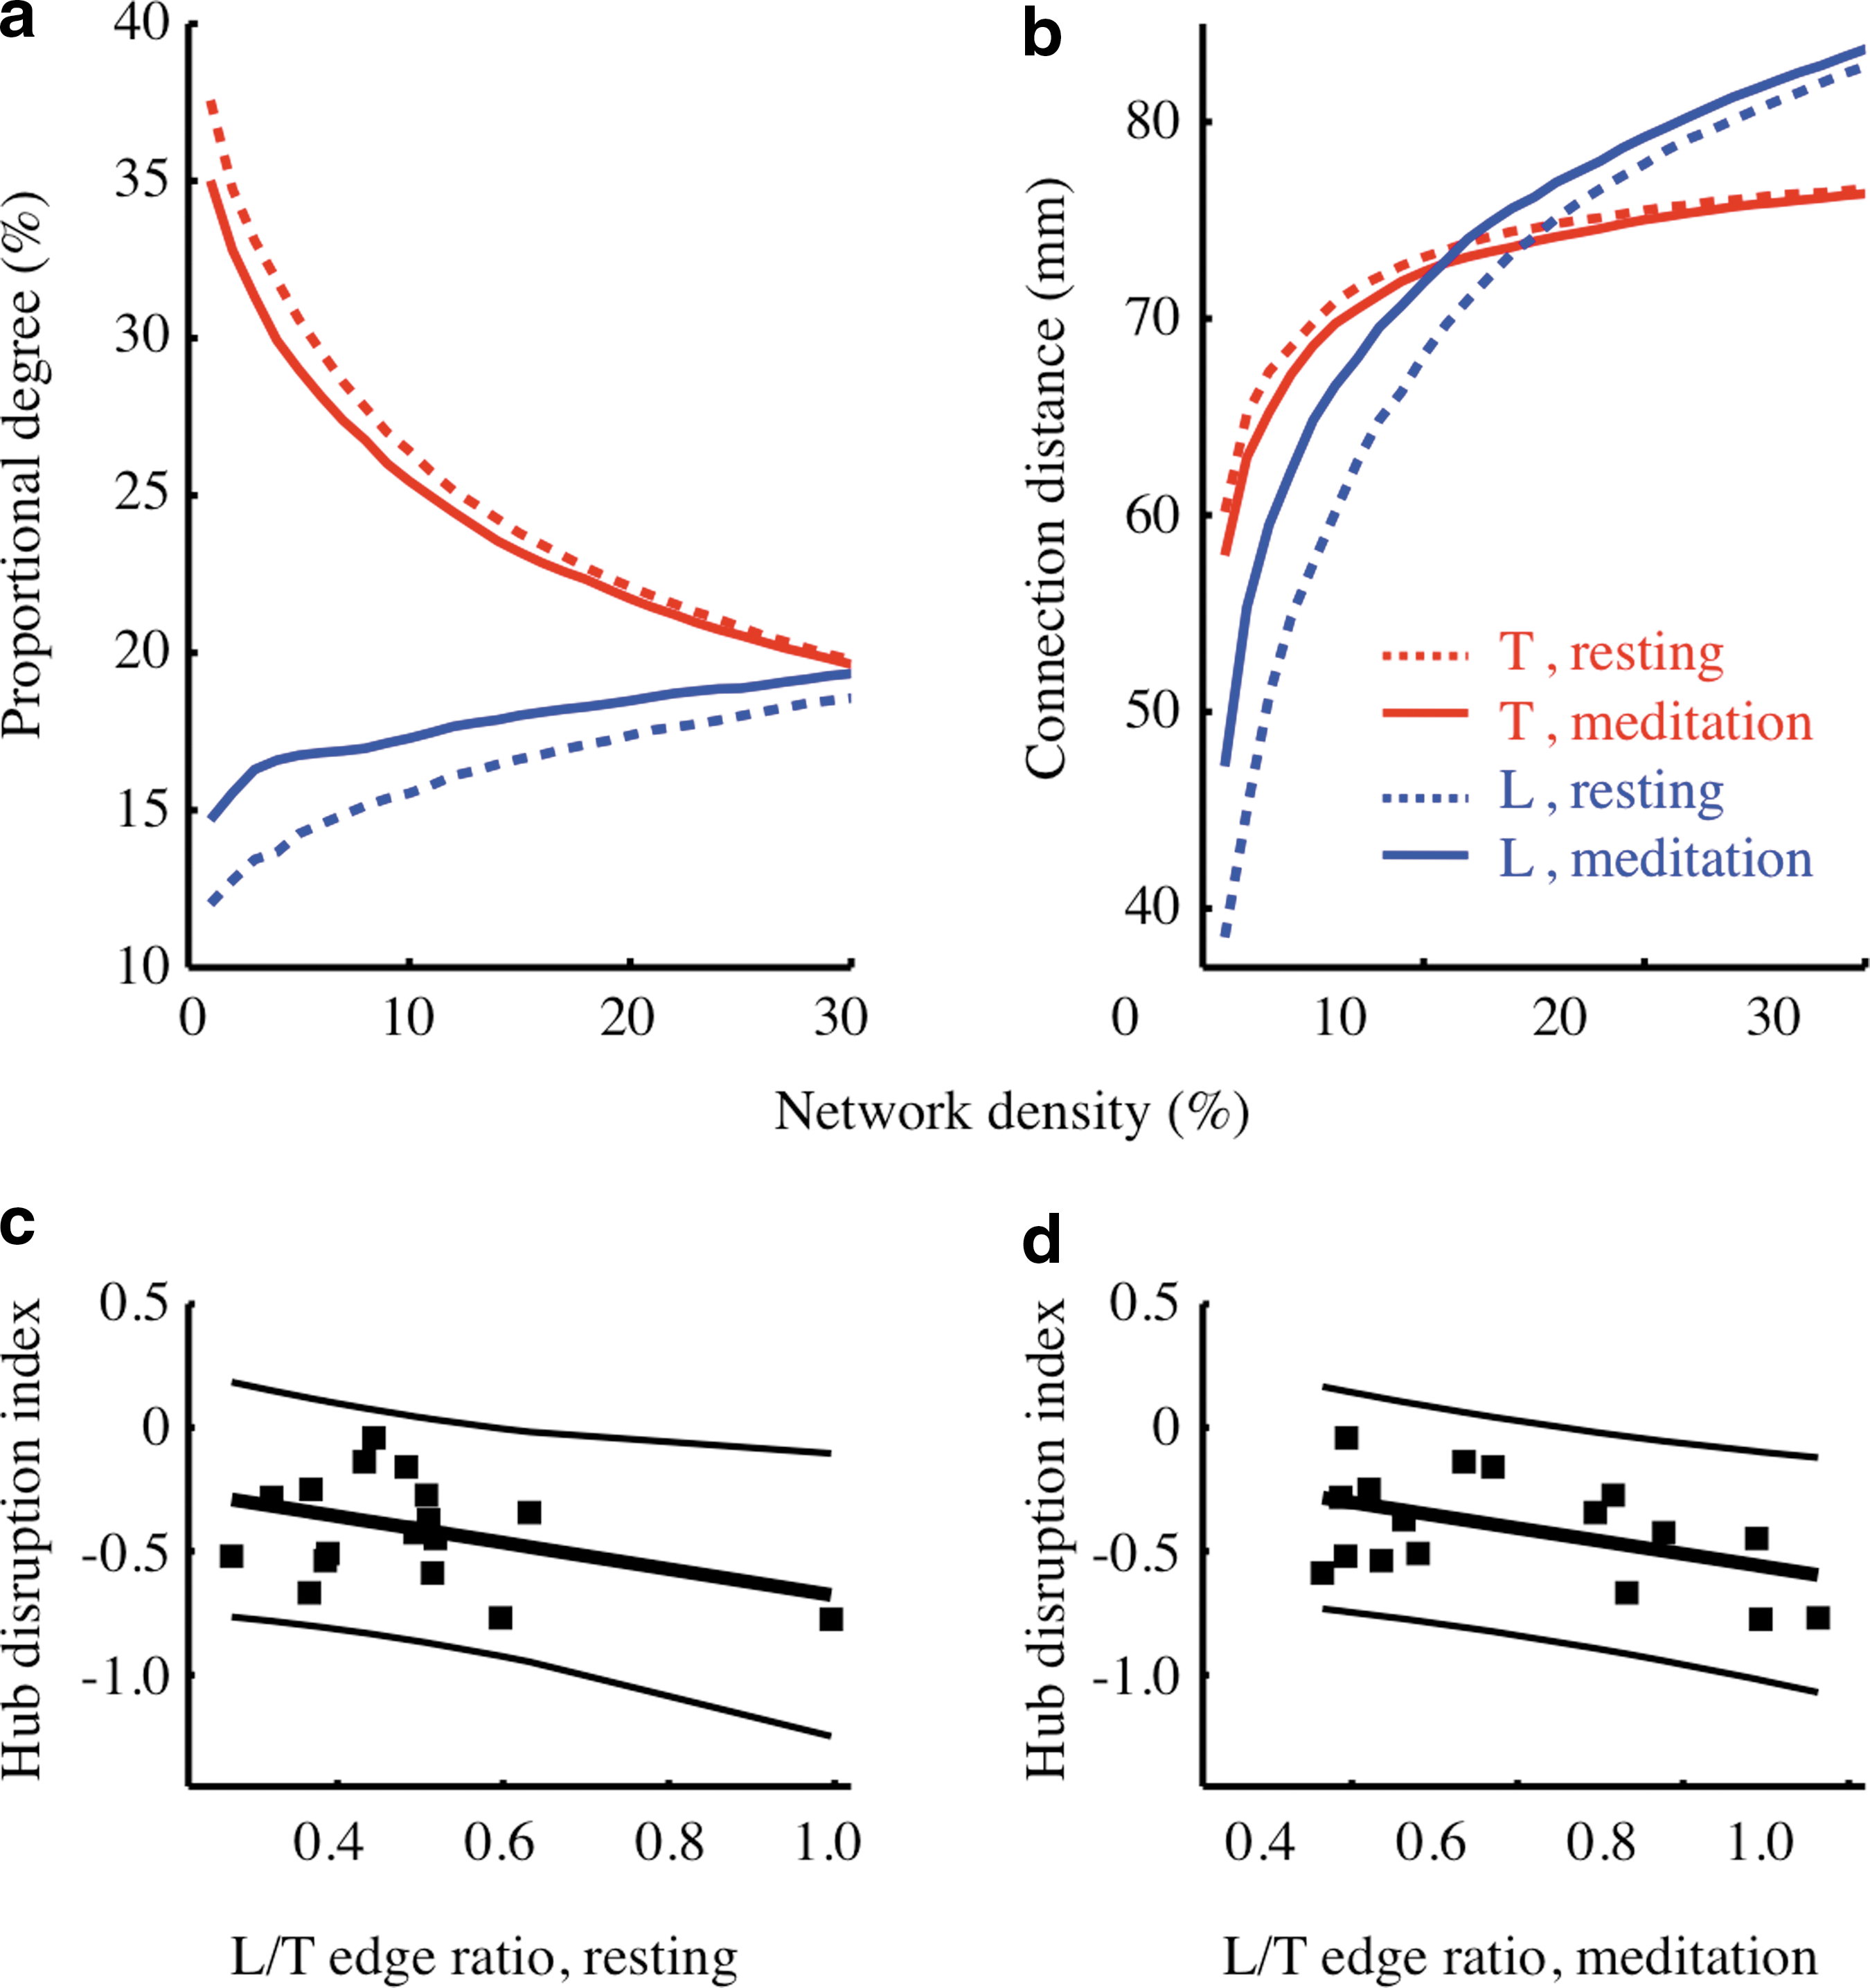
Transverse edges dominated all sparse, low connection density, functional brain networks, and long-distance longitudinal edges were added gradually with increasing connection density. Compared to the resting state at the same network density, the meditation state had fewer transverse edges and more longitudinal edges. For the meditation state in the connection density range 1–10%, there were significantly more longitudinal edges (14.2% of all edges for resting-state networks, 16.5% of all edges for meditation state networks, paired t (17) = 2.55, p = 0.02); significantly fewer transverse edges (30.7% for resting-state networks, 29.2% for meditation state networks, paired t (17) = 3.02, p = 0.01); and a significantly higher ratio of the number of longitudinal to transverse edges (0.47 for resting-state networks, 0.58 for meditation-state networks, paired t (17) = 3.03, p = 0.01) (Fig. 5a). This indicates that meditation was associated with a significant shift in orientation of functional connections toward more longitudinal orientations.
Furthermore, for the meditation state there was significant longer connection distance of longitudinal edges (56.9 mm for resting-state networks, 63.6 mm for meditation networks, paired t (17) = 2.74, p = 0.01) (Fig. 5b). The individuals that demonstrated the greatest shift toward longitudinal orientation of edges during meditation also tended to have the greatest extent of hub/non-hub reconfiguration as estimated by the hub disruption index (r (16) = −0.39, p = 0.11 for the resting state; r (16) = −0.47, p = 0.049 for the meditation state) (Fig. 5c, d). There was also a trend of positive correlation between the longitudinal to transverse edge number ratio and meditator's experience (r (16) = 0.29, p = 0.25 for the resting state; r (16) = 0.33, p = 0.18 for the meditation state). In addition, at the sparsest connection density, transverse connections accounted for the greatest percentage of total connection distance but longitudinal connections accounted for a greater proportion of connection distance at higher densities, especially in the meditation state. There were similar results when the angle threshold for categorization was 15° or 45° (Fig. 6).
To nodally locate these effects of meditation on edge orientation and distance in the context of brain anatomy and topology, we centered all edges (with their physical orientations preserved) on both of the nodes they connected. In both resting and meditation states the bilateral sensorimotor cortex and superior temporal gyri were always connected by long-range transverse edges, and there were short-range edges in all orientations; however, there were almost no long-range longitudinal or oblique edges. The most striking difference between the two states was the emergence of longitudinal long-range edges during meditation that connected anterior and posterior brain regions, specifically, the bilateral DLPFC and MPFC anteriorly and the bilateral parietal association cortex and PCC posteriorly (Fig. 7). These nodes, which had the greatest increase in longitudinal-to-transverse edge ratio during meditation, were also the nodes that showed the greatest increase in degree during meditation (r = 0.16, p = 0.0062 by permutation test).

Effect of meditation on network edge orientation at the nodal level at network density 2.5%.
Discussion
We used a within-subjects, counterbalanced resting-state fMRI experiment to explore changes in configuration of human brain functional networks associated with changes in consciousness induced by Taoist meditation. In this study, the results indicated that during meditation, there was extensive reorganization of the nodes and edges of functional brain networks, although the global topological properties of the networks were conserved. In particular, high degree hub nodes in the resting-state network tended to have lower degree in the networks measured during meditation, and vice versa. These changes in the relative importance or centrality of individual nodes were associated with changes in the distance and orientation of edges. Meditation was associated with a greater frequency of long-distance longitudinal (antero-posterior) edges; and these longitudinal edges tended to connect nodes that had increased degree during meditation.
Additionally, although this study focused on the network correlates of short-term reversible changes in meditation state, rather than the possible trait effects of long-term meditation, we found that network changes were related to individual differences between meditators. For example, the reorganization of network hubs and non-hubs, summarized by the hub disruption index, was significantly greater in individuals who had longer experience. These results echo previously reported effects of the duration of meditation practice on both cognitive performance (Brefczynski-Lewis et al., 2007; Desbordes et al., 2012; Grant et al., 2011; Hasenkamp et al., 2012; Lutz et al., 2008b; Short et al., 2010) and cerebral structure (Hölzel et al., 2008, 2011; Lazar et al., 2005; Luders et al., 2012; Pagnoni and Cekic, 2007).
Meditation reorganizes hubs/non-hubs but conserves global network topology
During resting state, the primary sensory areas of the cortex had relatively high degree and could be described as hubs. Other cortical areas, including some regions of association cortex, had relatively low degree and could therefore be described as non-hubs. This ordering of nodes in terms of their degree was disrupted, at least partially inverted, by the practice of meditation. These results are comparable to other studies that have investigated the role of primary sensory cortices during meditation. For example, PET revealed that Yoga meditative relaxation induced a reduction in the metabolic activity in primary and secondary visual centers (Herzog et al., 1990). EEG studies have shown increased amplitude modulation of alpha activity in the occipital areas during meditation (Anand et al., 1961; Banquet, 1973).
More broadly, our results indicating that the functional connectivity of primary sensory areas was significantly reduced during a meditative state may be regarded as analogous to long-standing observations on the subjective changes in mental state, for example, greater inward focus and withdrawal of attention from the external world, associated with meditation (Zelazo et al., 2007).
However, our results indicate that meditation is associated with more extensive changes than reduced connectivity to sensory cortex. In particular, other regions including the bilateral MPFC, bilateral DLPFC, bilateral insula, bilateral parietal cortex, bilateral PCC, bilateral precuneus, and bilateral thalamus all had increased nodal degree during meditation compared to resting state. Considering the nature of the DMN comprising the MPFC, PCC, precuneus, and IPL (Greicius et al., 2003; Mason et al., 2007; Raichle et al., 2001), we propose that the intentional to-do-nothing and to-think-nothing relaxation skills practiced during meditation enhance the functional connectivity within the DMN; and this observation is consistent with previous seed-based analyses (Brewer et al., 2011; Jang et al., 2011; Taylor et al., 2012).
Furthermore, it is interesting to note that key regions responsible for the three relatively independent aspects of attention, that is, thalamus (important for alerting), parietal lobe (important for orienting), and anterior cingulate and DLPFC (important for executive control) (Jin Fan et al., 2005), all became more central to the network configuration during meditation. We infer that DMN and attention networks are not always competitive and that induction of the meditative state can be associated with greater connectivity of attentional systems and the default mode system often regarded as representative of introspective or self-referential cognition (Buckner et al., 2008; Fox et al., 2005; Greicius et al., 2003).
Meditation causes changes in orientation and distance of functional connections
Our results indicate that meditation is not only associated with changes in nodal properties but also with changes in the orientation and distance of edges. Network analysis of neuroimaging data has recently focused on topological properties, such as nodal degree or small-worldness, which can be defined and calculated regardless of the physical space in which the system is embedded; nonetheless, this approach could lose important geographical information at the same time. We considered it likely that changes in consciousness induced by meditation would also be associated with changes in the physical properties of the network (Barthélemy, 2011; Sasai et al., 2011).
We focused on the distance and orientation of edges in 3D. We found that long-distance edges were predominantly orientated transversely in the resting-state condition. However, in the meditation condition, there were more long-distance edges orientated longitudinally and the ratio of longitudinal to transverse edges was significantly greater. Importantly, these changes in edge orientation could be related to changes in nodal degree. Specifically, the anterior and posterior nodes of the DMN that showed increased degree during meditation were also the nodes that were connected by the emergence of more longitudinally orientated edges during meditation. It is therefore suggested that transient changes in level of consciousness associated with meditation are associated with convergent changes in the topological and spatial properties of brain functional networks. Although network hubs and edges were different components of networks, there were correlated changes in both the degree of nodes and the orientation of edges during the meditation state.
In addition, these orthogonally crossed transverse and longitudinal edges in low-density networks possibly echo the proposed grid-like brain fiber pathways revealed by diffusion MRI (Wedeen et al., 2012), and they provide a possible backbone for the whole brain functional network. Furthermore, since the human brain consists of modular network subsystems with highly right-left symmetric organization (Crossley et al., 2013; Fornito et al., 2011; Salvador et al., 2005; Smith et al., 2009), a transition from low to high L/T edge ratio accompanying the resting state to meditation state change may suggest that during the meditation state, functional brain networks entered a less right-left connected state, that is, a state likely showing less intra-system (interhemispheric) connections.
Some studies have indicated that there might be increased interhemispheric connectivity either during the meditative state (Cahn and Polich, 2006) or in long-term meditators scanned at rest (Luders et al., 2012). Our results suggest that different meditation techniques may have diverse effects on brain connectivity. They also illustrate the advantage of a whole brain functional connectivity analysis, for example, the graph theoretical methods used in this study, over those based on certain preselected nodes, edges, or networks. On a more general methodological note, these results indicate the potential importance of considering changes in anatomical orientation of edges, and the more familiar topological metrics, in future studies of functional brain networks.
Comparison to other network studies of change in consciousness
These results are to some extent comparable to previous findings of radical reorganization of functional network hubs (and non-hubs) in patients with complete loss of consciousness or coma due to acute brain injury (Achard et al., 2012). Comatose patients, compared to healthy volunteers, also had reduced degree of normal hub nodes in sensory cortical areas, and increased degree of nodes that were not normally hubs in parietal cortex and other areas. It was also notable that the global topological properties of brain networks, such as small-worldness, were not significantly abnormal in comatose patients.
Taken together with the current findings, this suggests that changes in level of consciousness might generally be associated with disruption in the rank ordering of nodal degree (or, more generally, nodal centrality). However, it appears that many global aspects of brain network topology remain remarkably constant at different levels of consciousness indicating that these aspects of brain network organization are unlikely to provide a sufficient explanation for the emergence of consciousness (Achard et al., 2012). However, we note that one previous seed-based fMRI resting-state study of meditation has reported changes of global network topology. Xue et al. (2011) reported that there was increased nodal efficiency and nodal degree (p < 0.05 uncorrected) of the left anterior cingulate cortex for subjects experiencing short-term IBMT.
This pattern of findings also suggests that the “anatomical pattern of integration” might be as important as “global level of integration” (Casali et al., 2013; Laureys, 2005; Tononi and Edelman, 1998) when considering the network basis for human consciousness. That is, a single region (node) or pathway (edge) will probably be insufficient to explain dynamic changes in level of consciousness, which may be more completely determined by extensive reorganization of the topological and physical configuration of a large number of nodes and edges.
Methodological considerations
Meditation has usually been studied with a relatively small sample size and with neither within-subjects nor counterbalanced designs (Sperduti et al., 2012; Tomasino et al., 2013), and this may have limited the statistical power of studies. We preferred our experimental design for two reasons. First, we considered that a within-subjects comparison, whereby each subject was scanned under both resting state and meditation conditions, was likely to be more powerful because it more naturally controls for trait-like individual differences. Second, we considered that counterbalancing the order of presentation of the two conditions was important to control for possible non-specific time-dependent effects on brain function (Yan et al., 2009) and to avoid disadvantages of standard repeated measures designs (Harris, 2008; Pollatsek and Well, 1995).
Some methodological limitations of this study should also be mentioned. First, although meditation has been related to various kinds of cognitive, physiological, and brain structural changes, there has not been a standard way to verify a meditation state, not to mention that there is a vast spectrum of discrete types of meditation. Moreover, the issue regarding investigating the nature of meditation could not theoretically be solved by adding either a control or an active control group. Mediation is probably, to some extent, a special kind of mental exercise; therefore, we presume it is not wrong to say that we did observe the differences between resting state and a very specific cognitive task. In this study, we relied on subjective reports from meditators. In future studies it would be interesting to include more objective markers of depth of meditation and to include, for example, a cognitively demanding control task (like mental arithmetic) to assess the specificity of network changes to meditation rather than cognitively active states more generally.
Second, the conditions of fMRI scanning, which involve lying down in a constrained and noisy environment, would usually be regarded unsuitable for the practice of meditation. However, it may be that the more experienced and expert meditators were better able to cope with these demanding conditions and this may partly explain the greater extent of network changes associated with greater experience of meditation. Third, it is possible that confounding factors such as sleep quality or fatigue may have confounded the effects of meditation. However, we used a within-subjects design to minimize the impact of potentially confounding individual factors. Moreover, although the within-subjects design in this study increased statistical power to detect meditation state-related differences in network organization, the lack of data on healthy volunteers (non-meditators) constrains our interpretation of state-related changes in relation to possible trait-like differences between the network organization of meditators and non-meditators.
Finally, considering the fact that there are indeed many different kinds of meditation techniques and objectives, it may be that our results based on Taoist meditation techniques do not generalize to all other meditation practices.
Footnotes
Acknowledgments
This research was funded by the National Science Council (NSC 97-2321-B-002-044), Taiwan. The Behavioral and Clinical Neuroscience Institute is supported by the Medical Research Council and the Wellcome Trust. T.J. is supported by the Ministry of Education, Taiwan. P.E.V. is supported by the Medical Research Council (Grant No. MR/K020706/1). We would also like to thank Dr. Changwei Hsieh for his helpful discussions on experimental design.
Author Disclosure Statement
E.T.B. is employed half-time by the University of Cambridge and half-time by GlaxoSmithKline; he holds stock in GSK.