
Abstract
Both fluorine-18-labeled fluorodeoxyglucose ([18F]FDG) positron emission tomography, examining glucose metabolism, and resting-state functional magnetic resonance imaging (rs-fMRI), using covarying blood oxygen levels, can be used to explore neuronal dysfunction in Alzheimer's disease (AD). Both measures are reported to identify similar brain regions affected in AD patients. The spatial overlap and association of [18F]FDG with rs-fMRI in AD patients and controls were examined to investigate whether these two measures are associated, and if so, to what extent. For 24 AD patients and 18 controls, [18F]FDG and rs-fMRI data were available. [18F]FDG standardized uptake value ratios (SUVr), with cerebellar gray matter (GM) as reference tissue, were calculated. Eigenvector centrality (EC) mapping was used to spatially analyze the functional brain network. Group differences were calculated for [18F]FDG and eigenvector centrality mapping (ECM) values in four cortical regions (occipital, parietal, frontal, and temporal) and across voxels, with age, gender, and GM as covariates. Correlation of [18F]FDG with ECM was calculated within groups. Both lowered [18F]FDG SUVr and EC values were seen in the parietal and occipital cortex of AD patients. However, [18F]FDG yielded more robust and widespread brain areas affected in AD patients; hypometabolism was also observed in the temporal cortex and regions within frontal brain areas. Poor spatial overlap of both measures was observed. No associations were found between local [18F]FDG SUVr and ECM. In conclusion, agreement of [18F]FDG and ECM in AD patients seems moderate at best. [18F]FDG was most accurate in distinguishing AD patients from controls.
Introduction
Neuronal dysfunction is of interest in Alzheimer's disease (AD), as it occurs before neuronal loss and is thought to have a similar temporal pattern as cognitive decline (Jack et al., 2013). Two methods have been widely used to investigate neuronal dysfunction in AD: (1) positron emission tomography (PET), which measures glucose metabolism with fluorine-18-labeled fluorodeoxyglucose ([18F]FDG); (2) functional magnetic resonance imaging (fMRI), which measures the blood oxygen-level-dependent (BOLD) contrast, to explore local neuronal dysfunction and functional connectivity between (remote) brain areas.
[18F]FDG PET is useful in clinical practice (Silverman et al., 2001). With [18F]FDG PET, reduced metabolism not only in the precuneus and bilateral parietal cortex (Chetelat et al., 2006; Li et al., 2008) but also in frontal and parietotemporal areas has frequently been observed in AD patients (Dukart et al., 2013; Mosconi et al., 2006). For resting-state functional magnetic resonance imaging (rs-fMRI), patterns of covarying activity in spatially distinct brain regions, referred to as functional connectivity (Biswal et al., 2010), are believed to be more sensitive to the disease state than simple measures of fMRI-BOLD complexity.
Many studies have shown reduced functional connectivity in AD patients (Binnewijzend et al., 2011; Damoiseaux et al., 2012; Greicius et al., 2004; Rombouts et al., 2009), particularly in the precuneus and bilateral parietal cortex. As such, functional connectivity can provide an alternative method to [18F]FDG PET for assessment of neuronal damage in AD. Several techniques can be used to examine functional connectivity. It has been shown that eigenvector centrality (EC) can easily be computed from rs-fMRI data (Wink et al., 2012) and that it is robust against global physiological effects (Lohmann et al., 2010). Furthermore, eigenvector centrality mapping (ECM) does not require a-priori knowledge and provides voxel-wise information (similar to [18F]FDG).
It has been shown that [18F]FDG and rs-fMRI identify similar regions in AD and they are reported to be linked, although only a few studies have examined this association in AD patients directly (Di and Biswal, 2012; Drzezga et al., 2011; Wehrl et al., 2013). If a strong connection exists, both methods could be interchangeable in AD. Using rs-fMRI instead of [18F]FDG is less invasive and reduces costs. A study by Drzezga and colleagues (2011) found good spatial overlap of hypometabolism and lowered functional connectivity in mild cognitive impairment (MCI) patients compared with controls in the precuneus, which was correlated across subjects. The authors reasoned that these findings support a causal mechanism between synaptic failure and functional disconnection. Other studies examining this association have focused mainly on functional connectivity of [18F]FDG and its corresponding rs-fMRI functional connectivity (Di and Biswal, 2012; Wehrl et al., 2013).
The aim of this study was to investigate whether both imaging modalities provide similar information in AD patients. First, we will examine if similar brain regions are identified when comparing AD patients to controls using [18F]FDG and ECM in four cortical regions (occipital, parietal, frontal, and temporal) and in a voxel-wise manner. Second, we will examine the direct association between [18F]FDG and ECM in a correlation analysis. It is expected that the precuneus and other parietal regions are identified with both [18F]FDG and ECM and that associations are strongest within the disease-affected parietal cortex.
Materials and Methods
Participants
All participants underwent a standard dementia screening, which included a record of their medical history, neuropsychological testing, physical and neurological examinations, structural MRI, and screening laboratory tests. Subjects represent a subset of individuals whose fMRI data and [11C]PIB PET data were previously reported (Adriaanse et al., 2014). The combination of [18F]FDG with fMRI data has not been reported earlier. Patients were excluded when they had a history of major psychiatric or neurological illness other than AD, used nonsteroidal anti-inflammatory drugs, or showed clinically significant abnormalities other than AD on the MRI scan, as determined by a neuroradiologist. The mini mental state examination (MMSE) was part of neuropsychological testing (Folstein et al., 1983). Clinical diagnosis was established by a multidisciplinary team. Twenty-four patients were diagnosed with probable AD (McKhann et al., 2011) and were compared with an elderly control group of patients (n = 18) who were recruited through advertisements of newspapers and underwent the same diagnostic procedure. Additional exclusion criteria for normal controls were subjective complaints or a history of major neurological or psychiatric illness. The study was approved by the Medical Ethics Review Committee of the VU University Medical Center. Ethics review criteria conformed to the Helsinki declaration. Written informed consent was obtained from subjects and/or subjects' caregivers after a complete written and verbal description of the study.
Magnetic resonance acquisition
MRI scans of all subjects were acquired using a 1.5 Tesla Sonata scanner (Siemens Medical Solutions, Erlangen, Germany). These scans included a coronal, T1-weighted, three-dimensional, magnetization-prepared rapid-acquisition gradient echo image (echo time 3.97 ms; repetition time 2700 ms; inversion time 950 ms; flip angle 8°; 160 coronal slices; voxel size 1 × 1.5 × 1 mm3) and resting-state functional scans of 200 T2*-weighted echo planar imaging volumes (TR = 2850 ms; TE = 60 ms; flip angle = 90°; voxel size 3.3 mm isotropic). Subjects were instructed to lie still with their eyes closed and not to fall asleep during the resting-state scan.
[18F]FDG PET acquisition
[18F]FDG scans were acquired using an ECAT EXACT HR+ scanner (Siemens/CTI, Knoxville, TN). The properties of this scanner have been reported elsewhere (Brix et al., 1997). A head holder was used to restrict head movement, which was checked on a regular basis using external laser beams. For the [18F]FDG scan, subjects rested for 10 min with their eyes closed in a dimly lit room with minimal background noise before ∼185 MBq [18F]FDG was injected. Thirty-five min later, patients underwent a 10-min transmission scan followed by a 15-min (static) emission scan. Further details of [18F]FDG scanning can be found elsewhere (Ossenkoppele et al., 2012). PET sinograms of both scans were corrected for dead time, tissue attenuation using the transmission scan, decay, scatter, and randoms. Next, images were reconstructed with a standard filtered backprojection algorithm using a Hanning filter with a cutoff at 0.5 times the Nyquist frequency, resulting in a spatial resolution of 7 mm full width at half maximum (FWHM) at the center of field of view (Boellaard et al., 2001). A zoom factor of two and a matrix size of 256 × 256 × 63 resulted in a voxel size of 1.2 × 1.2 × 2.4 mm3.
Structural magnetic resonance analyses
All MRI analyses were performed using FMRIB Software (FSL 5.0.4
fMRI analysis
Preprocessing in FSL included motion correction, spatial smoothing using a 7 mm Gaussian kernel to match the [18F]FDG data, high-pass temporal filtering (0.01 Hz), removal of nonbrain tissue, and coregistration to standard space (MNI152) through the T1-weighted image. EC was calculated using in-house fast-ECM software (Wink et al., 2012;
PET data analysis
Structural MRI T1 images were rigidly aligned to corresponding PET images using a mutual information algorithm (Maes et al., 1997). [18F]FDG scans were analyzed using PVE-lab, a software program that makes use of a probability map based on 35 defined regions of interest (ROIs) (Svarer et al., 2005). Parametric images of standardized uptake value ratios (SUVr), using cerebellar GM as reference, were generated. Cerebellar glucose metabolism is relatively preserved in AD, and therefore, cerebellar GM was chosen as reference tissue for analysis. Partial volume effects could lead to an underestimation of [18F]FDG SUVr (Fazio and Perani, 2000). However, correction using standard partial volume correction (PVC) methods is highly dependent on the actual method being used, as many uncertainties may affect accuracy and precision of (MRI based) PVCs (Nissen et al., 2012). Therefore, PVC was not incorporated in the present study. Subjects' [18F]FDG SUVr images were normalized to standard MNI152 2 mm space using FLIRT (part of FSL;
Group comparisons
All subsequent group comparisons and correlations were performed within the rs-fMRI mask described in the fMRI analysis section. Average [18F]FDG SUVr and ECM values within the following four cortical ROIs were calculated: occipital cortex, parietal cortex, frontal cortex, and temporal cortex, all based on the MNI structural atlas (provided in FSL;
Dice similarity coefficient
To quantitatively assess the spatial similarity between changes in [18F]FDG SUVr and ECM in AD patients versus controls, the dice similarity coefficient (DSC) was calculated. The DSC was calculated for both group comparisons mentioned in the Group Comparisons section: for the voxels resulting from the statistical comparison and from the simple group subtraction maps. The DSC measures overlap between two segmentations (A and B) and are defined as DSC(A,B) =2(A∩B)/(A+B), where ∩ is the intersection (Zou et al., 2004). A DSC of 0 represents no overlap and 1 represents perfect overlap.
Nonimaging statistics
All other statistical analyses were performed using SPSS (version 20.0; SPSS, Chicago, IL). Age and MMSE score were compared between groups using an independent t-test. Distribution of gender between groups was compared using a chi-square test. Mean [18F]FDG SUVr and EC values in the four ROIs were compared between AD patients and controls with age and sex as covariates using analysis of covariance. Pearson correlations of [18F]FDG SUVr with ECM within the four ROIs were calculated within groups. Pearson correlations were calculated for [18F]FDG SUVr and ECM values with the MMSE score. Finally, receiver operating characteristics (ROC) curves, with regional [18F]FDG SUVr and EC values in AD patients and controls, were calculated. The area under the curve (AUC) was used to assess accuracy of both methods in distinguishing between AD patients and controls. A p value below 0.05 was considered statistically significant.
Results
Combined [18F]FDG and rs-fMRI data of 24 AD patients and 18 controls were available. As expected, MMSE scores were significantly lower in AD patients than in controls (t(40) = 11.09, p < 0.01). Age was also lower in AD patients (t(40) = 2.28, p < 0.05). An overview of demographic variables is given in Table 1.
Subject Characteristics
Data are presented as means ± standard deviations. Mean [18F]FDG SUVr and EC values were corrected for age and sex. MMSE score = Mini mental state examination score (Folstein et al., 1983).
[18F]FDG, fluorine-18-labeled fluorodeoxyglucose; AD, Alzheimer's disease; EC, eigenvector centrality; SUVr, standardized uptake value ratios.
Regional [18F]FDG and ECM in a group comparison
Mean [18F]FDG SUVr in the parietal (p < 0.01), temporal (p < 0.01), and occipital cortex (p < 0.05) was significantly lower in AD patients compared to controls. Mean EC values in the occipital (p < 0.05) and parietal cortex (p < 0.05) were significantly lower in AD patients (Table 1). In AD patients, higher mean EC values in the frontal and temporal cortex were observed compared to controls, but these increases were not significant.
Voxel-wise [18F]FDG and ECM in a group comparison
Significantly lower [18F]FDG SUVr and EC values in AD patients compared to controls were observed (Fig. 1). [18F]FDG showed the largest group differences, with AD patients having lower [18F]FDG SUVr in the bilateral parietal cortex, precuneus, temporal cortex, and small areas in the bilateral occipital and medial frontal cortex. For ECM, lower EC values in AD patients were seen in left medial occipital cortex and left inferior temporal gyrus. The areas of [18F]FDG SUVr and ECM identified in the group comparison showed almost no overlap, which was confirmed by a DC of 0.01. No significant voxels with higher EC values or higher [18F]FDG SUVr were observed in AD patients compared to controls. Figure 1B shows the spatial overlap of lower [18F]FDG SUVr and lower EC values in AD patients compared to controls when no statistical threshold was used (subtraction maps). Overlap was seen in several cortical areas and was not only most pronounced in the parietal cortex but also in superior temporal cortex and medial frontal regions. This spatial overlap corresponded to a DC of 0.58. For an overview of the number of voxels and the intersection, see Table 2.
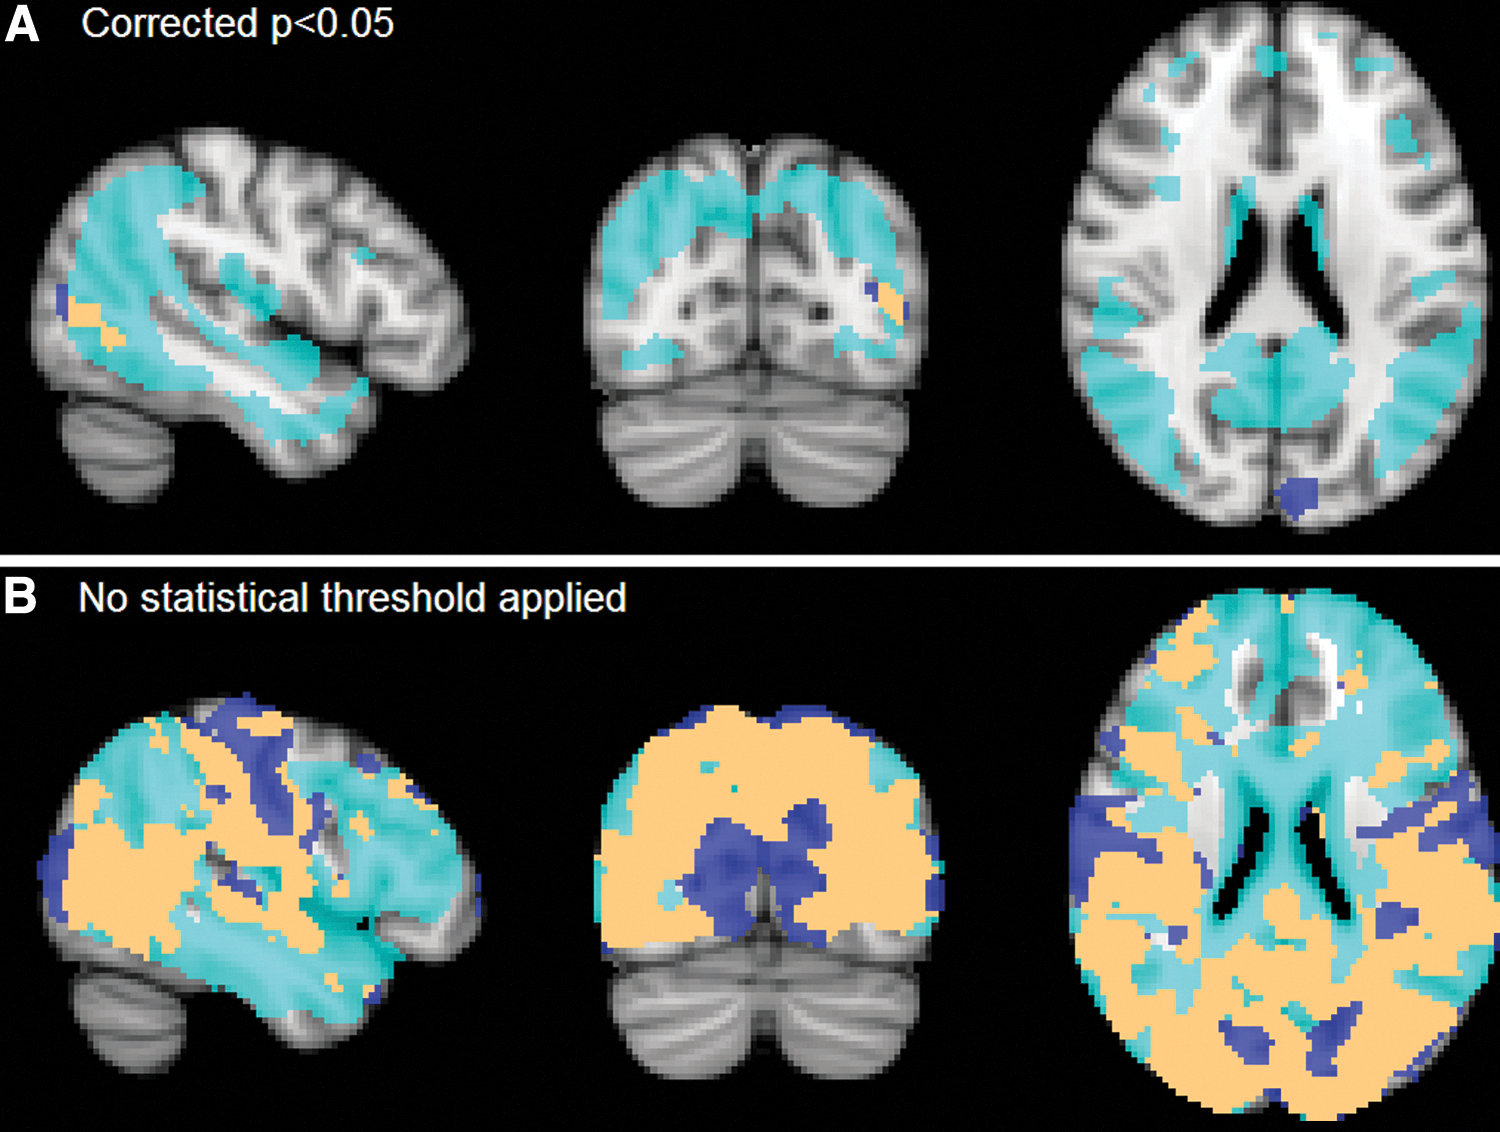
Lower [18F]FDG SUVr and ECM values were found in AD patients compared to controls. Two analyses were performed: top images
Dice Similarity Coefficients and Number of Voxels of Lowered [18F]FDG SUVr and EC Values in AD Patients and the Overlap
Total no. of voxels included was 194440.
ECM, eigenvector centrality mapping; FWE, family-wise error.
Correlation of [18F]FDG with ECM
No significant correlations between [18F]FDG SUVr and ECM values were found within the four cortical ROIs. Scatterplots showing the associations between the two measurements are displayed in Figure 2.
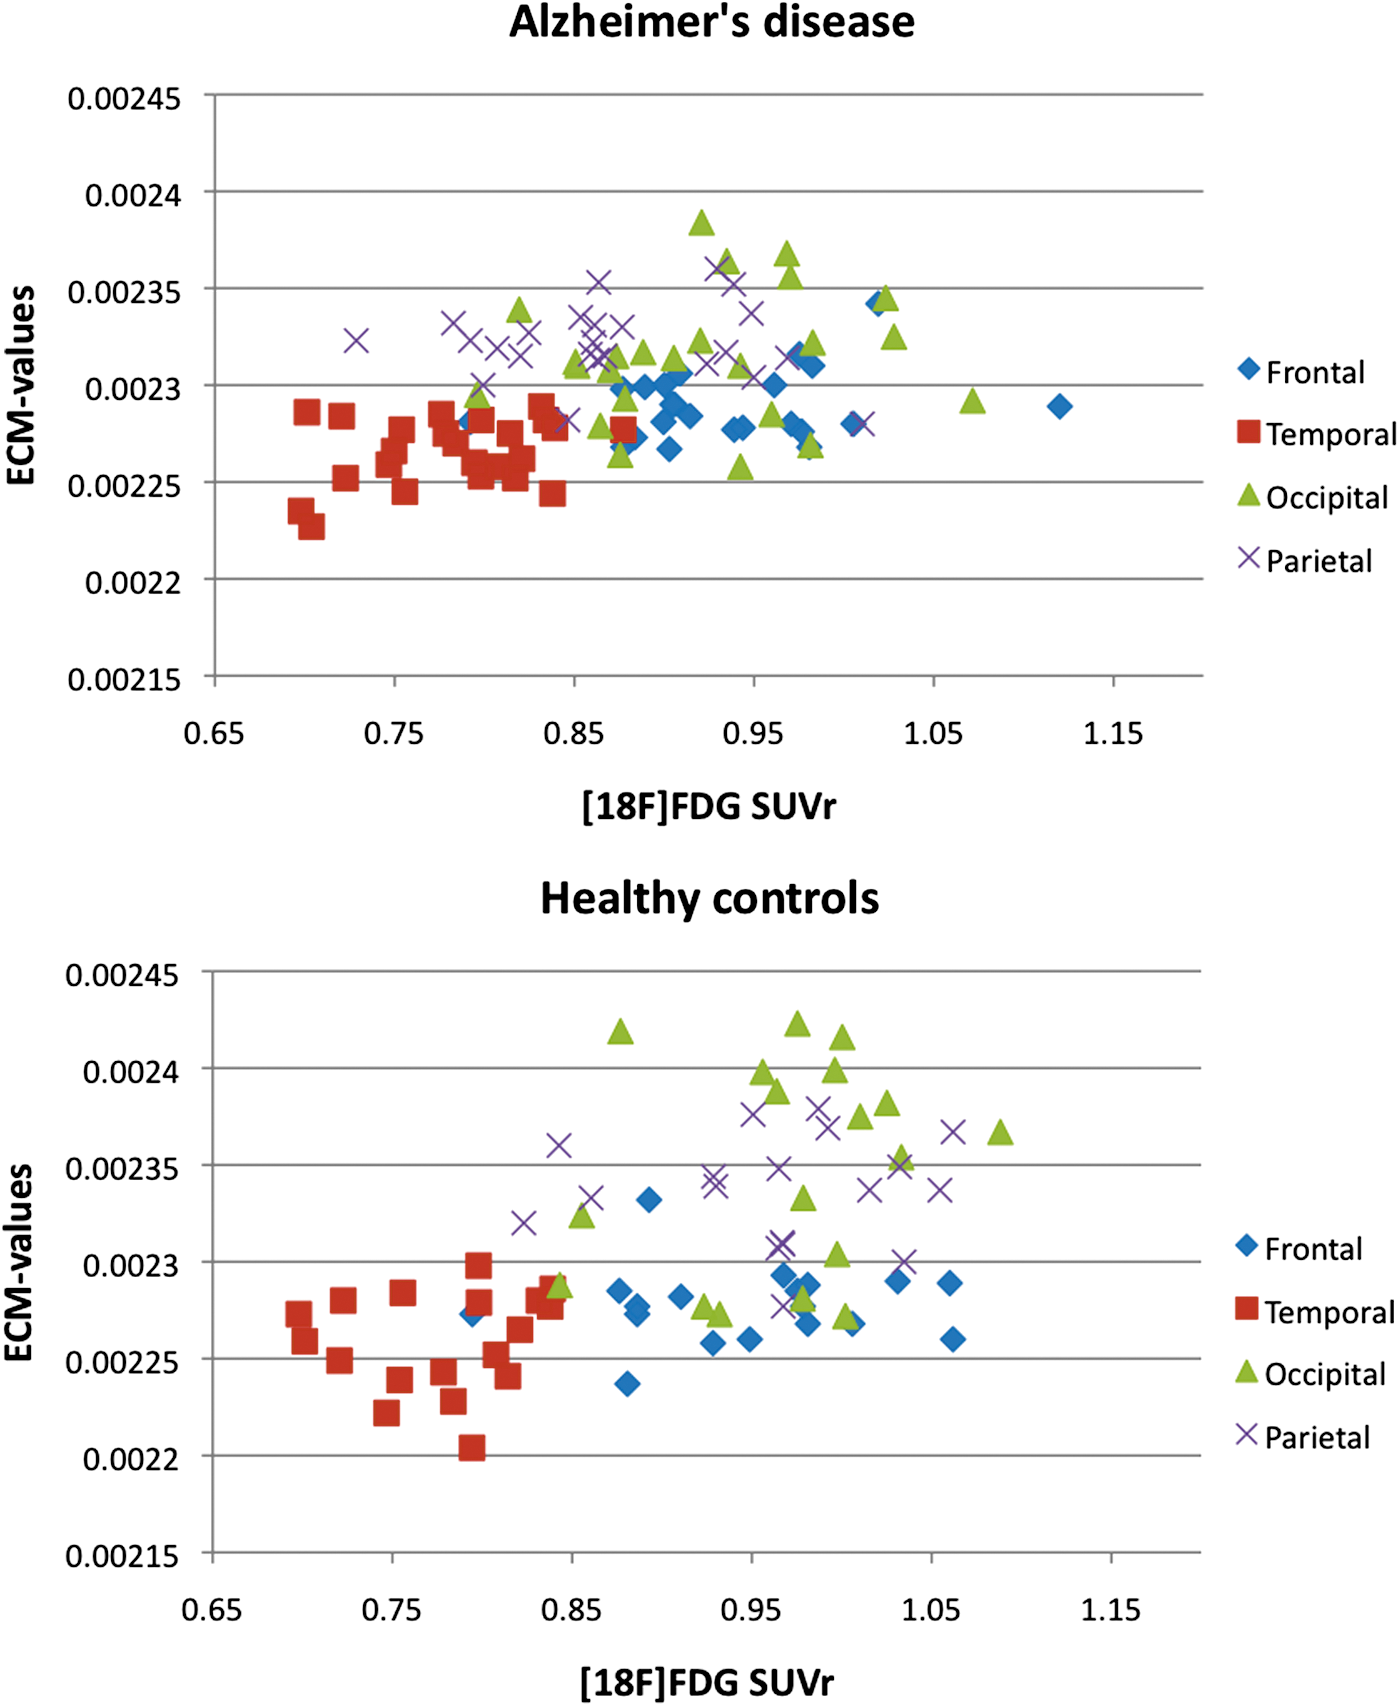
Scatterplots showing the association of mean [18F]FDG SUVr (x-axis) with mean EC values (y-axis) in parietal, occipital, temporal, and frontal cortex. Top image shows the association in AD patients, and lower image the association in healthy elderly controls. EC, eigenvector centrality. Color images available online at
Correlation of [18F]FDG and ECM with global cognitive performance
MMSE scores of healthy controls ranged from 28 to 30 and, because of this narrow range, were not included in this analysis. Neither [18F]FDG SUVr nor EC values in the four ROIs showed a significant correlation with MMSE score in AD patients.
Receiver operating characteristics
ROC curves were calculated for [18F]FDG SUVr in the parietal and temporal cortex and for EC values in parietal and occipital cortex, that is, the regions where strongest group differences were found (Fig. 3). AUC was good for [18F]FDG SUVr when combining mean parietal and temporal measurements (0.85). Poor accuracy was found for EC values in the parietal and occipital cortex combined (0.69).
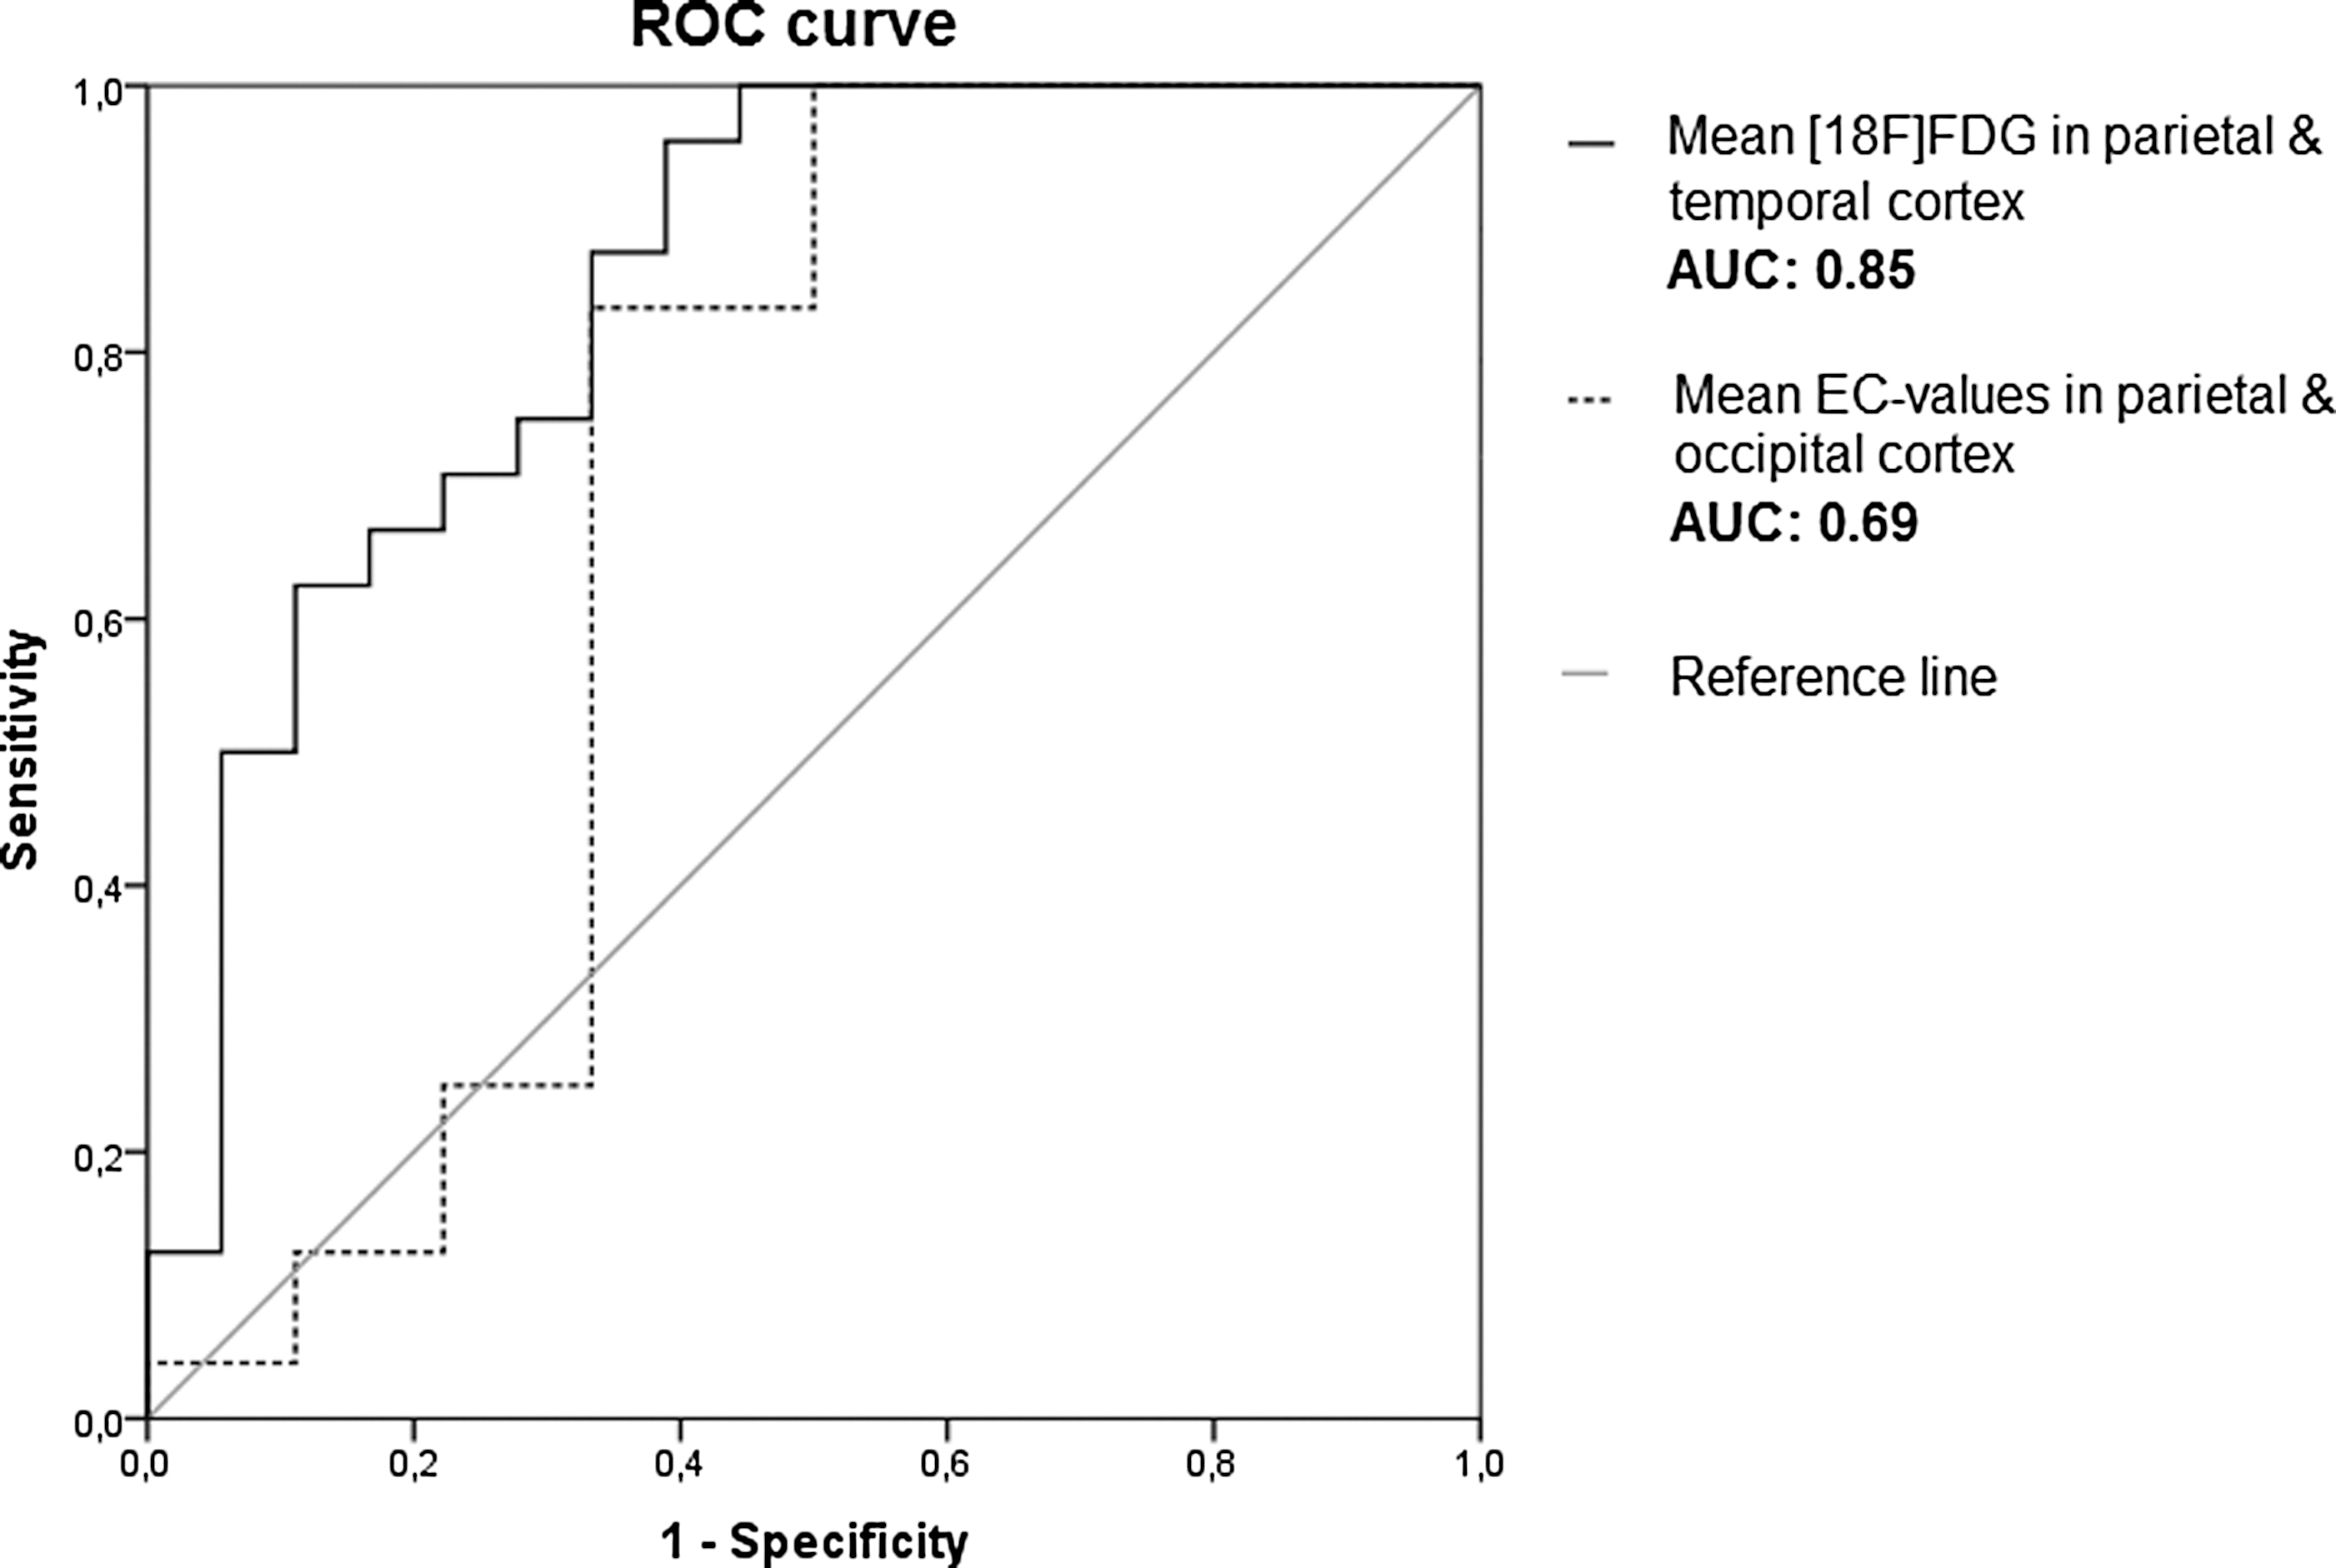
Receiver operating characteristic curves for mean [18F]FDG SUVr in the parietal and occipital cortex and for mean ECM values in the parietal and temporal cortex. AUC, area under the curve.
Discussion
The main finding of this study is that although [18F]FDG and ECM both showed AD-related deficits in the parietal and occipital cortex, these techniques showed poor agreement in other cortical areas across the brain. Hypometabolism was more widespread than lowered centrality, including temporal cortex and small regions of the frontal cortex as well. In addition, no correlation between local [18F]FDG SUVr and ECM was found.
Regions known to be susceptible to reduced metabolism in AD patients were replicated in both regional and voxel-wise analyses. Lower [18F]FDG SUVr was seen in three of the four ROIs, that is, parietal, occipital, and temporal cortex. The voxel-wise analysis revealed more detail with lower [18F]FDG SUVr in AD patients being found in bilateral parietal cortex, posterior cingulate cortex, precuneus, bilateral occipital cortex, medial frontal cortex, and medial temporal areas, which is in line with previous research (Drzezga et al., 2011; Li et al., 2008; Mosconi et al., 2006). [18F]FDG in the parietal and temporal cortex performed best in distinguishing AD patients from controls, with a very good accuracy of 0.85. This is in agreement with the clinical applicability of [18F]FDG (Silverman et al., 2001). ECM, at present, does not seem suitable for clinical purposes, as accuracy to distinguish patients from controls is poor (0.69). This could possibly be enhanced with new methods such as multivariate voxel-based classification approaches. However, when examining group differences on a voxel level with ECM, smaller regions compared to [18F]FDG were identified; lower centrality in AD patients was seen in the occipital cortex, replicating previous findings from our group (Binnewijzend et al., 2014).
In the ROI analysis, lowered EC values were found in two regions, that is, the occipital and in the parietal cortex. The occipital cortex together with the parietal cortex has been reported with highest centrality values for fMRI data in controls (Binnewijzend et al., 2014; Lohmann et al., 2010; Tomasi et al., 2013). High centrality in the parietal/occipital cortex agrees with the role of these brain regions as a hub within the healthy functional brain network, especially the precuneus that has many connections to other brain regions, is energy demanding and is important for information processing (Buckner et al., 2009; de Haan et al., 2012; Drzezga et al., 2011). Interestingly, these highly connected and energy demanding brain regions seem most vulnerable in AD patients. High energy demands of hub regions may make these regions especially vulnerable to deficits in energy delivery (Tomasi et al., 2013). Amyloid-plaque formation shows a striking spatial overlap with the locations of cortical hubs (Buckner et al., 2009). It is commonly believed that accumulation of amyloid-β is followed by synaptic dysfunction, neuronal loss, and finally cognitive problems (Hardy and Selkoe, 2002; Jack et al., 2013). In contrast, results from transgenic mouse models indicate that the neuronal activity might enhance amyloid-β deposition (Cirrito et al., 2008). If so, measures of neuronal activity are promising for early detection of AD.
Even though the parietal and occipital cortex were identified with both techniques, spatial overlap of the regions identified in a voxel analysis with [18F]FDG and ECM was very low. As described above, hypometabolism was more widespread than lowered centrality. In contrast, others have reported stronger agreement (spatial overlap of 42%) of changes in functional connectivity and metabolism in MCI patients (Drzezga et al., 2011). When examining simple subtraction maps, relatively good overlap (56%) of regions with lower metabolism and lower centrality in AD patients was found; overlap was not only seen in the precuneus and posterior cingulate cortex but also in occipital cortex and in small regions of temporal and frontal areas. These results should be interpreted with caution since no statistical correction was performed.
Besides group differences, the correlation of metabolism and centrality was investigated. We expected good associations for [18F]FDG and ECM in disease-affected regions in AD patients, but no clear associations of [18F]FDG SUVr with ECM were found. A possible explanation could be that the dynamic range of [18F]FDG SUVr and EC values was too small to detect possible associations. Based on the plotted data in Figure 2, this might be true for EC values in AD patients. However, in general, this does not seem to explain the lack of association. Drzezga and colleagues (2011) found that hypometabolism was correlated with lower degree centrality in the precuneus across all subjects, but similar to the present study, not within groups. Of course, centrality of a voxel within the whole-brain network is not the same as metabolism measured in a single voxel. In addition, MCI patients represent the disease stage before AD. However, results from studies examining functional connectivity/centrality in AD are often related to metabolism changes, since they are both believed to represent synaptic dysfunction (Jack et al., 2013). In line with this hypothesis, Tomasi and colleagues (2013) found that fMRI BOLD signal amplitude and local and global degree centrality were correlated with glucose metabolism across healthy subjects. A recent article by Di and Biswal (2012) identified resting-state networks based on [18F]FDG data and rs-fMRI data in elderly controls. The authors hypothesized that functionally connected regions would also show high correlations of metabolic activity. This hypothesis proved to be partially true; similar resting-state networks were identified with both measures, but anterior–posterior networks were absent for [18F]FDG data. The discrepancy between [18F]FDG and functional connectivity was reasoned to reflect the difference in coupling of energy consumption and ongoing neural synchronization within the resting state networks (RSNs) (Di and Biswal, 2012). This fits the results of our study; centrality (neural synchronization) and metabolism (energy consumption) were not correlated in AD patients and elderly controls. The two methods might, therefore, provide complementary information (Wehrl et al., 2013) and possibly reflect changes at different time points in the disease course of AD. The combination of methods could possibly be useful in improving early clinical diagnosis of AD. Future research should focus on conversion to AD in elderly subjects and MCI patients.
Limitations
The extent to which centrality was affected in AD patients on a voxel level was less pronounced than in the regional analysis. Possibly this can be attributed to differences in inherent spatial smoothness of the data (Radua et al., 2014). To account for these spatial differences for the two techniques, preprocessing of rs-fMRI data included smoothing with a relative large kernel of 7 mm FWHM to match the [18F]FDG data. After normalization of [18F]FDG data to standard MNI space, average intrinsic smoothness of the data was FWHMx, FWHMy, and FWHMz: (10 × 12 × 11 mm). This was somewhat smaller for ECM after normalization (10 × 11 × 11 mm), but closest to [18F]FDG. To illustrate, when applying a commonly used smoothing factor of 5 mm FWHM on rs-fMRI data, intrinsic smoothness was 8 × 8 × 8 mm. Furthermore, GM loss in AD patients could have influenced measures of metabolism and rs-fMRI. To correct for this, individual GM was taken into account when calculating regional values and used as a covariate in the voxel-wise analysis. Finally, ECM is a relatively new measure of connectivity in AD research, which has certain advantages (Lohmann et al., 2010). Studies examining other measures of functional connectivity could provide more insight into the association of metabolism with functional connectivity in AD. Similarly, other outcome measures of glucose metabolism using [18F]FDG PET, such as standardized uptake values or cerebral glucose metabolism rate, could provide additional information. Other PET/MR-based measurements such as perfusion and cerebral blood flow can provide extra information on the (de)coupling between metabolism and functional connectivity in AD.
Conclusion
Hypometabolism and lowered centrality in AD patients were observed in the occipital and parietal cortex. However, agreement in other cortical regions was absent. In addition, the direct association of [18F]FDG and ECM was very weak. Both methods are, therefore, believed to represent different mechanisms in healthy elderly and AD patients. [18F]FDG SUVr in the parietal cortex was best in distinguishing between AD patients and controls and is useful in clinical practice, whereas ECM, at present, does not seem to be suitable for clinical purposes.
Footnotes
Acknowledgments
A.M.W. was funded by VUmc Radiology, the Neuroscience Campus Amsterdam, and the Dutch MS Research Foundation (Grant No. 08-650). B.N.M.v.B. receives research support from the American Health Assistance Foundation, Alzheimer Association, Internationale Stichting Alzheimer Onderzoek, the Center of Translational Molecular Medicine, the Dutch Organization for Scientific Research (NWO), and De Hersenstichting Nederland. P.S. serves/has served on the advisory boards of Genentech, Novartis, Roche, Danone, Nutricia, Baxter, and Lundbeck. He has been a speaker at the symposia organized by Lundbeck, Merz, Danone, Novartis, Roche, and Genentech. For all his activities, he receives no personal compensation. He serves on the editorial board of Alzheimer's Research and Therapy and Alzheimer's Disease and Associated Disorders and is a member of the scientific advisory board of the EU Joint Programming Initiative and the French National Plan Alzheimer. F.B. serves on the editorial boards of Brain, European Radiology, the Journal of Neurology, Multiple Sclerosis, and Neuroradiology and serves as a consultant for Bayer-Shering Pharma, Sanofi-Aventis, Biogen-Idec, UCB, Merck-Serono, Jansen Alzheimer Immunotherapy, Baxter, Novartis, and Roche. The VUmc Alzheimer Center is supported by Alzheimer Nederland and Stichting VUmc fonds. The clinical database structure was developed with funding from Stichting Dioraphte.
Author Disclosure Statement
There are no actual or potential conflicts of interest to disclose. All authors have read and agreed with the contents of the manuscript. The results of the study have not been published before and are not under consideration to be published by another journal.