




Abstract
It is important to consider the effect of a previous experimental condition when analyzing resting-state functional connectivity magnetic resonance imaging (fcMRI) data. In this work, a simple sensory stimulation functional MRI (fMRI) experiment was conducted between two resting-state fcMRI acquisitions in anesthetized rats using a high-field small-animal MR scanner. Previous human studies have reported fcMRI network alteration by prior task/stimulus utilizing similar experimental paradigms. An anesthetized rat preparation was used to test whether brain regions with higher level functions are involved in post-task/stimulus fcMRI network alteration. We demonstrate significant fcMRI enhancement poststimulation in the sensory cortical, limbic, and insular brain regions in rats. These brain regions have been previously implicated in vigilance and anesthetic arousal networks. We tested their experimental paradigm in several inbred strains of rats with known phenotypic differences in anesthetic susceptibility and cerebral vascular function. Brown Norway (BN), Dahl Salt-Sensitive (SS), and consomic SSBN13 strains were tested. We have previously shown significant differences in blood oxygen level-dependent fMRI activity and fcMRI networks across these strains. Here we report statistically significant interstrain differences in regional fcMRI poststimulation enhancement. In the SS strain, poststimulation enhancement occurred in posterior sensory and limbic cortical brain regions. In the BN strain, poststimulation enhancement appeared in anterior cingulate and subcortical limbic brain regions. These results imply that a prior condition has a significant impact on fcMRI networks that depend on intersubject difference in genetics and physiology.
Introduction
The interaction of task or stimulus brain activation with resting-state brain networks has been a topic of investigation since the first report of resting-state functional connectivity magnetic resonance imaging (fcMRI) by Biswal and colleagues (1995). In that seminal article, Biswal and his coauthors described the extreme methods they used to prevent subject bias from a previous motor task or mental imagery predisposing the results of their resting-state fcMRI experiments. A multitude of experimental manipulations has been shown to alter resting-state fcMRI networks, including changing behavioral states (Sala-Llonch et al., 2012), anesthesia (Peltier et al., 2005a), previous motor learning (Newton et al., 2007), transcranial magnetic stimulation (Fox et al., 2012), and prior performance of challenging/fatiguing tasks in humans (Peltier et al., 2005b). There have been fewer reports of task/stimulus interaction with the resting-state in the animal fcMRI literature. However, anesthesia (Vincent et al., 2007), anesthetic dose (Pawela et al., 2009), arousal level (Liu et al., 2013), peripheral nerve injury (Pawela et al., 2010), brain injury (Weber et al., 2008), and stress (Liang et al., 2014) have been shown to change resting-state fcMRI networks in animals. In this study, the authors describe the effect of a prior conventional sensory stimulus on the cortical sensory resting-state network in an anesthetized rat using an acute experimental methodology.
Subpain threshold electrical forepaw stimulation is a commonly used stimulus in rodent functional MRI (fMRI) studies (Hyder et al., 1994). The stimulation is usually produced through the use of an electrical square pulse generator equipped with a constant current unit and/or stimulus isolation unit. A bipolar electrode is placed in the paw of the subject rat. Electrical stimulation is given with variable pulse widths (msec), amplitudes (mA), and frequencies (Hz). This method has been shown to activate the primary sensory forelimb (S1FL) region, secondary sensory cortex (S2), sensorimotor thalamic nuclei, and caudate putamen (CP) brain regions in rat brain blood oxygen level-dependent (BOLD) fMRI studies. The electrical forepaw stimulation parameters can change the BOLD fMRI signal intensity and the spatial extent of the activated voxels in these brain regions. These BOLD signal metrics (intensity/spatial extent) can also vary depending on whether the subject animal is awake or anesthetized (Martin et al., 2006; Peeters et al., 2001). They can also be influenced by the anesthetic agent or the dosage used (Austin et al., 2005; Huttunen et al., 2008; Luo et al., 2007; Pawela et al., 2009; Williams et al., 2010; Zhao et al., 2007). Forepaw stimulation given in a standard block trial evokes an activated voxel time course governed by neurovascular coupling. The proceeding hemodynamic response function has the following characteristics: a hemodynamic delay of 2–6 sec from the onset of stimulus, an initial high-intensity peak followed by a gently downward sloping plateau, a return toward baseline after stimulus off, and a poststimulus undershoot. Recovery to baseline after the poststimulus undershoot is short and in the order of 4–10 sec. There is a paucity of literature documenting the longer term baseline trend after stimulus and most fMRI analyses use a detrending algorithm across the block design to minimize baseline interference.
The BOLD fMRI hemodynamic response function has been shown to be linked to the neural synaptic activity by correlation to local field potentials (Logothetis et al., 2001). The linkage between the BOLD fcMRI hemodynamic response function and neural activity has been proven to be more challenging to determine. Spontaneous low-frequency neuronal oscillations that are correlated across brain regions have been described for many years. Shmuel and Leopold (2008) demonstrated in monkey visual cortex the linkage between relative power changes in the local field potential gamma band and fluctuations in the BOLD signal. Maximum correlation was achieved by introducing a time-lag of 6 sec between the BOLD signal and the electrophysiology data. However, Lu and colleagues (2007) demonstrated that spontaneous cortical electrophysiological signals in the S1FL of the rat were more correlated with the BOLD signal in the low-frequency delta band (1–4 Hz) in combined electroencephalography (EEG)/fMRI experiments. These two key studies are in fundamental disagreement with each other, and therefore, the basis of the BOLD fcMRI signal is still a matter of open inquiry (Bruyns-Haylett et al., 2013). It is unknown if neurovascular coupling for BOLD fMRI and fcMRI signal production utilizes the same mechanism. Furthermore, if they are different, it is also unknown if they interact.
The motivation here was to determine the influence of previous sensory stimulation on the sensory S1FL fcMRI network in the rat in an acute experimental paradigm lasting ∼35 min. The brain has a nonlinear and dynamic functional organization. Friston and colleagues (1996) were the first to suggest that the measurement of brain activity at any point in time should always consider the influence of brain activity from a previous experimental condition. The anesthetized rat is a suitable model to test fundamental hypotheses about the interaction of the task/stimulus activation and resting-state conditions. We used an anesthetized preparation to suppress the impact of higher level brain functions such as attention, conscious sensory perception, and stress on the experimental paradigm. We employed a simple experimental design with first, a resting-state fcMRI acquisition, second, an off period of 5 min with no MRI scan, third, a forepaw stimulation fMRI experiment, fourth, an addition off period of 5 min with no MRI scan, and fifth, a final resting-state fcMRI acquisition. We utilized our experimental design in three different strains of inbred rats: Dahl Salt-Sensitive (SS), Brown Norway (BN), and consomic SSBN13 strains. The authors have previously described phenotypic variation across SS, BN, and SSBN13 strains in fMRI response and intrinsic fcMRI connectivity (Li et al., 2013). These strains exhibit significant interstrain phenotypic differences in cerebrovascular physiology (Drenjancevic-Peric and Lombard, 2004; Durand and Lombard, 2011; Lukaszewicz et al., 2013) and anesthetic susceptibility (McCallum et al., 2013; Stadnicka et al., 2009; Stekiel et al., 2004), which makes them interesting subject populations for imaging studies. The inbred nature of the strains limits intrastrain individual genetic and physiological variance across subject rats, which increases reproducibility across rats within a given strain. Consomic rat models also have been created where a single chromosome from one strain is inserted in the genetic background of the other strain (i.e., SSBN13, SS background with chromosome 13 of BN inserted). These consomic rats exhibit intermediate phenotypes different from the parental SS and BN strains (Kunert et al., 2006). Given the prior observations, we expected to find differences in sensorimotor fcMRI networks poststimulation across different rat strains.
Materials and Methods
Animal preparation and anesthesia
All studies and protocols were approved by the Institutional Animal Care and Use Committee of the Medical College of Wisconsin. Thirteen male BN rats (BN/HsdMcwiCrl; Charles River Laboratories, Wilmington, MA) weight 250–360 g, 10 male SS rats (SS/HsdMcwiCrl; Charles River Laboratories) weight 200–300 g, and 9 male consomic SS-13BN (SS-Chr 13BN/Mcwi; Medical College of Wisconsin) weight 100–300 g were used in the study. Additional rats enrolled in the study, however, were removed from further analysis due to poor physiology during the MR scanning sessions. All rats were housed under the same environmental conditions and maintained in an ambient temperature on a 12-h light/12-h dark cycle. Regular diet (low-salt) and water were provided as needed before MRI experiments. The animals were initially anesthetized with 4% of isoflurane (Halocarbon Laboratories, River Edge, NJ) for induction in a mixture of air and pure oxygen and then moved to a surgical platform equipped with heating pad to maintain body temperature at 37°C±0.5°C. Isoflurane was maintained at 1.5% during all subsequent surgical procedures. Oral intubation was performed for mechanical ventilation, and tail vein catheterization was used for continuous delivery of anesthesia agents. After transferring the rats to the magnet, a mixture of dexmedetomidine (Dexdomitor, 0.05 mg/kg/h; Pfizer Animal Health, New York, NY) with pancuronium bromide (2 mg/kg/h; Hospira, Inc., Lake Forest, IL) was injected as an initial bolus of 0.1 mL and then continuously infused through the tail vein after isoflurane was tapered to zero. A MR-compatible needle electrode was inserted subcutaneously between the second and fourth digits of left forepaw for electrical stimulation.
fMRI/fcMRI experimental methodology
Functional MRI and resting-state acquisitions were carried out on a Bruker 9.4T animal scanner (ADVANCE; Bruker, Billerica, MA) equipped with a Bruker surface receive coil and linear transmit coil. Rat rectal temperature was monitored during MRI acquisition and maintained by an automated feedback control air flow heating system. The blood oxygen saturation (MouseOx Plus; Starr Life Sciences, Oakmont, PA), inspired/expired O2 and CO2 (POET IQ-2; Criticare Systems, Waukesha, WI), respiratory and heart rates of all rats were continuously monitored and recorded. All parameters were maintained within normal physiological ranges throughout the entire experimental paradigm.
For all imaging experiments, 10 contiguous interleaved 1 mm slices were acquired with the fourth slice located over the anterior commissure (−0.36 mm from bregma). Anatomical images were acquired first with a fast spin-echo sequence [rapid acquisition with relaxation enhancement (RARE), field of view (FOV)=3.5×3.5 cm, matrix size=256×256, repetition time (TR)=2.5 sec, echo time (TE)=50.8 msec]. Functional images were then acquired with the same slice positions as the RARE using an echo-planar imaging (EPI) sequence (single shot EPI, FOV=3.5×3.5 cm, matrix size=96×96, TR=2 sec, TE=19.437 msec, number of repetitions (NR)=110, the total acquisition time of the EPI was 3 min 40 sec). BOLD signals for fMRI and fcMRI were measured in the same rat using the experimental paradigm shown in Figure 1. An electrical stimulation (S88 Square Pulse Stimulator; Grass Telefactor, West Warwick, RI) paradigm was used with fixed square stimulation pulses of 2.0 mA, 2.0 msec, and frequencies of 3, 5, 7, and 10 Hz for forepaw stimulation. We have noted previously no compensatory increases in blood pressure or heart rate (indicators of pain) in anesthetized rats utilizing these same subthreshold forepaw stimulation parameters (Cho et al., 2007). Two sets of resting-state fcMRI were acquired before and after stimulation with the same imaging sequence.
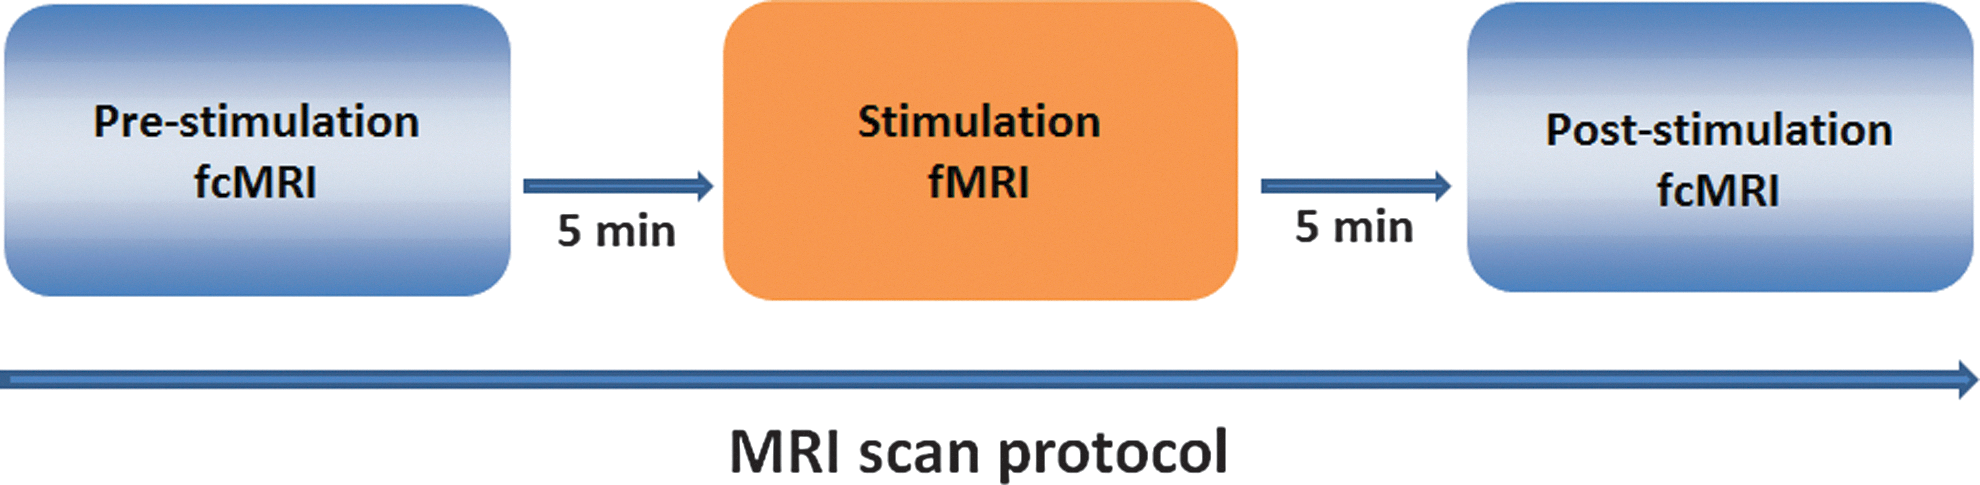
Experimental paradigm with forepaw stimulation acquisition between pre- and poststimulation functional connectivity magnetic resonance imaging (fcMRI) acquisitions.
Data processing
Imaging data analysis was carried out using the Analysis of Functional NeuroImages (AFNI,
fcMRI data processing and analysis
Seed-based fcMRI analysis was employed to measure the intrinsic functional connectivity of the S1FL network. The common activation foci detected in all rat strains within the right S1FL were used as a seed region. For both pre- and poststimulation fcMRI analysis, two sets of EPI scans were concatenated and coregistered to the same anatomical template. A band-pass filter was applied to the preprocessed images to keep only low-frequency fluctuations within the frequency range of 0.01–0.1 Hz. The averaged time course of each seed was then correlated with the time course of each voxel in the whole brain using the Pearson cross-correlation. The correlation coefficients (r) were subjected to the same Fisher Transform [z=0.5ln(1+r)/(1−r)] and spatially smoothed with a Gaussian kernel (1-mm full width half maximum) to create a connectivity map for each rat. For obtaining the network patterns in each strain, a voxelwise one-sample t-test within group subjects was used against a null hypothesis of no connectivity (p-value 0.05 with Bonferroni correction). A one-way repeated measures analysis of variance (ANOVA) was employed (p-value 0.05 with correction) across the three strains, with rat body weight and age as nuisance covariates, to obtain the differential connectivity. The strength of connectivity within each network was examined by post hoc Tukey's test with a Bonferroni correction.
Results
Figure 2 displays the results acquired from the experimental paradigm in SS rats (n=10). The results were averaged across all animals. Six contiguous MR slices located 1.68 to −3.36 mm from bregma were plotted. The top series shows the BOLD fMRI activation map resultant from electrical forepaw stimulation. The top-middle series presents the data from the initial resting-state fcMRI experiment. The bottom-middle series is a rendering of the data from the poststimulus fcMRI experiment. All fcMRI plots were created from a seed region calculated across voxels in the right S1FL region. The seed region was chosen from the common activation foci for all forepaw fMRI experiments in all three strains. The same seed region is used across Figures 1 –3. The bottom plot is the mapped result from a t-test between the pre- and poststimulation fcMRI experimental data. Statistically significant enhanced resting-state correlation was detected in the ipsilateral and contralateral S1FL regions in SS rats poststimulation. Significant poststimulation enhancement was also detected in the insular cortex and amygdala when using the same S1FL seed in SS rats. It is noted that the amygdala is part of the brain limbic system.
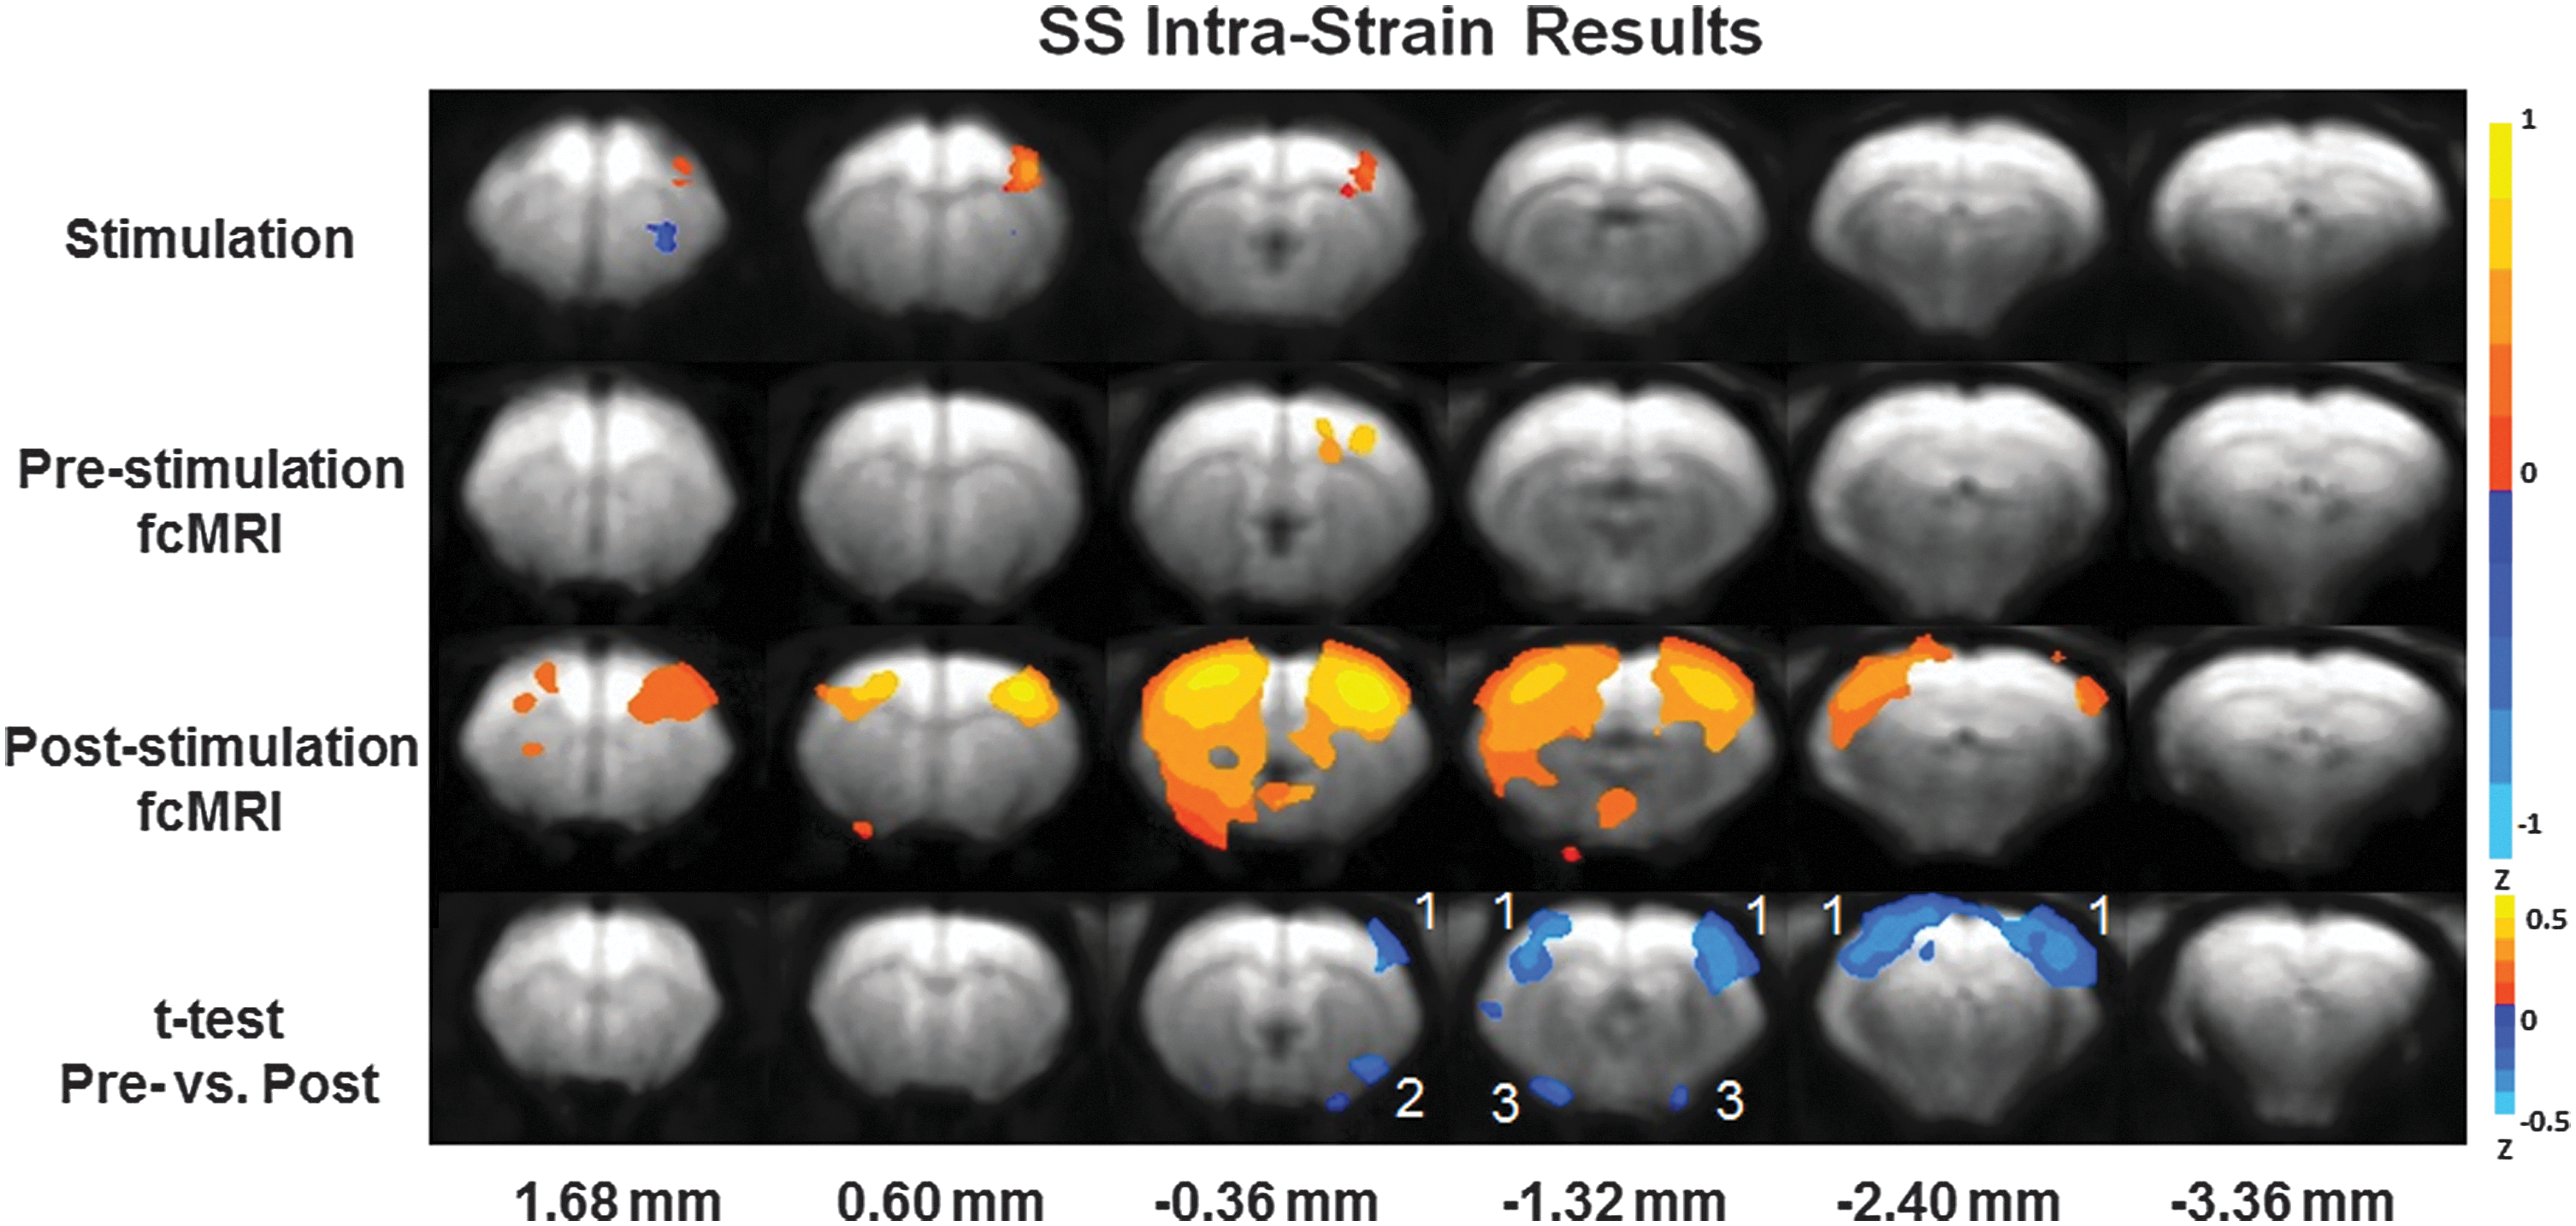
Intrastrain Dahl Salt-Sensitive (SS) results utilizing the experimental paradigm. Top: forepaw stimulation functional MRI (fMRI) results. (p-value 0.05) Top-Middle: prestimulation fcMRI results. (p-value 0.001) Bottom Middle: poststimulation fcMRI results. (p-value 0.001) Bottom: t-test of pre- versus poststimulation fcMRI results. (p-value 0.05) The color bar indicates Z-scores. Highlighted brain regions include
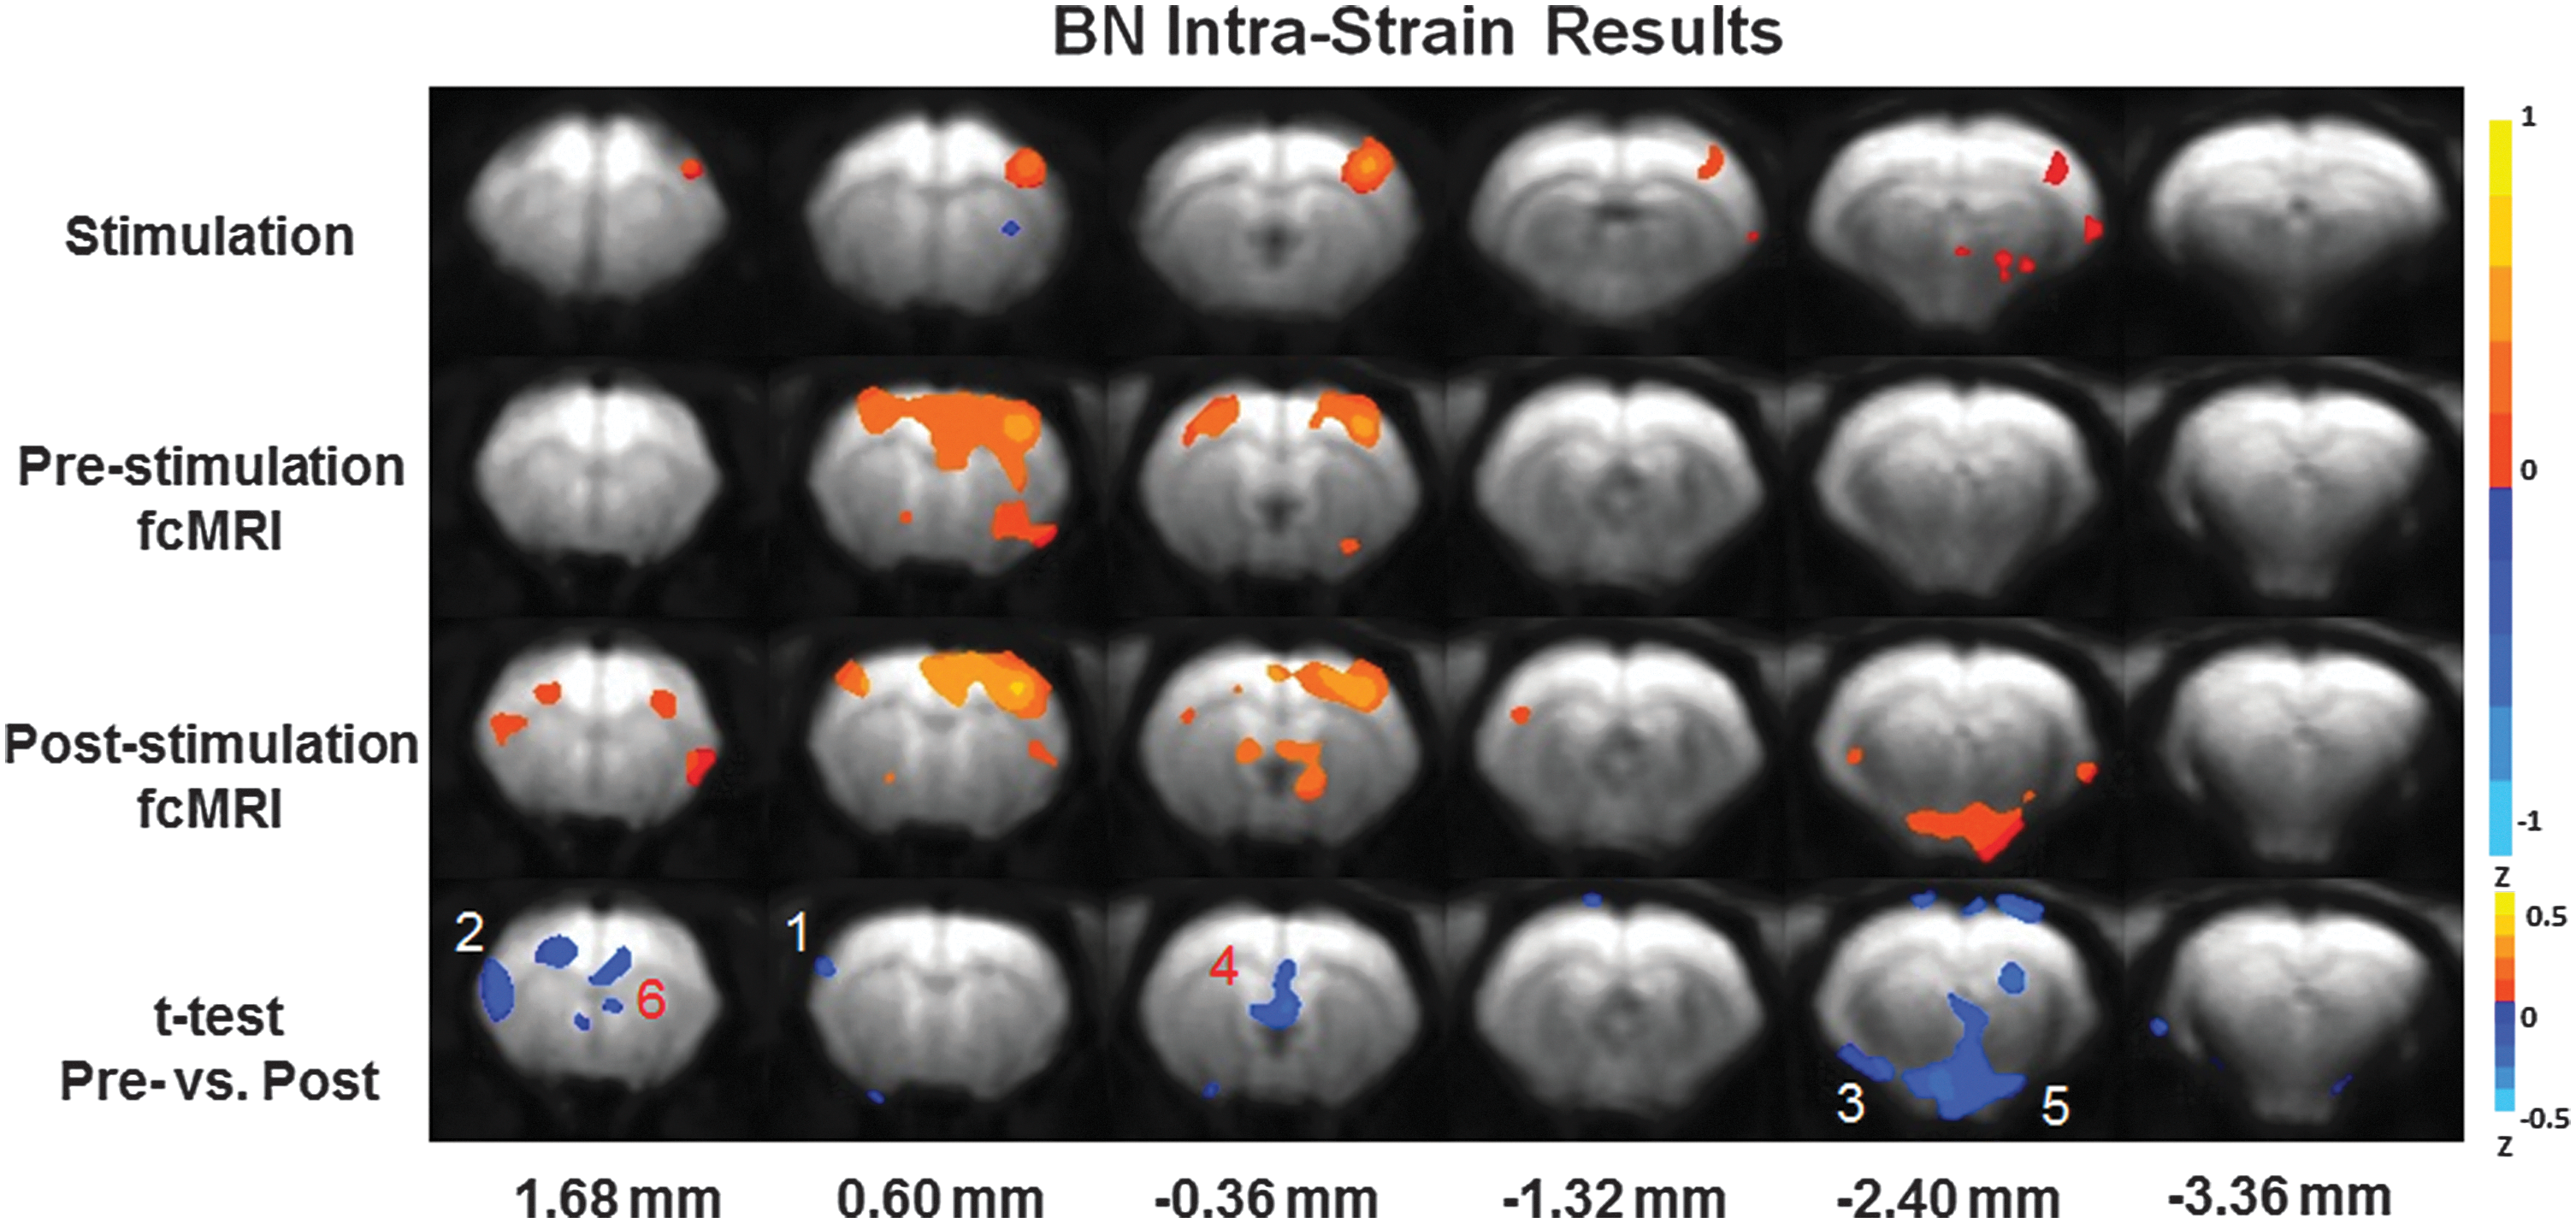
Intrastrain Brown Norway (BN) results utilizing the experimental paradigm. Top: forepaw stimulation fMRI results. (p-value 0.05) Top-Middle: prestimulation fcMRI results. (p-value 0.001) Bottom Middle: poststimulation fcMRI results. (p-value 0.001) Bottom: t-test of pre- versus poststimulation fcMRI results. (p-value 0.05) The color bar indicates Z-scores. Highlighted brain regions include
Figure 3 reveals the outcomes from the experimental paradigm in BN rats (n=13). The results were averaged across all animals. The same six contiguous MR slices were plotted, as shown in Figures 2 and 4. The top series is the resultant fMRI activation map from the forepaw stimulation experiments. The top-middle shows the data from the prestimulus fcMRI experiments. The bottom-middle exhibits the data from the poststimulation fcMRI experiments. The same S1FL seed region was used to create all fcMRI plots, as shown in Figures 2 and 4. Intervoxel correlation across the entire brain was higher in BN rats than the SS and SSBN13 rats and the threshold had to be increased to a p-value of 0.00005 to increase S1FL network delineation. The bottom series is a display of the results from a t-test between the pre- and poststimulus fcMRI conditions. Anterior brain regions demonstrating enhanced connectivity were the insular and the cingulate cortex (MR slice 1.68 mm located from bregma). The fornix, septal nuclei, and the indusium griseum exhibited enhanced correlation to the S1FL seed between the pre- and poststimulus conditions (MR slice located −0.36 mm from bregma). It is noted that the fornix and septal nuclei are a link between the limbic system and the hippocampus. Anterior cingulate is part of the limbic system. A slight poststimulation enhancement of anterior contralateral S1FL was noted (MR slice located 0.60 mm from bregma). The limbic regions, amygdala and hypothalamus, were also significantly enhanced poststimulation (MR slice located −2.40 mm from bregma) in BN rats.

Intrastrain SSBN13 results utilizing the experimental paradigm. Top: forepaw stimulation fMRI results. (p-value 0.05) Top-Middle: prestimulation fcMRI results. (p-value 0.001) Bottom Middle: poststimulation fcMRI results. (p-value 0.001) Bottom: t-test of pre- versus poststimulation fcMRI results. (p-value 0.05) The color bar indicates Z-scores. No statistically significant differences were detected between pre- and poststimulus conditions.
Figure 4 is a demonstration of the results from the SSBN13 rats (n=9). The results were averaged across all animals. The same six contiguous MR slices were plotted, as shown in Figures 2 and 3. The top plot is a display of the fMRI voxel activation map from the electrical forepaw stimulation experiment. The top-middle series is a plot of the outcome from the prestimulation fcMRI experiments. The bottom-middle plot reveals the outcome from the post-forepaw stimulation fcMRI experiments. The same S1FL seed region was used to create all fcMRI plots, as shown in Figures 2 and 3. The bottom series exhibits the results from a t-test comparing pre- and poststimulus experimental conditions. No significant change in voxel correlation was detected between the pre- and poststimulation conditions for SSBN13 rats.
Figure 5 displays the results of a one-way ANOVA across all three strains for the prestimulus (top) and poststimulus (bottom) fcMRI trials. No significant differences are noted across the strains for the prestimulus fcMRI experiments. However, significant differences were detected across strains for the poststimulus fcMRI trials. Regions exhibiting significant interstrain difference include the S1FL, S2, amygdala, and fornix. The majority of voxels that exhibited cross-strain correlation differences were located in the hemisphere contralateral to the right S1FL seed region.
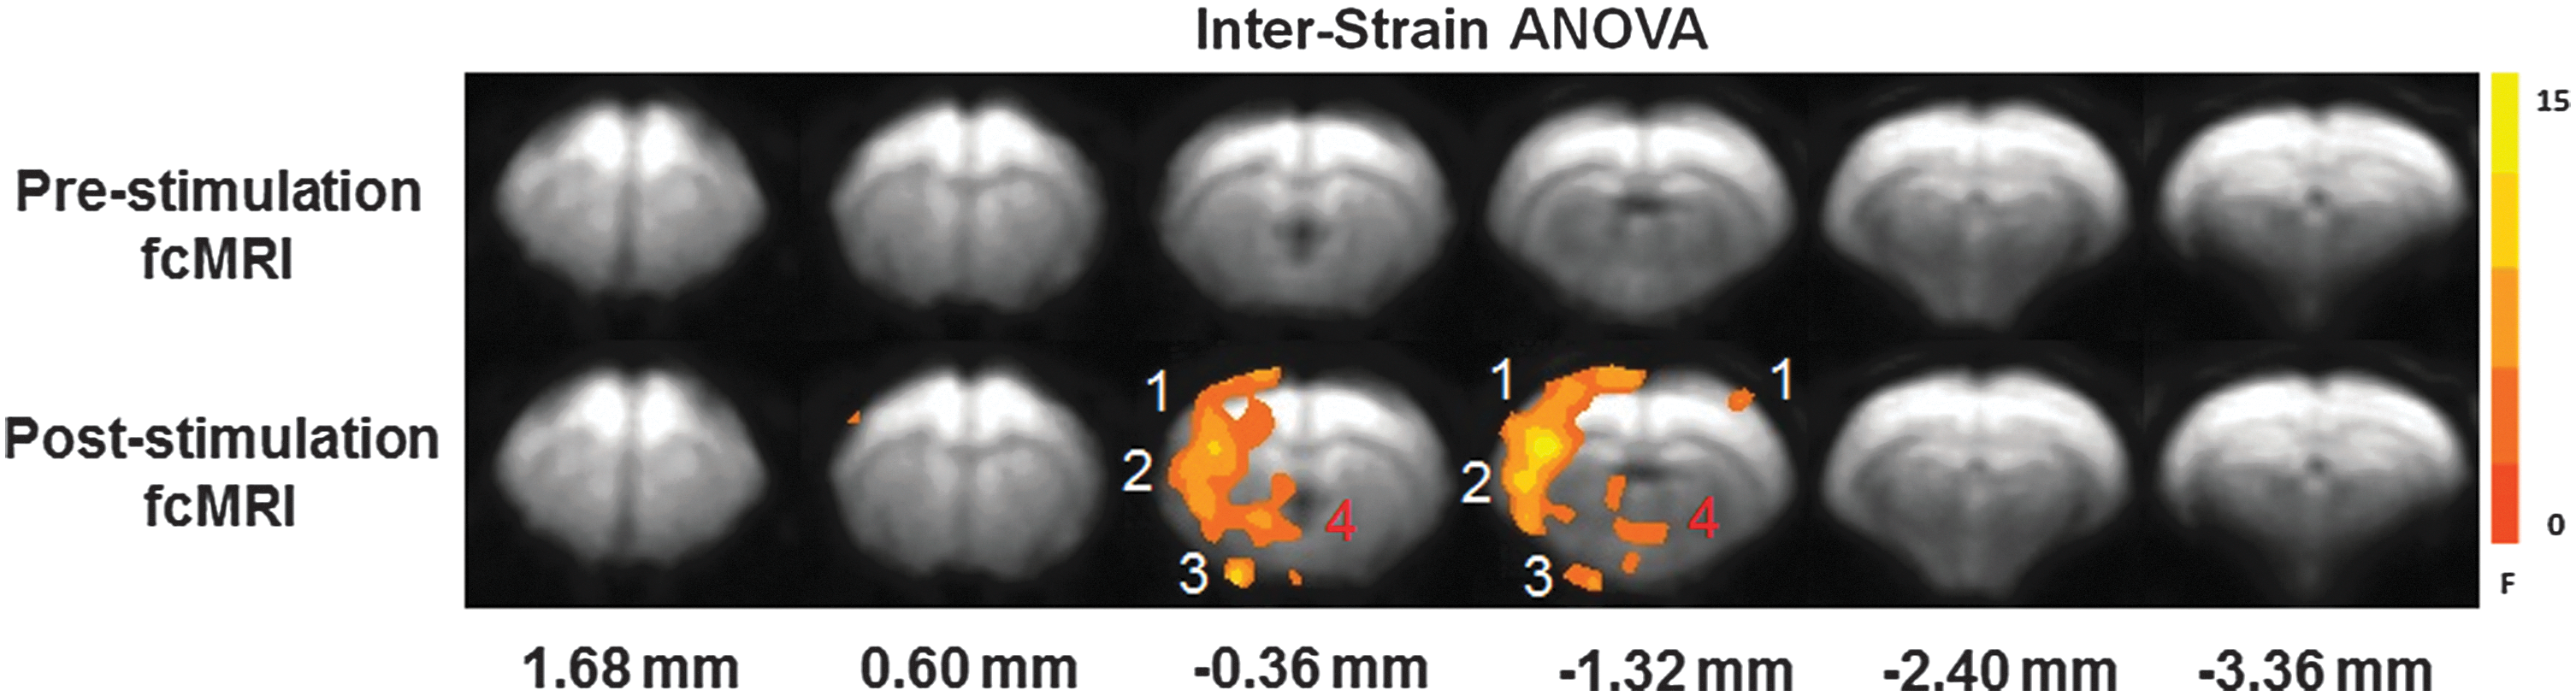
One-way analysis of variance (ANOVA) across SS, BN, and SSBN13 strains for both pre- (top) and poststimulation (bottom) fcMRI acquisitions. The color bar indicates F-scores. Highlighted brain regions include
Figure 6 is a quantification of the ANOVA results from Figure 5. The authors plotted the Z-scores resulting from a correlation analysis from all the voxels in the cortex to the seed region in the S1FL for all strains for both pre- and poststimulus conditions. No significant variance was found for the prestimulation trials across strains. For the poststimulation fcMRI trials, the Z-scores in cortical correlation for the BN and SSBN13 rats were statistically significant from the SS rats when compared using Tukey's test for multiple comparisons.
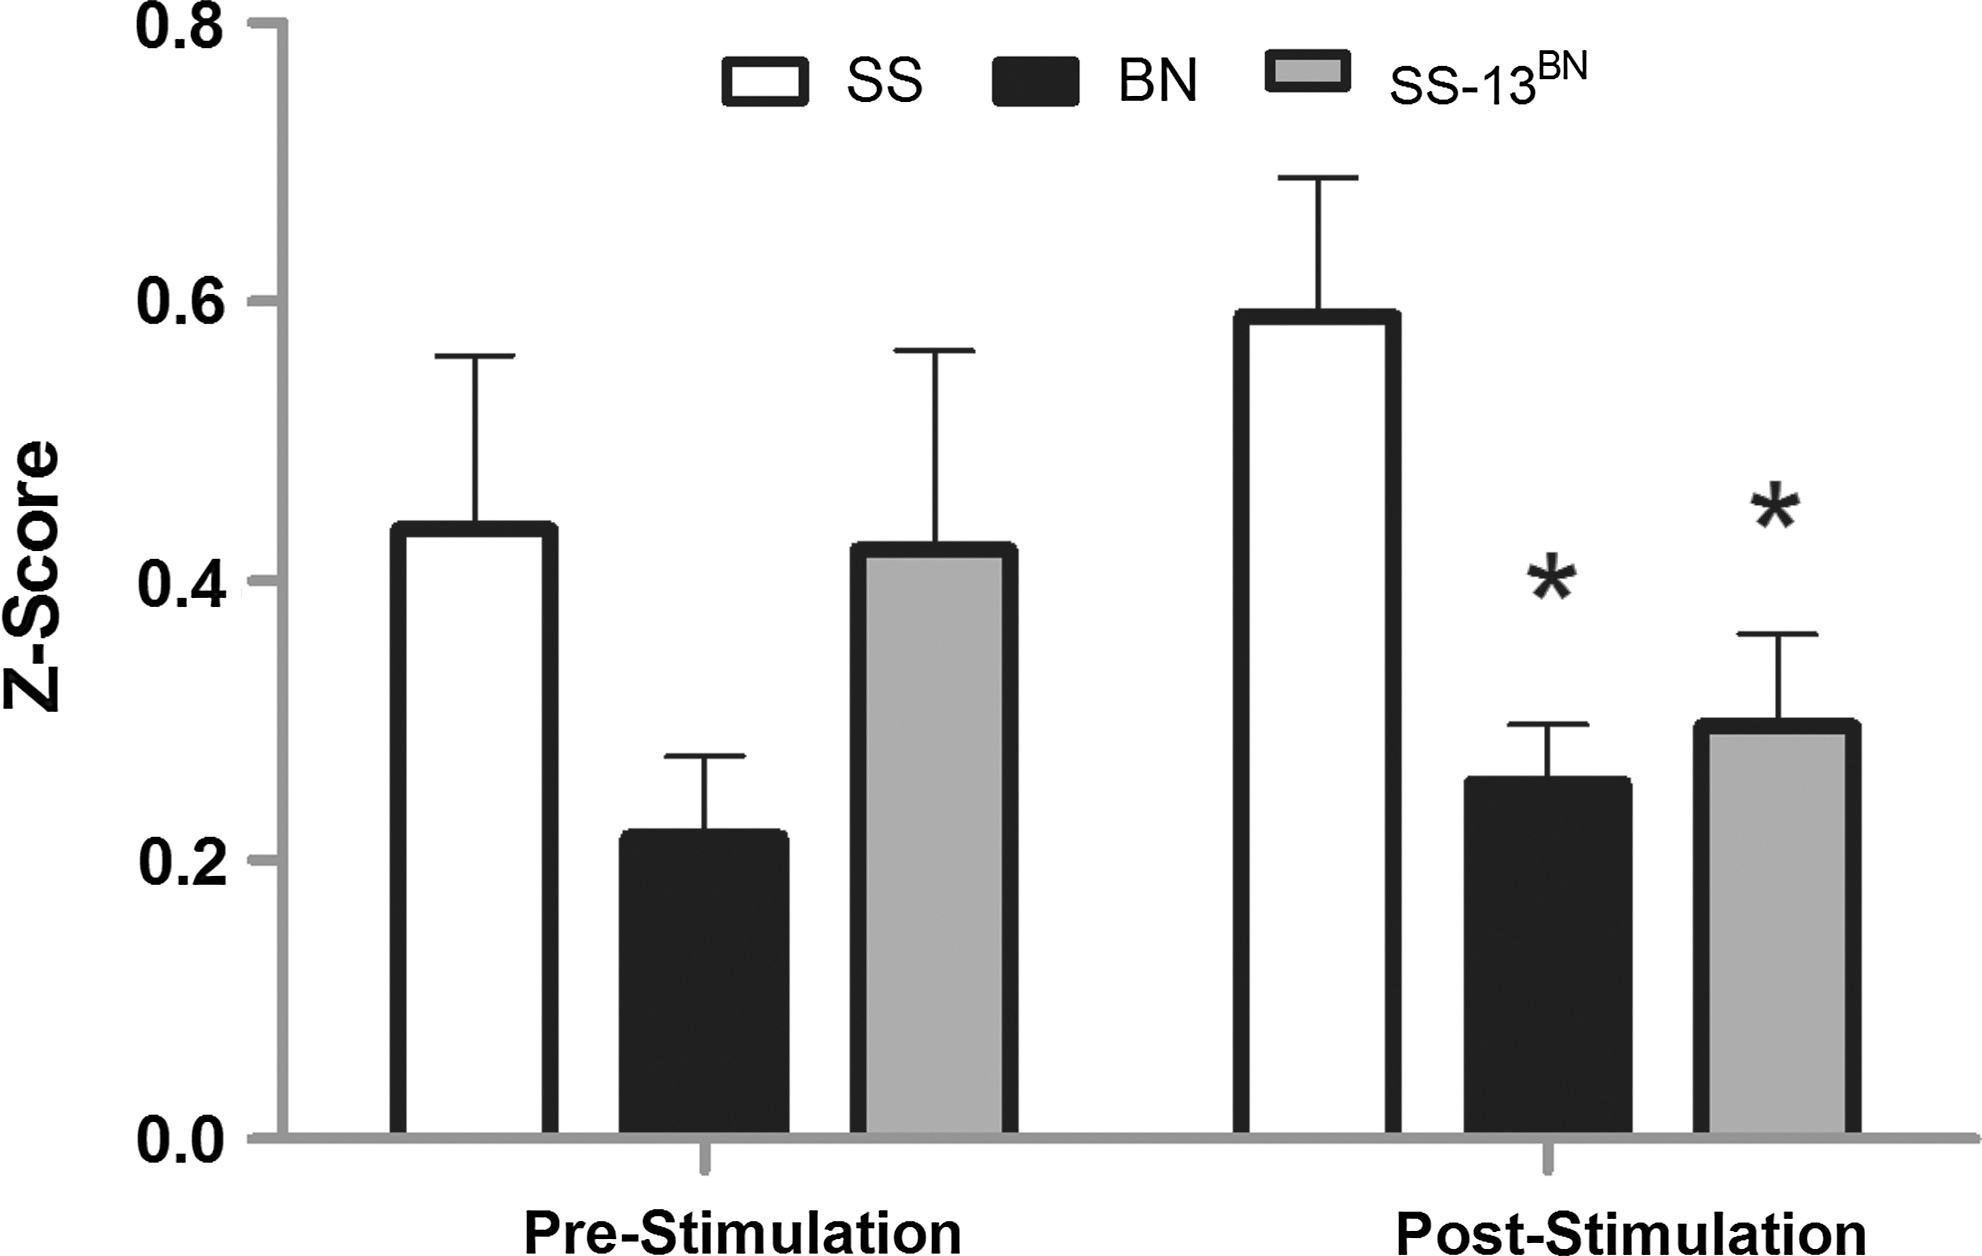
Quantitative representation of differential fcMRI cortical connectivity among SS, BN, and SS-13BN strains pre- and poststimulation. The results from post hoc Tukey's comparison of ANOVA from Figure 5 are plotted. Error bars indicate the standard deviation. *Indicates statistically significant p<0.05 for both BN versus SS and SSBN13 versus SS for the poststimulation fcMRI condition.
Discussion
The primary goal of this investigation was to explore the effect of task/stimulus condition on subsequently measured fcMRI networks. In addition, we intended to compare these effects between three different rat strains. We anticipated strain-dependent differences because of the known differences in hemodynamic and general anesthetic sensitivities. We detected statistically significant differences between the pre- and poststimulation fcMRI networks revealed by S1FL seed region analysis. There were also significant interstrain dissimilarities in fcMRI networks across SS and BN rats. There were no significant differences detected in the SSBN13 rats. Qualitatively, an increase in connectivity across the S1FL network is visible in the fcMRI pre- and poststimulus maps for SSBN13 rats. However, no voxels passed the statistical significance threshold at p=0.05 with a standard t-test. It is unknown why differences were not detected in SSBN13 rats. However, we speculate that the SSBN13 rats may exhibit an intermediate fcMRI phenotype between SS and BN canceling out significant interstrain disparities. Previously, we showed that the BOLD fMRI response to forepaw stimulus is similar in BN and SSBN13 strains (Li et al., 2013). We employed fMRI-guided fcMRI for data analysis. We chose to probe the fcMRI data using the S1FL seed region because that was the only common location of fMRI activation foci to forepaw stimulation across all three strains. Poststimulation enhancement in fcMRI networks occurred in different brain regions for the BN and SS strains using the S1FL seed region. The t-test exposed statistically significant enhancement of posterior cortical regions, including bilateral S1FL, amygdala, and insular cortex poststimulus in SS rats. In contrast, a t-test revealed statistically significant enhancement of anterior cortical insula/cingulate and posterior subcortical fornix, amygdala, indusium griseum, and hypothalamus in the poststimulus fcMRI data for the BN rats. We hypothesize that these differences in resting-state networks between SS and BN strains may be due to physiological differences across the strains. Cross-strain physiological differences may lead to changes in detection threshold of fcMRI networks across strains. There are many known phenotypic differences between SS and BN rats in anesthetic susceptibility and cerebral vascular function. Known cross-strain genetic differences are implicated in these physiological dissimilarities. Interstrain phenotypic differences may point to the mechanism behind the poststimulus enhancement in the resting-state fcMRI data.
The influence of previous stimulus/task on the resting-state
These results demonstrate an increase in the number of voxels that correlate with the S1FL seed region poststimulation in SS and BN rats. A corresponding increase in correlation strength was also observed between functionally connected voxels. Boly and colleagues (2007) demonstrated that conscious perception of a stimulus led to an increase in baseline BOLD fluctuations in the medial thalamus and the lateral frontoparietal network in humans. The authors attributed these regions to vigilance and external monitoring brain networks. Similarly, in this study, we detected poststimulus enhancement of the insular cortex in both SS and BN rats. The insular cortex has been implicated in somatosensory perception and self-awareness. Waites and colleagues (2005) reported that a 5-min language task increased the connectivity in language-related brain regions when comparing fcMRI data acquired pre- and post-task in human subjects. Tung and colleagues (2013) reported an increase in the amplitude of BOLD baseline fluctuations and strength of the correlation coefficients across voxels in the motor regions after a 23-min button press task in human subjects. The changes were not present in their control studies that replicated the timing of the two fcMRI scans in subjects without the interspaced button press experiment. We are the first to report an acute stimulus-induced enhancement of fcMRI networks in anesthetized rats. These data suggest that increases in BOLD signal fluctuations post-task/stimulus are not limited to human subjects.
Network differences across SS and BN strains poststimulus
Previously, we have demonstrated that activation in SS rats occurs in fewer statistically significant voxels to electrical forepaw stimulation at 3, 5, 7, and 10 Hz frequencies (fixed 2.0 mA amplitude and 2.0 msec duration) compared to BN and SSBN13 rats. In the present study, SS rats exhibited a smaller distribution of BOLD response to forepaw stimulation in the S1FL region (three slices) as opposed to BN rats (five slices). In SSBN13 rats, the response to forepaw stimulation occurred in an intermediate distribution across four slices in S1FL. BN rats expressed a significantly higher intervoxel fcMRI correlation across the entire brain. The threshold used to create the fcMRI plots for BN rats (Fig. 3) had to be increased to a p-value of 0.00005 to clearly delineate brain regions as opposed to 0.001 for SS and SSBN13 strains. In BN rats, the enhancement occurred in more limbic regions (cingulate, amygdala, hypothalamus) and regions involved in the anterior to posterior limbic connectivity (fornix, septal nuclei). The septal nuclei are involved in reciprocal limbic connections between the cingulate, thalamus, hippocampus, amygdala, and hypothalamus in rat. In contrast, SS rats display a higher poststimulation enhancement in posterior cortical S1FL. Common to both SS and BN strains, enhancement occurred in amygdala and different parts of insular cortex. The insular cortex is connected with the primary somatosensory cortex (S1) and the secondary somatosensory cortex (S2), the infralimbic cortex, the caudate-putamen, the amygdala, and the bed nucleus of the stria terminalis in rat. The ANOVA exposed the greatest interstrain differences in fcMRI networks in contralateral S1FL, S2, fornix, and amygdala (Fig. 5). Post hoc analysis revealed that SS versus BN/SSBN13 dissimilarities were the source of the ANOVA variation. Recently, Liang and colleagues (2014) found a statistically significant decrease in the medial prefrontal cortex (including anterior cingulate) to amygdala in awake rats that have been previously exposed (7 days prior) to a predatory odor. Their results also demonstrated significantly higher anxiety in an elevated plus maze experiment in the previously predatory odor-exposed rats. Here we describe changes in similar brain regions. These results suggest that prior stimulus could cause significant alterations in fcMRI networks involved in anxiety and awareness in rats. It is unknown why enhancement was more pronounced in the cortical S1FL region in SS rats as opposed to more anterior and subcortical brain regions in BN rats. Further study is required.
Possible influence of differences in anesthetic susceptibility across SS and BN strains on these results
SS rats have been shown to have significantly increased sensitivity to inhaled agents, isoflurane, sevoflurane, and halothane, when compared to BN and SSBN13 rats (Stekiel et al., 2004). Inhaled anesthetics are potent vasodilators. Dexmedetomidine used in this study is a known vasoconstrictor (Ganjoo et al., 1998; Ohata et al., 1999). Anecdotally, we have noticed that BN rats had a higher sensitivity to dexmedetomidine when compared to SS rats. This finding is in direct contrast to the studies using inhaled agents in these strains. We hypothesize that differences in anesthetic sensitivity could contribute to a divergence in fcMRI networks detected poststimulation. Many of the regions that were enhanced poststimulation are involved in arousal and vigilance. Awake rats demonstrate stronger functionally connected networks when compared to the anesthetized conditions at a moderate anesthetic depth with the fcMRI methodology (Zhang et al., 2010). It has been hypothesized that anesthesia suppresses consciousness using a top-down mechanism (Mashour, 2014). The cortex is suppressed first followed by deeper subcortical regions. A recent study by Pillay and colleagues (2014) found that deep brain stimulation of rat limbic regions increases fcMRI basal forebrain and limbic connectivity and hypothesizes that these regions may be involved in subject arousal postanesthesia. The hypothesis is made that SS rats (which have less sensitivity to dexmedetomidine than BN rats) have a greater level of arousal caused by the preceding forepaw stimulus and therefore exhibit a higher level of enhancement in more cortical networks poststimulus. In contrast, the BN rats display poststimulus enhancement in lower level subcortical networks because they start the experimental paradigm in a deeper anesthetic state compared to SS rats. Further validation of this interpretation may be obtained in the future with combined EEG/MR experiments aimed at comparing the anesthetic states across different rat strains at various points along the experimental paradigm.
Possible influence of the genes involved in endothelium-dependent vasoactivity on these results
It is known that SS and BN strains differ in many vascular-associated physiological properties. Dahl Salt-Sensitive rats rapidly develop hypertension upon being fed a high-salt (8% diet) mimicking human hypertension disease (Kunert et al., 2006; Mattson et al., 2008). This phenotypic response to salt in SS rats is a multifactorial genetic condition, but several contributing candidate genes have been identified (Stodola et al., 2011). For example, the SS rat genome contains a unique renin allele. Renin also known as angiotensinogenase, is an enzyme that hydrolyses angiotensinogen to angiotensin I. Angiotensin II is a peptide that results from angiotensin I and is the most vasoactive peptide in the body. Angiotensin II is a potent vasoconstrictor and is involved in systemic blood pressure regulation. Most pharmaceuticals used to control blood pressure are believed to target the renin–angiotensin system. The BN strain is resistant to developing hypertension when placed on a high-salt diet. BN rats have a different renin allele than SS rats. Rat chromosome 13 encodes for the renin gene. When the BN chromosome 13 is inserted into the genetic background of the SS strain, protection against the development hypertension under a high-salt diet is conveyed to the resulting SSBN13 strain (Cowley et al., 2001). Even in the absence of a high-salt diet, SS rats demonstrate impaired endothelium-dependent relaxation of cerebral arteries compared to BN rats (Durand et al., 2010). Normal cerebral artery endothelium-dependent relaxation is restored by insertion of the BN renin gene into the SS background (Drenjancevic-Peric and Lombard, 2004). The distribution of angiotensin receptors in rat brain is not uniform and is higher in subcortical regions than in the cortex (Mendelsohn et al., 1984). The authors could also speculate that angiotensin system differences between SS and BN rats may lead to a stronger enhanced cortical network poststimulus in SS rats as opposed to strong enhancement in subcortical networks in BN rats.
The bioavailability of nitric oxide (NO) has been shown to be higher in BN rats when compared to SS rats (Lukaszewicz and Lombard, 2013; Lukaszewicz et al., 2013). SS rats have been proven to have a different cytochrome P450 ω-hydroxylase 4A (CYP4A) allele than BN rats (Lukaszewicz and Lombard, 2013). The CYP4A gene is located on rat chromosome 5. SS rats have been confirmed to have an upregulation of the cytochrome P450 ω-hydroxylase 4A/20-hydroxyleicosatetraenoic acid (CYP4A/20-HETE) pathway, which causes an elevated level of reactive oxygen species. 20-HETE has been shown to reduce the activity of endothelial nitric oxide synthase. NO is the major vasodilator or modulator implicated in neurovascular coupling. Introgression of the BN CYP4A allele (chromosome 5) into the SS genetic background has been shown to restore normal vascular function in SSBN5 rats (Lukaszewicz et al., 2013). This may be one reason why BN rats demonstrated a higher level of global brain connectivity when compared to SS rats. Impaired endothelial function could be involved in some of the fMRI/fcMRI differences between SS and BN strains.
Experimentally induced physiological changes
The MR environment is challenging. EPI scans cause a great deal of scanner auditory noise and could potentially modulate resting-state networks (Cheung et al., 2012). However, we did not detect any enhancement of brain regions associated with auditory stimuli in rats (Liu et al., 2013). Temperature and CO2 production can also alter the BOLD signal. We maintained these parameters through constant real-time monitoring and adjustment throughout the experimental paradigm. We did not notice any transient or other changes in blood pressure and heart rate across the entire 35-min protocol. We kept this experimental paradigm short to limit any tachyphylaxis during constant infusion of dexmedetomidine, as previously described. They did not use global signal regression to normalize strain baseline because they were concerned about establishing artificial negative correlation into these fcMRI results (Murphy et al., 2009; Saad et al., 2012). We were also apprehensive about introducing interstrain bias through signal regression.
Conclusion
Resting-state fcMRI brain networks have been linked to the intrinsic neural oscillatory activity. Previous studies in humans have demonstrated alterations in fcMRI networks by introduction of a task between two equally spaced resting-state fcMRI scans. The first goal was to determine if this phenomenon also was linked to brain regions involved in higher level cognitive functions and arousal by utilizing an anesthetized rat preparation. We found significant poststimulus enhancement in cortical sensory, limbic, and prefrontal cingulate brain networks in anesthetized rats. The second goal was to determine if genetic or physiological influence had any effect on poststimulus/task alteration by using inbred rat strains with known physiological and genetic differences. We found significant differences in cortical versus subcortical fcMRI network enhancement across the rat strains poststimulus. We attributed these interstrain dissimilarities to interstrain variation in anesthetic susceptibility and/or vascular endothelial function. This work represents an important first step to the understanding of the brain networks involved in vigilance and arousal in the rat brain.
Footnotes
Acknowledgments
The authors would like to recognize support from the National Institutes of Health (NIBIB R01-EB000215-27/NIGMS R01-GM56398) and the Advancing a Healthier Wisconsin Program (5520208). The authors would also like to thank Dr. James S. Hyde for helpful comments and Mr. Matthew L. Runquist for MRI technical assistance.
Author Disclosure Statement
The authors have no conflicts of interest to report.