
Abstract
The default-mode network (DMN) has been implicated in many conditions. One particular function relates to its role in motor preparation. However, the possibly complex relationship between DMN activity and motor preparation has not been fully explored. Dynamic interactions between default mode and motor networks may compromise the ability to evaluate intrinsic connectivity using resting period data extracted from task-based experiments. In this study, we investigated alterations in connectivity between the DMN and the motor network that are associated with motor readiness during the intervals between motor task trials. fMRI data from 20 normal subjects were acquired under three conditions: pure resting state; resting state interleaved with brief, cued right-hand movements at constant intervals (lower readiness); and resting state interleaved with the same movements at unpredictable intervals (higher readiness). The functional connectivity between regions of motor and DMNs was assessed separately for movement periods and intertask intervals. We found a negative relationship between the DMN and the left sensorimotor cortex during the task periods for both motor conditions. Furthermore, during the intertask intervals of the unpredictable condition, the DMN showed a positive relationship with right sensorimotor cortex and a negative relation with the left sensorimotor cortex. These findings indicate a specific modulation on motor processing according to the state of motor readiness. Therefore, connectivity studies using task-based fMRI to probe DMN should consider the influence of motor system modulation when interpreting the results.
Introduction
Resting state functional magnetic resonance imaging (fMRI) has received increasing attention in the field of neuroimaging. In contrast to conventional task-based fMRI experiments, acquiring data from awake subjects in a relatively unconstrained mental setting offers an opportunity to observe the brain function in baseline conditions. This approach has allowed for the discovery of several networks with intrinsic functional connectivity that can be characterized by correlated signal oscillations between neuronal assemblies or nodes (Beckmann et al., 2005; Damoiseaux et al., 2006; De Luca et al., 2006).
One of the most consistent findings in resting state studies is a network that comprises the posterior/precuneus cingulate cortex (PCC), ventromedial prefrontal cortex, and inferior bilateral parietal cortex regions: the default-mode network (DMN). In particular, this network shows a greater activity during the resting state than during the performance of different tasks (Greicius et al., 2003; Raichle et al., 2001; Shulman et al., 1997) and has been associated with introspective processes (Greicius et al., 2003) such as episodic memory (Vincent et al., 2006), decision-making (Buckner and Carroll, 2007), and moral judgment (Harrison et al., 2008). Furthermore, the DMN seems to be impaired in several neurological diseases and mental disorders (Cherkassky et al., 2006; Fassbender et al., 2009; Greicius et al., 2004; Garrity et al., 2007; Just et al., 2004; Mueller, 2007), and may thus possibly represent a putative biomarker.
Recently, resting-state data have been recently considered in conjunction with task-based fMRI as a means to incorporate both behavior and a biological basis into the interpretation of connectivity data (Horwitz, 2003). These possibilities led to the widespread use of resting-state protocols to investigate intrinsic connectivity networks, but some caveats have been raised: it is more likely that an individual will fall asleep, become uncomfortable, or become fatigued when he or she is not engaged in an active task (Wilson et al., 2014). Furthermore, the financial costs of adding resting-state runs to experimental sessions limit their use.
A possible way to overcome these problems is to reduce the task-related signal, as an attempt to enable the evaluation of the resting-state data embedded in task-based experiments (Arfanakis et al., 2000; Fair et al., 2007). However, Treserras et al. (2009) showed that motor readiness increases connectivity between regions of the motor network and the DMN. They implemented a readiness condition in which the volunteer was instructed to perform a movement when prompted, but the prompt was not presented. Thus, the authors suggested that the DMN, in addition to the cortical motor areas and basal ganglia, plays a role in the preparation of movement. This finding indicates that using resting periods from task-based experiments as proxies of resting state conditions could be problematic when motor responses are required.
Treserras et al. (2009) evaluated a general readiness state without executing a motor task. Although the conceptual idea is clear, one aspect was not present in their experiment: whether actually executing the motor task influences the connectivity change between the motor network and the DMN. Such an influence could explain the divergence between their results and those obtained by Arfanakis et al. (2000) and Fair et al. (2007). Conversely, the contrasting results may be due to the different levels of readiness involved in the tasks.
To explore this discrepancy in the literature and add new information to this field, we aimed to address the following related questions: (1) do readiness and execution of the motor task per se affect the connectivity between the DMN and motor networks? and (2) can resting periods from task-based experiments be used as resting-state data to study intrinsic connectivity? We hypothesized that readiness along with a motor task would induce additional changes in connectivity between the networks that could last for minutes. If this hypothesis were confirmed, it would indicate a limitation when interpreting connectivity analysis from resting periods during task-based experiments on the same basis as resting-state data.
To test our hypothesis, fMRI data were acquired during two motor runs (one with variable and one with constant intervals between tasks), and during two resting-state runs (one before and one after the motor runs). The motor run with variable intervals was expected to induce higher motor readiness effects because the volunteer had to be ready to perform the task at any time. The motor and readiness effects differences by comparing the functional connectivity during motor task periods to that of interval periods during motor runs. We also directly tested the possibility of using interval periods between tasks to study intrinsic functional connectivity by comparing their connectivity to the ones found during pure resting states. Finally, by contrasting the two pure resting states, we were able to look for minute-lasting (long-lasting) alterations in connectivity caused by motor runs.
Material and Methods
Subjects
Twenty subjects (12 males; mean [SD] age, 25 [5] years, ranging from 18 to 36 years) participated in the study. All volunteers were right handed [Edinburgh Handedness Inventory (Oldfield, 1971); mean = 77, SD = 17] and had at least 8 years of formal education. A structured questionnaire was applied to exclude participants with a history of neurological diseases, psychiatric disorders, or extensive drug abuse. Informed written consent was obtained from each participant. The project was approved by the ethics committee of Faculdade de Medicina da Universidade de São Paulo (CAPPesq 0251/05) and was performed in accordance with the Helsinki Declaration.
Tasks
Figure 1 summarizes the experimental design. All volunteers performed two types of experiments: pure resting condition (PRC), which consisted of resting with open eyes and looking at a fixation image (square or triangle occupying 22′ of the visual field); and motor resting condition (MRC), in which subjects were instructed to start performing finger-tapping movements (during which the right thumb sequentially opposed the other fingers of the right hand) as soon as the fixation image changed and to stop when it changed back.
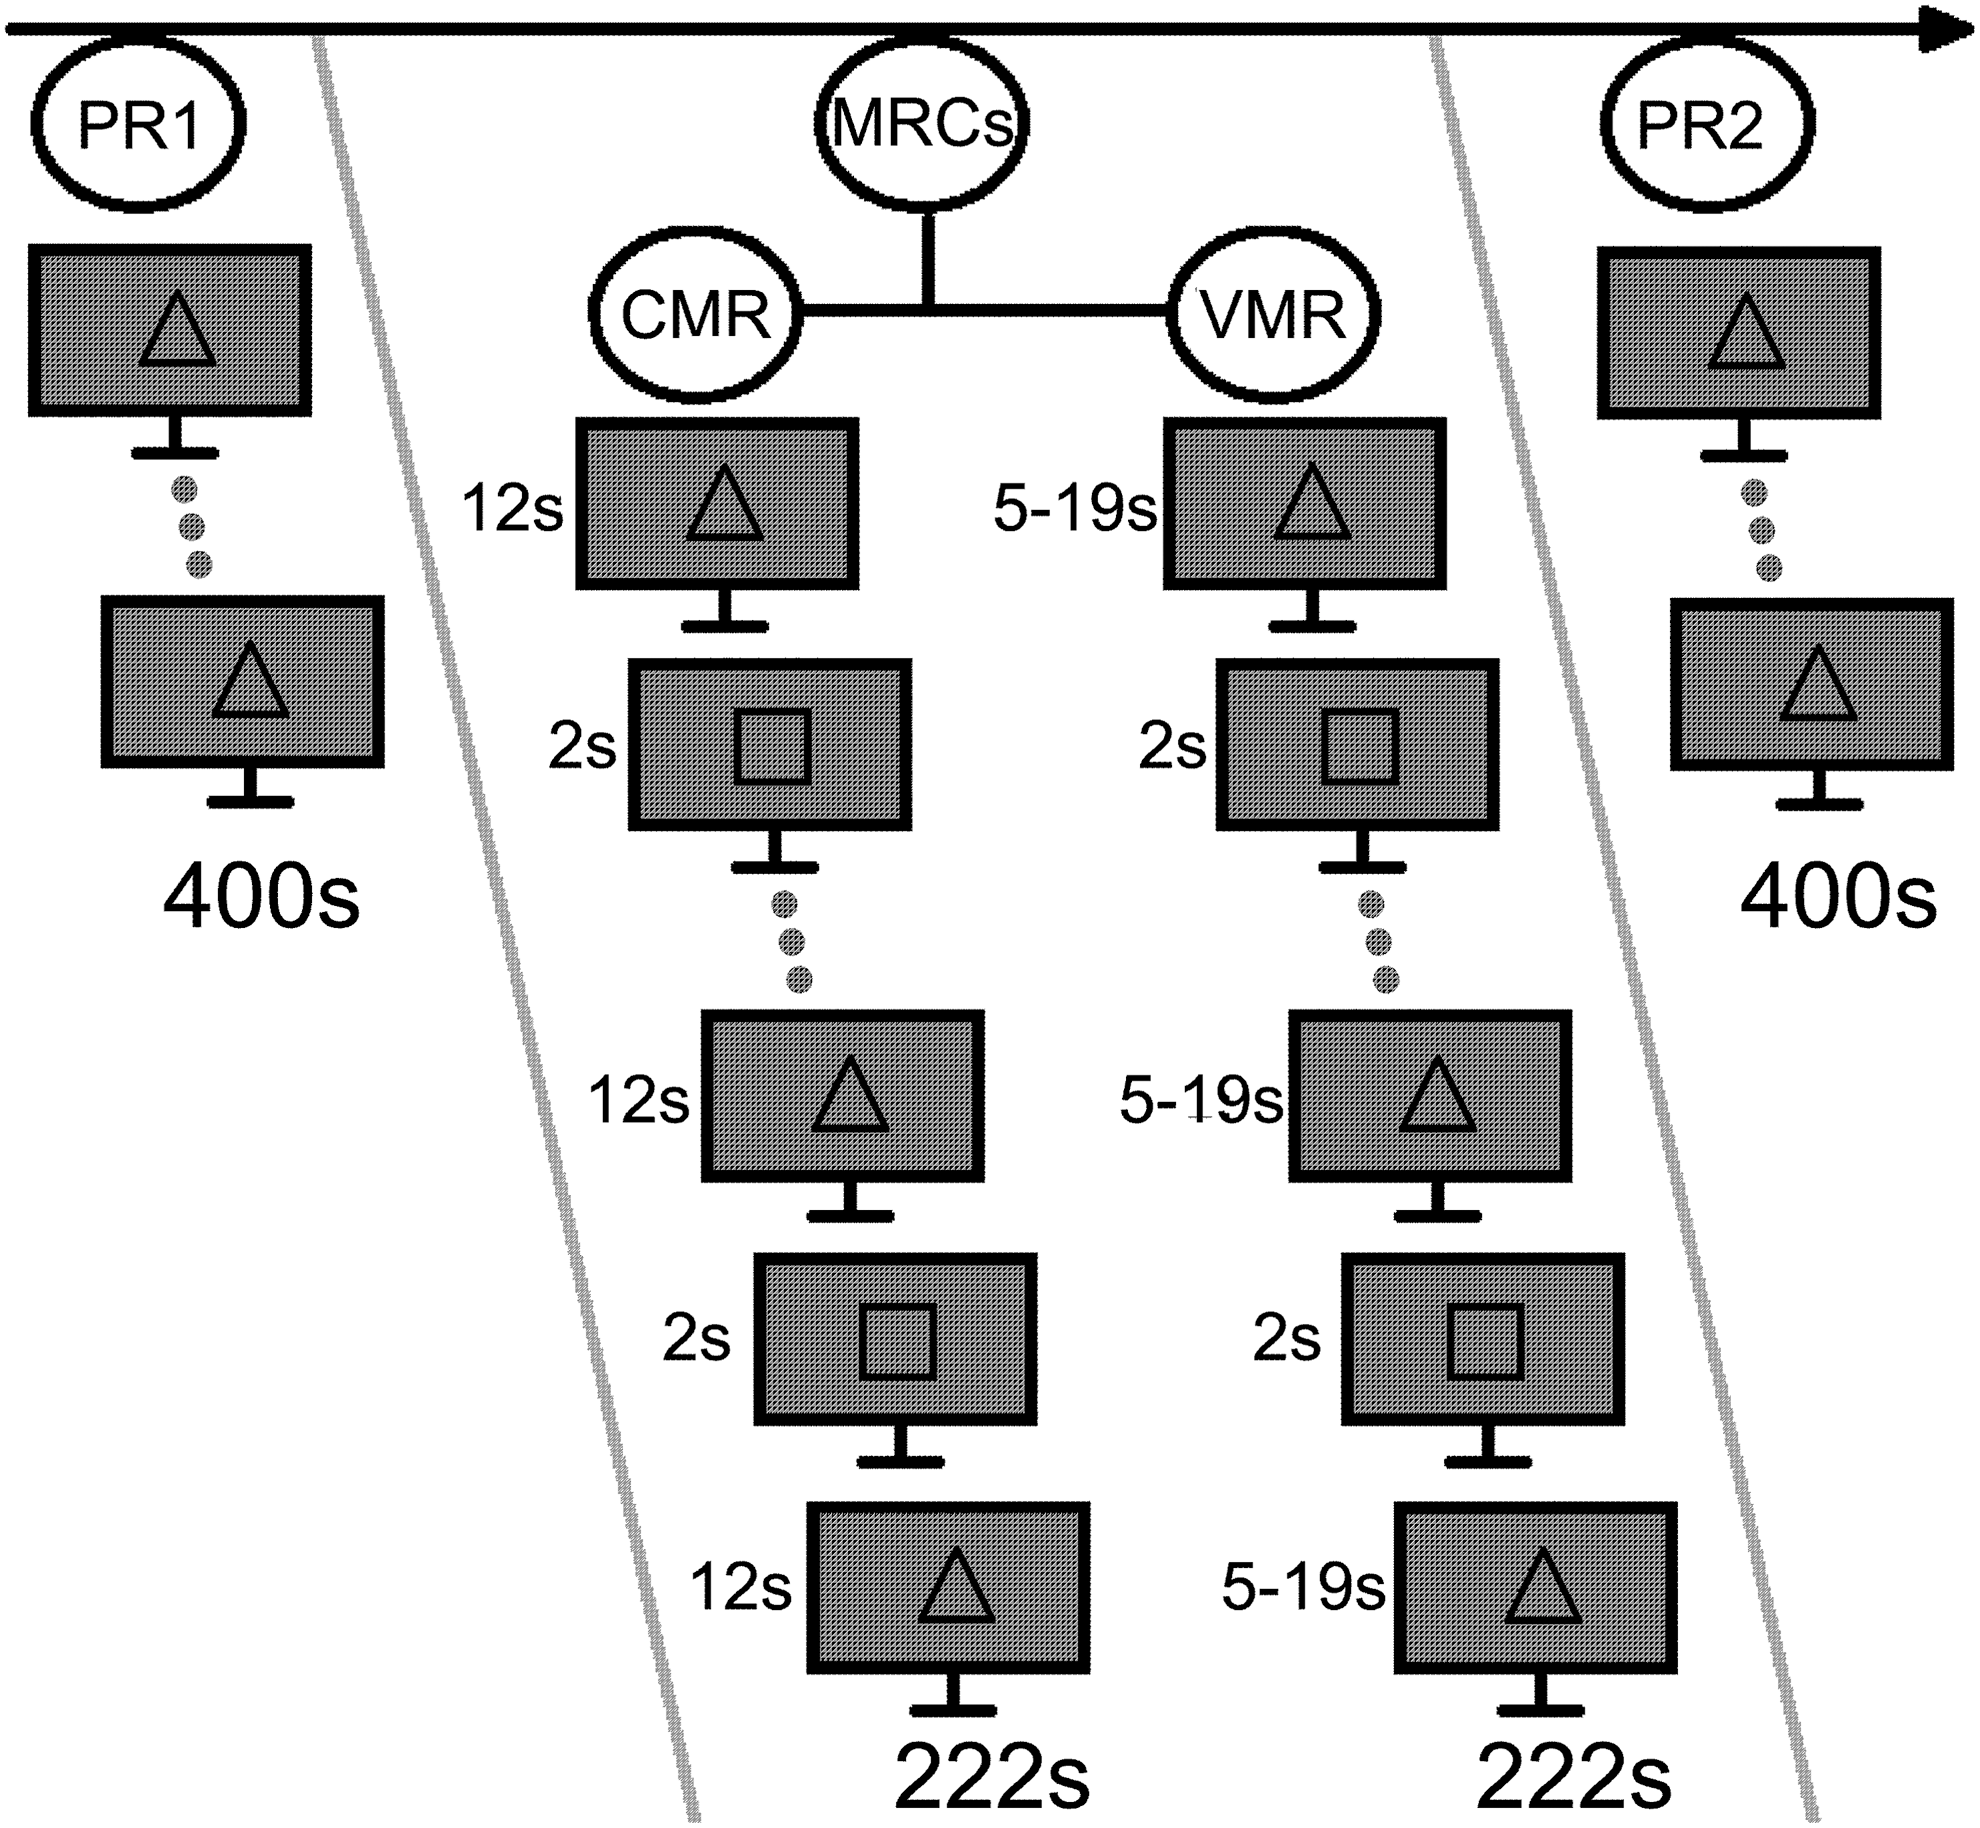
Experimental design, showing the order of the four experimental conditions: two pure resting (PR1 and PR2), constant motor resting (CMR), and variable motor resting (VMR). The image also presents an example of the stimuli used (we varied the meaning of square and triangle between subjects) and the duration of these stimuli, as well as the total time of each experiment. The order of the motor resting condition (MRC) was varied for each volunteer.
For the MRC experiments, the stimulus to indicate the finger tapping was presented for 2 sec and appeared 15 times during each run. Each subject performed two MRC experiments: the variable motor resting (VMR), in which the waiting time varied from 5 to 19 sec in a uniform random distribution; and the constant motor resting (CMR), in which the waiting time was constant (12 sec). The subjects were neither informed of experimental stimulus presentation timings nor instructed to pay attention to rhythm or any possible difference between the experiments. The order of the CMR and VMR experiments and the type of stimulus signaling the task were counterbalanced across subjects (for 50% of the subjects, a square-indicated movement and a triangle-indicated rest; for the remaining participants, the square-indicated rest).
The PRC experiment was also performed twice: the first PRC (PR1) was acquired before the fMRI tasks; and the second PRC (PR2) was implemented after the MRCs. All but one subject participated in another low-noise resting-state acquisition before the PR1, but the results of this scan are not explored in this article.
Data acquisition
All data were acquired using a 3.0 Tesla MRI system (Achieva–Philips), equipped with an 8-Channel head coil, a pulse oximeter, and respiration recording devices. The functional images were acquired using gradient-echo T2*-weighted sequences (TR = 2 sec, TE = 28 sec, flip angle =90°, voxel size = 3 × 3 × 3 mm3, 41 slices, field of view = 240 × 240 mm2; MRC scan duration = 3 min 42 sec; PRC scan duration 6 min 40 sec). In these sequences, we decided to add short sound pauses such that the scanner acoustic noise would act as a metronome. We used this manipulation to facilitate the identification of differences between the motor experiments (VMR and CMR), although participants were not instructed to identify any such differences. This allowed the volunteers to keep focus on the motor task and naturally react to predictable and unpredictable conditions.
Each EPI brain volume was collected in ∼1900 msec and a sound pause was added to complete the 2-sec TR. Two structural images (T1-weighted: TR = 7 msec, TE = 3.2 msec, flip angle = 8°, voxel size = 1 × 1 × 1 mm3, field of view = 240 × 240 mm2, scan duration = 6 min; T2-weighted: TR = 11,000 msec, TE = 130 msec, flip angle = 100°, voxel size = 0.7 × 0.9 × 5 mm3, field of view = 230 × 182 mm2, scan duration =2 min 45 sec) were also collected to permit the exclusion of participants with brain lesions.
All subjects wore a custom-made finger glove designed by Zurc & Zurc for use in the MRI environment. Its design includes a nonmagnetic conductive paint that is applied over gel fabric finger protectors. The glove was used to record the timing of each finger-tapping movement. After the experiment, the volunteers answered specific (direct and indirect) questions to evaluate whether they had identified the difference between MRC experiments. They also rated perceived task difficulty, boredom, and attentional focus during each condition.
Behavioral data and questionnaire analyses
We analyzed the reaction times and volunteers' ratings (in a scale from 0 to 10) for attention, difficulty, and boredom to evaluate behavioral differences between the tasks and to control for possible confounding factors. Behavioral data were analyzed using the R software (R Development Core Team 2011). A one-sided paired Wilcoxon test was performed to test whether response times were shorter during CMR than during VMR. Using the same test, we compared the mean response time difference between the first seven and the last eight trials from each condition. We also performed Wilcoxon paired tests (two sided) to determine whether the ratings given after the experiment differed between conditions. p-Values were false-discovery rate (FDR) corrected for multiple comparisons.
fMRI data analysis
In summary, fMRI data were analyzed using established preprocessing steps (see the Preprocessing section) and independent component analysis (ICA) to determine whether the DMN was identifiable as one of the main networks (see the Independent Component Analysis section). Then, we measured the functional connectivity between the precuneus and the right and left motor cortical regions of interest (ROIs). ANOVA tests were used to evaluate the differences in connectivity between experimental conditions (see the ROI-based analysis section). Our aim was to evaluate the changes in connectivity associated with readiness and hand movement, as well as the differences between task interval periods and pure resting states.
Preprocessing
Preprocessing steps were performed using the FSL software (Jenkinson et al., 2012). Movement correction, slice-timing correction, spatial smoothing (Kernel = 6 mm), and high-pass filter of 0.01 Hz were applied to the data. We used the 0.01 Hz high-pass filter to remove low-frequency artifacts and preserve the most significant DMN oscillations, which are ∼0.01–0.06 Hz (Wu et al., 2008). After these preprocessing steps, we registered the individual images to a standard template (MNI 152, 2 mm) using affine transformation with 12 parameters.
Independent component analysis
To assess whether the DMN was detectable as one of the main networks in all conditions, we performed group probabilistic independent component analyses. We concatenated the data matrices from the subjects (Svensén et al., 2002), using the MELODIC tool. A different ICA was performed for each experiment, using the whole runs of each subject. The number of components was constrained to 20 to reduce the subdivision of the main networks (Abou-Elseoud et al., 2010). Visual inspection was used to identify the group DMN component and the group motor network component in each experiment, based on the frequency of the components and their similarity to previous reports (Beckmann et al., 2005; Biswal et al., 1995; Damoiseaux et al., 2006; De Luca et al., 2006; Raichle et al., 2001).
ROI-based analysis
To evaluate the DMNs connectivity with the motor network and its differences between experimental conditions, we modeled the signal from the PCC as a function of the signals from two motor ROIs, as follows: We used the featquery FSL tool (Jenkinson et al., 2012) to extract the time series from three spherical (5 mm radius) ROIs: one in the PCC, one in the left sensorimotor cortex (LS1M1), and the last in the right sensorimotor cortex (RS1M1). The center of each ROI was placed at the same MNI coordinates (PCC: x = 4, y = −60, z = 18; RS1M1: x = 36, y = −22, z = 60; LS1M1: x = −36, y = −26, z = 54) as those used by Treserras et al. (2009).
Although recorded physiological data were acquired, they were discarded due to the bad quality of the signal, and a variation of global-signal regression was performed to reduce physiological noise. Instead of using a single whole-brain regressor (Fox et al., 2005), we segmented the brain into white matter, gray matter, and cerebrospinal fluid and used the three mean time series as regressors. This approach has similar properties to the traditional global mean regression (Jo et al., 2010).
To compare the effects of readiness and the effects of the task itself, the signals of each ROI were divided into two time series: the motor time series, which was composed of the time points corresponding to the finger tappings and the three following TRs; and the resting time series, which was formed by the remaining time points. This procedure was applied to separate most of the hemodynamic responses associated with finger tappings. To avoid effects from the cutting pattern in our comparisons, we applied in PRC experiments the same pattern of cut used in CMR experiments. After this filtering step, we standardized each times series.
In the first-level analysis, linear regressions were performed separately for each type of time series and for each time of experiment, totaling eight analyses per subject. In these analyses, the PCC signal was modeled as a function of the two motor ROIs. The beta coefficients from these linear models were introduced as measures of the dependent variable in the second level of analysis.
At this stage, repeated measures of ANOVA tests were used to evaluate the within-subject condition effect, inputting each experiment condition as categorical independent variables (1 factor, 4 levels: PR1, PR2, VMR, CMR). A total of four ANOVA tests were performed because the beta values from each motor ROI (RS1M1 and LS1M1) and each type of time series (resting time series and motor time series) were analyzed separately. Following this ANOVA, post hoc paired t tests were used to further understand the condition effect. These paired tests also analyzed differences between the expectation effect (resting time series) and the execution effect (motor time series). All of the p-values of these tests were FDR corrected for multiple comparisons.
Results
Behavioral data and questionnaires
The analysis of the questionnaires, which was used to control for confounding factors and evaluate the subjects' behavior, revealed no significant difference between the attention ratings (0 = totally focused; 10 = totally distracted) when comparing the MRCs (mean [SD]: CMR = 3.40 [2.35]; VMR = 3.25 [2.59]; corrected p = 1) or between the difficulty ratings (0 = really easy; 10 = really difficult) when comparing PRCs and MRCs (mean [SD]: PRCs = 2.5 [2.43]; MRCs = 1.82 [1.57], corrected p = 0.256). However, the boredom ratings (0 = not boring at all; 10 = extremely boring) were higher for the PRCs than they were for the MRCs (mean [SD]: MRCs = 3.60 [2.81]; PRCs = 5.2 [3.25]; corrected p =0.049). As such, we calculated the correlation between this rating and the changes in beta values, but found no significant correlation. In addition, of the 20 volunteers, only 8 (40%) correctly classified the motor experimental conditions when asked whether the interval between tasks was variable or constant in each experiment.
Reaction time data from nine volunteers (four males) were used to compare the behavior during MRCs. The other 11 participants were excluded from this analysis because data from some finger-tapping movements were not recorded (due to technical problems). For the individuals included in this analysis, reaction time data were available for at least 95% of the trials.
The reaction time during CMR presented a borderline tendency of being shorter than the reaction time during VMR (one-sided paired test corrected p = 0.062; mean [SD] difference 43.5 [7.4] msec). The reaction time difference between the first seven and the last eight trials (as described in the Material and Methods section) was greater in the constant condition (one-sided paired test corrected p-value = 0.049, mean [SD] difference 35.8 [4.5] msec). Of the nine volunteers included in this analysis, five correctly identified the difference between MRCs, but the changes in reaction time were uncorrelated with a correct classification.
Independent component analysis
The ICA revealed that the nodes that previous studies (Beckmann et al., 2005; Damoiseaux et al., 2006; De Luca et al., 2006; Raichle et al., 2001) described as the main characteristics of the DMN were present in all of the experimental conditions (Fig. 2). In all conditions, we found two main components associated with the DMN: one with the highest PCC influence and the other with strong loadings in the ventromedial prefrontal cortex.
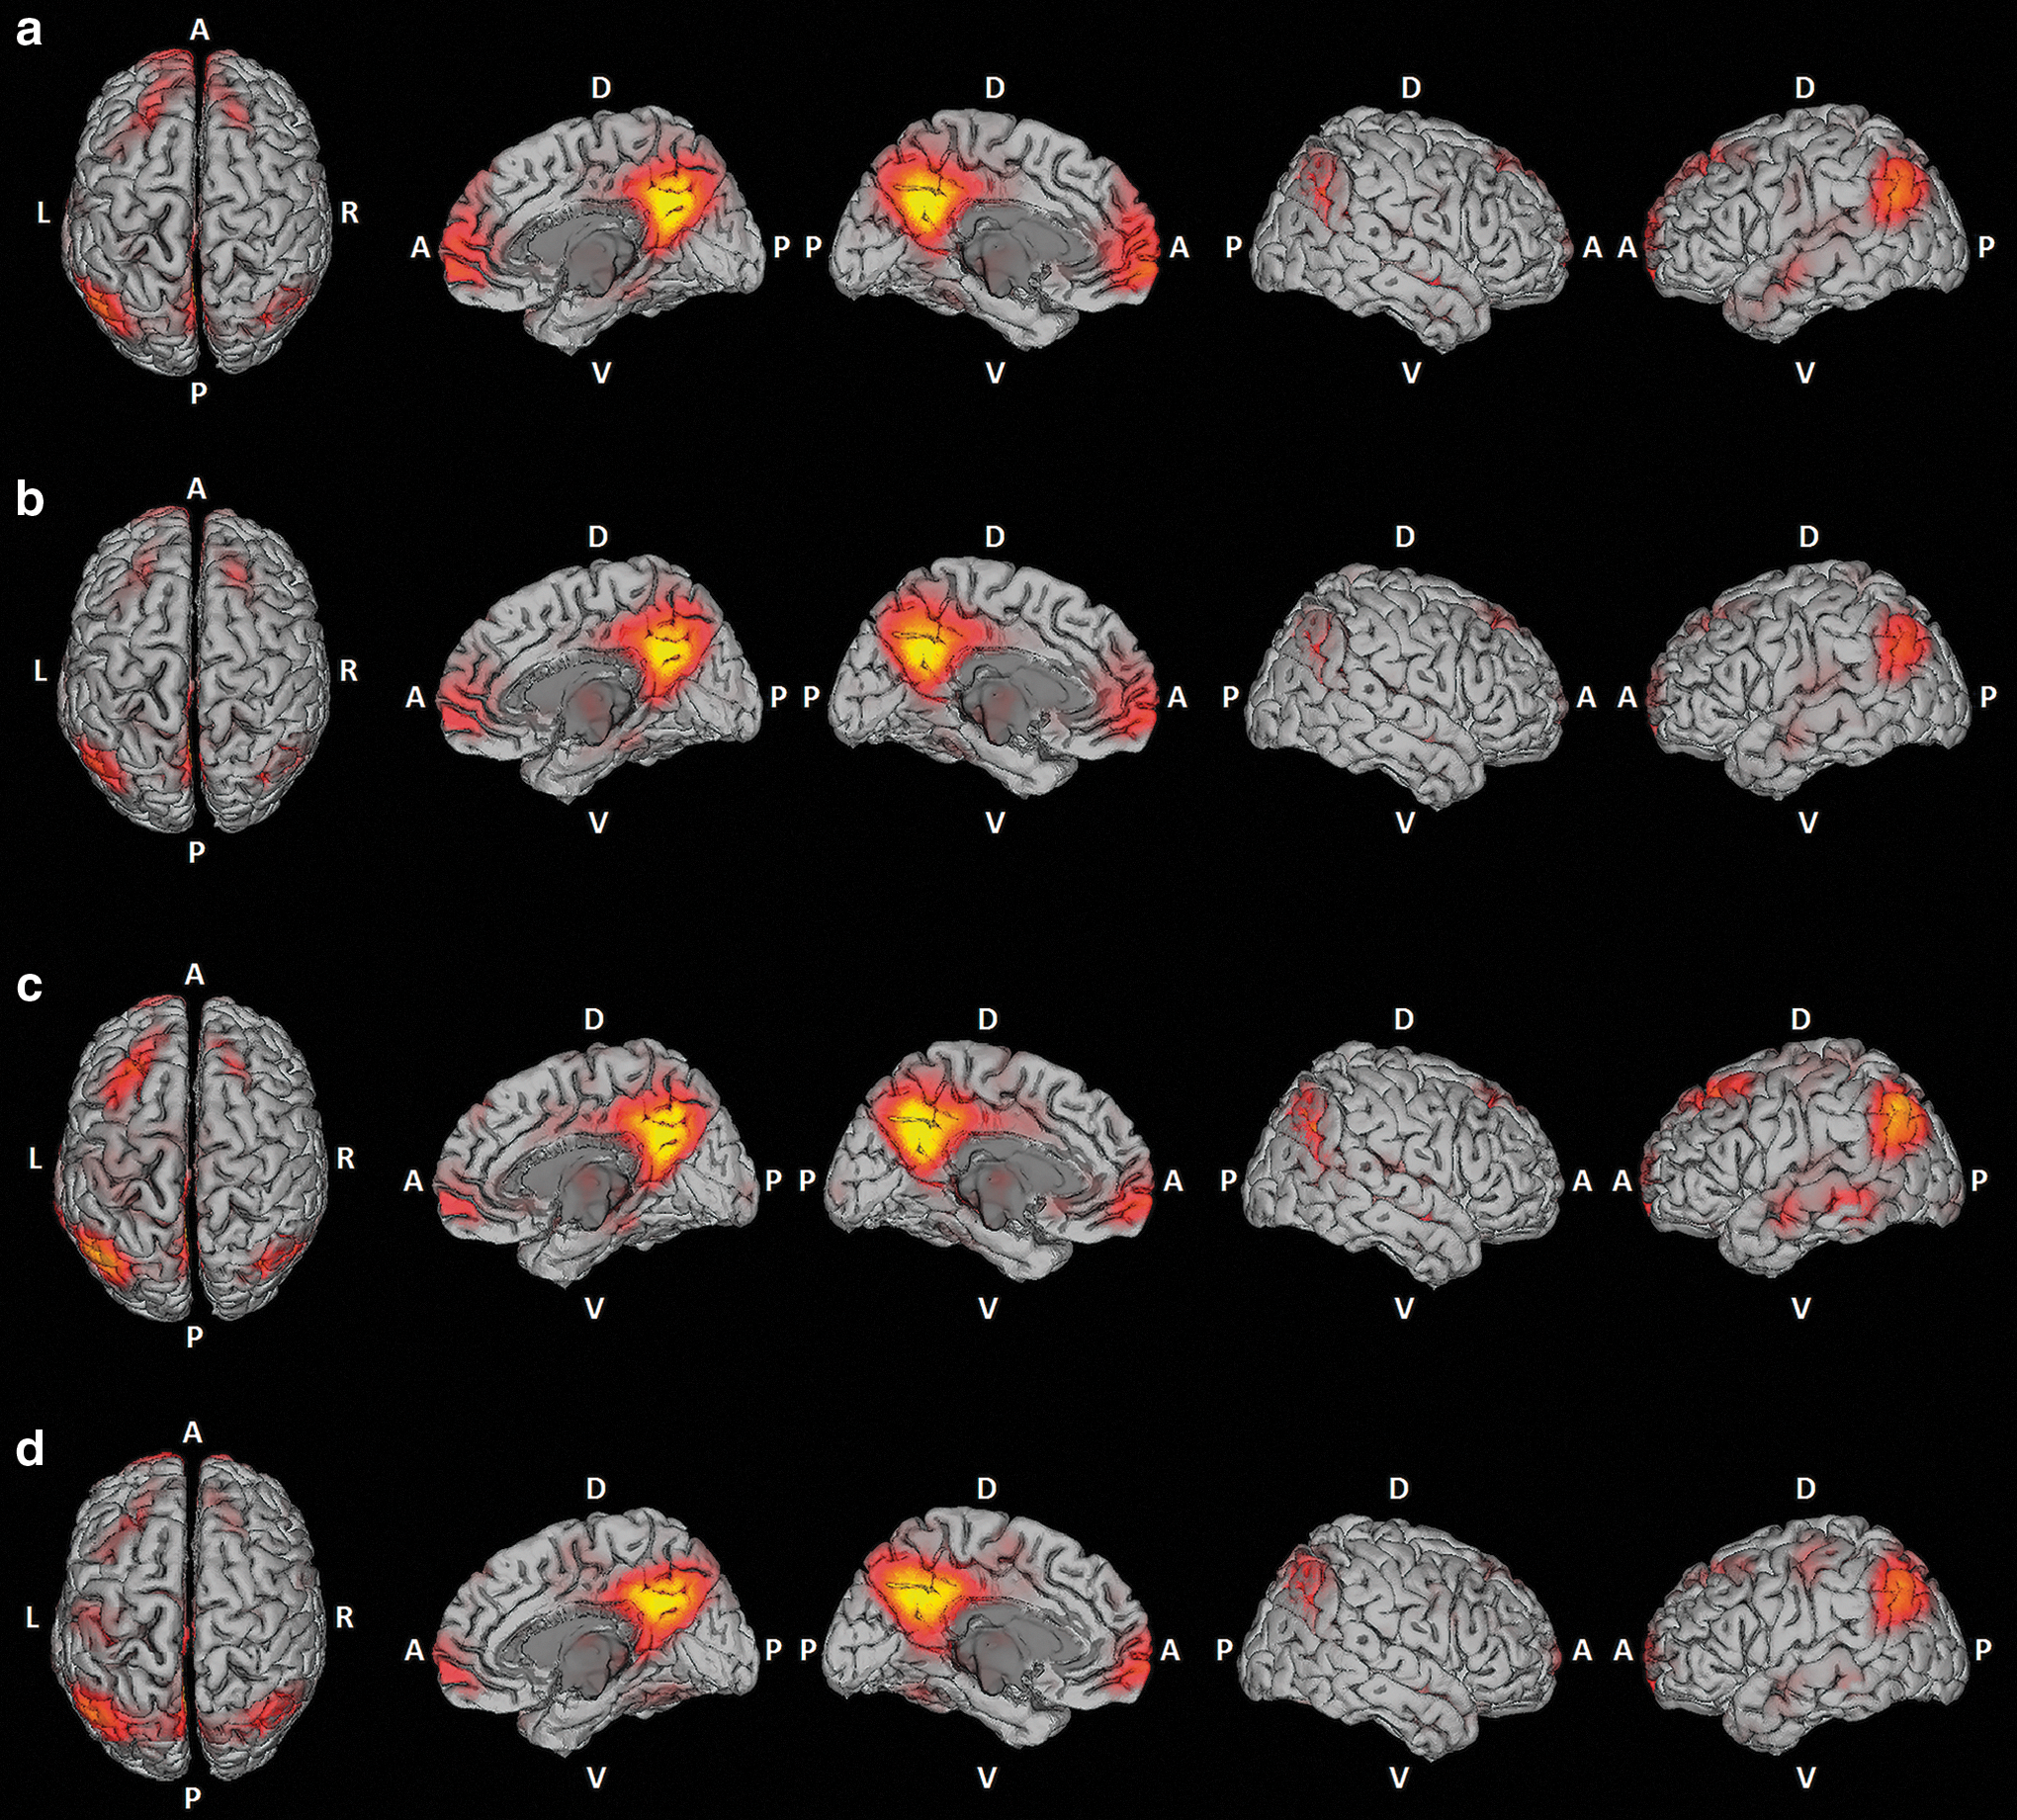
Independent component analysis (ICA) maps of the default-mode network's (DMN) main component for each experimental condition:
In addition, the sensorimotor network was identified in all experiments (Supplementary Fig. S1; Supplementary Data are available online at
The DMN PCC-focused component showed a change in frequency from the PRCs to the MRCs. In the CMR, the main power peak was found in the same frequency of the motor network component (Fig. 3), which was the frequency of finger-tapping stimulus presentation (0.071 Hz). A similar effect is additionally apparent in the VMR because we found some power peaks of the DMN in the same frequency as those of the motor network. During PRCs, the main frequencies of both networks seemed to be lower than in MRCs and were below 0.05 Hz (Fig. 4).
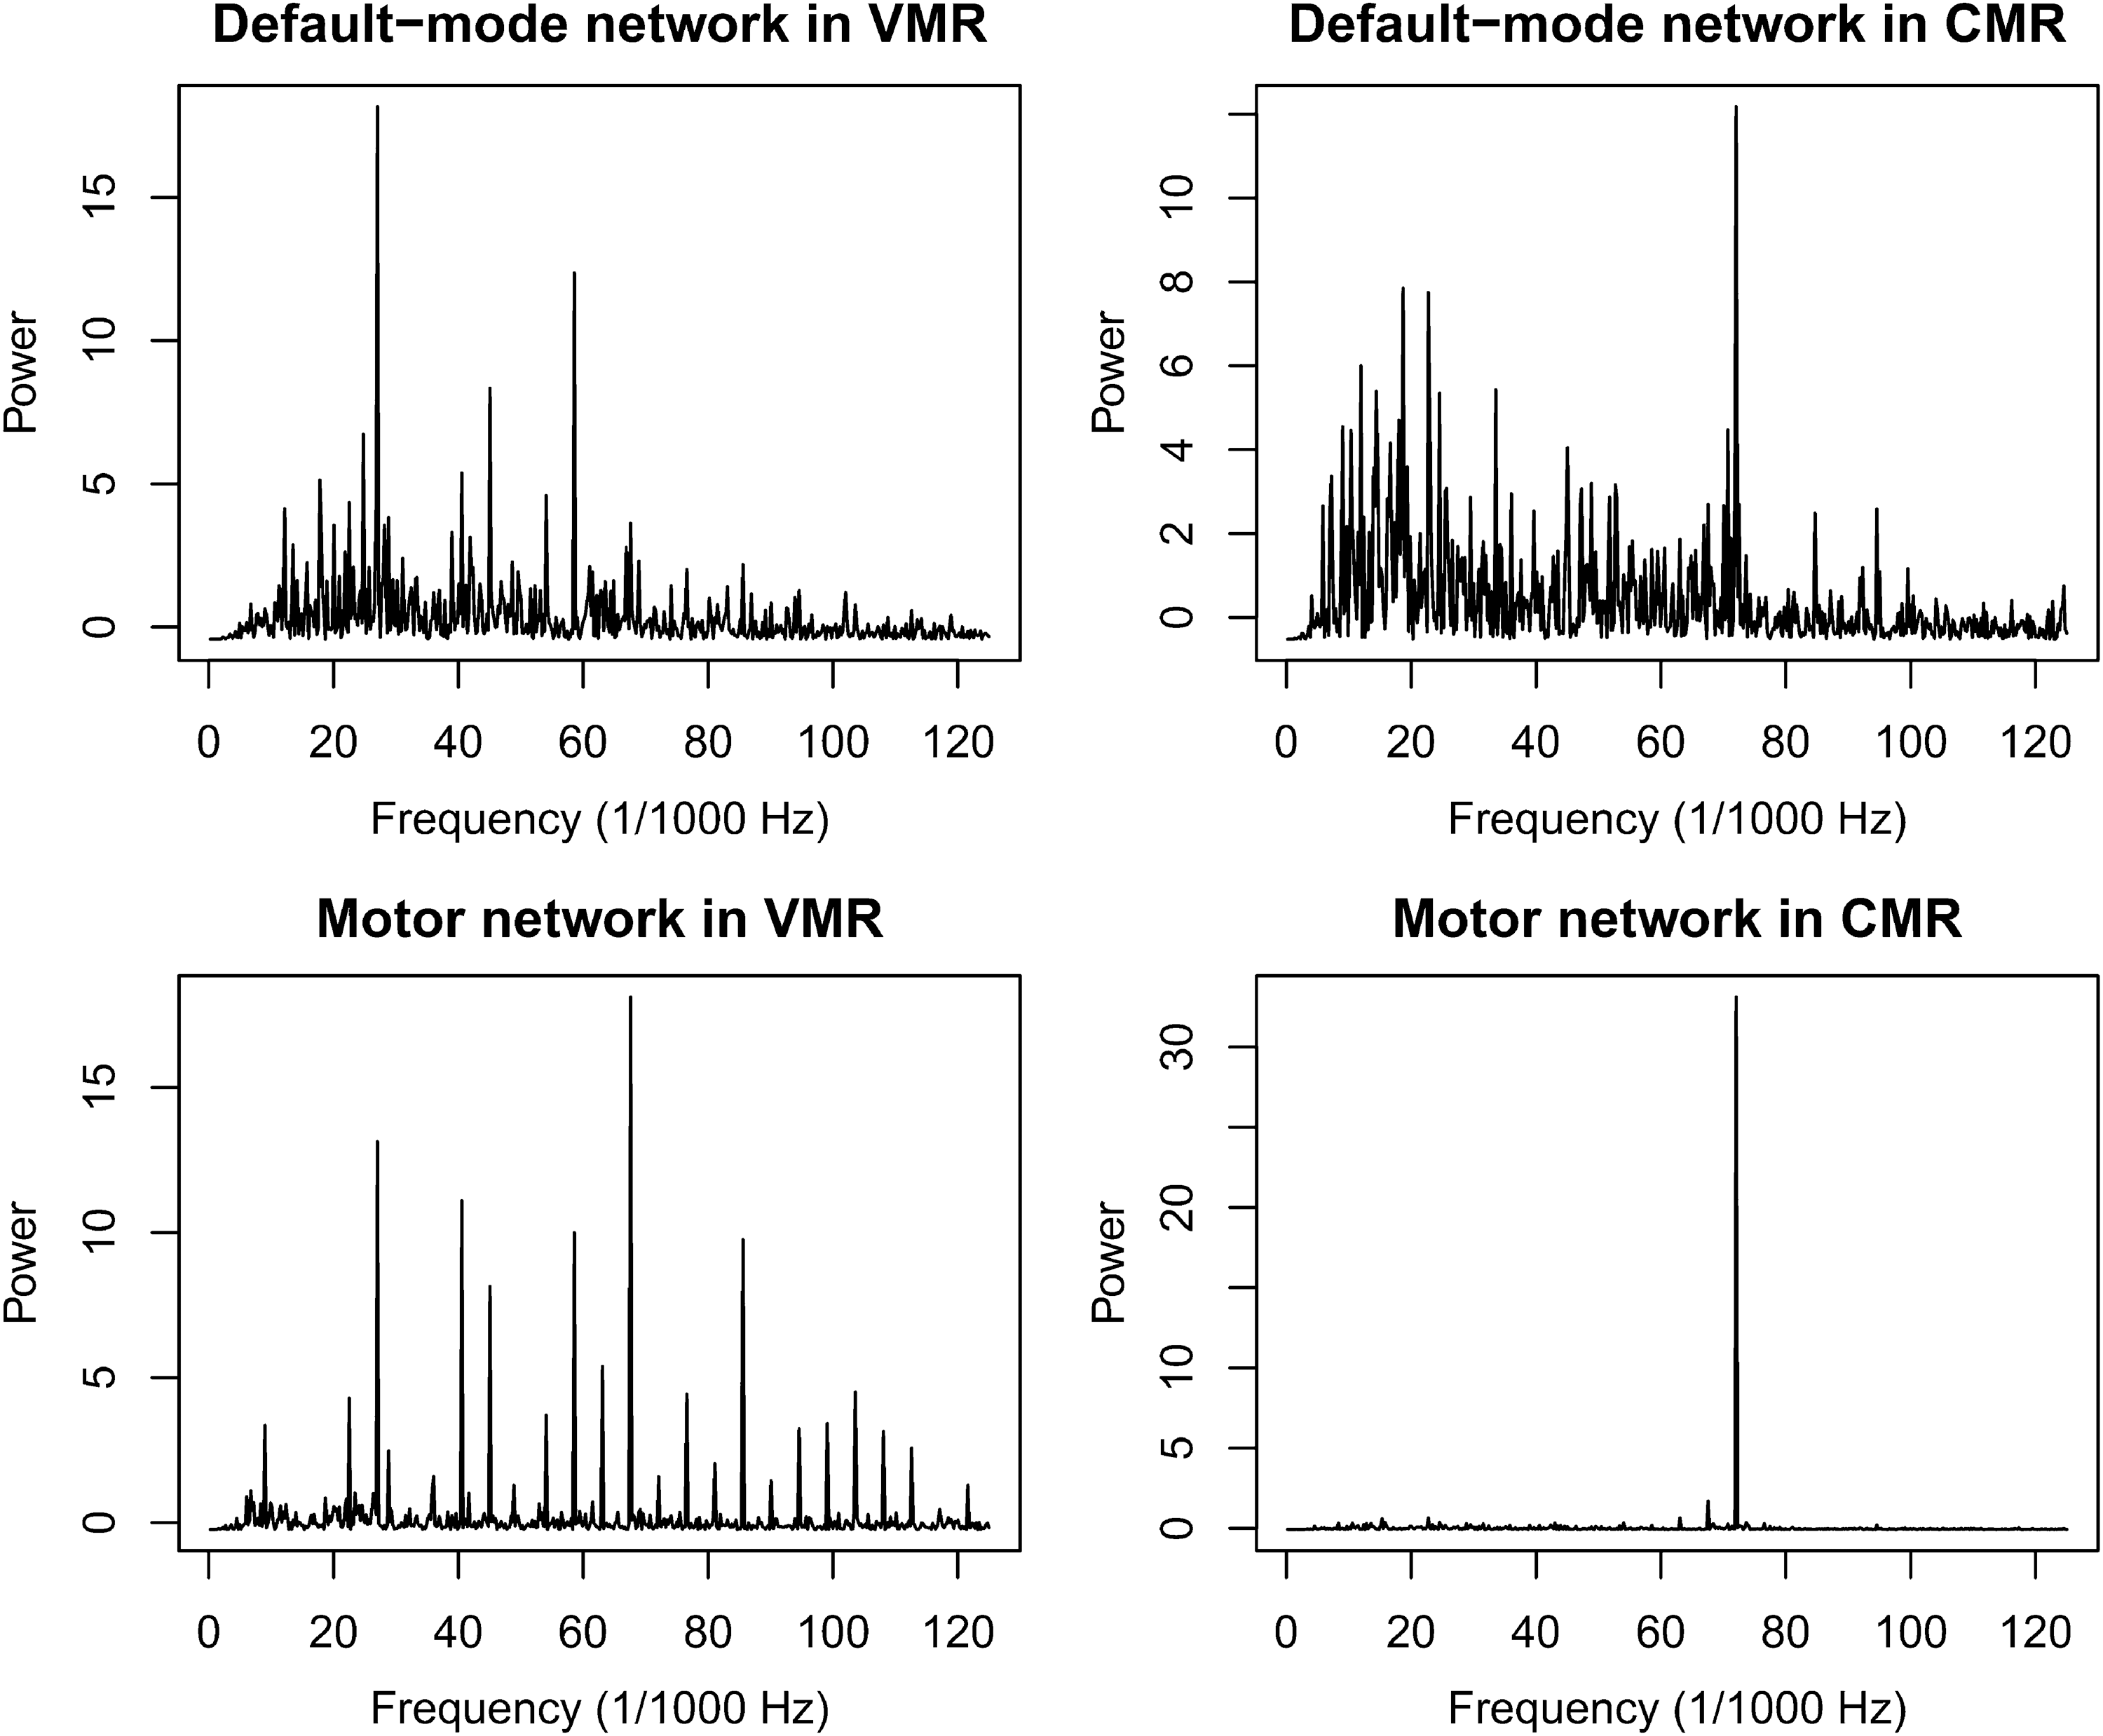
Power X frequency plots showing the spectrum of the time series for the main DMN and motor network components during both motor conditions. Note that the main peaks of the DMN are in the same frequency as some of the main peaks of the motor network, in both conditions.
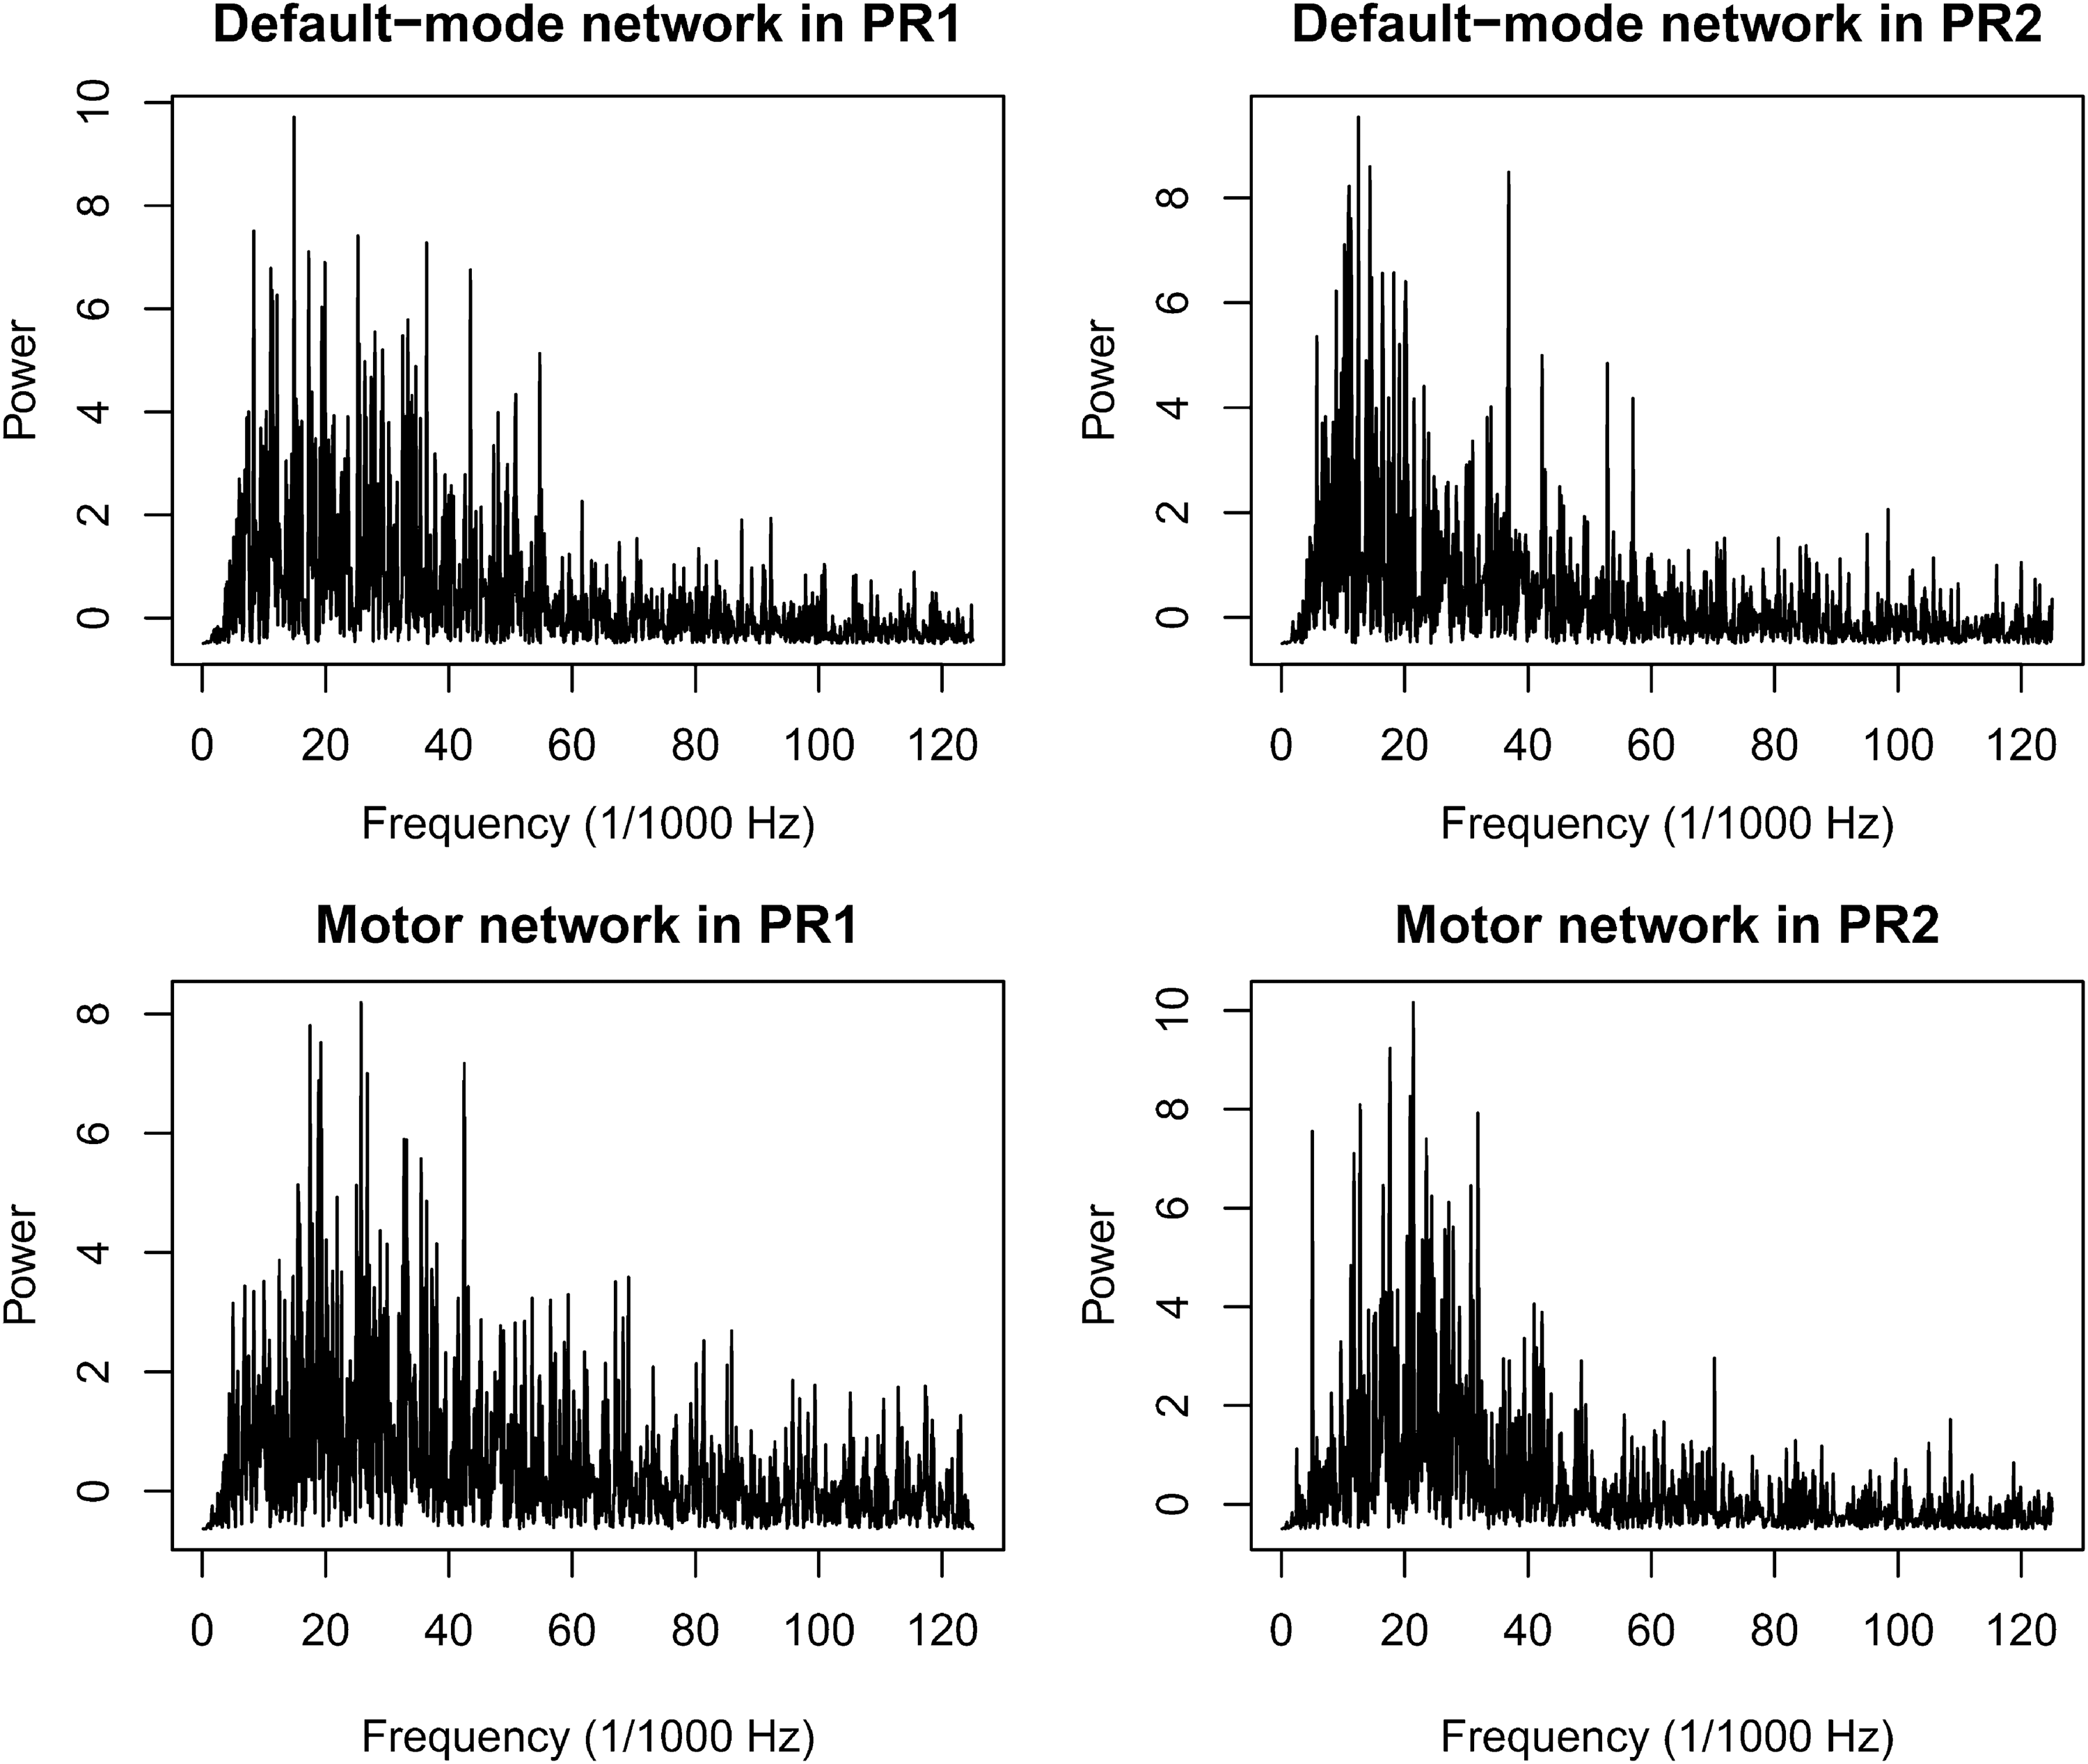
Power X frequency plots showing the spectrum of the time series for the main DMN and motor network components during the first (PR1) and second (PR2) pure resting conditions. Note that the frequencies of both networks are low, mostly below 0.05 Hz.
ROI-based analysis
ANOVAs for the beta values of the RS1M1 ROI showed significant condition effects only for the resting time series (resting time series F(3,57) = 3.73, corrected p = 0.048; motor time series F(3,57) = 0.22, corrected p = 0.966). Paired comparisons revealed that these effects are associated with higher beta values during the resting time series of VMR condition (Fig. 5a and Table 1). Only in this time series was a significant relationship observed between RS1M1 and PCC (Supplementary Table S1).
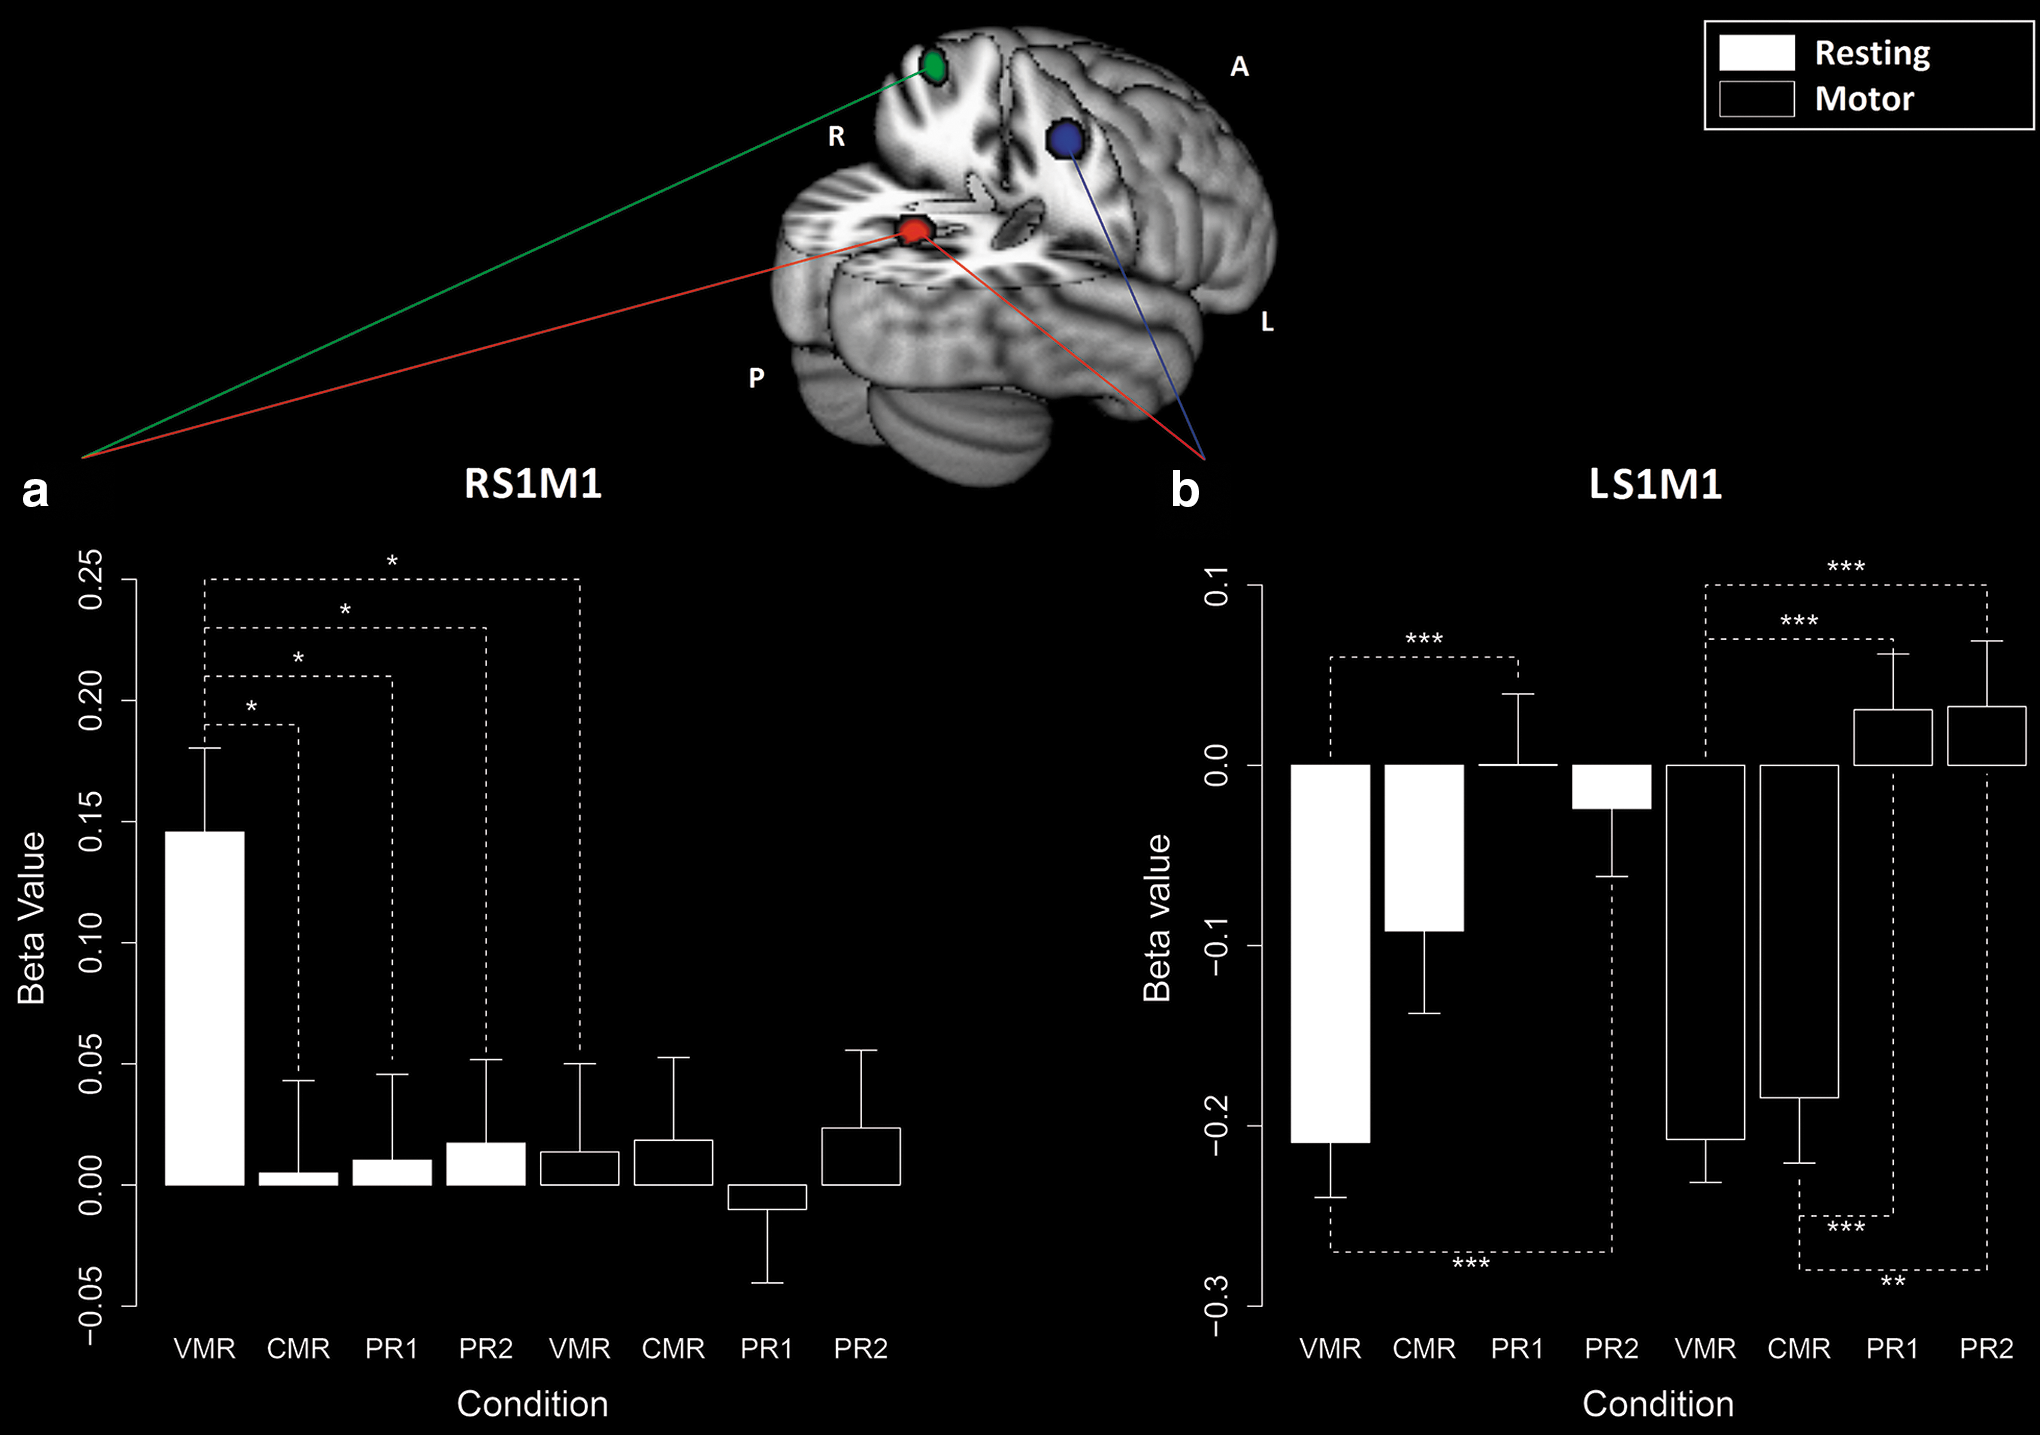
Connectivity analysis and ROIs' locations on the standard MNI brain (152 volunteers, 2 × 2 × 2 mm): precuneus ROI (bottom); left sensorimotor cortex (LS1M1) ROI (middle); and right sensorimotor cortex (RS1M1) ROI (top). Note that the image is in the radiological orientation (left and right are inverted). The Graphs present the beta values associated with RS1M1
Beta-Value Differences and Corrected p-Values Comparing Experimental Conditions
The differences were calculated and tested separately for the right (RS1M1) and left (LS1M1) sensorimotor cortical ROIs and for each type of time series (resting and motor). Significant differences (corrected p < 0.05) are in bold.
CMR, constant motor resting; PR1, first pure resting; PR2, second pure resting; ROIs, regions of interest; VMR, variable motor resting.
In contrast, ANOVAs for the LS1M1 presented significant condition effects for both time series (resting time series F(3,57) = 7.92; motor time series F(3,57) = 20.33; both corrected p-values were smaller than 0.001). Paired tests indicated that these effects are associated with more negative beta values during both MRCs when analyzing the motor time series and during VMR condition for the resting time series (Fig. 5b and Table 1). In the other conditions, the beta values were not different than zero (Supplementary Table 1).
Comparing the beta values from motor and resting time series, we found only one significant difference: a higher value for the RS1M1 during the resting intervals (Fig. 5a and Table 2).
Beta-Value Differences Between Resting and Motor Time Series for Each Experimental Condition
The differences were calculated and tested separately for the right (RS1M1) and left (LS1M1) sensorimotor cortical ROIs. Significant differences (corrected p < 0.05) are in bold.
Finally, as a post hoc analysis, the interaction between motor ROIs was included as an explanatory variable in the first-level linear regressions. However, the interaction effect was not significant, and the effects of each motor ROIs were similar to those found in the analysis without the interaction term.
Discussion
In this investigation, we showed connectivity changes associated with readiness and the execution of a simple movement between nodes of the motor network and the DMN. We expected different interactions between the DMN and the motor network associated with the readiness and the execution states. The main features of these interactions would be an increased connectivity between motor regions and the DMN during the readiness periods and by negative partial correlations during the execution of the finger tapping. The experimental setup also allowed us to look for a longer internetwork effect of the task. Furthermore, our methodology was suitable to evaluate the use of data from intervals between tasks as resting-state data. To our knowledge, this was the first study to analyze all of these aspects together.
As predicted, the connectivity increases between the DMN, and RS1M1 were specific to the resting periods of VMR condition, which indicates that connectivity is modulated by the readiness to execute finger movements. In addition, in the motor time series, we observed the expected negative beta values for motor cortex associated with the finger-tapping hand. However, this effect was also present during the waiting intervals of the VMR condition. Contrary to our expectation, there was no significant difference when comparing the PRCs, which indicates no long-lasting change in connectivity associated with the task. We also found that the DMN was still organized as a network, as identified by the ICA technique in all conditions. Together, these results reveal an issue in the use of data from resting periods of event-related experiments as resting data for connectivity analysis.
These results demonstrate differential effects of preparation and execution of movement on connectivity. During VMR, the individual cannot accurately predict the occurrence of the upcoming stimulus and is therefore continually ready to perform the task. In contrast, in the CMR condition, the constant pace elicits lower expectation between trials and enhanced expectation at the time immediately preceding the initiation of movement.
The notion of condition-specific mindsets is behaviorally supported by the RT data (stronger reduction along CMR than along VMR condition). These results may indicate that the pattern of stimulus presentation was identified along runs. Also, only 5 of the 9 participants who were included in RT analysis and 8 of the 20 total volunteers consciously and correctly identified the difference between tasks, which indicates that there might be an unconscious processing of the pace of stimulus presentation. However, the fact that only nine volunteers were evaluated in the RT analysis limits the interpretation of our results.
The increased connectivity between PCC and RS1M1 in the VMR condition can be interpreted as being related to expectation and preparation for movement. This result is in line with the work of Treserras et al. (2009), who studied the difference in connectivity from a resting state to a movement-readiness condition, whereby the volunteer was instructed to execute a cued movement. Because the cue was not presented, the subject was continuously in this readiness condition. With this methodology, they observed increased connectivity between PCC and RS1M1. They also found a connectivity decrease between the left and right sensorimotor cortices. Our results support the model that they proposed for the movement-readiness condition, which included the PCC in the premotor control system.
In this model for right hand movement, the anterior cingulate cortex communicates with the PCC, which sends signals to the right motor cortex and the upper precuneus, and they both communicate with the caudate nucleus and left motor cortex. The different pattern of interaction with left and right motor regions indicates that the PCC would be important for the preparation of a motor task and, possibly, the selection of the hand to be used in the task.
Our study develops the evidence presented by Treserras et al. (2009) because we additionally assessed negative correlations. In fact, we found a negative partial correlation between the PCC and the LS1M1 in both motor task conditions and during the intervals of the VMR condition. Despite some indication from the first studies of the DMN that a simple motor task was not sufficient to produce decreases in the DMN activity (Shulman et al., 1997), the negative correlations between PCC and LS1M1 that we found are in agreement with more recent results that show the negative correlation of the DMN with a motor task (Marchand et al., 2007). Importantly, and unexpectedly, a negative correlation was present in the intertrial rest period of the VMR condition. This is potentially attributable to the intertrial interval not being sufficiently long to dissociate the hemodynamic responses that are associated with the execution of the task. Alternatively, this could be a postmovement effect. Contrary to these hypotheses, the data from the CMR condition did not display this effect, which suggests that this effect is directly related to the readiness for movement. Considering these possibilities, the negative correlation between LS1M1 and PCC seems to be associated with both task preparation and execution.
The fact that the PCC showed a positive relationship with RS1M1 and a negative relationship with LS1M1 suggests that the DMN inhibits the preparation of the left hand and preferentially improves the selection of the right hand. Moreover, we found that actually doing the motor task does not interfere with the readiness connectivity, given that our results for the readiness state (increased connectivity between PCC and RS1M1) are similar to those of Treserras et al. (2009). Another important development of the present study in relation to Treserras et al. (2009) is that both motor regions simultaneously included in the linear model. Since both motor regions are expected to interact with the PCC during the experiments, our approach provides a better modeling of the data.
The reported changes in connectivity were not sufficient to disrupt the organization of the DMN, which was consistently identified through ICA. However, changes in the spectral distribution of the main DMN component during MRCs indicate that the entire network is affected by the motor tasks. ICA is suited for the detection of large networks and was thus not capable of detecting changes as those observed with linear regression, which is a method more sensitive to small connectivity changes. Taken together, the evidence obtained using both methods points to sustained intranetwork, but altered internetwork, connectivity associated with the preparation and execution of movement.
It is important to note that the entire time series were used for ICA, thus limiting our interpretation of the effect of preparation and motor execution separately in this analysis. Nevertheless, both motor conditions had similar results, which suggests the alteration in frequency is due to the negative correlation of DMN with task, which is present in both MRCs.
In addition, the fact that both the ICA and ROI-based connectivity analysis showed similar results for both PRCs indicates that the motor task used does not have a long-term effect (on the scale of several minutes) on these measurements. Previous studies have shown that language and motor learning tasks may induce long-term alterations of connectivity (Albert et al., 2009; Waites et al., 2005). Our task, which was generally rated as easy (rated less than 2 on average, in a difficulty scale from 0 to 10), was potentially too simple to induce such alterations.
Previous studies have used simple sensorimotor paradigms (Greicius et al., 2004) or data from intervals between task blocks (Cherkassky et al., 2006) as resting-state data. In fact, Fair et al. (2007) studied the use of block-designed and event-related experiments as resting-state data for connectivity analyses. They found that data from fixation periods of block tasks presented connectivity patterns very similar to those of resting-state data. In contrast, the connectivity analysis with data from event-related designs (filtered to remove effects from the task) presented similarities to the resting-state analysis, but regions of the DMN presented connectivity differences. Arfanakis (2000) suggested that using ICA to filter task periods of block-designed experiments would yield results that are close to the resting-state results.
Based on our findings, the differences in event-related data analysis might be associated with similar readiness effects because the interval between tasks was pseudorandom. The blocked design might have presented fewer differences from resting state because of the lower expectation for the task. The interval between blocks is usually constant, and because the participants are told (or easily learn) that the tasks occur in blocks, they can be reasonably considered to be less prepared for the task during the intervals.
The similarity between data from the fixation intervals during the CMR condition and the resting-state conditions is in accordance with this idea, thus indicating that intervals with lower associated readiness could be used as resting-state data. Therefore, we advocate special care when evaluating the participant's expectations during task design and interpreting the resting-state data derived from task-based fMRI runs.
In our analysis, we used a variation of global signal regression to extract physiological noise. This procedure may induce negative connectivity (Murphy et al., 2009). However, it increases specificity of positive relations (Weissenbacher et al., 2009), thereby strengthening the significance of the relationship found between RS1M1 and PCC. Regarding the negative connectivity observed between PCC and LS1M1, there is evidence that the negative correlation commonly presented by the DMN cannot be entirely attributed to artifact correction (Fox et al., 2009). In addition, because we are mainly interested in comparing conditions and not in the absolute value of the connectivity, this method should not compromise our results.
In the same line, the reaction time analysis might not be the best way to determine the perception of the volunteer because it is influenced by the frequency of finger tapping. However, the effect should be the same in both conditions, and the comparison between CMR and VMR remains valid.
Analyzing the questionnaires indicated that the differences between PRCs and MRCs are not affected by the difficulty of the task; and that the differences between CMR and VMR are not associated with a conscious decay of attention from one condition to the other. The boredom grade was higher for PRCs than for MRCs, but was uncorrelated with connectivity changes, which suggests that boredom did not significantly affect the reported findings.
Conclusion
This study shows that readiness for a motor task alters the connectivity between the DMN, particularly the PCC, and the motor network. This change in connectivity seems to be a part of movement processing, and is based on the hand used in the task, as suggested by the different partial correlations of PCC with left (negative) and right (positive) cortical motor regions during preparation for right hand finger-tapping movements.
The reliability of the ICA-derived representation of the DMN indicates that, by contrast, the intranetwork connectivity is not disrupted. Because DMN deactivation is found during a broad range of cognitive tasks (e.g., language and working memory), similar connectivity changes are predictable for other networks and other tasks, which would in turn indicate the fundamental importance of the DMN in task transition. Conversely, this may be a characteristic specific to motor preparation. Other studies should perform similar tests with different tasks. Finally, our findings reveal a potential limitation for using data from resting periods of event-related tasks as resting-state data for connectivity analysis. Evaluating volunteer expectation in relation to task requirements is therefore recommended during the design and interpretation of connectivity studies.
Footnotes
Acknowledgments
We would like to thank Thomas White, Sukhi Shergill, and Raymundo Neto for their help reviewing the article and for their insightful suggestions that helped improve this article. Also, we thank Fundação de Amparo à Pesquisa do Estado de São Paulo (Foundation for Research Support of the State of São Paulo, or FAPESP) for the grant for this research (2010/18874-9). Finally, we would like to thank Gilson Vieira and all the other members of LIM 44 for our brainstorming discussions about the present work.
Author Disclosure Statement
No competing financial interests exist.
References
Supplementary Material
Please find the following supplemental material available below.
For Open Access articles published under a Creative Commons License, all supplemental material carries the same license as the article it is associated with.
For non-Open Access articles published, all supplemental material carries a non-exclusive license, and permission requests for re-use of supplemental material or any part of supplemental material shall be sent directly to the copyright owner as specified in the copyright notice associated with the article.