




Abstract
A group of 21 autistic children were studied for determining the relationship between the anatomic (AC) versus functional (FC) connectivity, considering short-range and long-range brain networks. AC was assessed by the DW-MRI technique and FC by EEG coherence calculation, in three experimental conditions: basal, watching a popular cartoon with audio (V-A), and with muted audio track (VwA). For short-range connections, basal records, statistical significant correlations were found for all EEG bands in the left hemisphere, but no significant correlations were found for fast EEG frequencies in the right hemisphere. For the V-A condition, significant correlations were mainly diminished for the left hemisphere; for the right hemisphere, no significant correlations were found for the fast EEG frequency bands. For the VwA condition, significant correlations for the rapid EEG frequencies mainly disappeared for the right hemisphere. For long-range connections, basal records showed similar correlations for both hemispheres. For the right hemisphere, significant correlations incremented to all EEG bands for the V-A condition, but these significant correlations disappeared for the fast EEG frequencies in the VwA condition. It appears that in a resting-state condition, AC is better associated with functional connectivity for short-range connections in the left hemisphere. The V-A experimental condition enriches the AC and FC association for long-range connections in the right hemisphere. This might be related to an effective connectivity improvement due to full video stimulation (visual and auditory). An impaired audiovisual interaction in the right hemisphere might explain why significant correlations disappeared for the fast EEG frequencies in the VwA experimental condition.
Introduction
Autistic spectrum disorder (ASD) is currently demarcated in terms of a triad of impairments in social interaction, communication, and behavioral flexibility (Zwaigenbaum and Howarth, 2011). ASD has been defined as a neurodevelopmental disorder with associated deficits in executive function, language, emotional, and social function (Baron-Cohen and Belmonte, 2005; Baron-Cohen et al., 2005; Belmonte et al., 2004a, 2004b; Bellando and Fussell, 2011; Best et al., 2008; Boisvert et al., 2010; Daniels et al., 2011; Hill & Frith, 2003; Horovitz et al., 2011a, 2011b; Mattila et al., 2010; McPartland et al., 2011; Rapin and Tuchman, 2008a, 2008b; Zwaigenbaum, 2010a, 2010b).
Although there exists an association between the two, structural or anatomic (AC) and functional (FC) connectivity, AC may be dissociated from FC (Boly et al., 2012a, 2012b; Stephan, 2008). Other authors have defined a new type of functional connectivity, labeled as effective connectivity (Harding et al., 2014; Li et al., 2015; Wicker et al., 2008).
The development of diffusion-weighted magnetic resonance imaging (DW-MRI) techniques in the last decade makes possible the noninvasive study of the anatomical circuitry of the living human brain (Bigler et al., 2010; Bozzali et al., 2013; Canales-Rodriguez et al., 2013; Dacosta-Aguayo et al., 2015; Garcia-Penton et al., 2014; Hernandez et al., 2013; Iturria-Medina et al., 2011, 2013, 2014; Jones et al., 2013; Keehn et al., 2012; Li et al., 2014; McKinney et al., 2004; Perez et al., 2014; Pontabry et al., 2013; Shen et al., 2012; Valdes-Hernandez et al., 2011; Winter et al., 2011; Zhan et al., 2013). DW-MRI techniques have being widely used to estimate the nervous fiber pathways connecting brain regions of interest (Bozzali et al., 2013; Garcia-Penton et al., 2014; Iturria-Medina, 2013). Recently, a novel DW-MRI and Graph Theory methodology were introduced with the principal purpose of summarizing patterns of anatomical connections between brain gray matter areas (Adler et al., 2010; Iturria-Medina et al., 2007, 2008; Li et al., 2014).
To assess functional and effective connectivity, the spatial resolution achieved using DW-MRI techniques allow the resting condition identification of relevant functional areas involved in resting condition and, in particular, experimental tasks (Bigler et al., 2010; Bydder et al., 2001; Hernandez et al., 2013; McKinney et al., 2004). Nonetheless, fMRI and PET studies do not offer the necessary temporal resolution to completely describe the functional and effective connectivity within and between both local and large-scale coordinated networks (Machado et al., 2015). On the other hand, the EEG/MEG (magnetoencephalography) methodology offers the necessary temporal resolution to completely achieve this goal (Birot et al., 2011; Machado et al., 2015).
Recent theories suggest that the coordinated integration of transient activity patterns in diverse brain regions is essential for information processing (Bowler et al., 2014; Kylliainen et al., 2012; Wallace and Stevenson, 2014), suggesting a possible temporal binding deficit in autism (Brock et al., 2002).
An EEG measure, most sensitive to changes in connectivity, is the bivariate function of quadratic coherence, which has been considered by some authors as a statistical measure for the correlation of spatially separated signals within a certain frequency band (Volf et al., 2010) or, in other words, a correlation analysis of EEG phase locking (Krusienski et al., 2012). A frequently referenced principle to explain EEG coherence is “What is wired together, fires together” (Sauseng and Klimesch, 2008). Therefore, it is presumed that EEG phase coherence indices, which are mainly measures of phase correlation, replicate synchronous coactivation of different brain areas (Lazar et al., 2010). The EEG coherence analysis is a noninvasive technique that can be applied to study functional relationships between spatially separated scalp electrodes and to estimate the similarities of waveform components, providing a good time resolution measure of the degree of dynamic connectivity between brain regions (Bernardino et al., 2012; Duffy and Als, 2012; Lazarev et al., 2010; Mathewson et al., 2012).
It has been hypothesized that the presence of changed patterns of brain neural development results in a local overconnectivity in the frontal cortex and a reduction in long-distance cortical–cortical coupling (Courchesne and Pierce, 2005a, 2005b; Leisman, 2011; Leisman and Melillo, 2012; Melillo & Leisman, 2009; Teder-Salejarvi et al., 2005). Some authors conjecture that the frontal overconnectivity and the long-distance underconnectivity cause the cognitive dysfunction in ASD patients (Courchesne and Pierce, 2005a; Lazar et al., 2010).
In a recently published article (Machado et al., 2015), we showed that autistic children, studied with video with audio tasks versus video without audio tasks, tended to show lower coherence values in the right hemispheres, suggesting an impairment of visual and auditory sensory integration in autistic children.
We hypothesize that the association of AC and FC might differ when comparing the resting-state condition with other experimental tasks, including the application of different stimuli, with a probable cerebral hemispheric lateralization. Therefore, the aim of the present study was to study autistic children to determine the relationship between AC versus FC, considering the anatomic connectivity assessment of the long-range and short-range regions by the DW-MRI technique, and EEG coherence values for these connections in three experimental conditions: basal control condition, watching a popular cartoon with audio, and with muted audio track.
Methods
Participants
A group of right-handed participants, 21 autistic children, 13 (65%) males and 8 (35%) females from 3 to 9 years old (70.3±29.32 months), were included in this study.
Participants were selected from the Outpatient Child Neurology Clinic of the Institute of Neurology and Neurosurgery, Havana, Cuba. Autistic children were separated, clinically examined blindly by two child neurologists, and diagnosed with an ASD, based on DSM-V criteria (Zulauf, 2014). Each participant had a classical autistic triad of impairments in social interaction, communication, and imagination (Filipek et al., 2006; Rapin et al., 2009; Belmonte et al., 2010; Silver and Rapin, 2012), with relatively intact verbal functions and with IQs over 85 (Charman et al., 2011). None of the participants presented with epileptic symptoms or other neurologic abnormalities other than those directly related to autism. Each participant was free of drug treatment. Written informed consent was obtained from each of the parents or guardians with a form approved by the Helsinki Committee of the Institute of Neurology and Neurosurgery under the supervision of the Ministry of Public Health of Cuba.
Experimental design
Participants were studied in a laboratory with controlled temperature from 24°C to 26°C, with noise attenuation and dimmed lights. One parent and a trained technician were present during the recording sessions, as well as the clinician in charge. All participants were, before the experimental session, familiarized with the room and experimental set to achieve better cooperation. During the experimental sessions, participants were seated in a comfortable chair.
The standard test consisted of three parts. At first, participants looked to the center of a shut TV monitor with a colored green dot in the center of the screen. Participants were instructed to fixate the dot trying not to change their gaze or move their heads or any other part of the body. This part of the experimental session was named basal and had a duration of at least 10 min, during which time EEG samples of no less than 65 sec were obtained. Later, a popular cartoon for children in Cuba was presented for approximately 5 min, and the participants were asked to pay attention to it and avoid unnecessary movements, particularly of the head. The original cartoon's audio was turned to a moderate intensity level. This experimental section was referred as video and audio (V-A).
During the third and last section, which also lasted approximately 5 min, the cartoon audio band was muted and the subjects were asked to continue paying attention to the movie. The audio was always muted at a specific selected moment of the cartoon story, assuring that the presented audio-on audio-off segments were the same for all subjects. This section was referred as video without audio (VwA). The audio track included conversation in Spanish among cartoon characters, which was important for understanding the story. All sessions were video monitored to evaluate facial expressions and other signs of emotional reactions.
EEG recordings
EEG data were gathered by a registered EEG technologist, specifically trained and skilled in working with children within the age group of the study. The EEG was recorded from 19 standard locations over the scalp according to the 10–20 system: Fp1, Fp2, F3, F4, F7, F8, T3, T4, C3, C4, P3, P4, T5, T6, O1, O2, Fz, Cz, and Pz. Gold-cup scalp electrodes applied with collodion were fixed after a careful cleaning of the skin, using a conductor paste, and connected to the input box of the digital electroencephalographic system Medicid-05 (Neuronic, S.A.). Monopolar leads were employed, using linked ears as a reference. EEG technical parameters were as follows: gain 20,000, pass-band filters 0.1–70 Hz, notch filter at 60 Hz, noise level of 2 μV (root mean square), sampling frequency 200 Hz, and electrode-skin impedance never higher than 5 KΩ. Electrodes were placed over the superior and inferior rim to record eye movement artifacts for ease of detection in the EEG records.
EEG visual inspection and selection of samples for quantitative EEG
Two experts visually inspected the records to select artifact-free EEG segments. EEG segments of no less than 65 sec from the noncontaminated records were selected for each experimental section, which were later exported to an ASCII file, using the MEDICID-05 system's own facilities, containing a matrix of the original EEG values, corresponding to the segments selected by the specialists for offline processing. Three ASCII files containing the EEG data corresponding to each participant in the different experimental conditions were created and stored for further quantitative analysis.
EEG analysis
EEG samples from every experimental section contained in the ASCII files previously described were imported by a specifically tailored software tool developed with MATLAB version 7.10.0.499 R2010a (The Mathworks, Inc.). This program incorporated different actions, including preprocessing of EEG samples, estimation of the power spectral densities (PSD) for every EEG lead, computation of different spectral indices, and finally an output of these results to a database developed with Microsoft Access to dedicated files.
EEG preprocessing
The EEG values of each of the 19 leads were submitted to a previous preprocessing set of actions consisting of the following: (a) subtraction of the mean value of the sequence of EEG values to diminish the effect of the DC component of the time series; (b) application of a nonlinear median filter to exclude outliers or abnormally high amplitude values (Gonzalez-Hernandez et al., 2002; Gonzalez and Richard, 2002); (c) standard linear detrending to avoid any possible drifts in the series; (d) high-pass digital filtering (low cutoff frequency of 0.5 Hz); and (e) low-pass digital filtering (high cutoff frequency of 55 Hz) using a sixth order Butterworth filter. For both filtering processes, an algorithm developed by The MathWorks, Inc. was applied which after filtering the data in the forward direction, reversed the filtered sequence and ran it back through the filter producing a zero-phase distortion effect (Aoude et al., 2006).
Calculations of EEG coherence
The function of quadratic coherence was calculated as the cross-spectrum, normalized by the power spectra of the two leads to be considered using the following expression:
where C is the cross-spectrum of the EEG time series; L1 is one of the two EEG leads; L2 is the other lead; PL1L1 and PL2L2 are the power spectra of both EEG time series. The MATLAB function mscohere was included in the MATLAB program developed for this study. EEG segments were defined, including 1024 samples with an overlap (50%) of 512 samples. Twelve segments were included (12288 samples, 61.44 sec). To each one, a Hann window was applied for calculations of the power spectral estimations of individual EEG leads, using the Welch periodogram. Spectral resolution of the process was 1/5.12 s=0.1953125 Hz. The first discrete frequency (Df) considered for calculations of coherence values in the studied EEG bands was the sixth after the DC or zero frequency corresponding to 1.171875 Hz. From this discrete frequency were included 12 Df for the delta EEG band (1.17–3.5 Hz), 22 for theta (3.5–7.5 Hz), 19 for alpha (7.5–11 Hz), 21 for sigma (11–15 Hz), 53 for beta (15–25 Hz), and 154 for gamma (25–55 Hz) (Lazar et al., 2010; Leveille et al., 2010).
Coherence values for the discrete frequencies corresponding to every EEG band were averaged for further statistical analysis previous to a Fisher's Zeta transformation using the following expression:
Original and transformed coherence values were included in a Microsoft Access database for storage and use in other graphical and quantitative process analyses.
Grouping of EEG leads for coherence analysis
We used in this study short- and long-range intrahemispheric values of coherence for both the right and the left hemisphere, using the same methodology in an earlier study (Machado et al., 2015).
MRI acquisition and preprocessing
All images were acquired using an MRI scanner Siemens Symphony 1.5 T. Using a standard diffusion gradient direction scheme (12 diffusion-weighted images and a b=0 image), DW-MRI data were acquired using a single shot EPI sequence. Two interleaved sets of 25 slices of 6 mm thickness with a distance factor of 100% were acquired to form a volume of 50 contiguous slices of 3 mm thickness covering the whole brain for each subject. Acquisition parameters were as follows: b=1200 s/mm2; FOV=256×256 mm2; acquisition matrix=128×128; corresponding to an in plane spatial resolution of 2×2 mm2; and TE/TR=160 ms/7000 ms. The above mentioned acquisition was repeated five times to improve the signal to noise ratio. To improve EPI quality, magnitude and phase difference images of a T2 gradient echo field mapping sequence were acquired with TE=7.71 ms and 12.47 ms. Also, a 3D high-resolution T1-weighted MPRAGE pulse sequence covering the whole brain was acquired with the following parameters: 160 contiguous sagittal slices of 1-mm thickness; in plane FOV=256×256 mm2; and matrix size 256×256 yielding a spatial resolution of 1×1×1 mm3. The echo time, repetition time, and inversion time were set to TE/TR/TI=3.93 ms/3000 ms/1100 ms with a flip angle FA=15°. MPRAGE volumes were spatially normalized to the T1-MNI template using the unified segmentation approach, available in SPM8 (
Graph theory-based anatomic connectivity
The graph framework used here has been widely described by Iturria-Medina and colleagues (2007, 2008) (Li et al., 2014). In brief, the cerebral volume is represented as a nondirected weighted graph G, in which nodes N correspond to atlas-defined regions and arcs aij to the connections joining them. Atlas was registered with the gray matter volume maps in native space and segmented into 90 regions, using the anatomically labeled template corresponding to the AAL atlas developed by the Montreal Neurological Institute (
An iterative streamlined fiber tractography algorithm was employed for finding the most probable trajectory connecting voxels of the surfaces of the corresponding anatomical areas (Machado et al., 2015). Streamlines exceeding 20 mm and below 500 mm in length and a curvature threshold of±90o were used to generate the connectivity matrix for each subject. The anatomic connectivity between a pair of nodes was quantified through the Anatomical Connection Density (ACD), defined as follows:
where w(aij) quantifies the conditional weight of the arc aij . Thus, ACD is related to the amount of nervous fibers shared by regions Ai and Aj involved in the connection with respect to the number of nodes Ni and Nj belonging to the surfaces, normalized by the fractional anisotropy (FA). Fisher's Z transformation was applied on the elements of the ACD matrix to improve the normality of the connectional coefficients.
Statistical analyses
An overview of the comparative methodology is summarized in Figure 1. To obtain spatial correspondence between functional and anatomical data, a map of EEG's leads is registered to the rendered patient's scalp in axial, coronal, and sagittal views, using affine transformations (center panel). Each EEG channel is labeled according to the closer atlas-defined region. Equivalent connections in anatomical and functional matrices were extracted for regression analysis. The linear correlation between the Z-transformed Coh and ACD scores was tested using pairwise Pearson correlation coefficients for each EEG frequency subband. Analyses were independently carried out for short- and long-range connectivities. This procedure was followed for each experimental condition (i.e., basal, VA, and VwA).
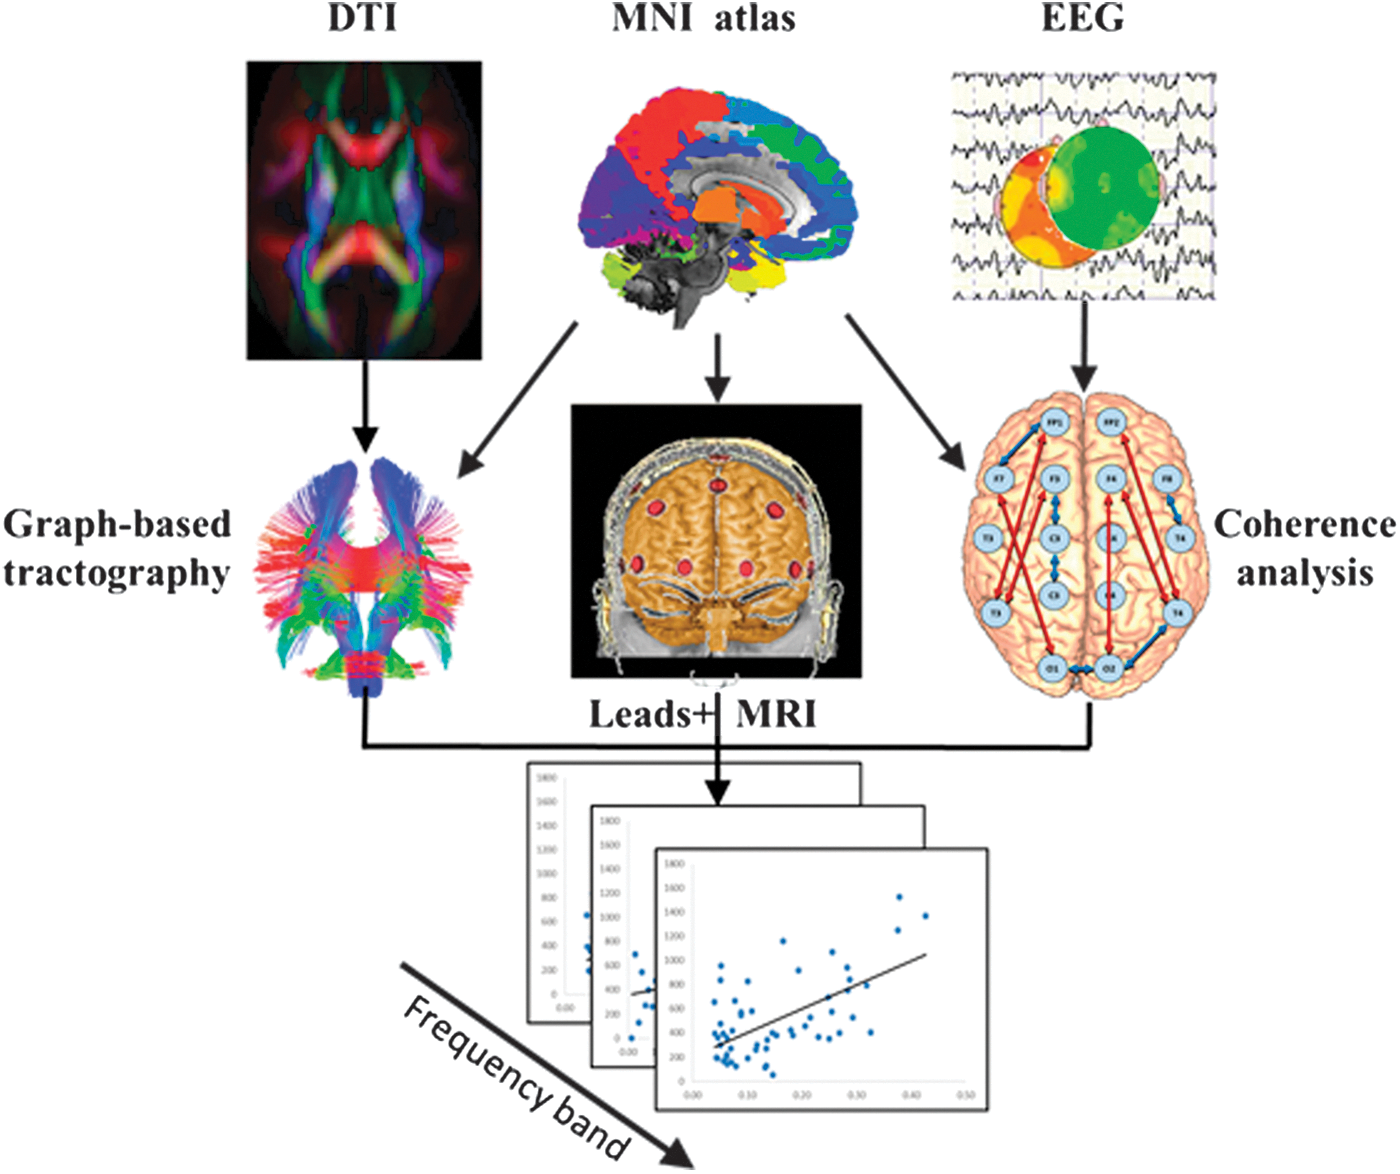
Schematic representation to illustrate the methodology for assessing anatomic versus functional connectivity correlations. MNI atlas registered to the individual brain defines the common nodes for both anatomic and functional networks. Connectivity values are based on the Graph Theory approach and EEG coherence analysis. Linear correlations were tested for each EEG frequency band. MNI, Montreal Neurological Institute. Color images available online at
Results
No significant correlation was found in age and gender for any functional or anatomic connectivity variables.
Left and right hemisphere short-range correlation: anatomic versus functional connectivity
In Figure 2, the results of the short-range anatomic versus functional connectivity correlations for the three experimental conditions (basal, V-A, and VwA) are shown. When comparing basal records, left versus right hemispheres, there are statistically significant correlations for all EEG bands in the left hemisphere; meanwhile, in the right hemispheres, no significant correlations for fast EEG frequency bands (β1, β2, and G) were found.
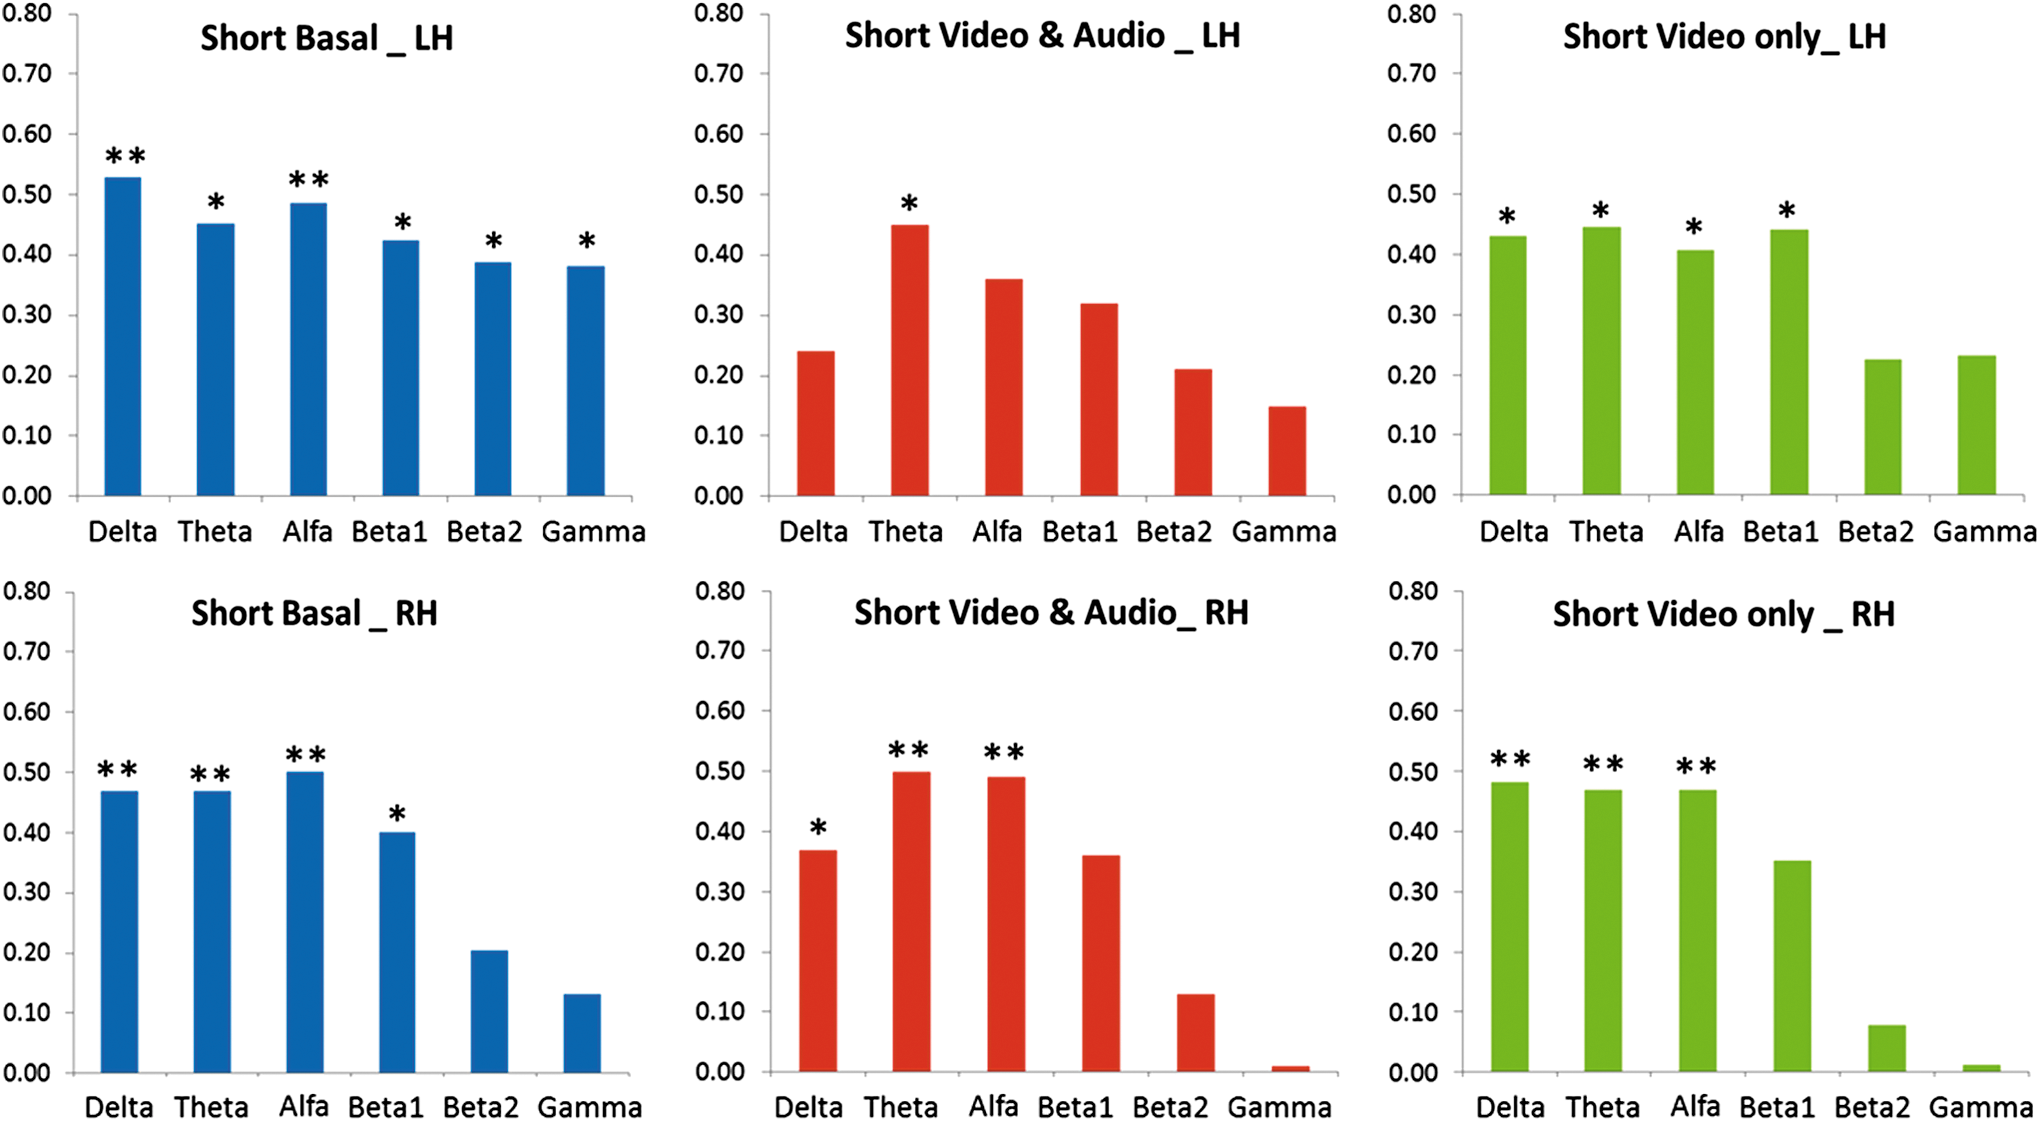
The results of the short-range, anatomic versus functional connectivity correlations for the three experimental conditions are shown. Basal (left), V-A (center), and VwA (right) panels; left hemisphere (upper) and right hemisphere (lower) panels. LH, left hemisphere; RH, right hemisphere; *p<0.05, **p<0.01. Color images available online at
For the experimental condition V-A, significant correlations diminished mainly for the left hemisphere, disappearing for all bands, except the theta frequency; meanwhile, for the right hemisphere, again no significant correlations for the fast EEG frequency bands (β1, β2, and G) were found.
For the experimental condition VwA, significant correlations for the rapid EEG frequencies disappeared, mainly for the right hemisphere.
Left and right hemisphere long-range correlation: anatomic versus functional connectivity
In Figure 3, the results of the long-range anatomic versus functional connectivity correlations for the three experimental conditions (basal, V-A, and VwA) are shown. When comparing basal records, similar correlations were found for left and right hemispheres. It called to attention that in the right hemisphere, significant correlations incremented to all EEG bands for the V-A experimental condition, but these significant correlations disappeared for the fast frequencies (β1, β2, and G) in the right hemisphere, showing even a negative correlation for the gamma band.
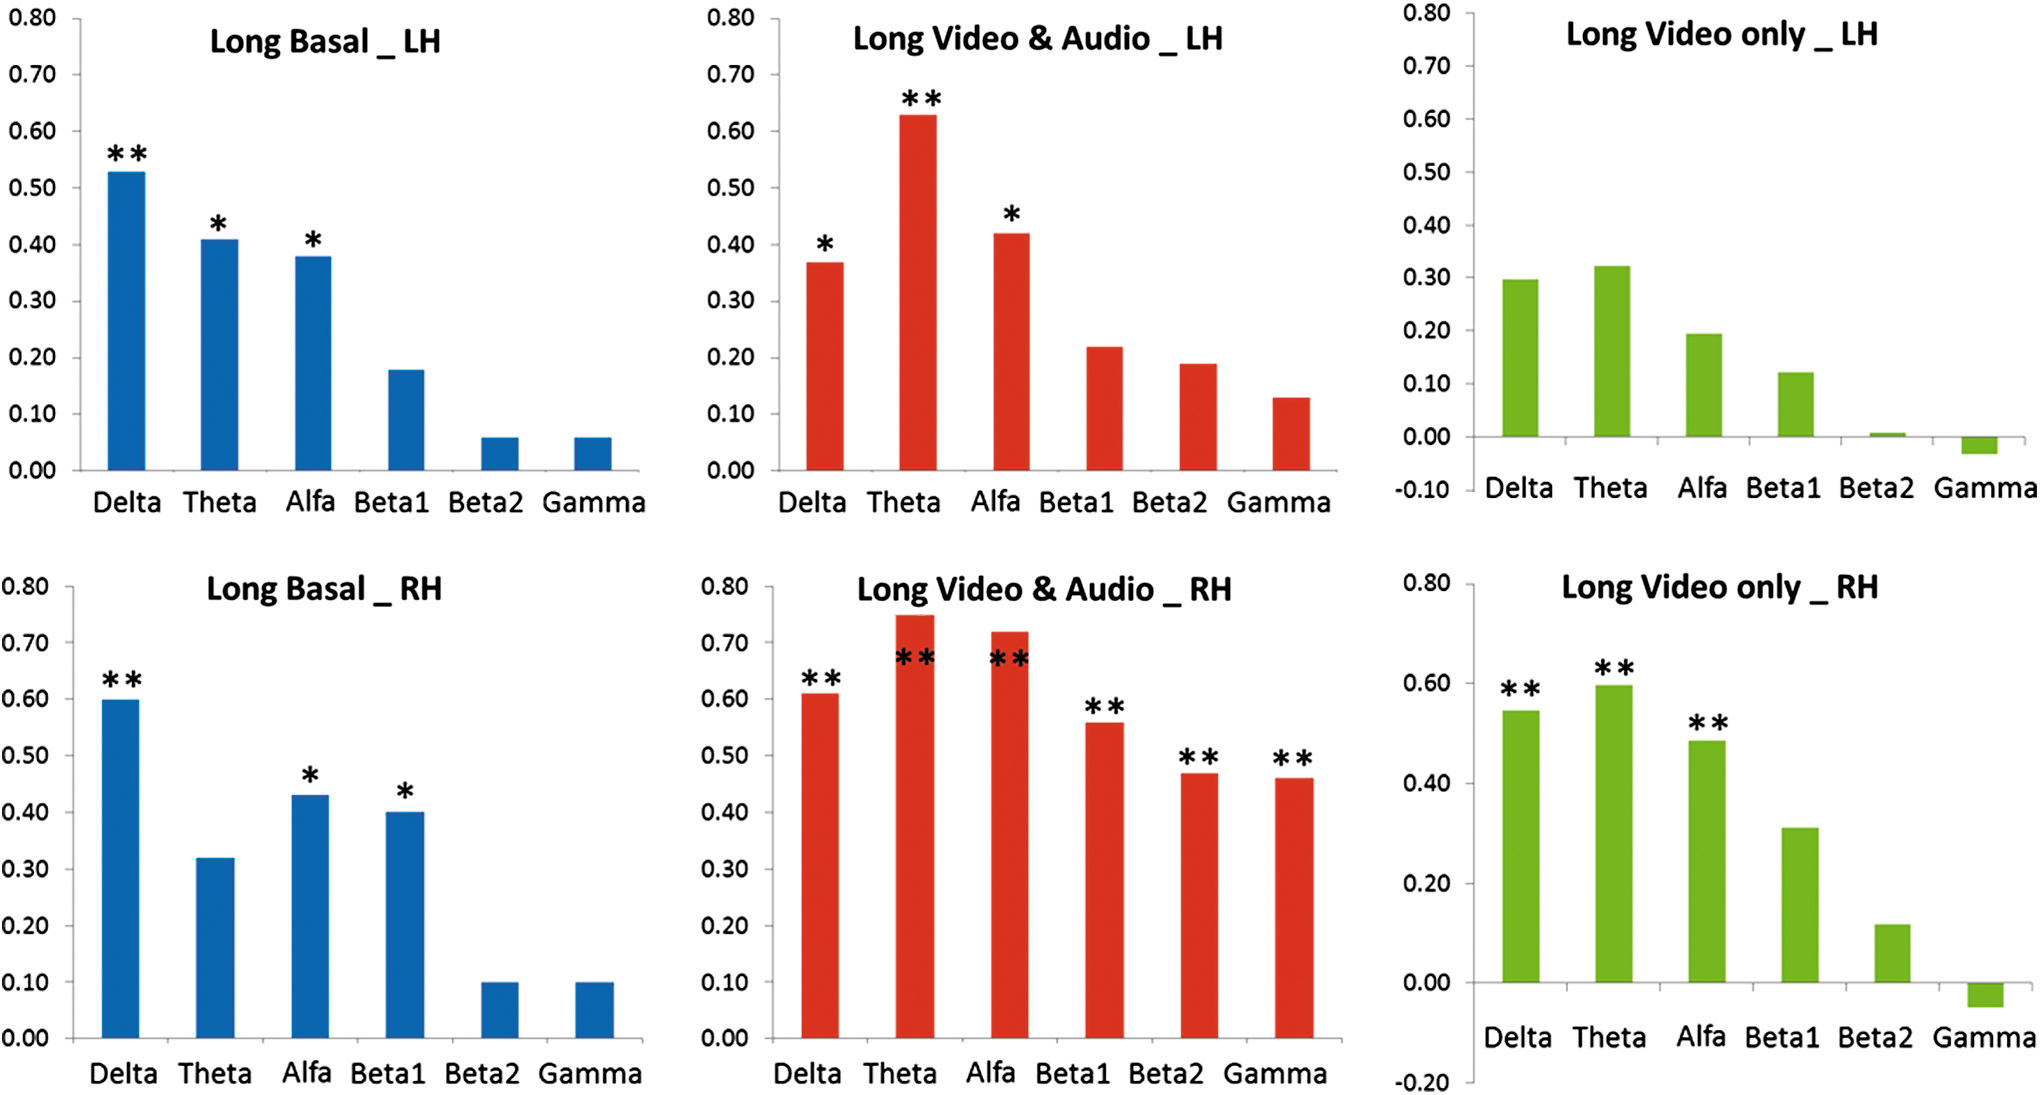
The results of the long-range anatomic versus functional connectivity correlations for the three experimental conditions are shown. Basal (left), V-A (center), and VwA (right) panels; left hemisphere (upper) and right hemisphere (lower) panels. LH, left hemisphere; RH, right hemisphere; *p<0.05, **p<0.01. Color images available online at
Discussion
Postmortem studies in mammalian species have shown that cortical anatomical connection matrices show small-world attributes (Hilgetag and Barbas, 2006, 2009; Hilgetag and Kaiser, 2004; Kaiser and Hilgetag, 2004; Sporns and Zwi, 2004). This means that anatomical brain connection patterns are characterized by a high clustering index and a short average distance between any two regions. Small-world topology is generally associated with global and local parallel information processing, sparse connectivity between nodes, and low wiring costs (Bassett et al., 2006; Bassett and Bullmore, 2006).
The brain is composed of anatomically distinct elements interconnected by a dense network of structural relationships (Dacosta-Aguayo et al., 2015; Iturria-Medina et al., 2008). The relationship between AC of large-scale brain networks and their FC is an area of active research for underlining neural dynamics processes (Abdelnour et al., 2014; Honey et al., 2010). Theoretical arguments further support the notion that brain network topology and spatial embedding should significantly influence network dynamics (Bowman et al., 2012). There is also emerging evidence of correspondence between the functional and structural pathways within many networks, suggesting that functional connectivities may be mediated by (direct or indirect) anatomical connections, offering an opportunity to supplement AC with FC data (Greicius, 2003; Skudlarski et al., 2008).
Whole brain connectivity networks or connectomes come in two forms: structural networks calculated from tractography methods by DW-MRI methodology (Gong and He, 2015; Hagmann et al., 2010; Iturria-Medina et al., 2007) and resting-state functional networks, inferred from the strength of long-range second-order temporal correlation structure of activation signals in various brain regions (Tsiaras et al., 2011). A major and actual goal of connectome research is to determine whether, and how, the structural and functional networks of the brain are related (Abdelnour et al., 2014; Tsiaras et al., 2011).
In recent years, there has been an interest in assessing both FC and AC in autism (Tsiaras et al., 2011; Wass, 2011). Considering that widespread activation of brain areas occurs during conscious processing, it is plausible to hypothesize that the synchronization patterns among brain regions in individuals with autism in the resting condition or during performance of different tasks diverge from those in control healthy subjects (Keehn et al., 2012; Mathewson et al., 2012; Ohta et al., 2012; Tsiaras et al., 2011; Wass, 2011). Therefore, it is crucial to study the relationship between AC and FC for assessing neural network dysfunction in autism.
Many studies assess either AC or FC, but we have not found publications regarding the correlation between both types of connectivity in autistic children. Barttfeld and colleagues (2013) have reported consistent differences in the connectivity patterns by EEG coherence in autistic children showing a lack of long-range, fronto-frontal, and fronto-occipital connections and an enhancement of local, short-range lateral frontal connections. We also recently reported an EEG coherence study for short-range and long-range coherence calculations. Children with autism tended to show lower coherence values for V-A and VwA experimental conditions compared to the basal record. Nonetheless, the most interesting finding occurred when comparing the two experimental conditions, V-A versus VwA, because our cases had a tendency to demonstrate lower coherence values in the right hemisphere during VwA (Machado et al., 2015).
Regarding our results, it appears that in a resting-state condition, the structural or anatomical connectivity is better associated with functional connectivity for short-range connections in the left, compared to the right hemisphere. Another key point is that the V-A experimental condition might enrich the AC and FC association for long-range connections in the right hemisphere, which is again disrupted in the VwA experimental condition, when audio is muted, with only the video-visual stimulus presented.
Several authors have affirmed that the increased resilience in ASD may reflect an excessively degenerate network with local overconnection and decreased functional specialization, and therefore, an overconnectivity can result in a poor signal-to-noise ratio where the system is swamped with noise that obfuscates the signal. Hence, with a poor signal to-noise ratio, the output of a network may not be sufficiently distinct to achieve the necessary information processing, creating an abnormally undifferentiated response to any stimulus (Peters et al., 2013; Tye and Bolton, 2013).
Some authors have affirmed that in autistic children, there exists an imbalance in the excitation–inhibition regulation in the cortex and its connections with other brain structure processes, related to the generation of fast EEG frequency oscillations (Orekhova et al., 2009).
Therefore, the finding that the V-A experimental condition enriches AC and FC association for long-range connections in the right hemisphere, might be related to models of cognitive function, which emphasized that effective connectivity is improved when the dynamic and interactive nature of neural responses is enriched when certain stimuli are reapplied in an experimental setting (Jirsa et al., 2010). Effective connectivity refers to the influence that one neural system exerts over another with respect to a given experimental context, thus helping uncover more information about how brain areas communicate (Boly et al., 2012b; Deshpande et al., 2013; Friston et al., 2000; Friston and Buchel, 2000; Kana et al., 2011; Salmond et al., 2003).
Several authors affirm that integration of sensory information may underlie several clinical and behavioral features in autistic children (Machado et al., 2015), including sensory hyper- and hyposensitivities (Cascio et al., 2012; Foss-Feig et al., 2010; Kwakye et al., 2011). Other authors have affirmed that autistic children show a tendency of responding only to one aspect of multisensory stimulus (Lovaas et al., 1979). In this sense, several reports have affirmed that low-level auditory/visual integration is common in autistic children (van der Smagt et al., 2007), and most authors indicate that autistic children show preferential responsivity to somatosensory and visual over auditory stimuli (Allen et al., 2009; Heaton et al., 2008; Jarvinen-Pasley et al., 2008a, 2008b; Jarvinen-Pasley and Heaton, 2007). This might explain why the AC and FC significant correlations disappeared for the fast frequencies in the VwA experimental condition when the audio track was muted (Machado et al., 2015).
To discuss if other authors have found similar results, many studies assess either AC or FC, but we have not found publications regarding the correlation between both types of connectivity in autistic children.
Peters and colleagues, applied Graph Theory to study EEG connectivity in patients with Tuberous Sclerosis Complex (TSC}, a disorder with a high prevalence of AD0, as well as in patients with nonsyndromic ASD. It is interesting that in TSC, both with and without a concurrent diagnosis of ASD, the mean coherence, global efficiency, and clustering coefficient were decreased and the average path length was increased. Nonetheless, these authors did not study the association of AC versus FC.
We conclude that it appears that in a resting-state condition, the AC is better associated with FC for short-range connections in the left compared to the right hemisphere. The finding that the V-A experimental condition enriches AC and FC association for long-range connections in the right hemisphere might be related to the fact that effective connectivity is improved when the dynamic and interactive nature of neural responses is enriched by the combined stimuli from the video (visual and auditory). The impaired audiovisual interactions lateralized to the right hemisphere might explain why these significant correlations disappeared for the fast frequencies in the VwA experimental condition.
Footnotes
Acknowledgments
This work was supported in part by the State of Israel Kamea-Dor-Bet Program and by the Children's Autism Help Project to G.L.
Author Disclosure Statement
No competing financial interests exist.