
Abstract
Functional magnetic resonance imaging (fMRI) studies utilizing measures of hemodynamic signal, such as the blood oxygenation level-dependent (BOLD) signal, have discovered that resting-state brain activities are organized into multiple large-scale functional networks, coined as resting-state networks (RSNs). However, an important limitation of the available fMRI studies is that hemodynamic signals only provide an indirect measure of the neuronal activity. In contrast, electroencephalography (EEG) directly measures electrophysiological activity of the brain. However, little is known about the brain-wide organization of such spontaneous neuronal population signals at the resting state. It is not entirely clear if or how the network structure built upon slowly fluctuating hemodynamic signals is represented in terms of fast, dynamic, and spontaneous neuronal activity. In this study, we investigated the electrophysiological representation of RSNs from simultaneously acquired EEG and fMRI data in the resting human brain. We developed a data-driven analysis approach that reconstructed multiple large-scale electrophysiological networks from high-resolution EEG data alone. The networks derived from EEG were then compared with RSNs independently derived from simultaneously acquired fMRI in their spatial structures as well as temporal dynamics. Results reveal spatially and temporally specific electrophysiological correlates for the fMRI-RSNs. Findings suggest that the spontaneous activity of various large-scale cortical networks is reflected in macroscopic EEG potentials.
Introduction
In awake, resting human brains, the blood oxygenation level-dependent (BOLD) signal measured by functional magnetic resonance imaging (fMRI) reveals spontaneous, large-amplitude, and low-frequency fluctuations that are temporally correlated and spatially organized into specific large-scale functional networks, collectively termed the “resting-state networks” (RSNs) (Biswal et al., 1995; Fox and Raichle, 2007). The spatial patterns that have been observed in resting-state fMRI are remarkably consistent across healthy subjects (Beckmann et al., 2005; Damoiseaux et al., 2006) and show a strong resemblance with those activated by various tasks (Smith et al., 2009). However, these patterns can be modulated at different levels of development or consciousness (Boly et al., 2009; Doria et al., 2010 ; Fransson et al., 2007; Horovitz et al., 2009; Liang et al., 2012) or altered in a variety of psychiatric and neurological disorders (Zhang and Raichle, 2010).
However, the BOLD signal is an indirect measure of neuronal activity, thus the neurophysiological basis of the fMRI-based RSNs is not fully understood. The spatial patterns of RSNs have been reproduced in those based on intracranial electrical recordings in animals (Leopold et al., 2003) and on electrocorticography (ECoG; He et al., 2008; Nir et al., 2008) and magnetoencephalography (MEG) (Brookes et al., 2011; de Pasquale et al., 2010, 2012; Hipp et al., 2012) in humans. However, as these neural recordings were acquired in separate sessions, rather than simultaneously with fMRI, they clearly do not reflect the same brain state. It is thus difficult to infer how the spontaneous and fast neuronal dynamics (millisecond time scale) is linked to the slow fluctuations of fMRI-RSNs (at order of seconds), especially since the BOLD signal also contains non-neuronal contributions from cardiac and respiratory fluctuations (Birn et al., 2006; Shmueli et al., 2007; Wise et al., 2004) and involuntary head motion (Power et al., 2012; Van Dijk et al., 2012). Electroencephalography (EEG) simultaneously acquired with fMRI has been utilized to investigate the temporal signature of electrophysiological correlates for fMRI-RSNs. Temporal correlates of EEG dynamics, in the form of band-limited power (Goldman et al., 2002; Laufs et al., 2003; Mantini et al., 2007; Sadaghiani et al., 2010), full-band power (Hiltunen et al., 2014), or transient potential topographies at high-power states (Britz et al., 2010; Musso et al., 2010; Yuan et al., 2012), have been found in brain regions that partially overlap with certain RSNs. Nonetheless, due to the fact that EEG measured at the scalp is of ambiguous cortical origin, the spatial origin and organization of the EEG activity that correlates with the spontaneous BOLD fluctuations have not been clear. So far, the electrophysiological representations of fMRI-RSNs that are specifically related in both the time and space domain have not yet been revealed. This result would confirm a neural basis for the organization of RSNs and moreover establish the utility of electrophysiological recordings as a tool for understanding the mechanisms that underlie network formation by taking advantage of high temporal resolution.
Therefore, to uncover the neurophysiological origins of RSNs measured by BOLD-fMRI, we aim to derive counterpart electrophysiological RSNs from high-density EEG data only (which we term as EEG-RSNs), recorded simultaneously with fMRI. We hypothesized that RSNs, derived from EEG data, match closely an equivalent set derived from fMRI data in both the space and temporal domain. We combined EEG inverse source imaging and temporal independent component (tIC) analysis (ICA) to obtain cortical distributions of EEG-RSNs and their temporal characteristics from EEG topographies. We compared the EEG-RSNs to RSNs separately derived from simultaneously acquired fMRI data. It is demonstrated that EEG-RSNs and fMRI-RSNs have significant similarity in spatial structures and correlations in temporal dynamics.
Materials and Methods
Study protocol
Nine healthy subjects (age 33 ± 10 years; one female) participated in the study. All participants provided written informed consent as approved by the local institutional review board. Simultaneous EEG and fMRI data were recorded when subjects rested in a supine position inside the scanner with their eyes closed (three runs per subject, 6 min and 10 sec per run).
EEG acquisition
High-density EEG signals were recorded using a 128-channel MRI compatible BrainAmp MR Plus system (Brain Products GmbH, Munich, Germany). The sintered Ag/AgCl ring electrodes were mounted into a scalp cap according to the standard 10-5 system. All electrodes were referenced to the FCz position, while a ground electrode was positioned at the AFz position. One additional electrode was placed on the subject's back to monitor the electrocardiographic signal. The impedance of all electrodes was maintained below 10 KΩ throughout the recording. The internal sampling clock of the EEG amplifier was synchronized with the MRI scanner 10 MHz master clock signal using the SyncBox device (Brain Products GmbH). Data were acquired at a sampling frequency of 5000 Hz with an analog filter (from 0.016 to 250 Hz) and a resolution of 0.1 μV.
fMRI acquisition
Imaging was performed on a General Electric (GE) Discovery MR750 whole-body 3 Tesla MRI scanner (GE Healthcare, Waukesha, WI) with a standard eight-channel receive-only head coil array. Whole-brain BOLD-fMRI was acquired using a single-shot gradient-recalled echo planner imaging sequence with the following parameters: 34 axial 2.9 mm thick interleaved slices with 0.2 mm gaps; TR/TE = 2000 msec/30 msec; matrix size = 64 × 64; FOV = 220 × 220 mm; sampling bandwidth = 250 kHz, 185 volumes, flip angle = 30°, acceleration by a factor of two using sensitivity encoding (SENSE). A low flip angle (30°) was particularly chosen to reduce the contribution of physiological noise while preserving sensitivity to BOLD-related signal changes (Gonzalez-Castillo et al., 2011). Another advantage of reducing the flip angle for studies involving concurrent fMRI and EEG recordings is that this technique reduces the levels of radio-frequency energy deposition, which decreases the likelihood of localized heating at the EEG electrodes. Pulse oximetry and respiration were recorded by a photoplethysmograph and a pneumatic respiration belt, respectively, at a sampling frequency of 25 Hz in synchronization with fMRI data acquisition. Anatomical images were acquired through a T1-weighted magnetization-prepared rapid gradient echo (3D MPRAGE) sequence (124 contiguous axial slices with 1.2 mm slice thickness; matrix size = 256 × 256; FOV = 220 × 198 mm; TR/TE/TI/TD = 5/1.98/725/1400 msec, flip angle = 8°; sampling bandwidth = 31.25 kHz, SENSE acceleration = 2).
EEG analysis
The EEG data acquired simultaneously with the fMRI data were corrected for artifacts related to the gradient switching and cardiac ballistic effect using the template subtraction method (Allen et al., 1998, 2000) implemented in BrainVision Analyzer software (Brain Products GmbH). Residual ballistocardiac artifacts in the EEG signals were removed using the ICA method. After artifact correction, EEG recordings were band-pass filtered from 1 to 70 Hz, removed of 60 Hz line noise, resampled at 250 Hz, and rereferenced to the common average reference. The EEG traces were then intermittently downsampled to time points at the local peaks of the global field power (GFP), which is defined as the total power summed across all channels over the whole frequency band, for the purpose of retaining data of high signal-to-noise ratio while reducing the computational load. The rationale of this temporal downsampling at relative high-energy states was first introduced as the concept of microstates by Lehmann and colleagues (1987). It was observed that the topographic representations of EEG scalp electrical fields do not change randomly or continuously over time, but instead remain stable around peaks of GFP (Lehmann and Skrandies, 1980). Such quasistable momentary topographies, termed the microstates, reflect the summation of concomitant neuronal activity across brain regions rather than the activity specific to a certain frequency band and are thought to capture a more concise and informative representation of the underlying neural process by eliminating noisy time points (Koenig et al., 2002; Lehmann et al., 1987).
The downsampled EEGs were subject to source estimation using a minimum norm method (Dale and Sereno, 1993; Hämäläinen and Ilmoniemi, 1984) (see the Supplementary Materials and Methods for more details on source analysis; Supplementary Data are available online at
fMRI analysis
The fMRI data preprocessing was performed using the Analysis of Functional NeuroImages software (AFNI,
After preprocessing, individuals' fMRI data were concatenated in the time domain and were subject to spatial ICA using the multivariate exploratory linear optimized decomposition into independent components (MELODIC) tool in the FSL software (Beckmann et al., 2005). Twenty-five spatial independent components were derived, representing the fMRI resting-state works. Eight representative RSNs were identified by comparing to those reported in Beckmann et al. (2005) and Smith et al. (2009).
Association of EEG and fMRI networks
Spatial maps from fMRI networks and EEG sources were associated with each other by spatial similarity through the use of Pearson correlation of the group-averaged, unthresholded, and smoothed spatial maps (FWHM = 6 mm). For each of the eight fMRI-RSNs, their spatial correlations with source maps of the 25 EEG tICs were calculated and the EEG tIC with the highest correlation was matched to the fMRI-RSN. An unambiguous match indicates that an EEG network was found to be of highest spatial correlation for a unique fMRI network among the eight investigated networks, whereas an ambiguous match indicates that a single EEG network may be associated with the highest spatial correlation for more than one fMRI network. The statistical significance of the spatial Pearson correlation coefficients (CCs) between matched unthresholded group maps of EEG and fMRI networks was assessed using a parametric method. The spatial correlation was converted to a p-value through a two-sided t-test after applying Fisher's r-to-z transform. A correction for the spatial degrees of freedom was given through the Gaussian random field theory and empirical smoothness estimation, as the number of independent resolution elements (i.e., resels; Hagler et al., 2006; Worsley et al., 1996). The p-value was further corrected for multiple comparisons across all possible pairings (multiplying the p-value by the number of EEG ICs and the number of fMRI-RSNs). Dice coefficient and percentage of overlapping were additionally calculated for thresholded (|z| > 3), group-level network maps of the matched pairs.
After matching, the full time course of each EEG tIC was convolved with a hemodynamic response function (HRF), downsampled to repetition time (TR), and its temporal Pearson correlation with the time series of spatially matched fMRI-RSN was calculated. To further assess the spatial specificity of EEG-fMRI relationship, the time course of each EEG-derived RSN (after HRF convolution and TR-scale downsampling) was used as a regressor in the general linear model (GLM) to assess its correlation with the preprocessed BOLD signals at the voxel-by-voxel level across the whole brain. Individual's correlations were transformed to z-scores and then subject to the group t-test. While the temporal correlation calculated between the time courses of matched networks indicates which EEG-RSN is related to a particular fMRI-RSN, the statistical images indicate the extent to which this correlation exists across the whole brain. Toward this end, the statistical images associated with each EEG-RSN (with significant temporal correlation to fMRI-RSNs) were compared to fMRI-RSN extracted by ICA by calculating the spatial Pearson correlation.
Monte Carlo simulations
To test the possibility that the discovered networks were driven by environmental noise, we recorded environmental noise data and repeated the analysis in Monte Carlo simulations. Noise EEG data were acquired at 1000 Hz with the electrode cap fit on a phantom head inside the scanner (without MR scanning) for the same length as human data recording. Gaussian noise with power 1/10 of the noise recording was added. The resulted signals were filtered between 1 and 70 Hz, removed of 60 Hz line noise, downsampled to 250 Hz, and rereferenced to the common average, yielding the noise data for Monte Carlo simulations. The sources for the noise data were identically analyzed as human EEG data using realistic head models, and the noise sources were subject to temporal ICA for deriving noise networks. The spatial correlation and temporal correlation were computed between noise networks and fMRI-RSNs derived from human subject data. To repeat the noise analysis in a Monte Carlo method, we generated phantom data using the permutation approach and the subsequent analyses were followed. The noise data were randomly permutated in the phase domain while maintaining the naturally colored spectrum of environmental noise (otherwise the data permutated in time domain will result in artificially white spectrum). Such procedure was repeated 500 times, entering repeated spatial and temporal correlations in the simulation pool. The statistical significance was assessed based on the permutated noise data for each fMRI-RSN.
Results
To investigate the electrophysiological basis of fMRI-RSNs, we intended to independently discover and derive large-scale networks from the EEG data alone (as schematically illustrated in Fig. 1). We have combined source imaging and tIC analyses on EEG topographies to determine their cortical origins and temporal characteristics. To maximize the signal-to-noise ratio for source imaging, EEG signals were temporally downsampled at high-power states, that is, the local maxima of the whole-band GFP, which occurs at discrete time points in uneven time intervals (mean ± SD = 38 ± 16 msec, ∼1/10 downsampling ratio). Then, the spatial maps representing temporally independent signals were extracted from sources of EEG through temporal ICA and they were deemed EEG-RSNs. Independently, fMRI-RSNs were obtained from BOLD-fMRI data alone through a separate spatial ICA analysis.
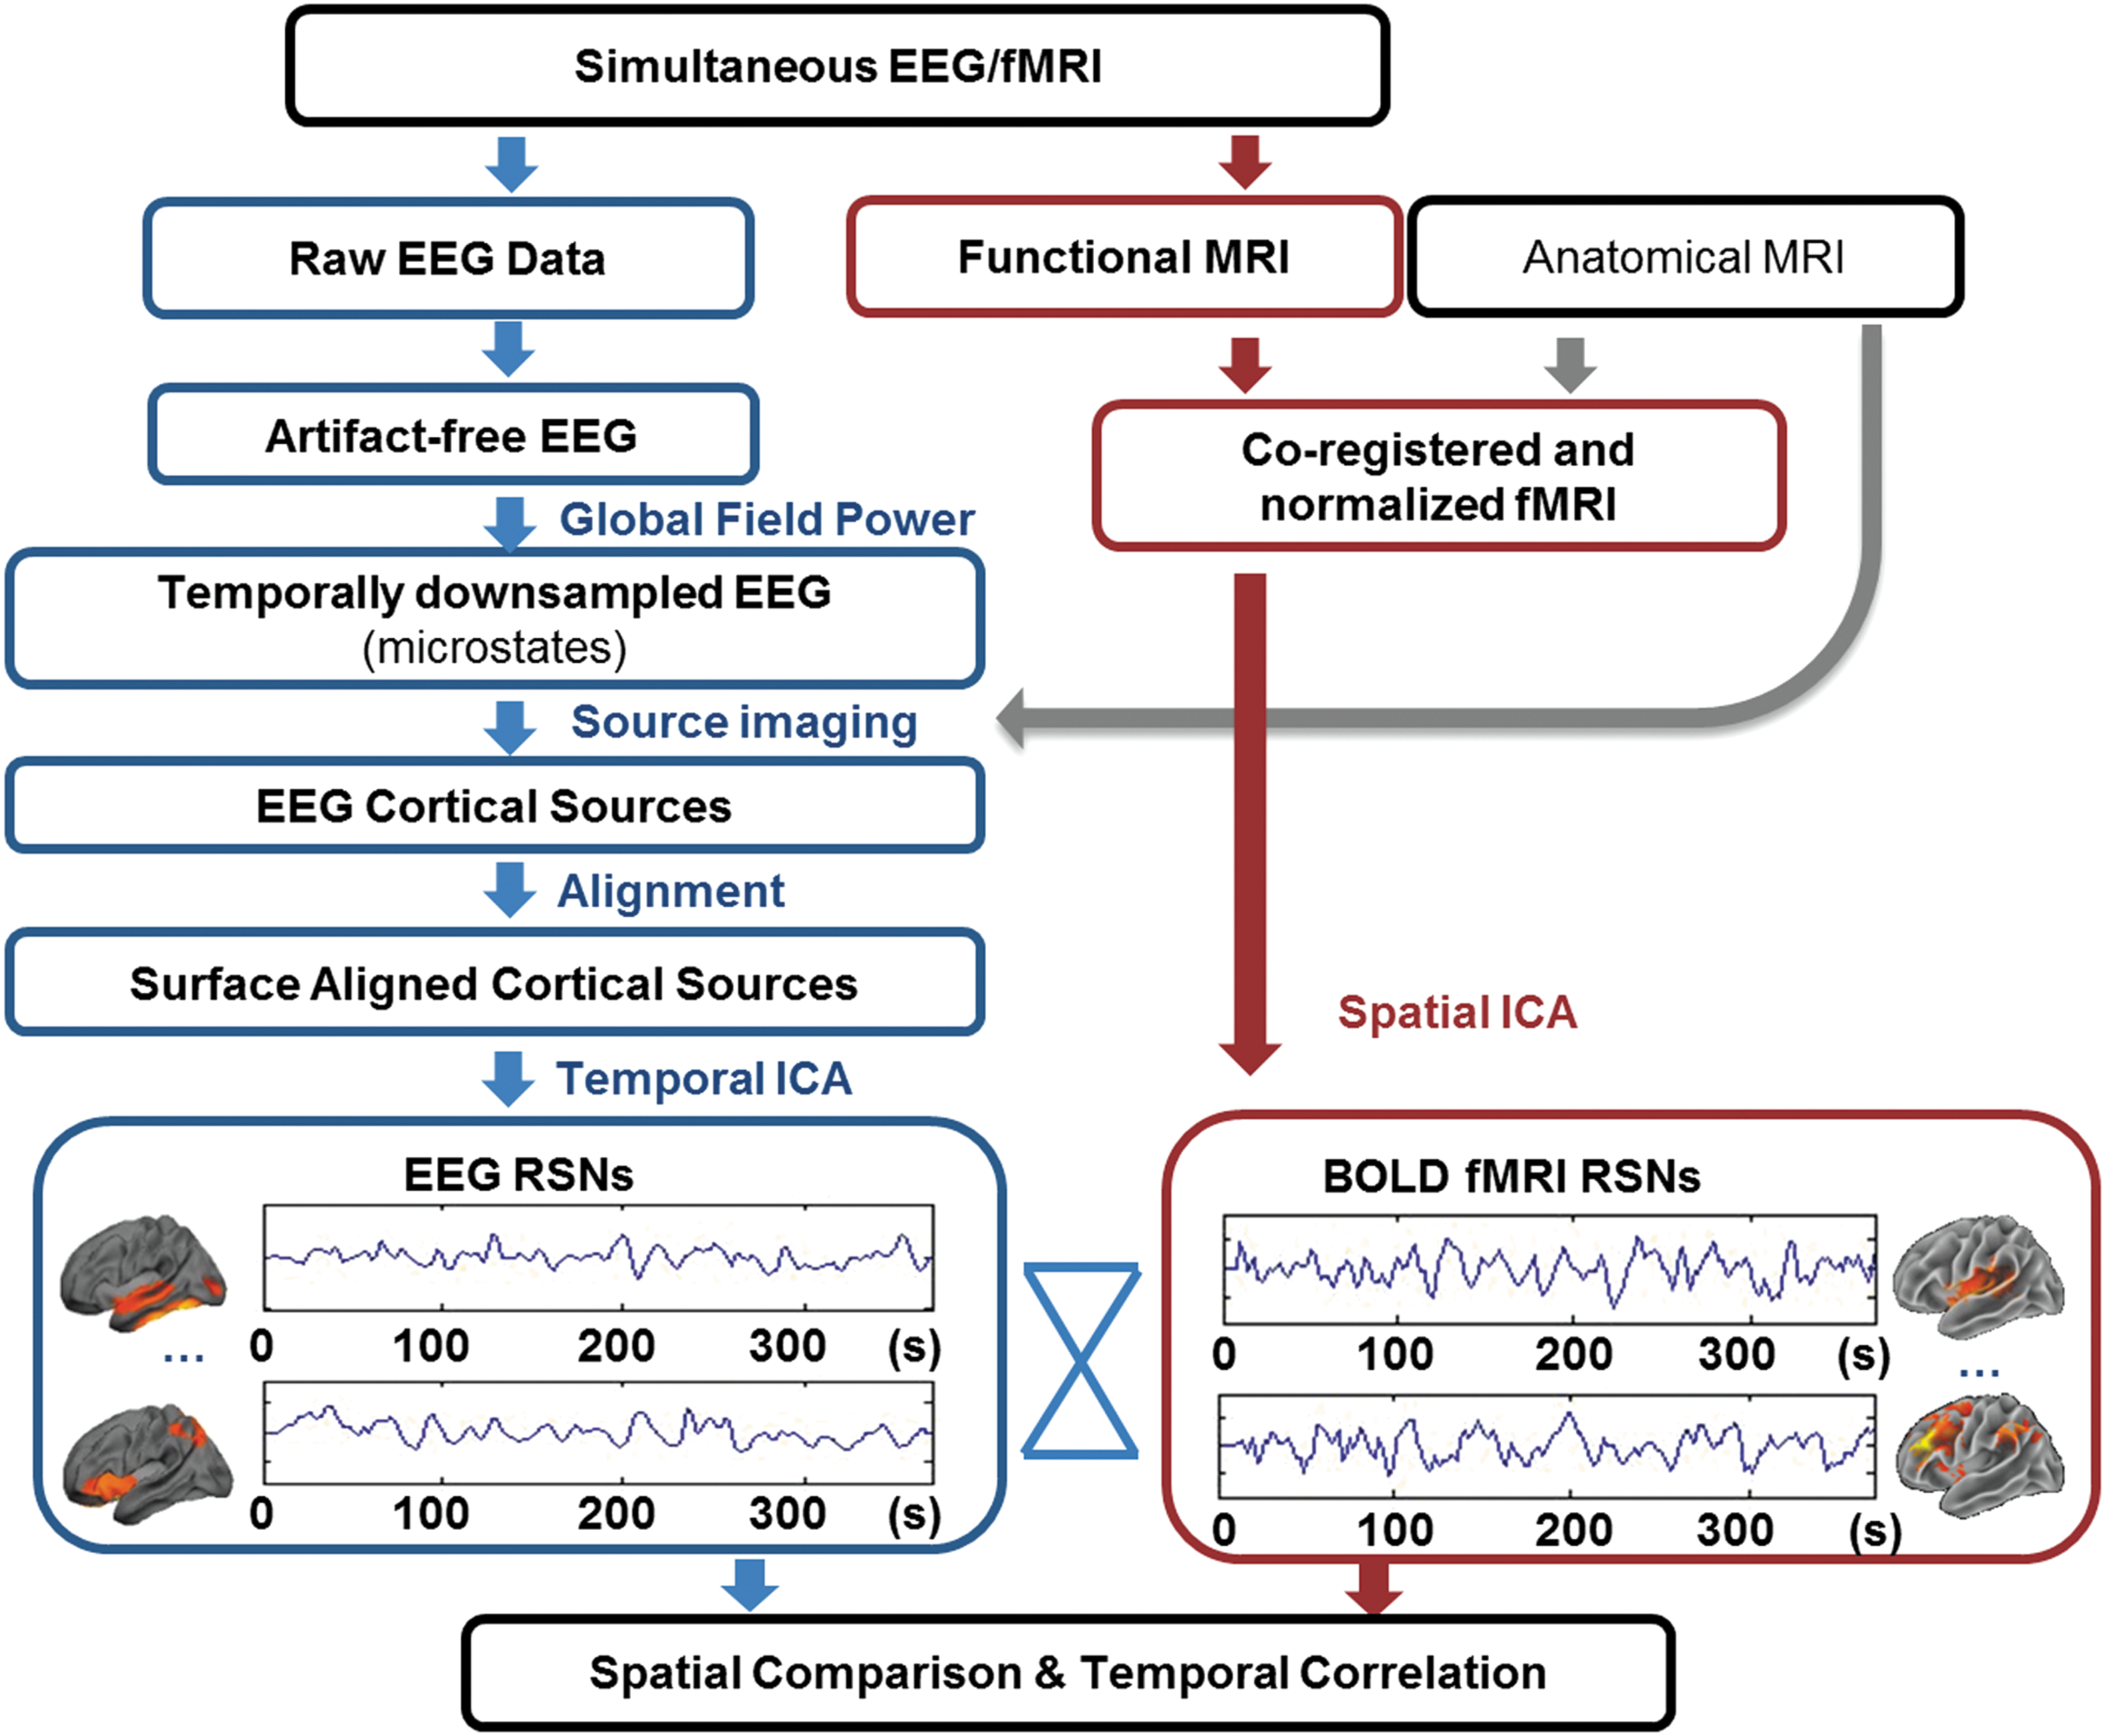
Schematic illustration of the data analysis stream. Note that electrophysiological representation of the large-scale resting-state networks (RSNs) was reconstructed from electroencephalography (EEG) data, separately from functional magnetic resonance imaging (fMRI) data. The cross-modal evaluation includes comparisons in both the spatial domain and temporal domain.
Simultaneously acquired EEG and fMRI data allow for a cross-modal comparison. We first compared the spatial patterns of EEG- and fMRI-RSNs by calculating a spatial correlation between the group-averaged maps from respective modality data. Of the 25 spatially independent components obtained from fMRI data, eight maps were identified as representative RSNs (Beckmann et al., 2005; Smith et al., 2009) and are shown in Figure 2. Eight maps of the 25 generated EEG tICs (also shown in Fig. 2) were then unambiguously paired with the fMRI-RSNs according to the Pearson correlation between unthresholded maps (p < 1 × 10⁻⁴ for all matched networks pairs, corrected for spatial smoothness and multiple comparison, resels estimated to be ∼878). The spatial correlations of the best matched EEG maps for fMRI-RSNs are significantly larger than those of the second best matches (p < 0.01, paired one-sided t-test, Fig. 4). All shown spatial maps of RSNs in Figure 2 are thresholded at |z| = 3, while unthresholded spatial maps are shown in Supplementary Figure S1. Table 1 lists values of four metrics, including the percentage of spatial overlap, the Dice coefficient, and the spatial CC between thresholded and unthresholded group-level images. To examine the variance across the subject samples, individual subjects' networks were also derived from both fMRI and EEG data. The spatial correlations of matched pairs averaged across all individuals are shown in Figure 3, which are all significant (p < 0.05) as assessed by using Monte Carlo simulations.
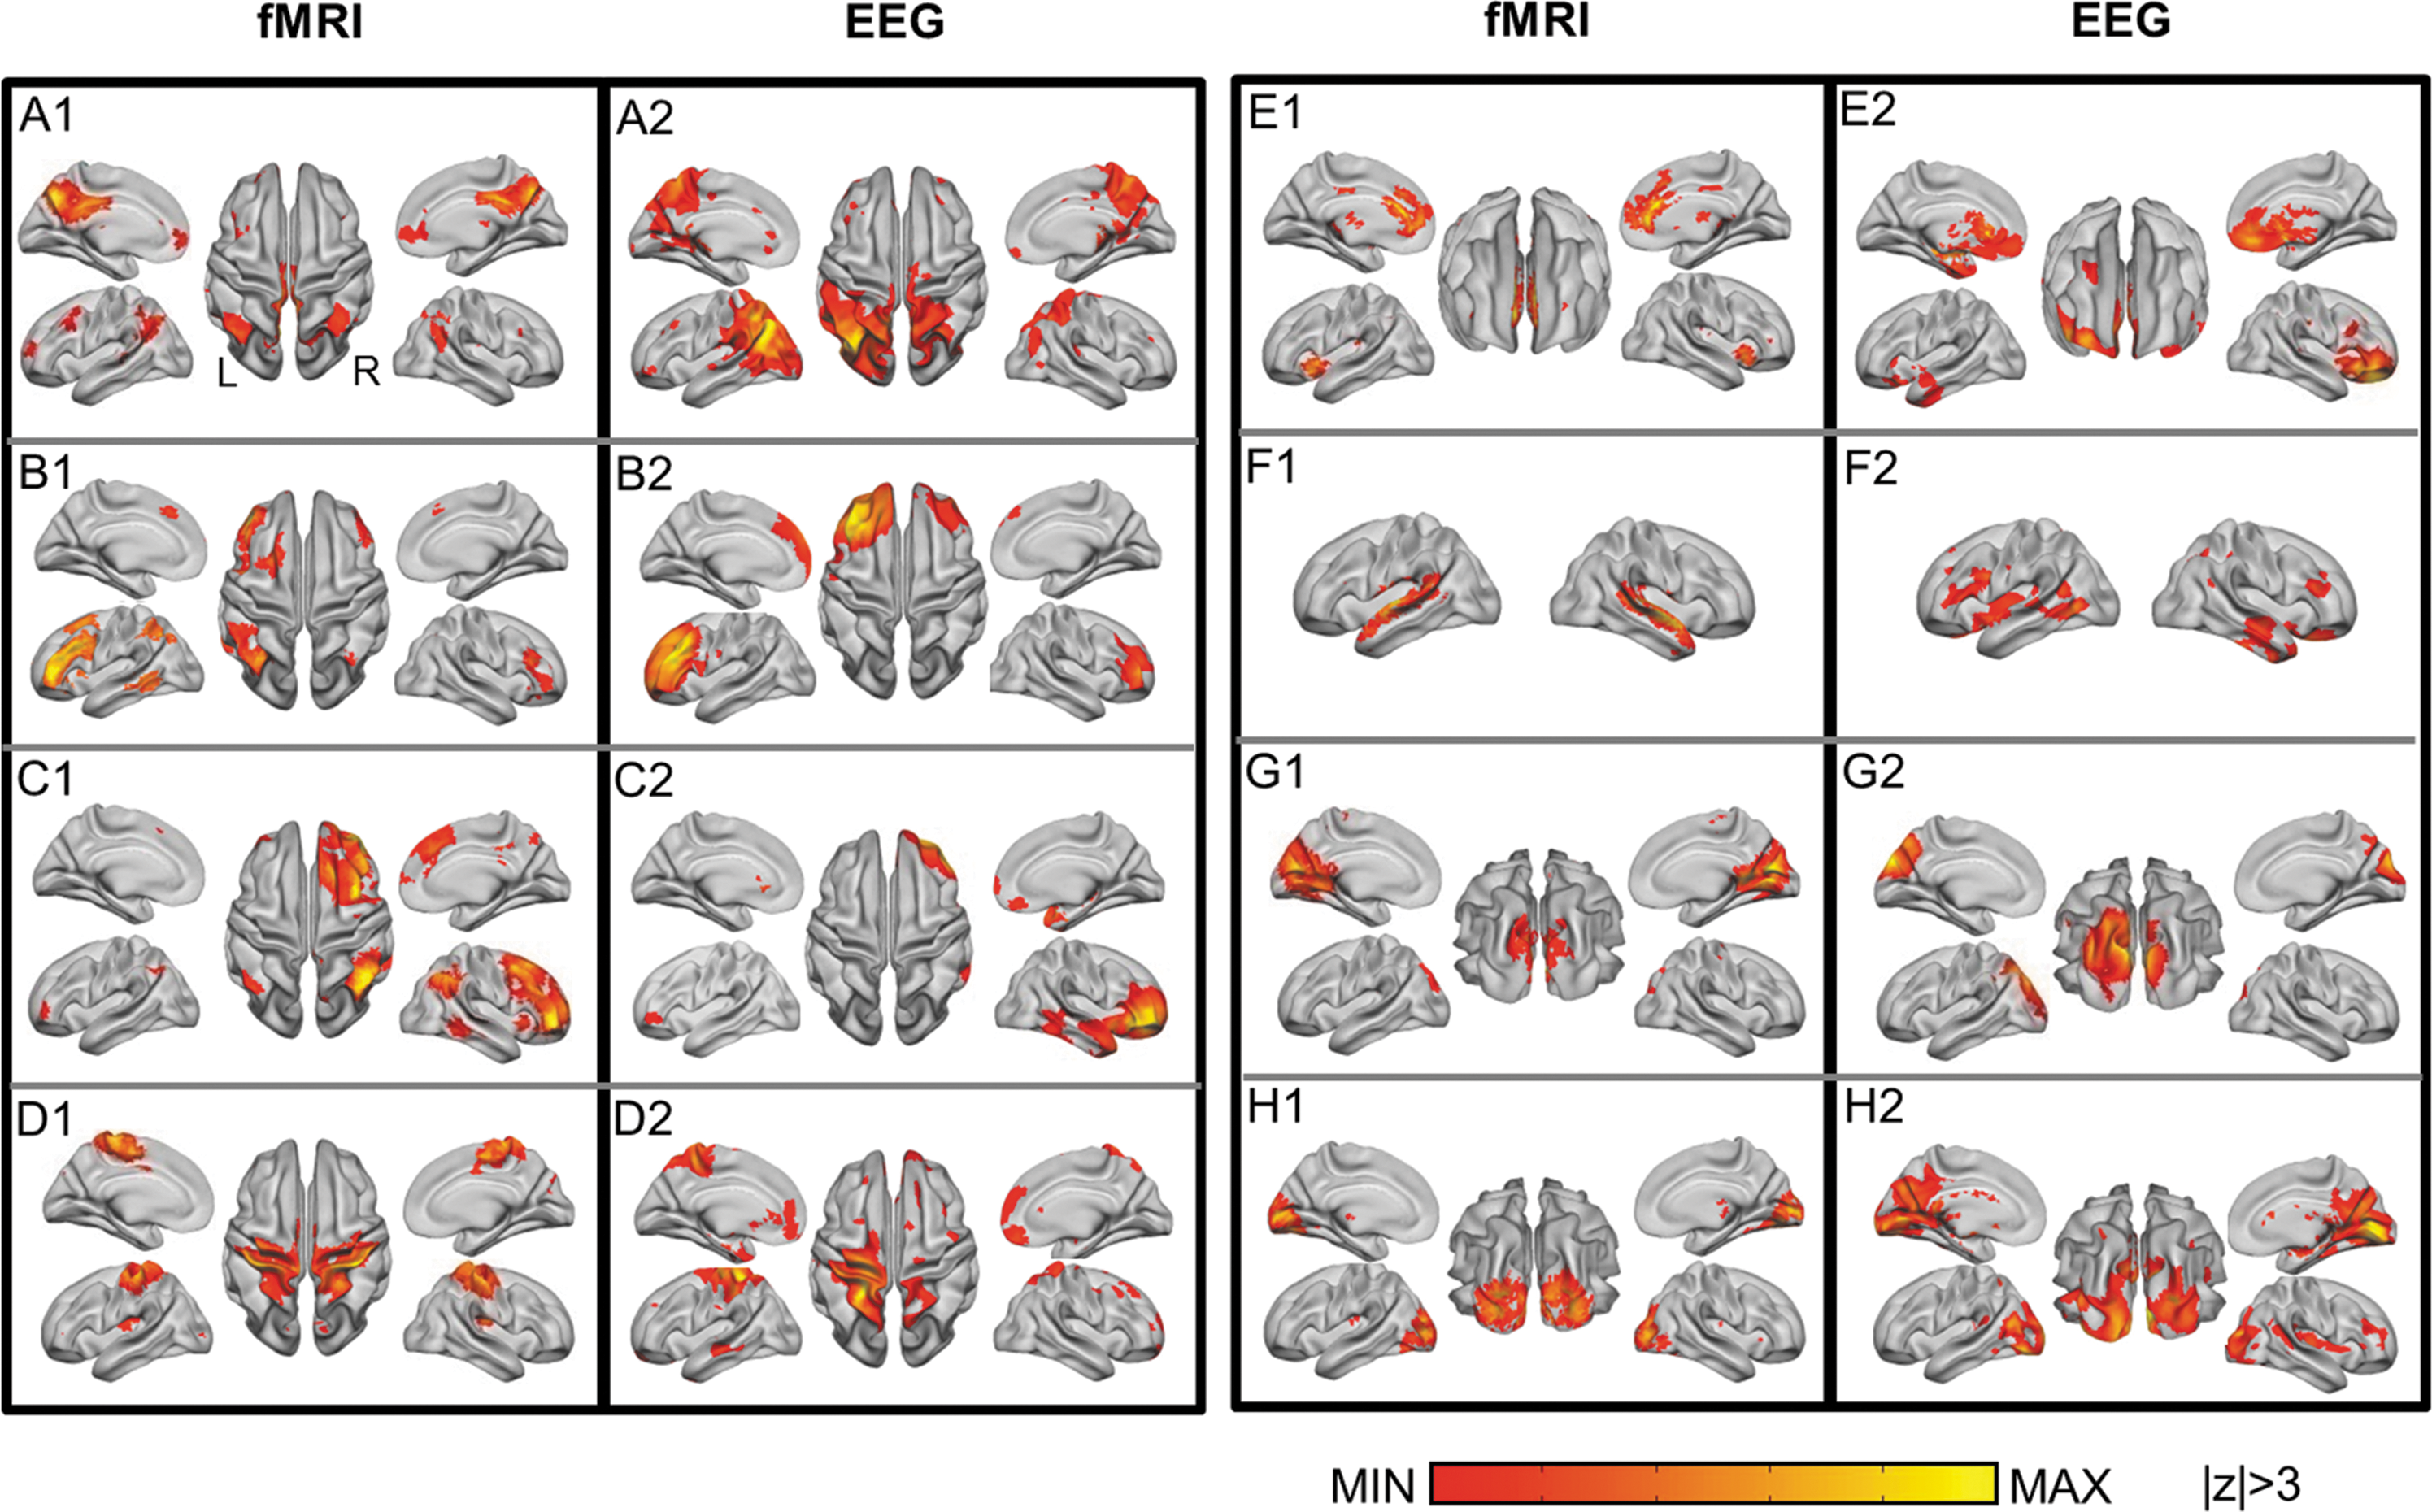
Eight well-matched pairs of blood oxygenation level-dependent (BOLD)-fMRI-derived (numerical label 1) and EEG-derived (numerical label 2) RSNs.
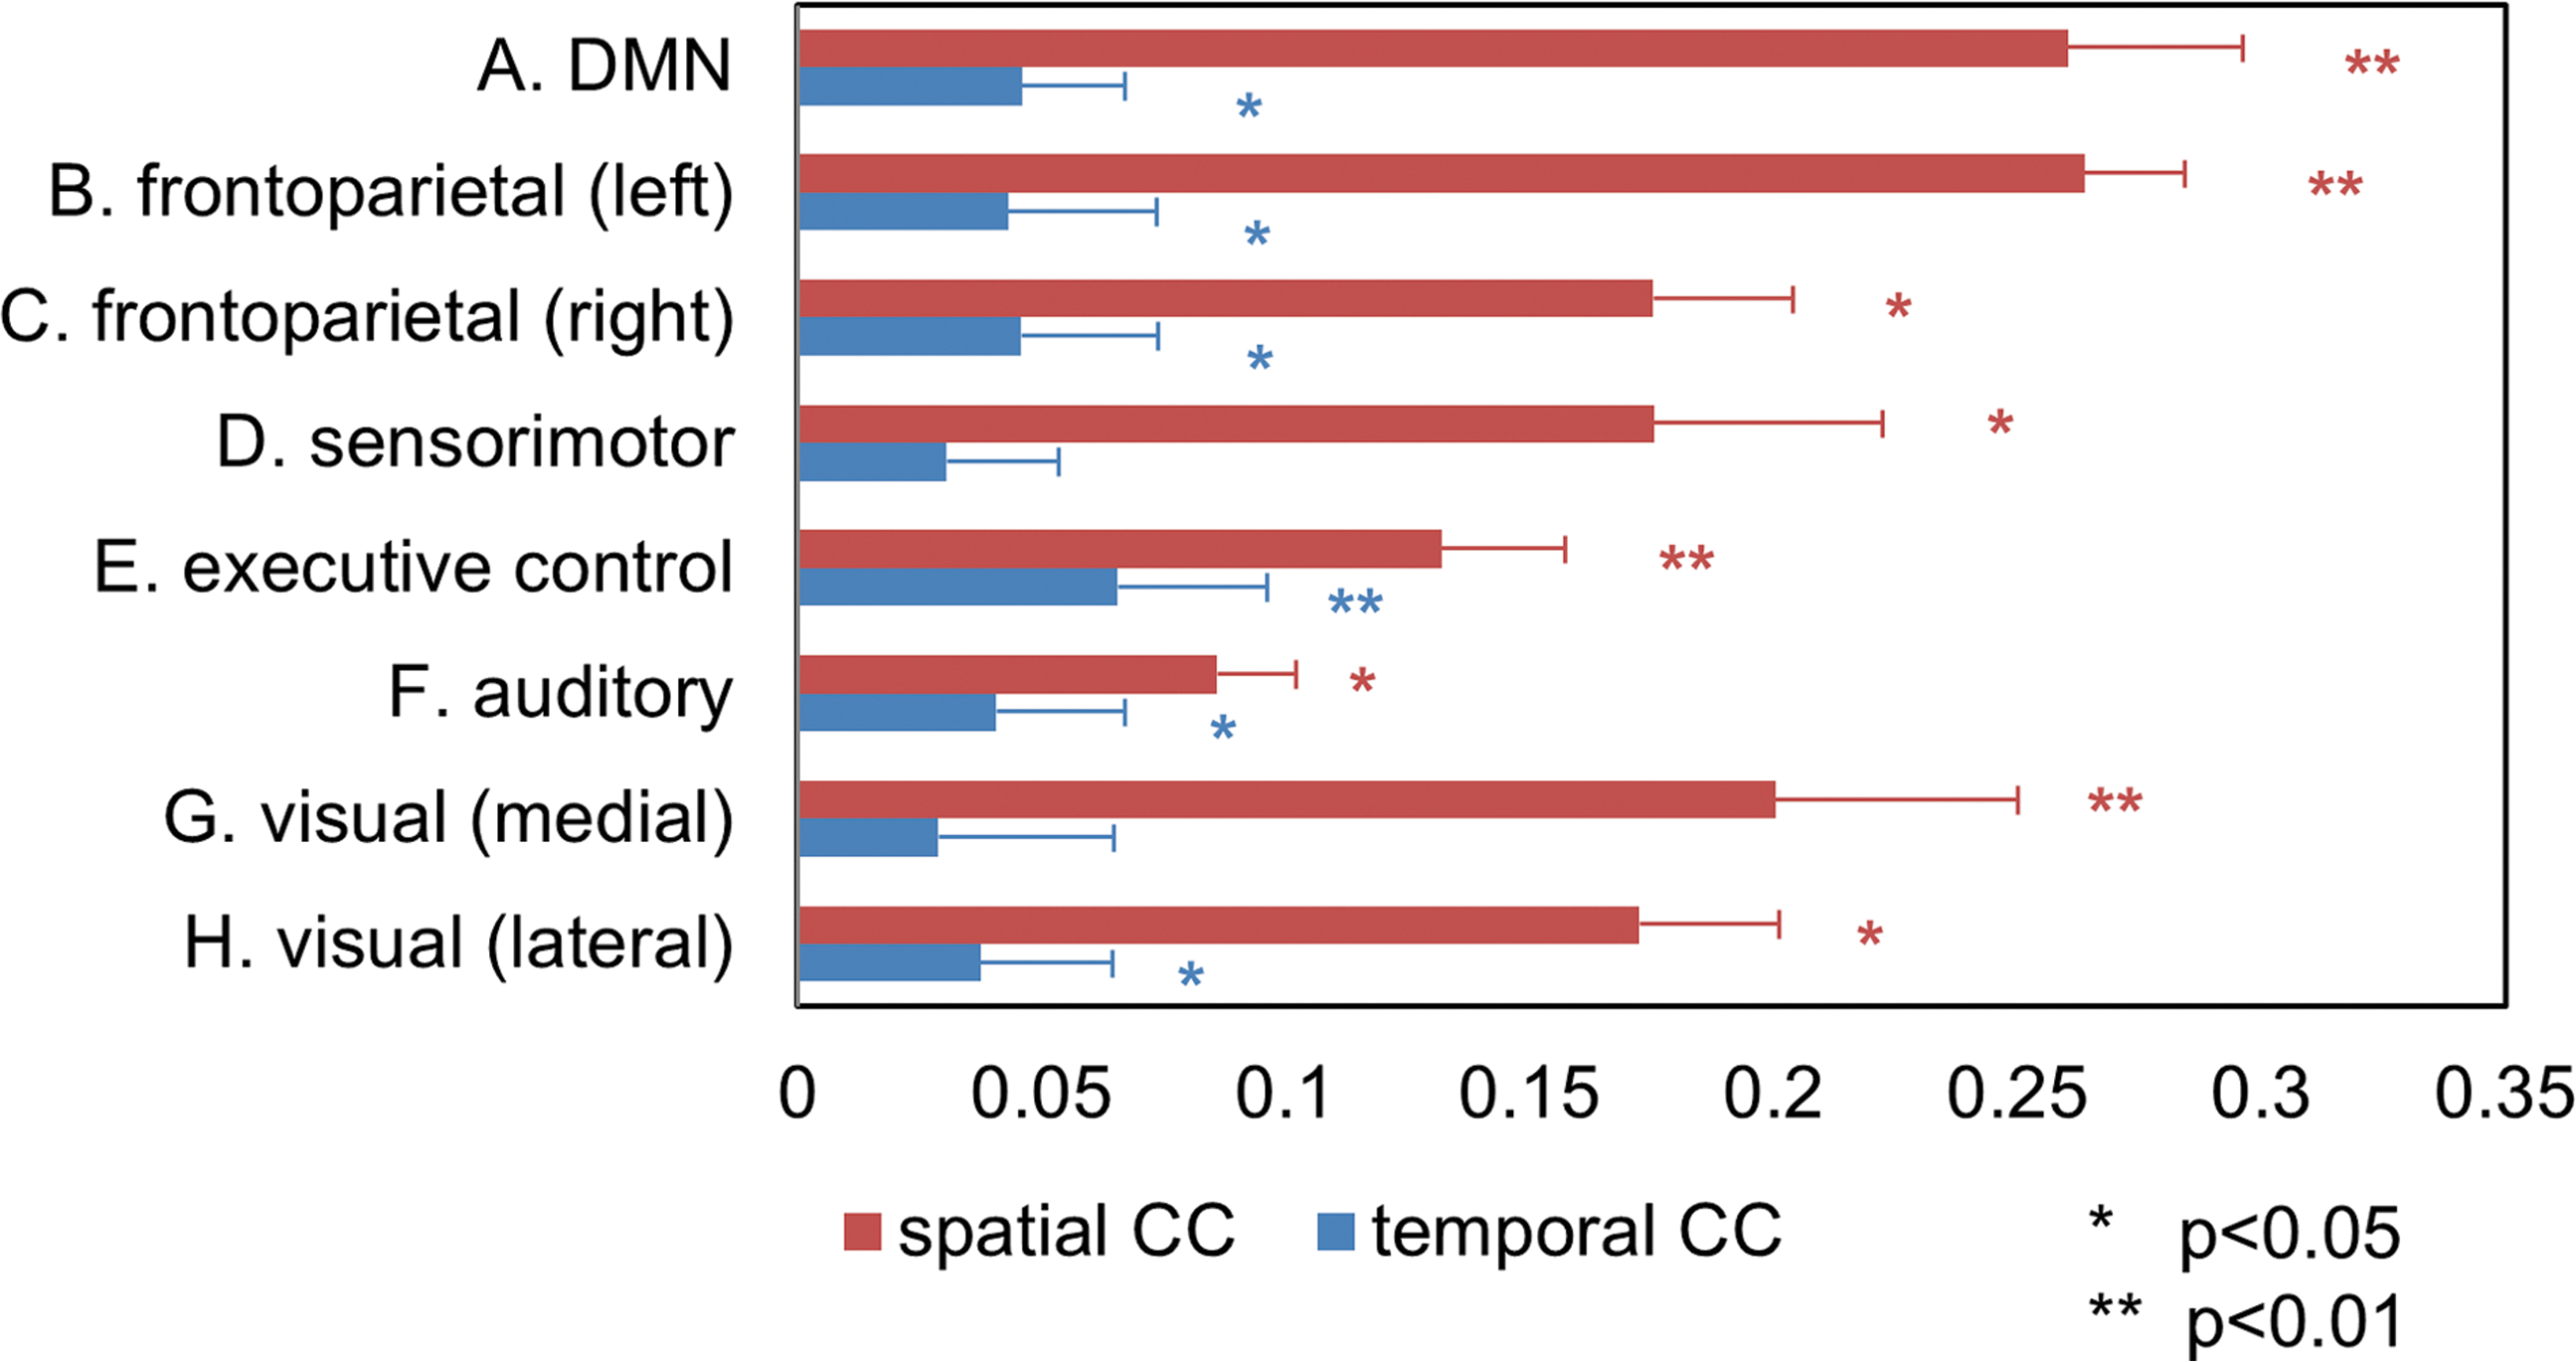
Correlation coefficients (CCs) of spatial patterns (red color) and time courses (blue color) between eight pairs of EEG-RSNs and fMRI-RSNs obtained from and averaged across all subjects. Stars indicate significant correlations after correction for multiple comparisons.
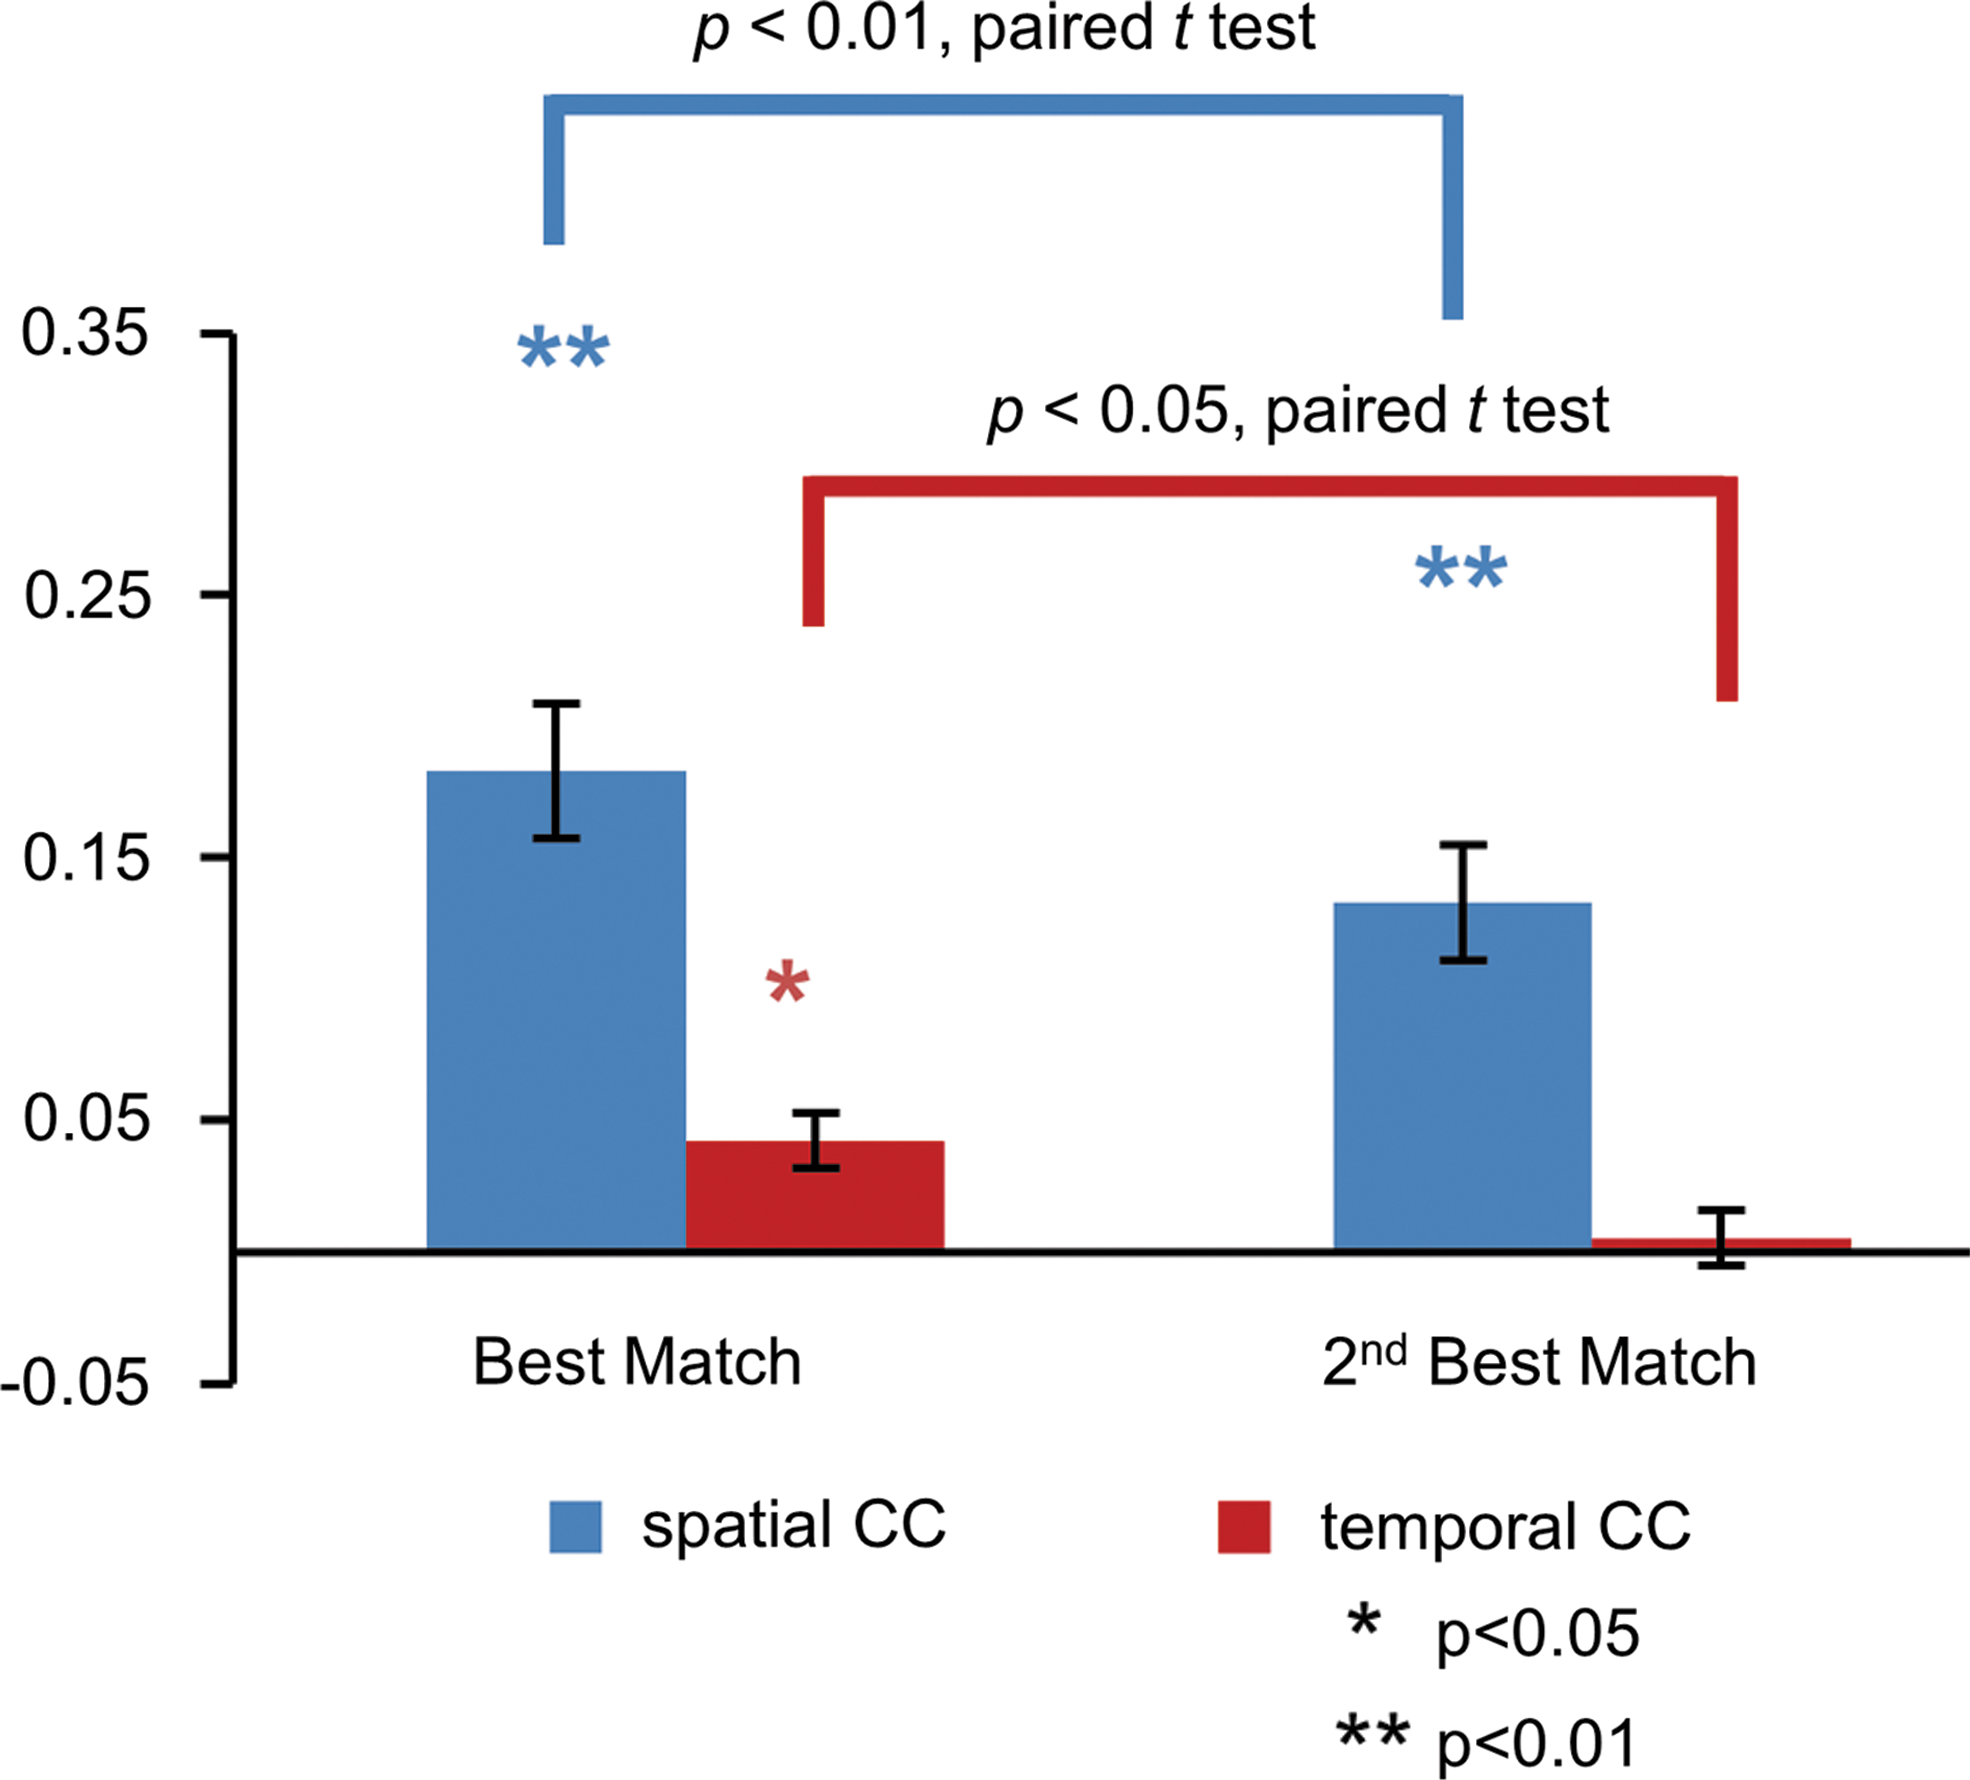
CCs of spatial patterns (red color) and time courses (blue color) between the best matched and the second best matched pairs of EEG and fMRI networks (Mean ± SEM). Stars indicate significant correlations after correction for multiple comparisons. Spatial correlations for both the best match and the second best match are significant, while only the temporal correlation is significant for the best match. Paired t-tests show that the spatial and temporal correlations of the best matched pairs are significantly larger than those of the second best mach.
The Percentage of Spatial Overlap, Dice Coefficients, and the Spatial Correlation Coefficient Between Thresholded and Unthresholded Group-Level Images of Matched Electroencephalography Resting-State Network and Functional Magnetic Resonance Imaging RSN Pairs
DMN, default model network.
For the purpose of comparison, EEG-RSNs reconstructed from all time points rather than the temporally downsampled data are illustrated in Supplementary Figure S2. Eight EEG networks were obtained from full data points and unambiguously matched to fMRI-RSNs. The spatial patterns between the EEG networks obtained with and without temporal downsampling are close (spatial correlation = 0.67 ± 0.21). Figure 2A shows the default model network (Greicius et al., 2003; Raichle et al., 2001; Shulman et al., 1997) identified independently by fMRI (A1) and EEG (A2), including the posterior cingulate cortex, the bilateral inferior parietal lobules, medial prefrontal cortex, and bilateral superior frontal gyri. Figure 2B and C show networks derived from both fMRI and EEG, which resemble the frontoparietal network (Smith et al., 2009) that predominantly involved the left and right hemispheres, respectively, and involved the dorsolateral prefrontal cortex, dorsomedial prefrontal cortex/dorsal anterior cingulate cortex, and middle temporal gyrus. Figure 2D corresponds to the sensorimotor network involving the primary motor, sensory cortices, and the supplemental motor area. Figure 2E includes the medial prefrontal cortex and the dorsal anterior cingulate cortex. These areas formed a network that has been found to be involved in executive control function (Miller and Cohen, 2001). Figure 2F mainly involves the superior temporal area, corresponding to the auditory network. Figure 2G and H correspond to two visual networks, with Figure 2G involving more medial visual areas and Figure 2H involving more lateral visual areas. For all fMRI-RSNs, a significant and unambiguous match was found in EEG. There are also notable differences between the fMRI and EEG maps. Compared with EEG, fMRI exhibits better spatial resolution and sensitivity in revealing the anatomical structures of coherent network activity, especially in deeper regions of the brain such as the superior temporal sulcus (Fig. 2F).
Due to the simultaneous acquisition of EEG and fMRI data, importantly, we were also able to assess the temporal correlation of EEG- and fMRI-derived RSNs' time courses. After the spatial maps of EEG-RSNs were extracted from the intermittently downsampled EEG source data, the continuous time courses of EEG-RSNs were reconstructed from full EEG source data through back projection. We hypothesized that a HRF can accommodate the different temporal scales of EEG-RSNs and fMRI-RSNs, in the same coupling way as the neural–hemodynamic relationship under stimuli/task conditions (Logothetis et al., 2001; Mukamel et al., 2005). Thus, we convolved time courses of EEG-RSNs with a canonical HRF (Friston et al., 1998) to assess the CC between time courses of the matched pairs of EEG- and fMRI-RSNs. Exemplar time courses of RSNs from single-session EEG and fMRI data are plotted in Supplementary Figure S3. The temporal profile of spontaneous modulations of BOLD resting data shows similarity with that of spatially matched EEG activity after convolution with a HRF. The quantitative cross-modality correlations (i.e., average and standard error of individuals' spatial and temporal correlation) of matched EEG and fMRI pairs are summarized in Figure 3 with statistical significance assessed using Monte Carlo simulations. Among all spatially matched EEG-fMRI networks, most pairs were identified with significant temporal correlations for their simultaneously acquired time courses, except for the sensorimotor and medial visual network. For the sensorimotor and medial visual network, relatively high and significant spatial correlations were found between the EEG and fMRI data, in contrast to their low and insignificant temporal correlations. While spatial matching found unambiguous pairs for fMRI- and EEG-RSNs, Figure 4 also shows the distinct temporal correlations between the best and second best matched pairs. Only in the best matched pairs, temporal correlation between fMRI-RSN and EEG-RSN time courses was significant.
To further investigate the relationship between different RSNs, we calculated the pairwise correlation between the time courses of fMRI-RSNs and EEG-RSNs with and without a convolution with HRF, as illustrated in Figure 5 (p < 0.05, corrected for multiple comparisons across all possible pairings). Since EEG-RSNs were derived through temporal ICA, their time courses exhibit very little correlation, as expected (Fig. 5C). However, after convolving with a HRF, the EEG-RSNs' time courses show distinct pair-wise correlation patterns (Fig. 5B). For example, temporal activities between the medial and lateral visual networks of EEG-RSNs are strongly correlated after convolving with HRF, and no correlation is observed in the data without HRF convolution. Interestingly, negative correlation has also been observed in EEG-RSN activity associated with the right frontoparietal network after convolving with HRF. The overall pattern of between-network EEG-RSN temporal activities is also very similar with the between-network correlations derived from fMRI (r = 0.41, p = 0.008). Figure 5D and E summarize the average of absolute correlation strength regarding all networks. Notably, the default mode network is commonly correlated with a wide range of other networks, especially as seen in the EEG data.
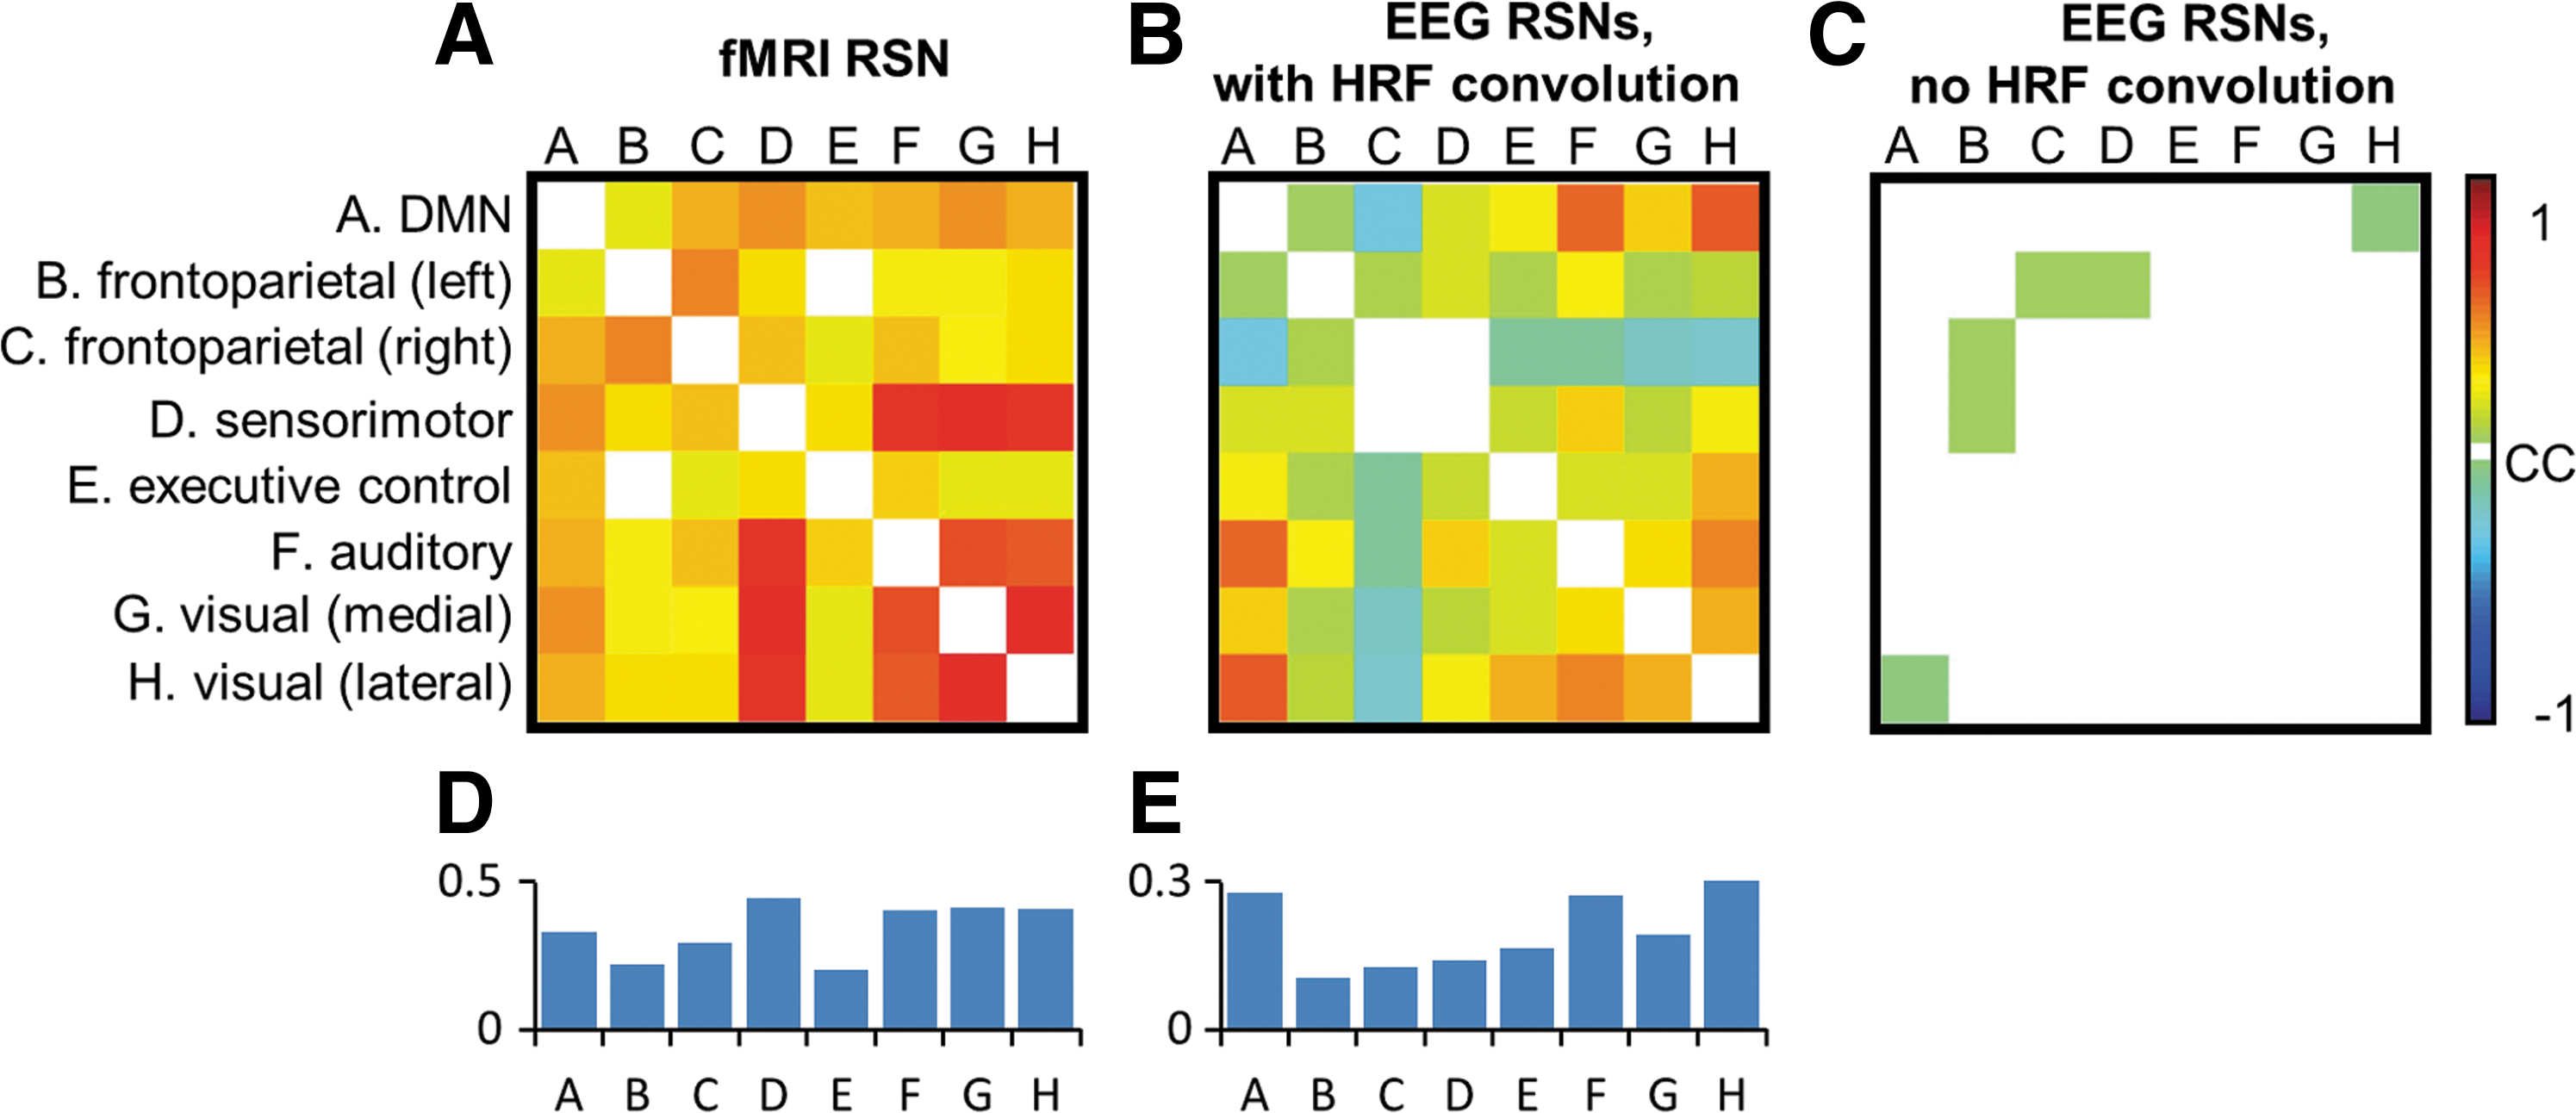
Pair-wise correlations between the
As EEG-RSNs and fMRI-RSNs were both derived using the data-driven approach, given the temporal correlation of matched pairs, it was still not clear how spatially specific the spontaneous EEG activity of a certain network would be in relation with the whole brain fMRI activity, since there exists cross talk between the time courses of RSNs, as indicated in Figure 5. Thus, it was difficult to judge how functionally relevant such temporal correlation would be despite their significance demonstrated. To understand the physiological meaning of the temporal correlation and to assess the spatial specificity of cross-modality correlation between EEG and fMRI, we examined the extent to which the time course of a certain EEG-RSN coincides with that of the BOLD signal at the voxel level using a GLM analysis. Results for the EEG-correlated default model network (DMN) as group-averaged maps are illustrated in Figure 6A, showing the regions where the variances of BOLD signals were significantly explained by the electrophysiological fluctuations of DMN derived from EEG data. The EEG-correlated DMN map appears very similar to the spatial extent of fMRI-derived DMN as in Figure 6B (r = 0.25). Table 2 lists values of four metrics, including the percentage of spatial overlap, the Dice coefficient, and the spatial CC between thresholded and unthresholded group-level images of EEG-fMRI-correlated network and fMRI-RSNs. For all the EEG-RSNs with significant temporal correlations to their spatially matched fMRI counterparts, the spatial distribution of EEG relevance is consistent with the maps of fMRI-RSNs, indicating the spatial specificity and functional relevance of such EEG-fMRI relationship.
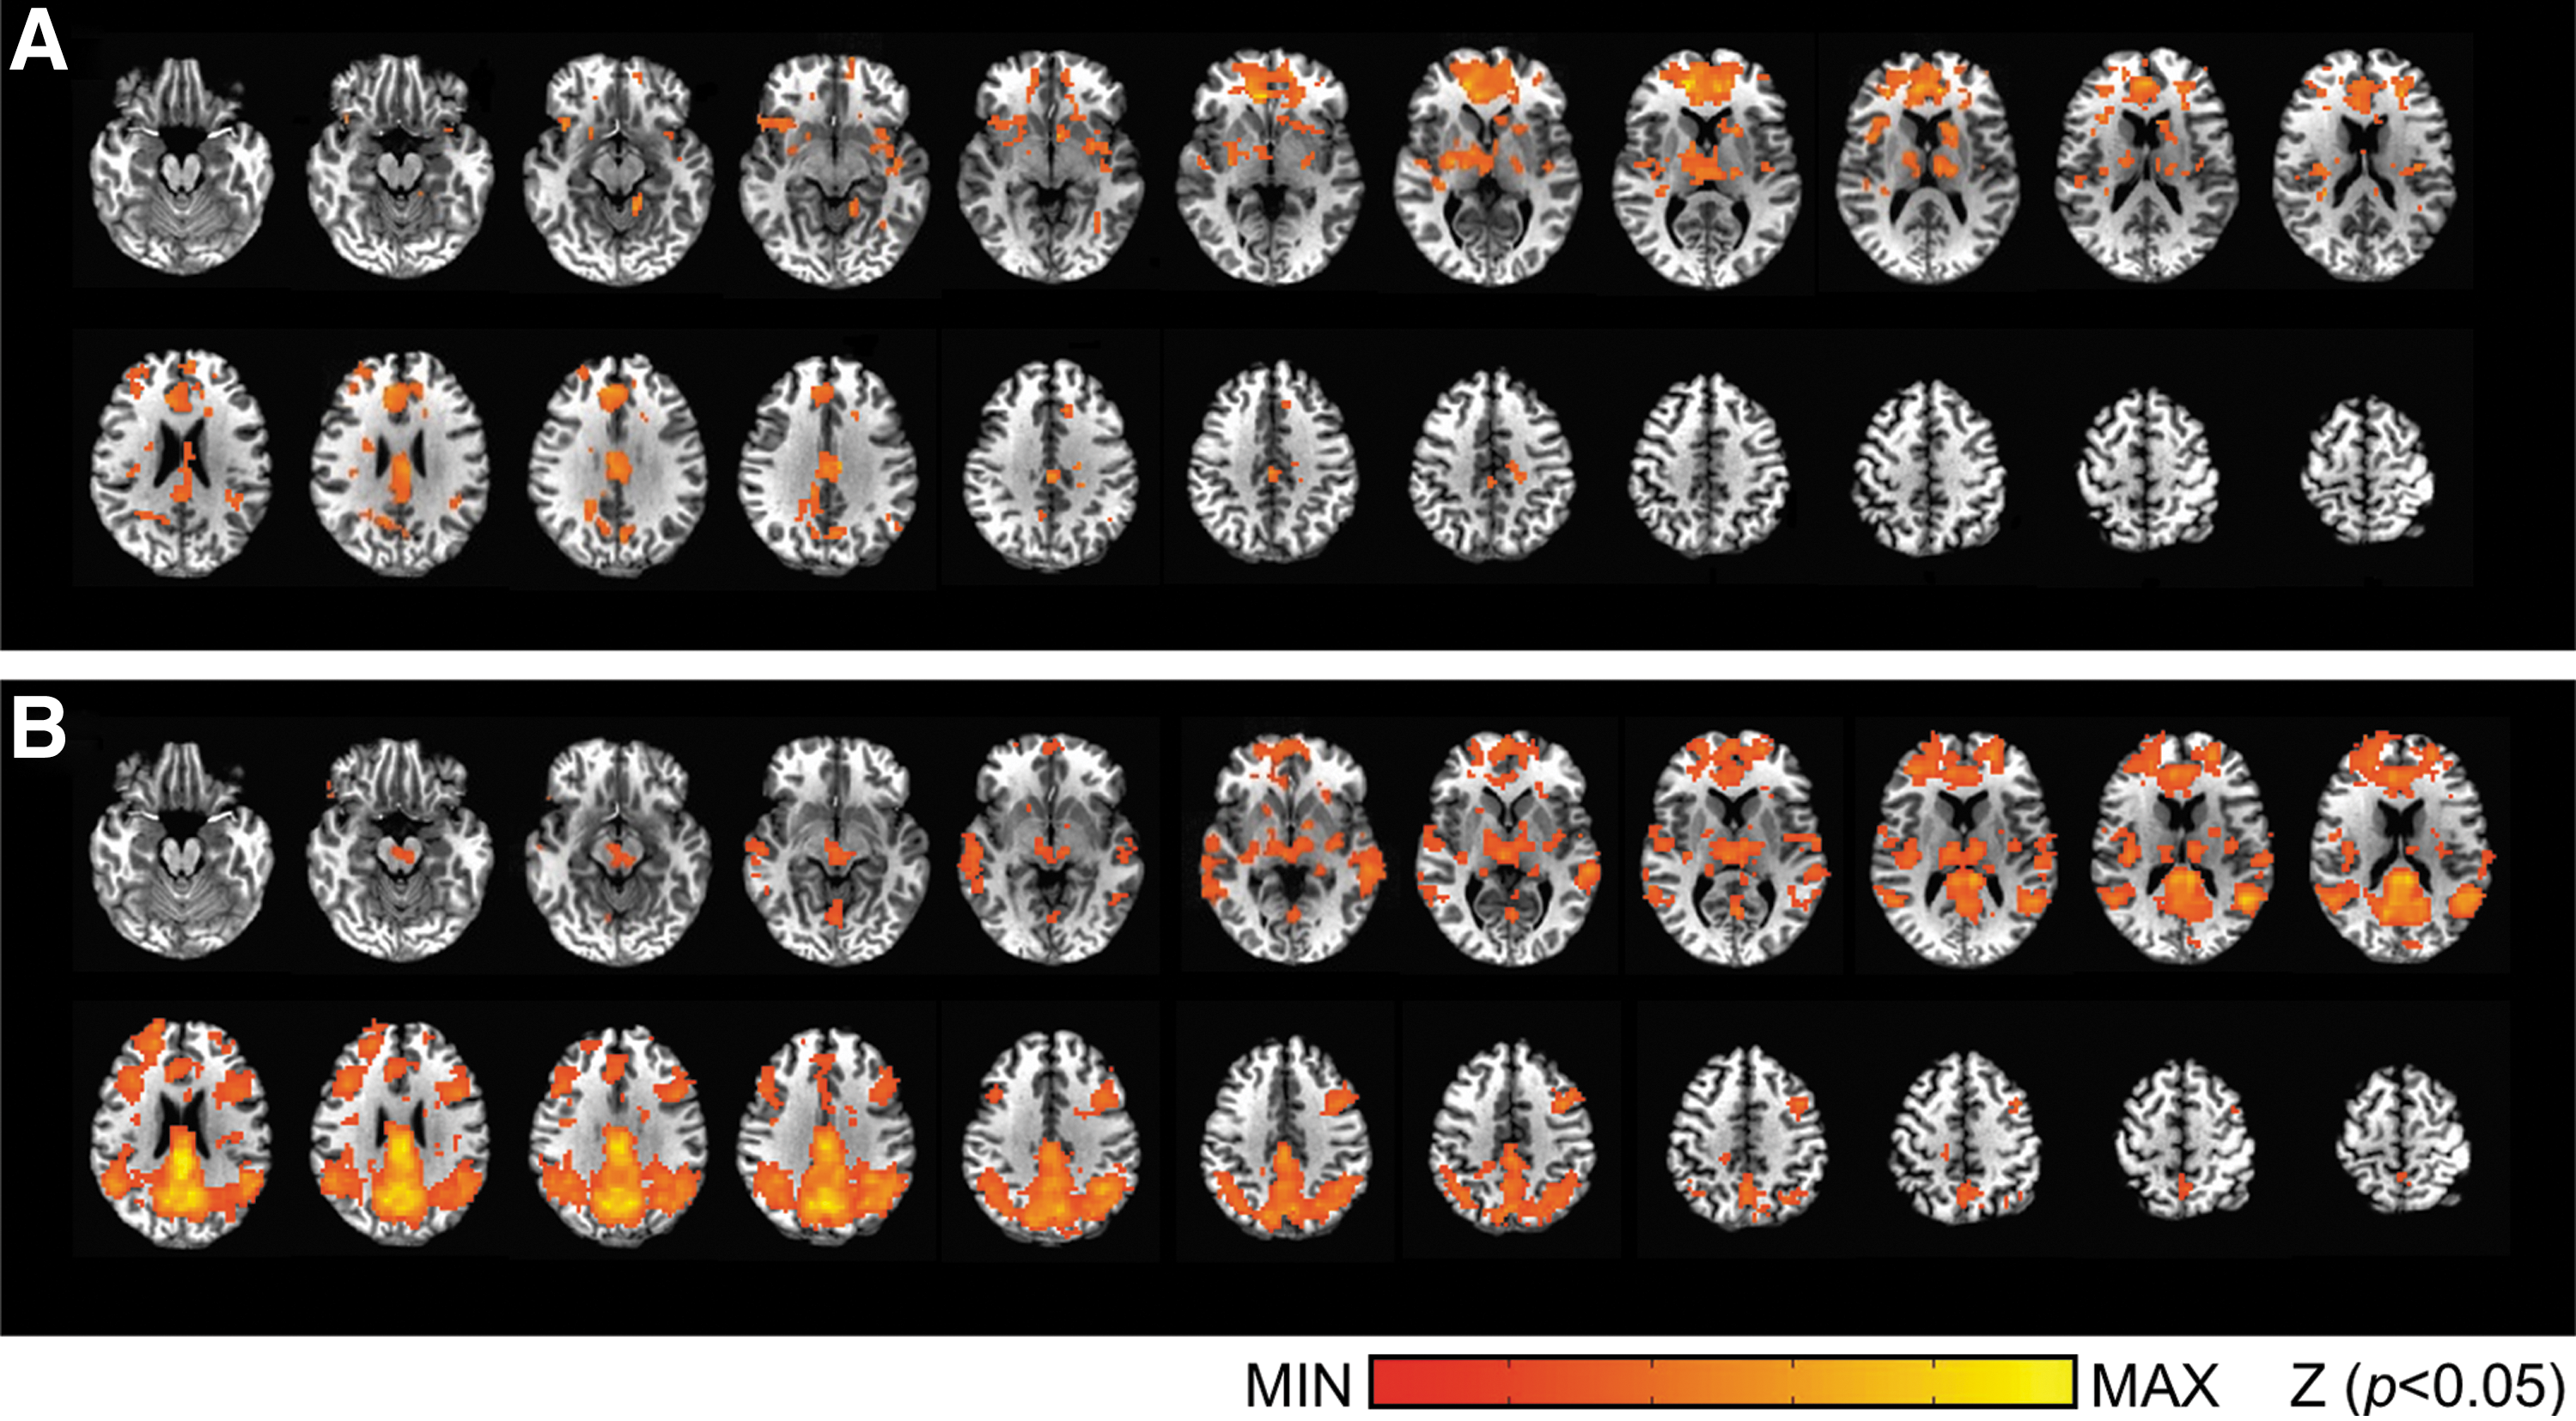
Compare
The Percentage of Spatial Overlap, Dice Coefficients, and the Spatial CC Between Thresholded and Unthresholded Group-Level Images of EEG-fMRI-Correlated Network and fMRI-RSNs
Dynamics of EEG-RSNs was continuously reconstructed at a fast temporal scale (250 Hz), which allowed us to compute power spectra of the respective time courses of RSNs (i.e., source amplitudes) without any temporal smoothing, as illustrated in Supplementary Figure S4. All spectra displayed a 1/f-like spectral distribution and showed substantial DC components due to the rectification procedure. Nonetheless, a moderate peak at ∼0.1 Hz was observed in several of the networks, including the default mode, sensorimotor, executive control, and medial visual networks. Another peak in the beta band (∼20 Hz) was also observed in the default mode, sensorimotor, and visual networks. A peak in the delta range (1–4 Hz) displayed in the spectra of the executive control network.
Discussion
We discovered large-scale electrophysiological representations for the BOLD-fMRI-RSNs, that is, EEG-derived large-scale human brain networks featuring fast, millisecond-scale temporal dynamics, which we term as EEG-RSNs. Our novel approach directly captured brain electrophysiological activity at high-resolution spatial and temporal scales and revealed large-scale electrophysiological RSNs with fast, distinct, temporal neural activity. More importantly, the EEG-RSNs that reflect direct neural activity topographically resemble the well-characterized fMRI-RSNs independently derived from simultaneously acquired fMRI data. In addition, after convolving with a HRF, the time courses of the EEG-RSNs are correlated with those of the spatially matched fMRI-RSNs and the association between EEG and fMRI is spatially specific to different networks. To the best of our knowledge, our study for the first time demonstrated the electrophysiological representation of large-scale RSNs that are related in both the spatial and temporal domain to the RSNs previously discovered in BOLD-fMRI data. This demonstration of cortical EEG-RSNs with spatial similarity and temporal correlation to the fMRI-RSNs independently verifies the electrophysiological basis of BOLD functional connectivity and demonstrates the intrinsic connection between fast neuronal activity and spontaneous slow hemodynamic fluctuations at the task-free resting state.
EEG-RSN versus fMRI-RSN
Our findings demonstrate and provide the first univocal evidence that cortical RSNs can be reconstructed from EEG signals with spatial and temporal similarity to fMRI-RSNs obtained from simultaneously acquired fMRI data. This fact that EEG-RSNs highly resemble the spatial structures of fMRI-RSNs is consistent with previous evidence from other electrophysiological recordings, including local field potentials (Leopold et al., 2003), ECoG (He et al., 2008; Nir et al., 2008), and MEG (Brookes et al., 2011; Hipp et al., 2012; de Pasquale et al., 2010, 2012). All findings converge on the notion that fMRI-RSNs have electrophysiological underpinnings and fundamentally reflect ongoing brain functions.
As a direct way of recording neural activity, EEG is well recognized for its richness in temporal information. The availability of high-density EEG covering the head and its noninvasiveness also makes it well suited for studying large-scale cortical neural networks in the human brain. Previous studies have utilized EEG to investigate the electrophysiological signature of RSNs and have focused on the temporal domain of EEG. However, similar to MEG, the nature of surface recording limits EEG in terms of spatial resolution and specificity. Thus, it is difficult to relate the scalp patterns of EEG to the anatomical structures of BOLD-fMRI-RSNs even though their time courses have been found to be correlated (Laufs, 2008; Mantini et al., 2007; Yuan et al., 2012), which hinders locating the specific electrophysiological origin of fMRI-RSNs. By means of source imaging, many studies (mostly involving tasks) have shown that improved spatial information can be retained from EEG/MEG while preserving the fast temporal information or even improving it through spatial deconvolution (Dale et al., 2000; Ding and Yuan, 2013; Ding et al., 2009; Jerbi et al., 2007; Yuan et al., 2010, 2011). As revealed in our current results of EEG-RSNs, many previous studies also demonstrated the capability of source imaging in recovering activations from deep brain structures (e.g., anterior and posterior cingulate cortices), which is achieved due to the advancements in modeling and computations in source imaging techniques and amounts to evidence that EEG/MEG measurements are sensitive to brain activations from certain deep structures (Beldzik et al., 2015; Miltner et al., 2003; Taylor et al., 2007; Ullsperger and von Cramon, 2001). Our study reports that largely distributed cortical RSNs, which were previously mostly observed in BOLD-fMRI based on hemodynamic signals, can be reconstructed from EEG alone by combining electrophysiological source imaging and ICA.
Our investigation is innovative in the way that eight distinct brain networks at the resting state were recovered from EEG data alone and that the multimodal spatial and temporal comparison was validated on two sets of EEG and fMRI networks, which were simultaneously acquired yet independently derived. Our approach differs from previous work that identified electrophysiological correlates of fMRI networks (similar as in Fig. 6) by exploiting the time courses of electrophysiological signal with those of BOLD-fMRI (Britz et al., 2010; Goldman et al., 2002; Hiltunen et al., 2014; Laufs et al., 2003; Musso et al., 2010; Sadaghiani et al., 2010; Yuan et al., 2012). Neither did these studies reveal anatomic organization of electrophysiological data alone (as we reported in Fig. 2) nor did they report spatiotemporal relationship to fMRI counterparts (as we reported in Fig. 3). Noteworthy, a recent study on a large EEG data set of 80 healthy subjects reported five EEG-derived networks at the resting state (Aoki et al., 2015), but the investigation did not include direct cross-model comparison with fMRI data. Our findings corroborate the findings from MEG data on the large-scale organization of electrophysiological data in similar spatial patterns with BOLD-fMRI networks (Brookes et al., 2011); however, existing technology precludes MEG from simultaneous recording with fMRI, while our data of simultaneous EEG-fMRI recordings allow detailed examination on the temporal relationship of spatially matched pairs.
In addition to the similarity of the EEG- and BOLD-derived RSN spatial patterns, our study again confirmed the temporal relationship between endogenous electrophysiological signals and the fMRI signal at the task-free resting state. Most importantly, our study showed that the information of an electrophysiological RSN can be embedded as fast-changing EEG events in intervals of ∼40 msec, which is much faster than the information obtained from band-limited power utilized in previous studies that temporally smoothed the power modulation of electrophysiological signals to various degrees (at least 400 msec) (Brookes et al., 2011; de Pasquale et al., 2010, 2012; He et al., 2008; Hipp et al., 2012; Nir et al., 2008; Schafer et al., 2014). In contrast, the spontaneous fluctuations of the BOLD-fMRI signal relevant to functional connectivity are mostly below 0.1 Hz (>10 sec in the temporal domain) (Cordes et al., 2001). Although these studies have shown that the spontaneous signal of distributed regions of the brain, reflected in either electrophysiological signals or BOLD-fMRI signals, exhibits temporal coherence in respective modality, the temporal relationship of correspondent RSNs across modalities has not been clear. In this study, we directly showed that the slow spontaneous fluctuations of BOLD-RSNs are linked to the fast dynamics of their spatially similar EEG counterparts. Despite the different temporal scales, their time courses are significantly correlated after convolving the power fluctuations of extracted EEG-RSNs with a HRF. The observed correlations cannot be attributed to physiological fluctuations that are independent of neuronal activity, such as the influence of respiration or cardiac circulation on the hemodynamic system (Birn et al., 2006; Shmueli et al., 2007; Wise et al., 2004). Although the EEG-RSNs' time courses explained a limited yet significant portion of the variance in the spontaneous fluctuations of BOLD signal, our results have shown that the EEG-fMRI relationship did not arise from spurious correlation as environmental or computational noises as in the Monte Carlo simulations, and more importantly, that the EEG-fMRI coupling is spatially specific to exactly those structures that constitute RSNs in either modality alone (Fig. 6), which again suggests the functional importance of the coupling relationship. Furthermore, this neural-BOLD coupling was observed in the spontaneous activity at the task-free resting state of brain and yet such relationship is also consistent with that found between BOLD and electrophysiological recordings in response to stimuli or a task (Logothetis et al., 2001; Mukamel et al., 2005), suggesting a general mechanism transforming the neural power changes into the hemodynamic signal variations.
Despite the spatiotemporal correspondence between EEG- and fMRI-RSNs, there are also important differences observed between the two different modalities. First of all, the spatial resemblance of RSNs does not guarantee the temporal correlation of their time courses. For example, the medial visual network was found to be associated with only a spatial correlation and lacked a significant temporal correlation. In addition, as shown in Figure 4, for the EEG networks that were found to be of the second highest yet still significant spatial correlation with corresponding fMRI-RSNs, no significant temporal correlations in their respective time courses were found. Furthermore, although the majority of the networks have a joint significant spatial correlation and temporal correlation between RSNs of different modalities, interestingly the temporal correlation is not in proportion to the spatial correlation. Particularly, the values of temporal correlation are much smaller than the spatial correlation, which indicates the difference of effect size between spatial and temporal comparison and suggests caution in making extrapolation across spatial and temporal domains. In general, the EEG only explained a small portion of the corresponding fMRI temporal signal variation, which leaves much of the fMRI signal variance unexplained. Note that the temporal correlation in the current investigation is only calculated within the frequency range of <0.1 Hz (because of BOLD signal) and only in the linear and stationary manner. In contrast, EEG-RSN offers a vast amount of information available at a fast and neuronal temporal scale, which may make it a useful tool in investigating dynamic network behaviors. Since the temporal structures of the neuronal or hemodynamic fluctuations may exhibit dynamics beyond a linear or stationary manner (Liu and Duyn, 2013; Palva et al., 2013; Tagliazucchi et al., 2012), mining into unexplained variance between EEG- and fMRI-RSNs could potentially add insights into the mechanism of dynamic functional connectivity (Chang and Glover 2010; Chang et al., 2013; Hutchison et al., 2013).
Nonetheless, fundamental differences between these two modalities should also be noted, such that fMRI is a surrogate signal, which is known to be affected by many physiological factors (Logothetis, 2008), and that EEG as a far-field sensor system is more sensible to the largely synchronized cortical signal in the low-frequency range and is less sensible to the locally synchronized signal in the high-frequency domain (Nunez and Srinivasan, 2006). Our observations in the spatiotemporal comparison suggest that caution should be taken when trying to link findings in regard to RSNs from BOLD-fMRI to electrophysiology and emphasize the importance of simultaneous recordings of multimodal data. Nevertheless, spatial similarity of the RSNs obtained from EEG and fMRI data and their temporal correlations is quite remarkable, strongly suggesting the presence of neuronal contribution in the BOLD-fMRI signal fluctuations as well as providing a strong indication that both modalities are in fact detecting and capturing an ongoing complex spatiotemporal natural brain activity.
Methodological considerations
Our data show that EEG-RSNs that spatially resemble the fMRI-RSNs can be extracted from only a downsampled fraction of EEG data (those at the local maximums of the GFP; Fig. 2) as well as from full data (Supplementary Fig. S2). Many previous studies showed that an ensemble of similar networks can be recovered through a continuous modulation of band-limited power in various frequency bands (Brookes et al., 2011; de Pasquale et al., 2010, 2012; Hipp et al., 2012) or the whole band (de Pasquale et al., 2010). Our observation suggests possibly that the instantaneous activations of multiple brain regions in the form of brief bursts of synchronized activity constitute the continuous, sustained interregional neuronal interactions. Therefore, it is possible that RSNs might be driven by synchronized neural activity at more discrete, burst-type temporal events (∼40 msec, physiologically relevant time scale), which are separated into temporally independent processes representing functional networks. Interestingly, our observation is analogous to recent resting-state fMRI findings that the BOLD-RSNs based on interregional correlations of continuous full data can be replicated from selective and discrete fMRI time frames of a high signal level (Liu and Duyn, 2013; Tagliazucchi et al., 2012), which supports the notion that interaction between brain regions may be determined by brain activity at short, intermittent events at critical points in time (as avalanche type of events) instead of a continuous sustained process evenly distributed over time. Tagliazucchi and associates (2012) revealed that resting-state activities measured by BOLD-fMRI follow a power-law distribution spanning several orders of magnitude in the space and spread as scale-free avalanches resembling those seen in smaller scales (Beggs and Plenz, 2003). The avalanche type of neuronal events is also measured by EEG (as microstates), which involves time scales much shorter than those typically associated with long-range temporal correlations (10−3–10−1 vs. 100–103 sec, respectively). Like the long-range temporal correlations, microstate sequences at rest were also found to possess scale-free dynamics in the time domain (ranging from milliseconds to tens of seconds) (Van De Ville et al., 2010). Despite the difference in time scales, the scaling exponents of neuronal long-range temporal correlations and avalanches have also been found to be strongly correlated during the resting state (Palva et al., 2013). Our data have provided evidence linking spatial organization of the EEG and fMRI resting-state activities and, thus, suggest that the avalanche type of events observed in EEG and fMRI might be closely related.
Moreover, our results also highlight the importance to delineate the temporal independence of RSNs on a fast time scale. Otherwise, if temporally smoothed or convolved with HRF, several RSNs may become correlated (e.g., the medial and lateral visual networks as shown in Fig. 5B vs. C), which make it difficult to delineate these RSNs based on their temporal independence. Indeed, previous studies that exploited low-pass filtering on electrophysiological data did not delineate concurrent and separate correlates of the medial and lateral visual networks for the fMRI data (Brookes et al., 2011; Schafer et al., 2014). Supplementary Figure S6B also shows an example that an ambiguous match with fMRI-RSN appears as the EEG sources are increasingly downsampled in the time domain. Since the dynamics of RSNs can be constructed from EEG at a fast temporal scale, it allows for calculation of power spectra for EEG-RSNs. Note that the power spectrum is calculated based on the amplitude fluctuations of source waveforms. The peak at ∼0.1 Hz is consistent with several previous studies that observed a similar peak in the power spectrum of rectified amplitude (Leopold et al., 2003) or power (de Pasquale et al., 2010). Unlike previous studies, our results found the peak in the very slow frequency range at a fast sampling scale without any temporal smoothing, thus excluding the possibility of aliasing from physiological noise in the higher frequency range. The spectral peak of the EEG networks is also consistent with the peak carrier frequency, in which correlated amplitude modulations of MEG signal formulate the networks, such as beta band for the DMN and theta band for the executive control network (Brookes et al., 2011).
Implication for future resting-state brain studies
Our investigation is related to previous work on the EEG microstate (Britz et al., 2010; Koenig et al., 2002; Lehmann et al., 1987; Musso et al., 2010; Yuan et al., 2012), which emphasizes on the study of brain dynamics. The term of microstate (Lehmann et al., 1987) refers to the observation that the topographic representation of the EEG scalp electrical field does not change randomly or continuously over time but instead remains stable around peaks of the GFP. Such quasistable microstates reflect the summation of concomitant neuronal activity across brain regions rather than the activity specific to any frequency band. Traditionally, prototypical EEG microstates are described by grouping EEG topographies at the local peaks of GFP according to their spatial similarity (Koenig et al., 2002; Lehmann et al., 1987). More recently, we have studied the quasistable EEG topographies at the sensor level by segregating prototypical microstates according to their temporal independence in lieu of their spatial dissimilarity (Yuan et al., 2012). In the present study, the concept of the microstate is further expanded by exploiting its spatial origins based on electrophysiological source estimates. Our current data showed that electrophysiological sources of temporal independent microstates are organized in several distinct networks and, for the first time, demonstrated that these large-scale networks are spatially similar to the patterns and temporally correlated to the dynamics of fMRI-RSNs. In contrast, similar organization of EEG networks was also reconstructed from continuous, whole-band EEG sources. Although the subtle difference between the networks obtained from EEG microstates and continuous data needs to be further validated, the observation that they resemble each other suggests that EEG-RSNs might be driven by synchronized neural activity at more discrete, burst-type temporal events, as discussed above. Relating to the studies on the EEG microstate (Koenig et al., 2002; Lehmann et al., 1987), one possible explanation for these putative neuronal events is that brain activity may be a shuffle of quickly evolving and independent processes. In such a framework, the microstates and RSNs may refer to the common building blocks of such processes. While microstates originate from the spatial consistency over fast-changing neural dynamics, RSNs emphasize the temporally coherent activity across different regions of the brain (Allen et al., 2014). This notion is supported by previous findings that EEG microstates in spontaneous activity have been associated with abstract thoughts arising as subjects rest in an awake state (Lehmann et al., 1998) and the potentially relevant neural substrates of mind wandering revealed by fMRI resting-state studies (Christoff et al., 2009; Mason et al., 2007). More importantly, the concept of microstate introduces new ways to dictate the dynamics of resting-state brain activity (Khanna et al., 2015). For example, the fast dynamics of microstates has been reported to have scale-free and self-familiar properties, which suggest that the instantaneous states at short intervals are critical for linking information across relatively long time ranges (Van de Ville et al., 2010). Furthermore, alterations in the temporal dynamics of EEG microstates, such as occurring duration and frequency, are evident in panic disorder (Kikuchi et al., 2011) and schizophrenia (Kindler et al., 2011) with the abnormalities in the latter condition being associated with auditory hallucinations (Kindler et al., 2011), which add to the growing body of evidence that the properties of RSNs are altered in a variety of brain disorders (Zhang and Raichle, 2010). While the relationship between microstate and RSN needs to be further studied and evaluated, the capability of investigating both in the source domain brings great potentials in studying the spatiotemporal dynamics of RSNs in individuals with various neuropsychiatric disorders using EEG alone or in combination with fMRI.
Conclusions
Our study investigated the neurophysiological basis of RSNs observed by functional MRI in the resting healthy human brain. Based on simultaneously acquired EEG- and BOLD-fMRI data, we show that large-scale brain RSNs are present and can be reconstructed from EEG data alone, which are of similar spatial patterns and correlated temporal dynamics to the networks independently derived from BOLD-fMRI data. Our investigation is innovative in the way that a number of brain networks at the resting state were recovered from EEG data alone and that the multimodal comparison was validated on two sets of networks independently derived from EEG and fMRI data. Our results for the first time demonstrated the electrophysiological representation of large-scale RSNs that are related in both the spatial and temporal domain to the RSNs previously discovered in BOLD-fMRI data. Findings establish a fundamental link between the spontaneous brain activity measured by EEG and fMRI and provide strong and unequivocal evidence for the neurophysiological basis of fMRI-RSNs.
Footnotes
Acknowledgments
This work was supported by the Laureate Institute for Brain Research, the William K. Warren Foundation, and, in part, by the Oklahoma Center for the Advancement of Science and Technology (HR09-125S to L.D.), the National Science Foundation (CAREER ECCS-0955260 to L.D.), and Federal Aviation Administration (DOT-FAA 10-G-008 to L.D.). The funding agencies were not involved in the design of the experiment, data collection and analysis, interpretation of results, and preparation and submission of the manuscript.
Authors Contributions
H.Y., L.D., and J.B. designed research; H.Y., V.Z., and R.P. collected data; L.D. and M.Z. contributed new reagents/analytic tools; H.Y., L.D., and M.Z. analyzed data; and H.Y., L.D., R.P., and J.B. wrote the article.
Author Disclosure Statement
No competing financial interests exist.
References
Supplementary Material
Please find the following supplemental material available below.
For Open Access articles published under a Creative Commons License, all supplemental material carries the same license as the article it is associated with.
For non-Open Access articles published, all supplemental material carries a non-exclusive license, and permission requests for re-use of supplemental material or any part of supplemental material shall be sent directly to the copyright owner as specified in the copyright notice associated with the article.