
Abstract
Node definition or delineating how the brain is parcellated into individual functionally related regions is the first step to accurately map the human connectome. As a result, parcellation of the human brain has drawn considerable attention in the field of neuroscience. The thalamus is known as a relay in the human brain, with its nuclei sending fibers to the cortical and subcortical regions. Functional magnetic resonance imaging techniques offer a way to parcellate the thalamus in vivo based on its connectivity properties. However, the parcellations from previous studies show that both the number and the distribution of thalamic subdivisions vary with different cortical segmentation methods. In this study, we used an unsupervised clustering method that does not rely on a priori information of the cortical segmentation to parcellate the thalamus. Instead, this approach is based on the intrinsic resting-state functional connectivity profiles of the thalamus with the whole brain. A series of cluster solutions were obtained, and an optimal solution was determined. Furthermore, the validity of our parcellation was investigated through the following: (1) identifying specific resting-state connectivity patterns of thalamic parcels with different brain networks and (2) investigating the task activation and psychophysiological interactions of specific thalamic clusters during 8-Hz flashing checkerboard stimulation with simultaneous finger tapping. Together, the current study provides a reliable parcellation of the thalamus and enhances our understating of thalamic. Furthermore, the current study provides a framework for parcellation that could be potentially extended to other subcortical and cortical regions.
Introduction
The human brain is a complex system with densely interconnected regions and mapping of this “human connectome” has become a major focus of neuroscience research (Fornito et al., 2013; Sporns, 2013; Wig et al., 2014b). The first crucial step to delineate the topological properties of the human brain is node definition or delineating how the brain is parcellated into individual subunits that can be assessed for functional or structural connections with each other (Fornito et al., 2013). As a result, more and more researchers have lent their attention to parcellation of the human brain, in both cortical and subcortical areas (Bzdok et al., 2013; Craddock et al., 2012; Kim et al., 2013; Shen et al., 2013; Wig et al., 2014a).
The thalamus acts as a gateway between subcortical areas and the cerebral cortex (Liang et al., 2013; Sherman and Guillery, 2002), with nearly all areas of the neocortex receiving afferents from the thalamus (Guillery and Sherman, 2002). Moreover, the thalamus plays an important role in regulating states of sleep and wakefulness (Steriade and Llinas, 1988), and thalamocortical connectivity is reported to be fundamental for the establishment of oscillatory brain waves (Jones, 2001). Dysfunction of the thalamus is implicated in the pathophysiology of neurological and neuropsychiatric disorders (Cauda et al., 2009; Welsh et al., 2010; Woodward et al., 2012). Based on its cytoarchitecture, the thalamus can be divided into several nuclei (Morel et al., 1997) that show distinct anatomical connectivity with different cortical and subcortical regions (Jones, 2007; Sherman and Guillery, 2002). In vivo parcellation of the thalamus into different subdivisions would provide locations of specific thalamic nuclei and, thus, be of great importance for understanding thalamic functioning and revealing thalamic involvement in the pathophysiology of brain disorders.
Magnetic resonance imaging (MRI) techniques are powerful methods for parcellating brain structures in vivo based on either anatomical or functional connectivity to provide insight beyond cytoarchitecture information. For example, there are a few reports that have used a diffusion tensor MRI-based fiber tractography technique (Basser et al., 1994) to parcellate the thalamus into subdivisions according to its anatomical connectivity with seven cortical areas (Behrens et al., 2003; Johansen-Berg et al., 2005; Mastropasqua et al., 2015). Those studies (Behrens et al., 2003; Johansen-Berg et al., 2005; Mastropasqua et al., 2015) were limited to the investigation of connections between the thalamus and large cortical regions. However, as noted by Behrens and colleagues (2003), the nonhuman primate literature provides support for a finer grained topographic mapping between subregions of, for example, the mediodorsal nucleus of the thalamus and smaller regions in the prefrontal cortex (Goldman–Rakic and Porrino, 1985; Kievit and Kuypers, 1977).
Furthermore, while the anatomical structure is thought to be the foundation of brain function, studies have found a discrepancy between anatomical and functional connectivity in the human brain (Honey et al., 2009, 2010). Thus, for functional MRI (fMRI) studies, it is equally essential to parcellate the brain based on its functional connectivity. Over the last decade, resting-state fMRI has emerged as a powerful tool for mapping the spontaneous or intrinsic functional connectivity of the human brain with high sensitivity in a completely noninvasive manner that is easy to implement (Biswal et al., 1995; Kim et al., 2013; Zhang et al., 2008, 2010; Zou et al., 2009). Kim and colleagues (2013) used an ICA-based approach to parcellate the thalamus and basal ganglia into several subdivisions, and Zhang et al. used seed-based resting-state fMRI to parcellate the thalamus into five subdivisions with a Winner-Take-All method to label each thalamic voxel (Zhang et al., 2008, 2010). The number of thalamic subdivisions in ICA-based approach is directly determined by the number of independent components. A different definition of independent components will result in varied thalamic parcellation results. By definition, the approach utilized by Zhang and colleagues is based on a priori knowledge of how the cerebral cortex is segmented. As a result, parcellation of the thalamus with different templates of cortical areas, for example, using the Automated Anatomical Labeling (AAL) template (Tzourio-Mazoyer et al., 2002) or the Brodmann Area template (Brodmann, 1909), will result in a different parcellation of thalamic nuclei, both in the number of parcels and in the spatial distribution of each parcel. Previous studies have shown that using functionally inaccurate region of interests (ROIs), for example, anatomically defined ROIs, for network analysis is extremely damaging to network estimation (Smith et al., 2011).
To obviate those mentioned issues, in the present study, a recently proposed approach for parcellating brain regions based on the similarity of their functional profiles with other regions of the brain (Craddock et al., 2012; Kahnt et al., 2012; Kelly et al., 2012; van den Heuvel et al., 2008) was adopted to parcellate the thalamus into different spatially continuous subdivisions without any spatial restrictions. An optimal solution of the number of thalamic subdivisions was obtained by evaluating the stability of diverse parcellation results. The validity of this approach was investigated by assessing the following: (1) specific functional connectivity fingerprints of the thalamic parcels with known brain networks and (2) brain activation and psychophysiological interactions (PPIs) of specific thalamic nuclei during a visuomotor task (8-Hz flashing checkerboard stimulation with simultaneous finger tapping). The visuomotor task allows us to examine the validity of our parcellation because it activates specific thalamic subdivisions (i.e., lateral dorsal and ventral posterior nuclei (Purushothaman et al., 2012; Stepniewska et al., 2007; Strick, 1976)) and it can be used to assess PPIs, which characterize direct connections between thalamic nuclei and other regions during task performance. For example, Purushothaman and colleagues found that the posterior part of thalamus, which sends fibers to primary visual areas, was involved in visual signal processing.
Materials and Methods
Data acquisition
Both resting-state fMRI and visuomotor task fMRI datasets were included in this study.
Resting-state fMRI dataset
Resting-state fMRI data that were acquired at the Beijing Normal University and have been made freely available on the website of the 1000 Functional Connectomes Project (
MR images from this dataset were acquired using a Siemens 3T Trio MRI scanner. Resting-state functional images were obtained using a T2*-weighted echo-planar imaging sequence with the following parameters: 33 axial slices, thickness/gap=3.0/0.6 mm, FOV=200×200 mm2 with in-plane matrix=64×64, TR/TE/θ=2000 ms/30 ms/90o, and scanning duration=7 min and 30 sec with 225 functional volumes. A high-resolution structural 3D MRI was acquired using a T1-weighted magnetization-prepared rapid gradient echo (MPRAGE) imaging sequence (spatial resolution=1×1×1.33 mm, TR/TE/θ=2530 ms/3.39 ms/7o, inversion time (TI)=1100 ms). During the resting-state scanning session, subjects were asked to keep their eyes closed, but not fall asleep.
Visuomotor task fMRI dataset
Visuomotor task data were acquired in eighteen healthy subjects (9 females/9 males; 22.8±1.8 years) at the Chinese Academy of Science. This study was approved by the Institutional Review Board of Chinese Academy of Science.
MR images of this dataset were also collected on a Siemens 3T Trio scanner. Task fMRI parameters of this dataset are as follows: 22 axial slices without gap, slice thickness=5 mm, FOV=220×220 mm2 with in-plane matrix=64×64, and TR/TE/θ=2500 ms/30 ms/90o. A high-resolution structural 3D MRI was acquired using a T1-weighted MPRAGE sequence (spatial resolution=1 mm3 isotropic, TR/TE/θ=2530 ms/3.39 ms/7o, TI=1100 ms). In the visuomotor task scans, a block design was used. It began with a 30-s off block and consisted of twelve cycles of alternated 20-s on and 20-s off blocks. During the on block, subjects were asked to view a screen with 8-Hz flashing checkerboard stimulation and tap their finger simultaneously.
Resting-state data processing
The resting-state fMRI were processed using SPM8 (
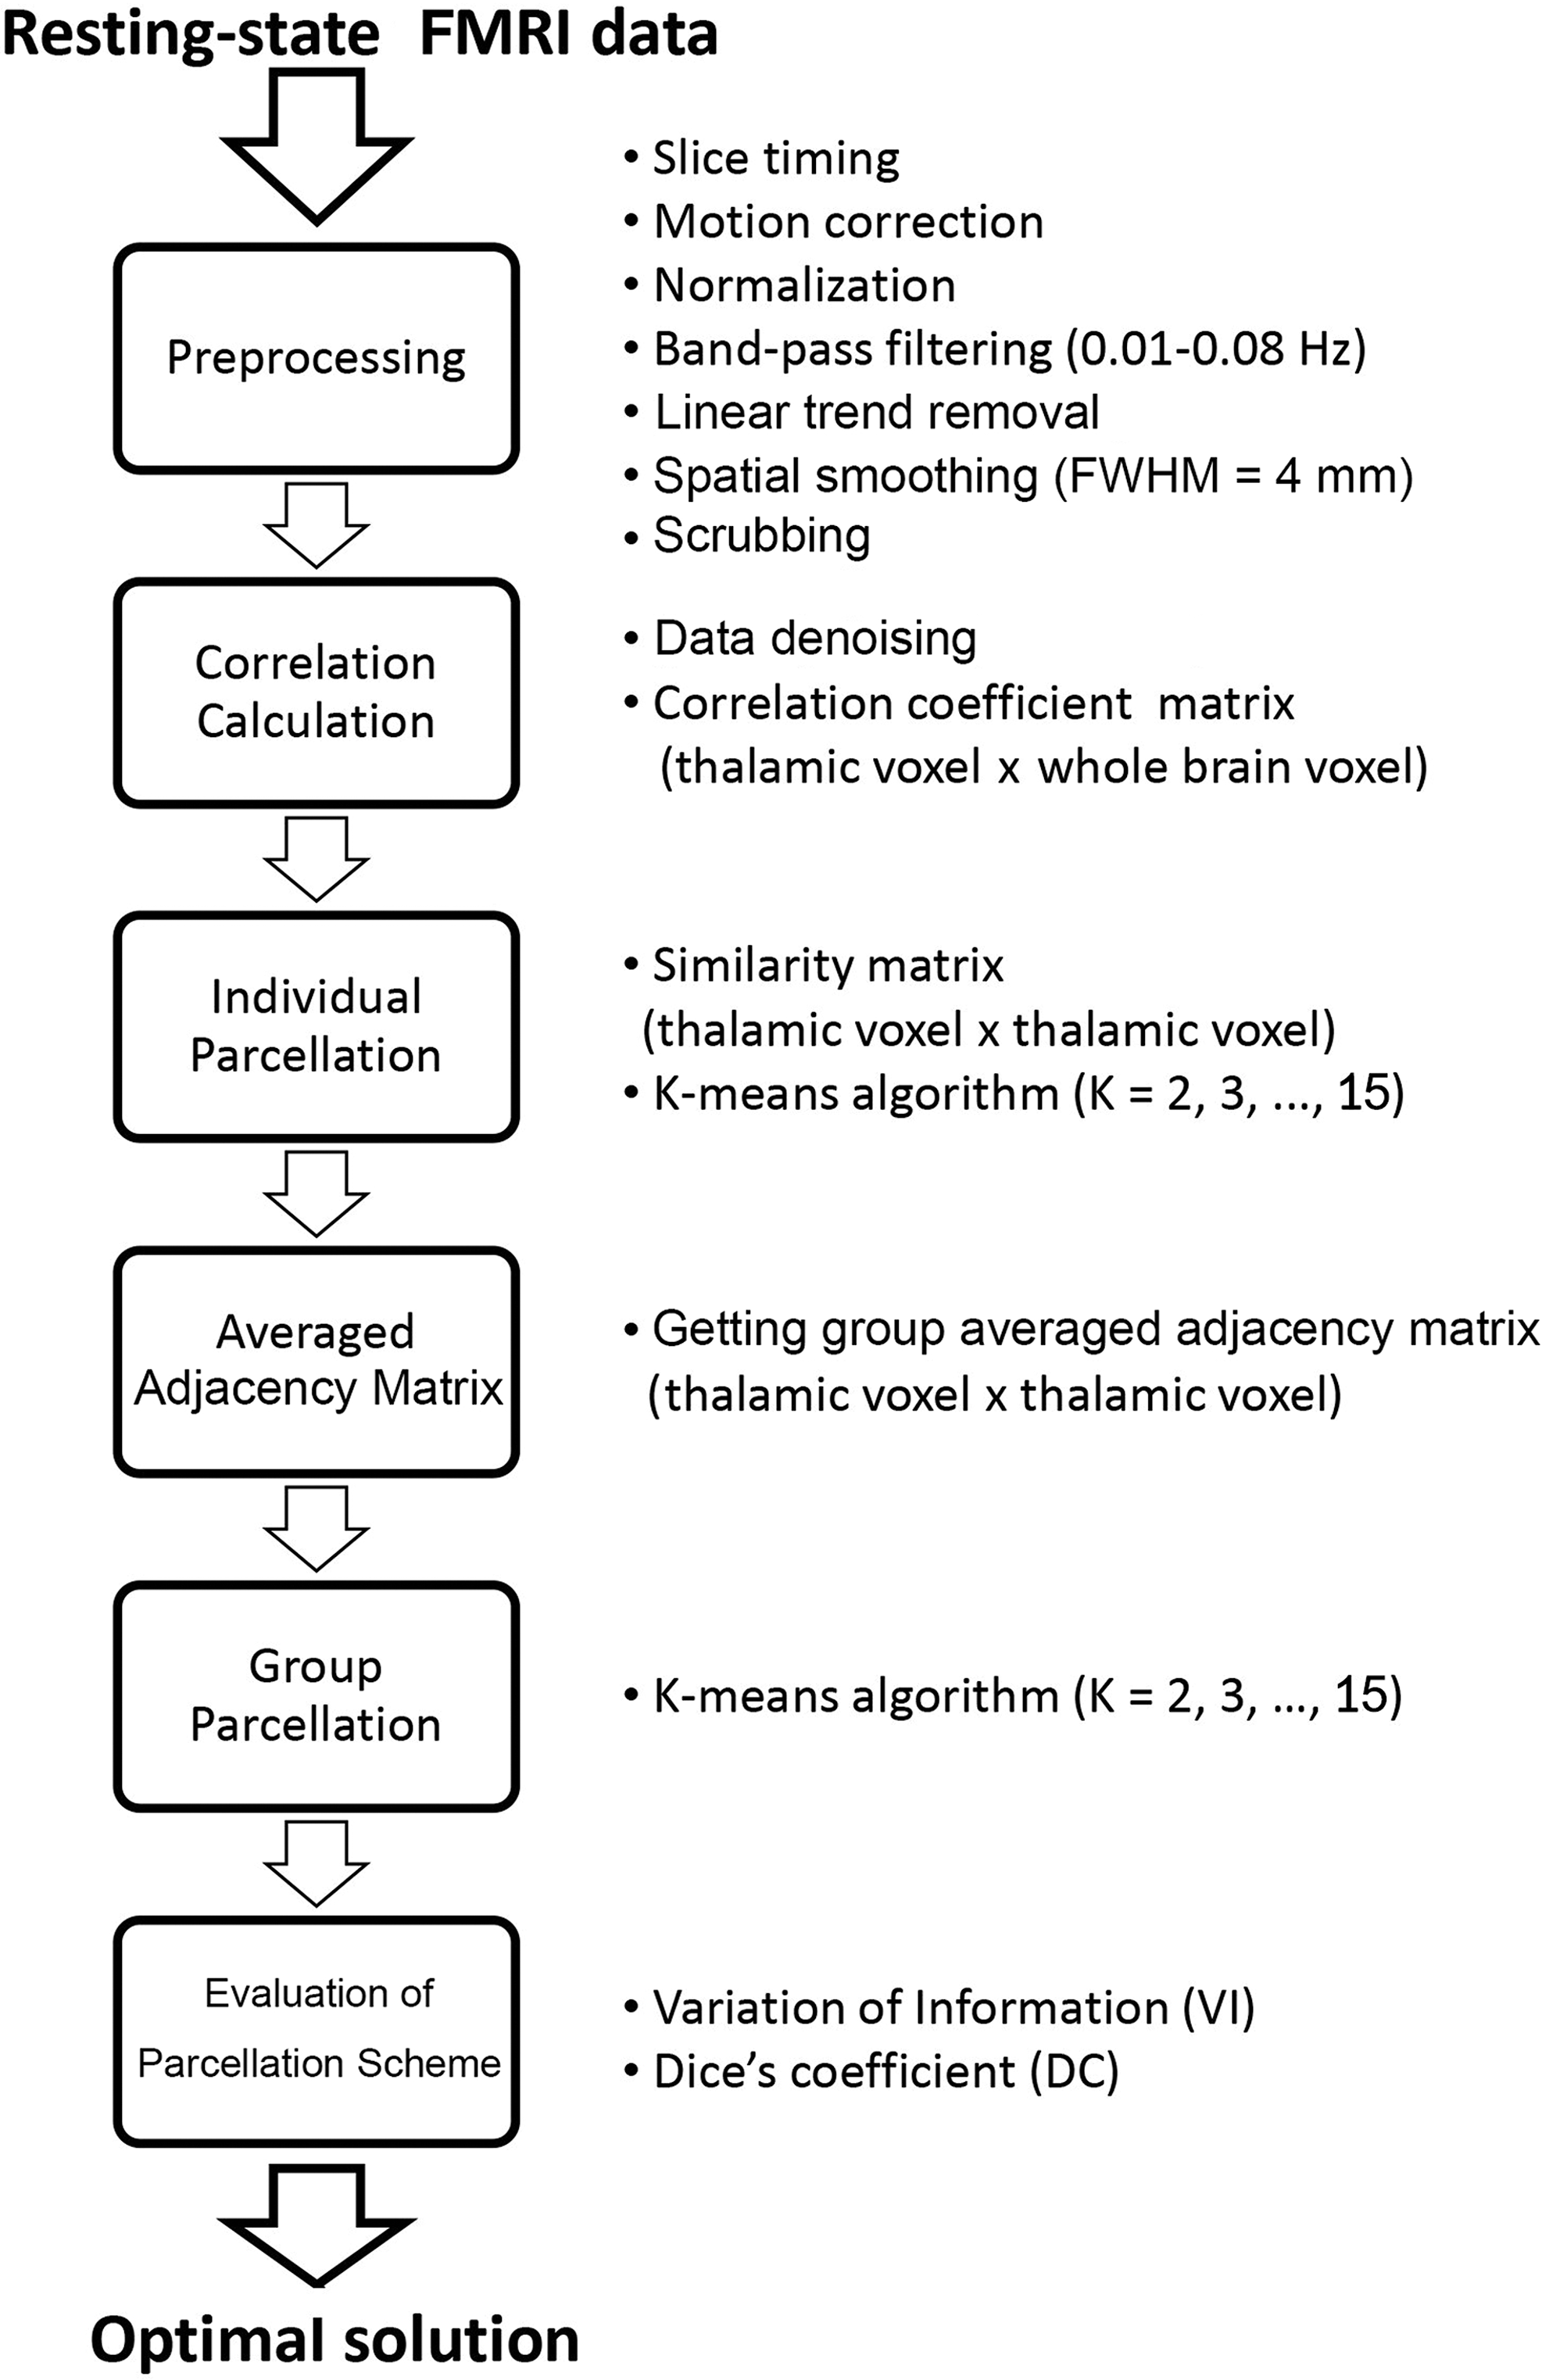
Flowchart. Procedures of resting-state functional MRI (fMRI) data analysis and thalamic parcellation.
To further reduce head motion effects, a temporal scrubbing method was applied to the preprocessed fMRI data with the threshold for framewise displacement (FD) set to 0.5 mm (Power et al., 2012). After the scrubbing procedure, most subjects (44/60) had no volumes scrubbed and the most volumes removed were 35 (in one subject). Scrubbing has been shown to improve functional connectivity maps, and in this study, this procedure will have minimal impact from slight differences in degrees of freedom from subject to subject (since most subjects did not have any volumes scrubbed and this is a single-group study). If the scrubbed data are less than 5 min, then exclude that data. In this study, no subjects are excluded in this procedure.
Resting-state functional connectivity-based parcellation
The first goal of this study was to segment the entire thalamus (both left and right parts together) into distinct subdivisions based on their resting-state functional connectivity patterns with the whole brain. The template of the thalamus was extracted from the AAL template (Tzourio-Mazoyer et al., 2002). The parcellation approach used here was modified from previous studies (Craddock et al., 2012; Kelly et al., 2012; van den Heuvel et al., 2008). A flow chart of parcellation procedure is shown in Figure 1. For each subject, functional connectivity between each thalamic voxel and every voxel of the whole brain was calculated (Fig. 1). Then, an individual similarity matrix was computed using Pearson's correlation coefficient to evaluate similarity between those spatial functional connectivity maps of each pair of thalamic voxels. A K-means clustering algorithm was applied to this similarity matrix to obtain individual thalamic parcellations, generating an individual adjacency matrix (Craddock et al., 2012). The group adjacency matrix was obtained by averaging all individual adjacency matrices. Then, the group adjacency matrix was input to the K-means clustering algorithm to obtain the group-level clustering result. For each clustering procedure (both single-subject and group levels), the number of clusters was chosen from 2 to 15.
Determination of the optimal solution
Since the cluster number, K, is a freely chosen parameter, we further assessed whether an optimal solution, that is, stable solution, existed. The variation of information (VI) index (Kahnt et al., 2012; Meilă, 2007) and Dice's coefficient (DC) (Craddock et al., 2012; Zhang et al., 2014b) were calculated here to assess the stability of parcellation procedure and determine an optimal solution. The computation of VI and DC is shown in Supplementary Materials (Supplementary Data are available online at
Functional connectivity fingerprints of thalamic subdivisions
To define the functional connectivity fingerprints of the estimated thalamic subdivisions from the optimal solution, we calculated the Pearson correlation coefficient between mean time courses of each thalamic subdivision and those of several common resting-state brain networks (Smith et al., 2009). Nine of ten functional networks were selected, including three visual networks, the default mode network, motor network, auditory network, executive control network, and left and right frontal–parietal networks (Supplementary Fig. S1). The tenth network reported by Smith and colleagues (2009), which covered the cerebellum, was not assessed in the current study because the fMRI data from resting-state fMRI dataset did not fully cover the cerebellum. The Pearson correlation coefficients were then transformed to Fisher Z-scores and then a series of one-sample t-tests were used to assess the statistical significance of each correlation. The statistical threshold was FWE corrected at p<0.05.
Specific functional response of the thalamic subdivisions to visuomotor task
For the task fMRI dataset, preprocessing steps were as follows: (1) slice timing; (2) head motion correction; (3) spatial normalization; (4) linear trend removal; and (5) spatial smoothing with 4 mm FWHM. For the first-level analyses, a general linear model (GLM) was constructed to detect task-based activation areas in each subject. Specifically, the block design convolved with a hemodynamic response function and six head motion parameters were used as predictors in the GLM. The spatial maps of regression coefficients for the block design predictor were used as contrast maps. Group activation maps were generated from a higher level GLM analysis implementing a one-sample t-test of the contrast maps from the first-level GLM. Whole-brain results were corrected for multiple tests to control for familywise error (FWE) using Monte Carlo simulations (FWE corrected at p<0.01, with uncorrected p<0.001 and minimum cluster size=270 mm3).
To investigate whether specific thalamic clusters responded during the visuomotor task, we averaged the raw regression coefficients in each cluster from the optimal solution. Then, a one-sample t-test of average activation amplitude (computed from raw regression coefficients) for each thalamic cluster was conducted across subjects with a significance threshold of p<0.05. To investigate the functional connectivity profiles of specific clusters during task performance, each thalamic cluster was used as a seed region to perform whole-brain voxelwise PPI analysis (Friston et al., 1997). As running in SPM, the centered block design convolved with the hemodynamics response function; the first eigenvalue of BOLD signals of given thalamic subdivisions and their interactions were used as regressors in PPI analysis. Only the element for beta value of interaction term was set to one in the contrast matrix. A series of two-tailed one-sample t-tests were then conducted to test for significance of previous results with a whole-brain multiple comparison correction based on Monte Carlo simulations (corrected p<0.01 with uncorrected p<0.001, and minimum cluster size was 270 mm3). In the case of a simple first-level GLM, the averaged activation amplitudes can be used to test hypotheses related to the simple question of “what regions in the brain have activity that is being modulated by the task?” In the case of PPI, the hypotheses being tested are asking the question “what regions of the brain show increased connectivity with the thalamic nucleus during the visuomotor stimulation itself (e.g., relative to the control condition)?” These are very different hypotheses that inform different aspects of thalamic nuclei behavior during visuomotor stimulation. Thus, a PPI analysis provides strong evidence for testing our parcellation scheme, as direct connections of thalamic nuclei with visual and motor regions should be separately disentangled (whereas the GLM activation results will just show nuclei involved in task response, but not their direct connections during the task).
Results
Thalamus parcellation results
Parcellation results with different cluster solutions obtained from the resting-state data are shown in Figure 2. The K=2 cluster solution revealed two spatially symmetric subdivisions of the thalamus. The larger cluster (Cluster 1) stretched from the ventral anterior part to the medial and almost covered the complete dorsal part of the thalamus. The other cluster (Cluster 2) covered only the ventral posterior and ventral lateral part of the thalamus. Interestingly, the two subdivisions appeared in both the left and right hemispheres and showed excellent symmetry. As we parcellated the entire thalamus together, the symmetric results indicated that the parcellation was dependent on the functional connectivity profiles and not constrained by the distance relationship (Mars et al., 2012; Tomassini et al., 2007). Compared with the K=2 cluster solution, Cluster 3 from the K=3 solution mostly stemmed from Cluster 2 (the ventral posterior cluster) of the K=2 solution. Cluster 4 from the K=4 solution was spilt from the medial cluster from K=3 and it covered the posterior part of the medial thalamus. Cluster solutions with K=5 to K=8 resulted in further splitting of these clusters into subdivisions to show a clear hierarchical structure of the parcellations. As it is shown in Figure 2, Cluster 9 from the K=9 solution was lateralized to the left part of the thalamus. Similarly, when K>9, one or more clusters were lateralized to a single hemisphere, thus those results are not shown here.
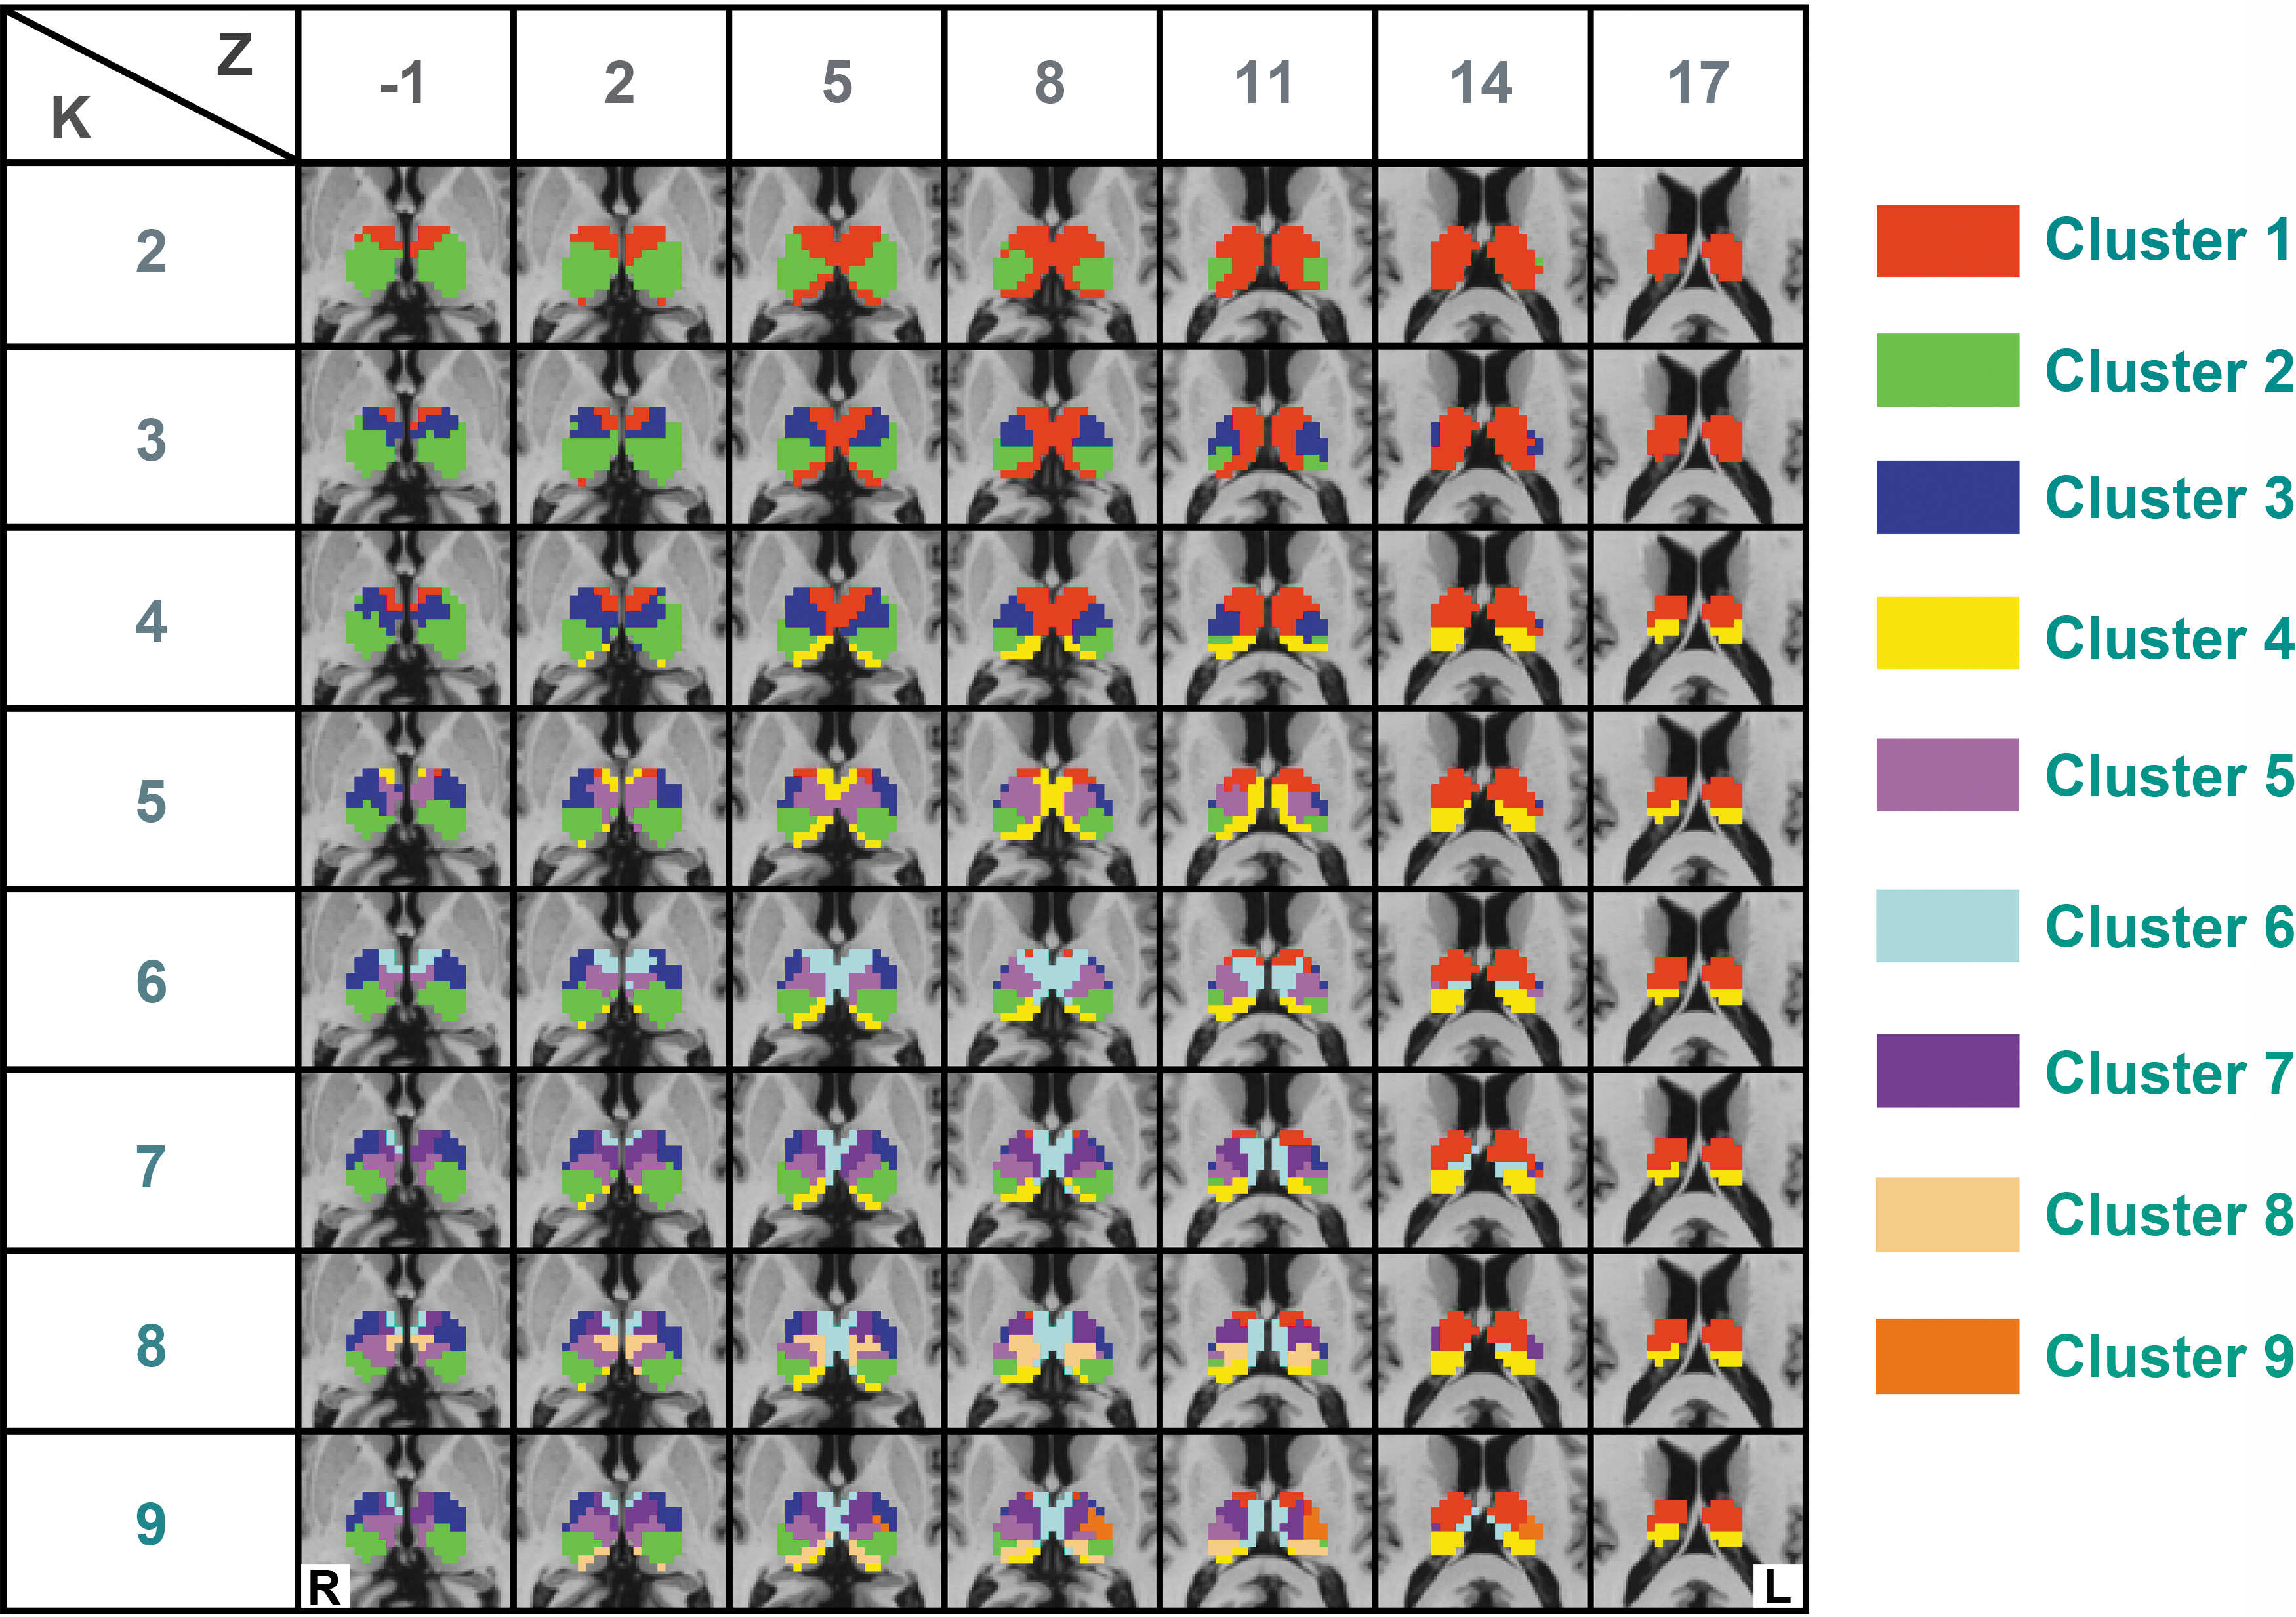
The resting-state functional connectivity-based thalamic parcellation. Resting-state functional connectivity-based parcellation of the thalamus with different cluster solutions (K=2, 3…9). Seven slices (Z values from −1 mm to 17 mm, slice thickness: 3 mm) covering the entire thalamus are shown. Different colors represent different thalamic subdivisions from the parcellation. L and R denote the left and right hemispheres, respectively. Color images available online at
Determination of the optimal cluster solution
To determine the optimal solution, a split-half procedure with 100 randomly generated split-half groups was used and VI and DC values were computed (Fig. 3) to assess the stability of the parcellation and the similarity between the adjacency matrices calculated for each group in the split-half procedure. VI increased as a function of K, indicating that the stability decreased as K increased (Fig. 3A). After performing a series of paired t-test statistics, VI was found to be significantly different with K (p<0.001), except for K=7. VI indices for the K=6 and K=7 parcellation were statistically undistinguishable (p=0.988), moreover, the parcellation with K=7 corresponded to a local maximum of the DC values (Fig. 3B); thus, K=7 was selected as the optimal solution.
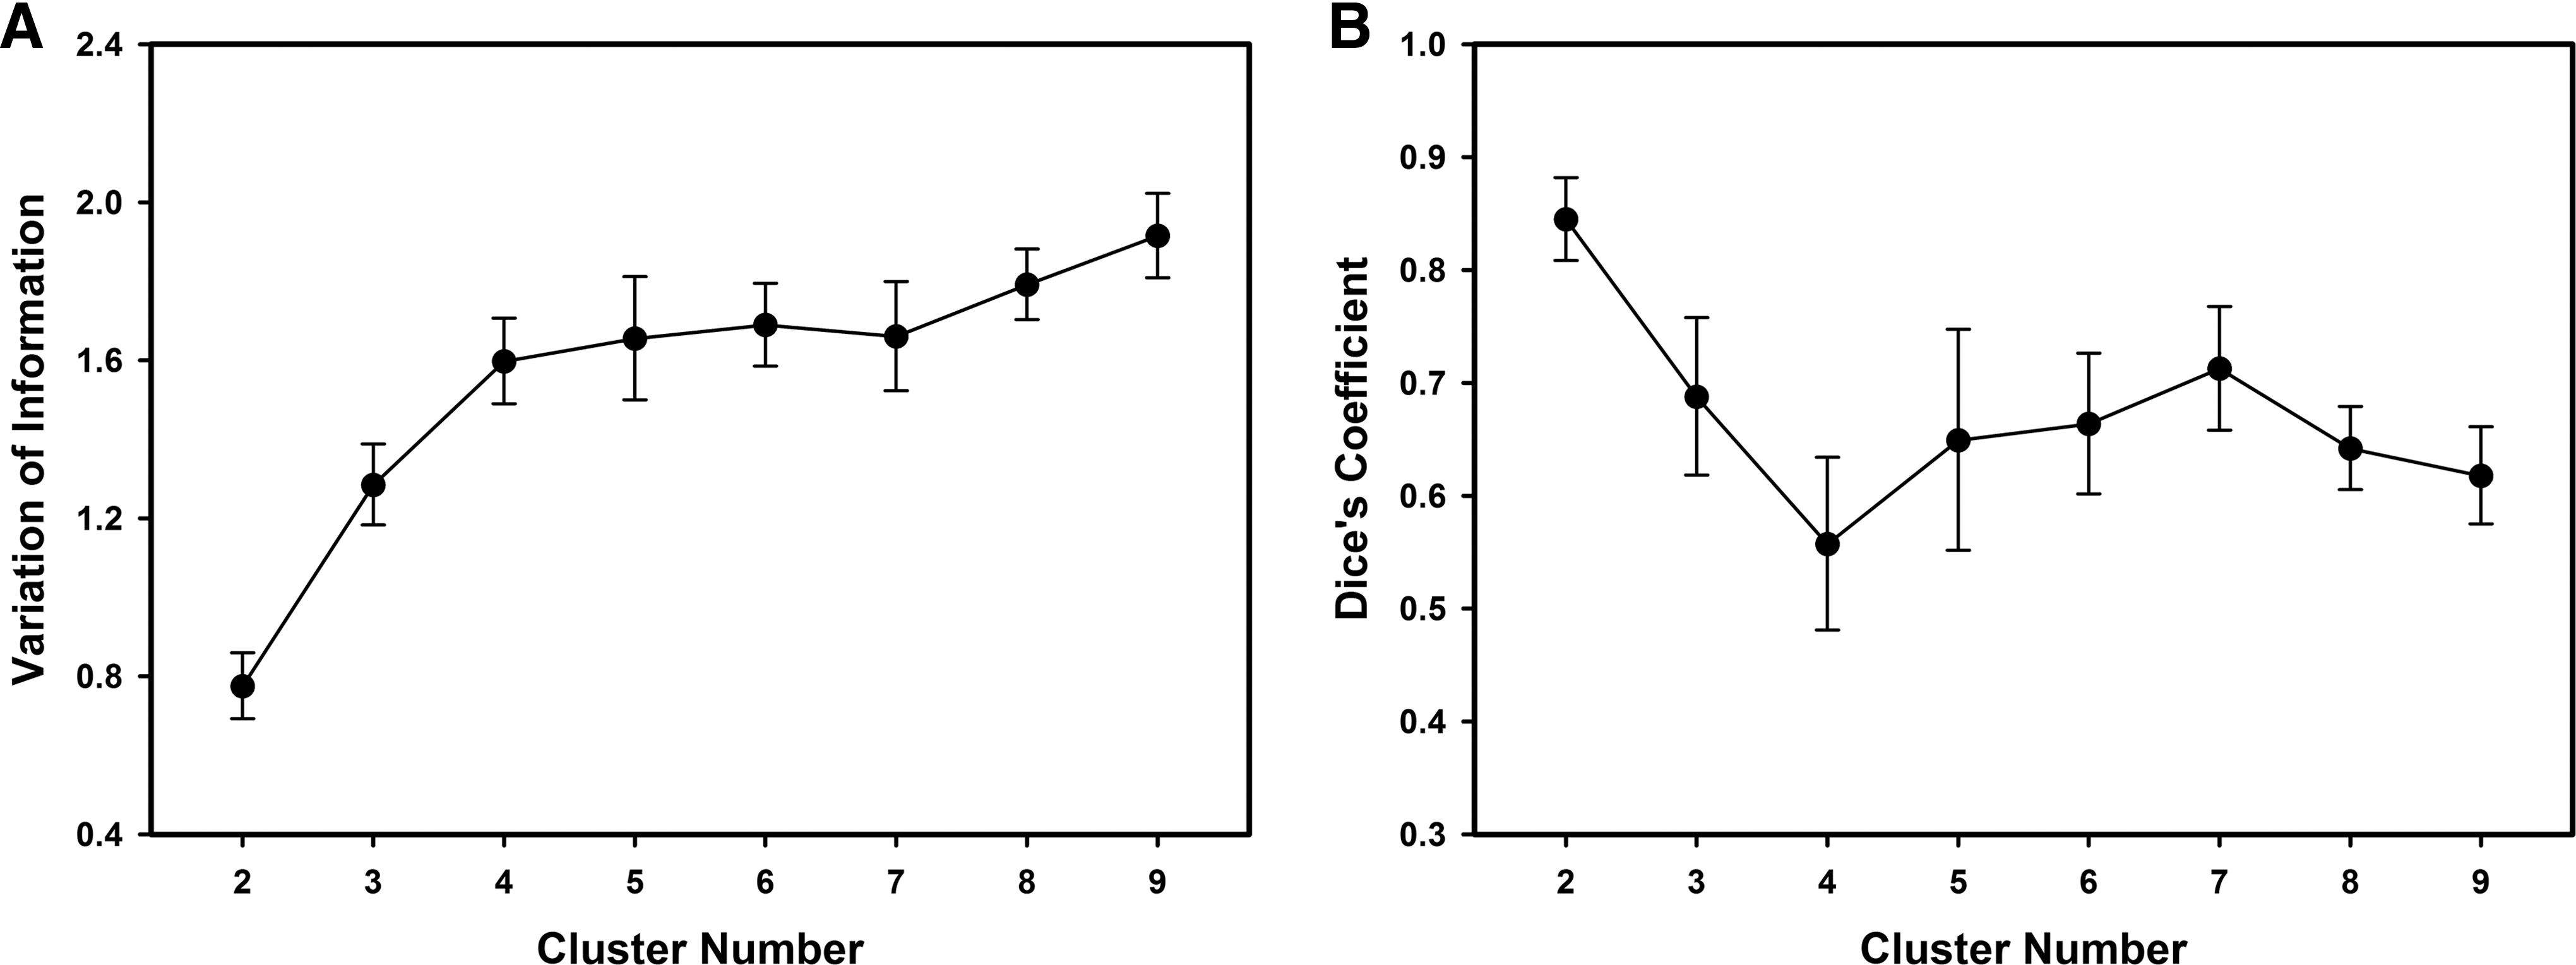
VI and DC values for each cluster solution (K).
Functional connectivity fingerprints between the thalamic parcellation and resting-state brain networks
The functional connectivity fingerprints of the thalamic subdivisions from the optimal thalamic parcellation (K=7) are shown in Figure 4, and the connectivity strength computed as values of the group averaged correlation coefficients between mean time courses of each thalamic subdivision and each resting-state brain network is listed in Table 1. It can be seen that different subdivisions of the thalamus showed distinct functional connectivity fingerprints. Table 1 shows that all statistically significant connections are positive. Cluster 1 was significantly correlated with default mode network, motor network, auditory network, executive control network, and bilateral frontal–parietal networks (Fig. 4). Cluster 2 demonstrated significant functional connectivity with all networks, except for bilateral frontal–parietal networks. Among these connections, the one with the motor network has the greatest connectivity strength (r=0.341). Cluster 3 showed significant but weak correlations with motor, auditory, and executive control networks. Cluster 4 and Cluster 6, which are almost the same cluster in the K=5 solution, showed a similar connectivity fingerprint, with very significant connections with the default mode network and executive control network. Cluster 5 and Cluster 7, although with distinct connectivity patterns, showed significant connectivity with almost all networks except for occipital pole visual and lateral visual networks.
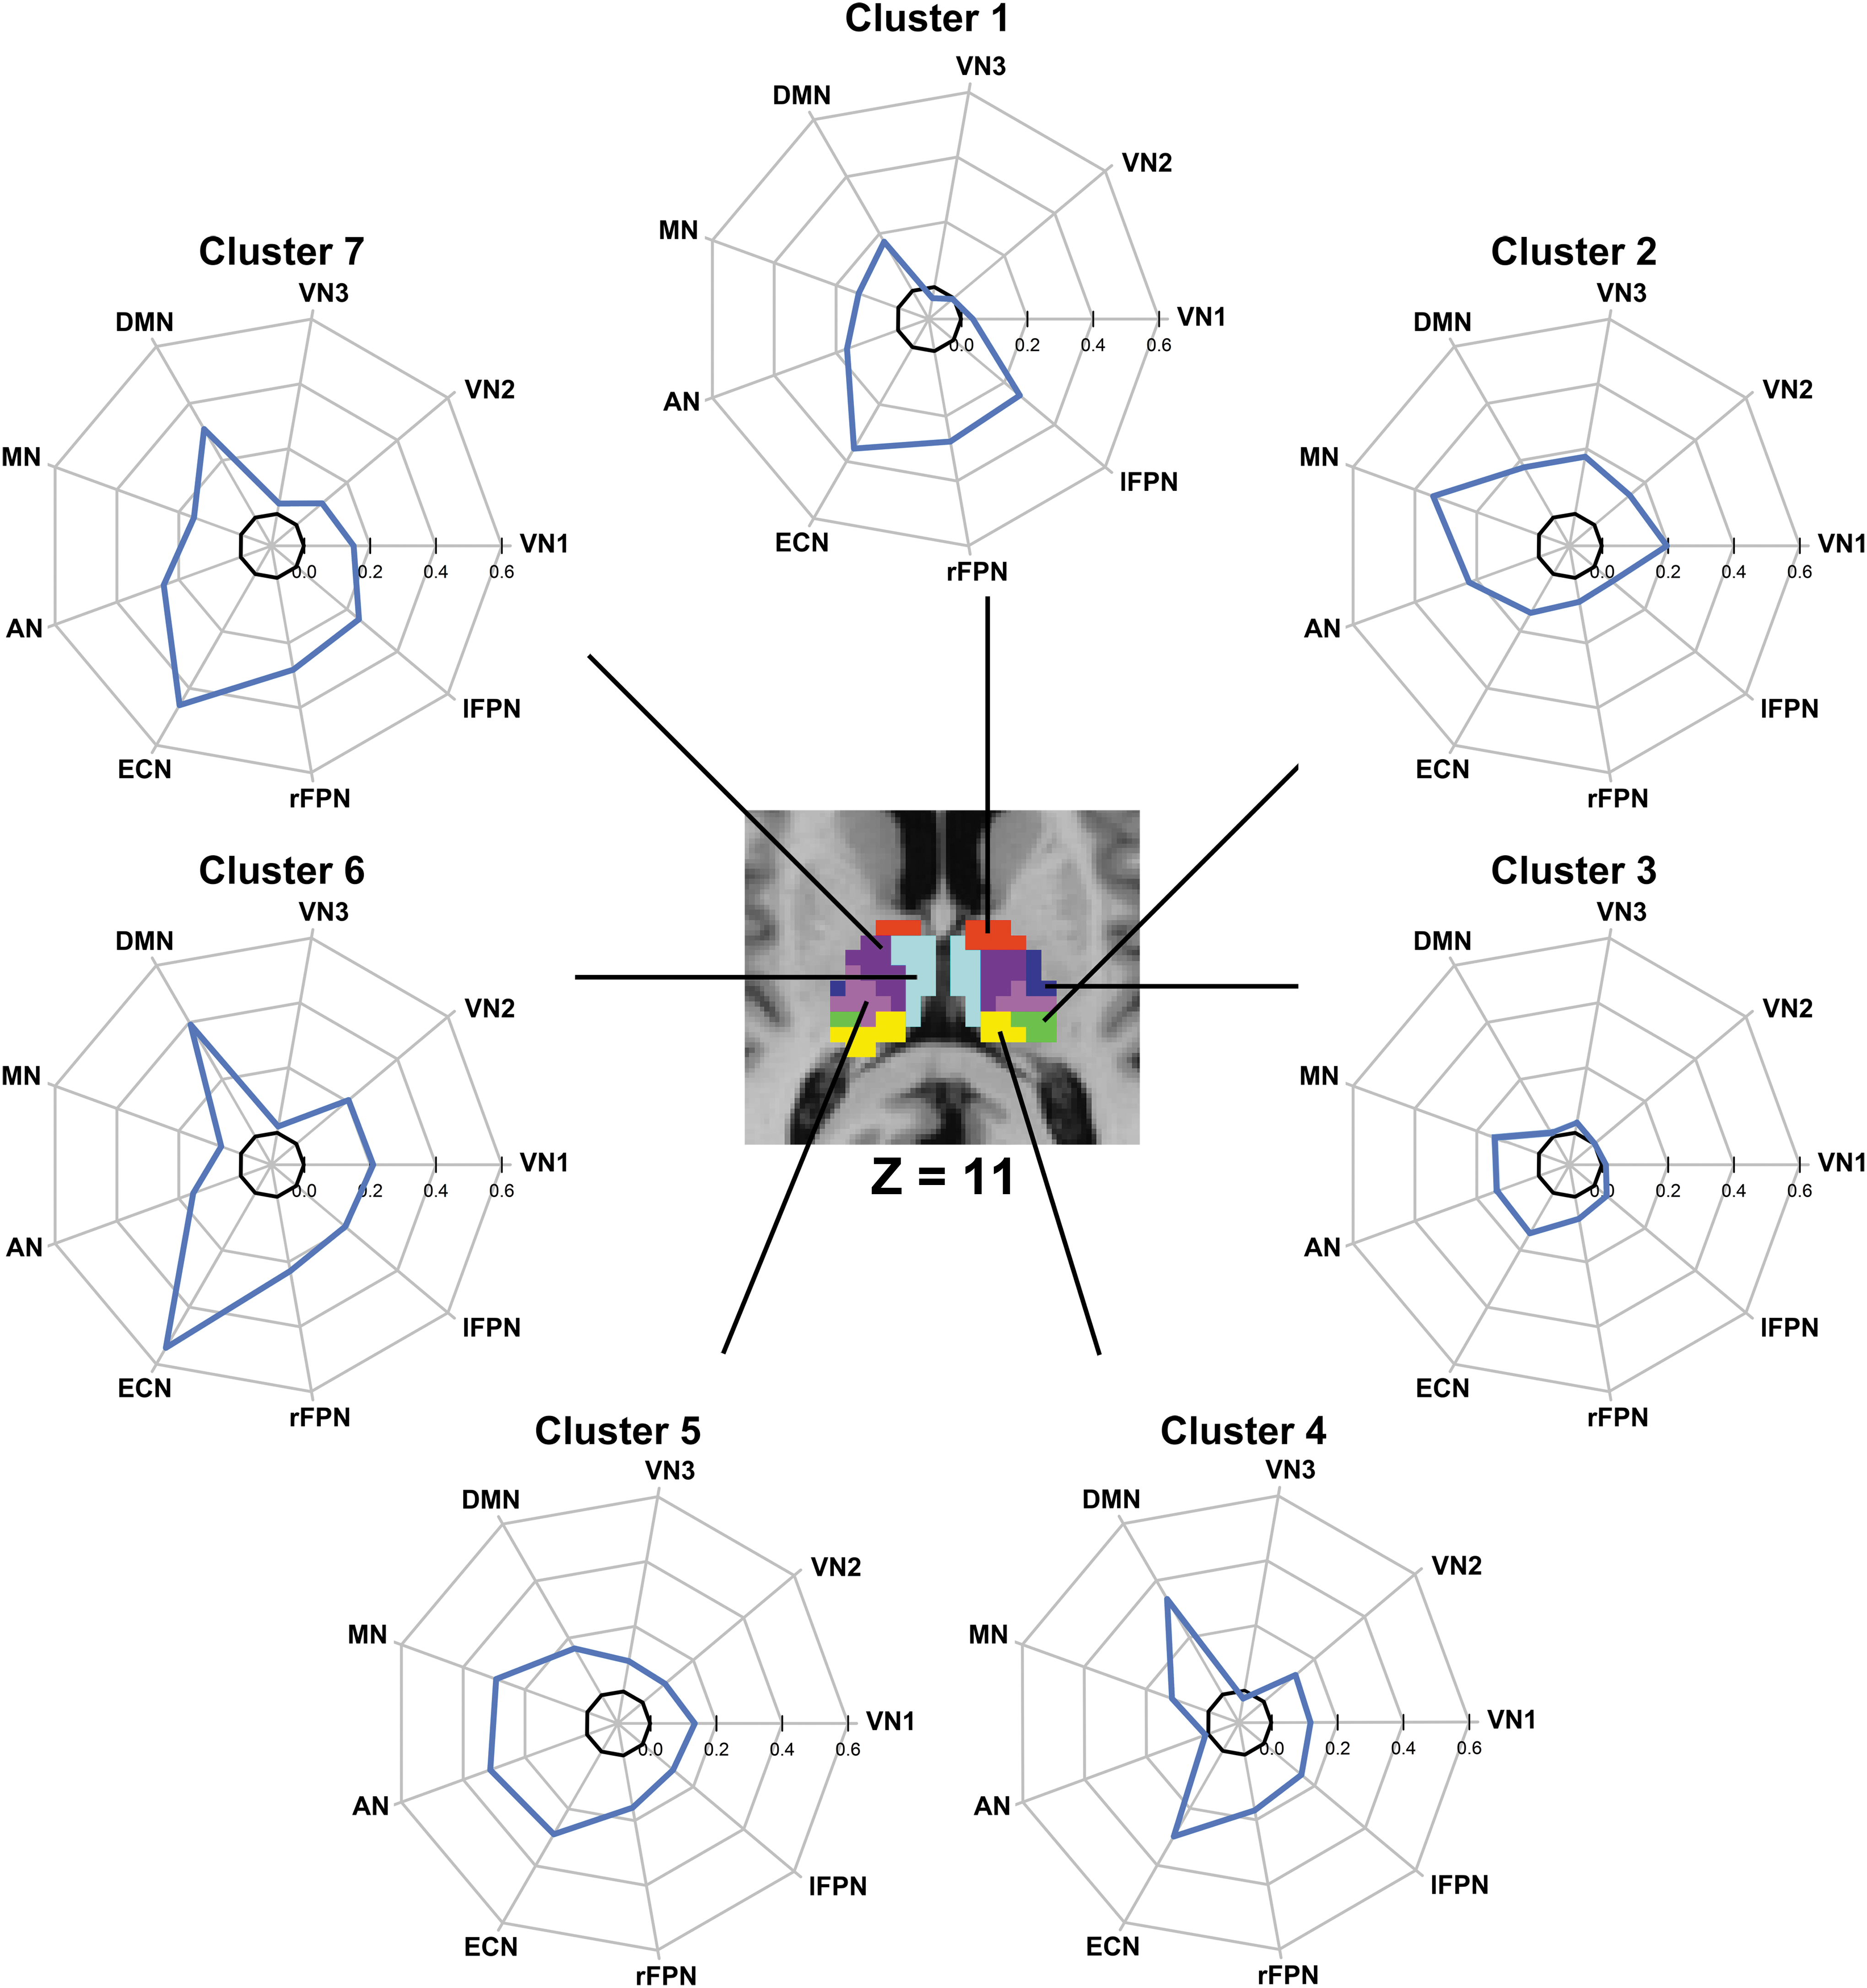
Functional fingerprints of thalamic subdivisions from the optimal solution (K=7). Fingerprints of Clusters 1–7 from K=7 solution. Each value of connectivity strength in fingerprint is the group averaged correlation coefficient between mean time course of each thalamic subdivision and each functional network. The MNI axial slice for the overlay corresponds to Z=11 mm. VN1, medial visual network; VN2, occipital pole visual network; VN3, lateral visual network; DMN, default mode network; MN, motor network; AN, auditory network; ECN, executive control network; rFPN, right frontal–parietal network; lFPN, left frontal–parietal network. Color images available online at
Mean Functional Connectivity Strength Between Thalamic Subdivisions and Brain Networks
Thalamic subdivisions are those from the optimal solution (K=7) using the resting-state fMRI data. Functional connectivity values in bold indicate statistically significant connectivity across subjects (corrected p<0.05).
VN1, medial visual network; VN2, occipital pole visual network; VN3, lateral visual network; DMN, default mode network; MN, motor network; AN, auditory network; ECN, executive control network; rFPN, right frontal–parietal network; lFPN, left frontal–parietal network.
Activations and PPI of the thalamic subdivisions during the visuomotor task
Visuomotor task activation of thalamic regions is shown in Figure 5A. The activated regions are located mainly in the bilateral ventral posterior part and left ventral lateral part of the thalamus, which overlap primarily with Cluster 2, Cluster 3, and Cluster 5 for the K=7 solution. The percentage overlap between visuomotor activated regions and the thalamic subdivisions is listed in Table 2. The activation amplitude of each thalamic cluster is shown in Figure 5B. Clusters 2, 3, and 5 showed statistically significant responses to visuomotor stimulation.

Response of specific thalamic clusters from the optimal solution (K=7) to visuomotor stimulation.
Percentage Overlap Between Thalamic Subdivisions and Visuomotor Task Activations
Thalamic subdivisions are those from K=7 parcellation using the resting-state fMRI data (with global signal regression).
PPIs during the visuomotor task condition relative to baseline were investigated between every subdivision of the optimal solution (K=7) and the whole brain. Only clusters (Cluster 2, Cluster 3, and Cluster 5) activated by the visuomotor task showed significant negative PPIs with the visual cortex or/and motor cortex (Fig. 5C). Clusters 2 and 5 showed negative PPIs with visual and motor cortices, while Cluster 3 only showed a negative PPI with the visual cortex. There were no significant positive PPIs of thalamic subdivisions with other regions of the brain.
Discussion
In the present study, we parcellated the thalamus into different subdivisions using an unsupervised approach based on their resting-state functional connectivity profiles with the whole brain. The validity of our thalamic parcellation approach was tested by assessing the following: (1) the functional connectivity fingerprints of our thalamic parcels with known brain networks and (2) the thalamic responses and PPIs with visual and motor regions during visuomotor stimulation.
Connectivity-based parcellation of the thalamus
Behrens and colleagues proposed a novel method to parcellate the thalamus based on its anatomical connectivity with a priori segmented cortical areas (Behrens et al., 2003; Johansen-Berg et al., 2005; Mastropasqua et al., 2015). Depending on the number of cortical regions used for the parcellation, they obtained different parcellation results, that is, parcellation of the thalamus into five or seven subdivisions. In the human brain, the anatomical structure is assumed to be the foundation of its function. With equal importance, the underlying anatomical structure is continually modulated by function in relation to experience (Damoiseaux and Greicius, 2009; Zhang et al., 2010). It is commonly assumed that functional connectivity between brain regions reflects the anatomical connectivity between them (Damoiseaux and Greicius, 2009; Honey et al., 2009, 2010). However, the relationship between functional and structural connectivity appears not be so straightforward. Studies have shown that the strength of functional and structural connectivity is positively correlated when structural connectivity is present; functional connectivity is also observed between brain regions without structural connectivity (Honey et al., 2009). Thus, a thalamic parcellation based on functional connectivity properties is needed for functional MRI studies.
To that end, a few studies have defined thalamic subdivisions based on functional connectivity with a template of brain cortical regions (Zhang et al., 2008, 2010). Kim and colleagues (2013) proposed a multilevel independent component analysis (ICA) technique to parcellate the thalamus and basal ganglia. However, ICA has some intrinsic methodological limitations (Hyvarinen, 2011), specifically, ICA-based schemes will depend on the choice of dimensionality of the ICA. In the current study, we adopted a technique based on the intrinsic functional connectivity profiles of thalamus. Compared to previous seed-based connectivity parcellation methods, it does not rely on a priori definition of cortical areas. Compared to ICA-based techniques, our approach is more hypothesis driven in the sense of the determination of number of nuclei. Moreover, the ICA will separate out the connectivity of each parcel into different components according to the networks they belong to. This makes interpretation a little trickier as one has to worry about mixing in many different components. However, the seed-based connectivity approach, as what we do, can assess the whole connectivity profile of each parcel. Thus, the results of the proposed methods are perhaps easier to interpret.
Resting-state functional connectivity with specific brain networks
Distinct and anatomically relevant functional connectivity fingerprints of each subdivision with brain networks provided evidence for the validity of our parcellation approach. For instance, the Cluster 6 mainly overlapped with the mediodorsal part of the thalamus. Significant functional connectivity was observed between this subdivision and the executive control and default mode networks (Fig. 4). Previous studies have shown that the mediodorsal nucleus anatomically projects to the prefrontal cortex and posterior cingulate cortex (Jones, 2007), which are key regions in the executive control network and the default mode network, respectively. Thus, our findings suggest a close correspondence between the functional and anatomical connectivity of Cluster 6. Notably, Clusters 2 and 3 are primarily located in the ventral lateral and ventral posterior parts of the thalamus, which sends fibers to motor and sensory cortices. Figure 4 shows that these subdivisions correlated with the motor network. Moreover, Cluster 4 mainly overlapped with the medial part of the pulvinar nucleus. This part of thalamus is anatomically connected with the prefrontal cortex, cingulate cortex, and visual and auditory cortices (Jones, 2007). Thus, the significant functional connectivity observed between Cluster 4 and these cortical areas (Fig. 4 and Table 1) is consistent with the known anatomical connections of the pulvinar.
Response of specific thalamic clusters to visuomotor stimulation
Visuomotor task activation
Activity of the thalamic clusters from the K=7 parcellation showed responses in certain clusters to visuomotor stimulation that are consistent with previous reports of visuomotor task activation (Calhoun et al., 2001; Miao et al., 2014; Witt et al., 2008), providing validity of our thalamic parcellation results. Specifically, Clusters 2, 3, and 5 were activated during the visuomotor task. Cluster 2 primarily comprised the posterior lateral part of the thalamus, a region that has been shown to project to both primary and higher order visual areas and to contribute to visual perception and attention (Fischer and Whitney, 2012; Purushothaman et al., 2012). The ventral lateral and ventral posterior parts of the thalamus, which were in Cluster 3 and Cluster 5, relay somatosensory and motor information to and among the brain (Morel et al., 1997; Stepniewska et al., 2007; Strick, 1976) and these regions were activated during the finger-tapping task when the flashing checkerboard stimulation was on.
PPI during the visuomotor task
Interestingly, only those thalamic clusters, which were activated by the visuomotor task, showed a significant PPI with visual and motor cortices. However, the PPI analysis revealed that in fact Clusters 2, 3, and 5 showed strong negative connectivity with visual and/or motor cortices. Although this may seem counterintuitive, theoretically, it can be explained. The statistical model used to detect brain activation (which is a GLM with a predictor that corresponds to the task plus any nuisance predictors) detects regions with increased or decreased BOLD signal responses to a given task (e.g., a main effect of the task), while a PPI analysis, which is also a GLM, but includes a ROI time course and an interaction regressor, investigates the interaction between the seed ROI and other regions of the brain during task performance. In other words, the PPI helps distinguish whether two regions activated by a task become more strongly functionally connected during task performance (e.g., have a stronger positive or negative correlation) or whether the regions act independently with both becoming more active during the task. Several previous studies have reported negative PPIs of thalamus with other brain regions during task performance. For example, Chang and colleagues (2011) reported a negative PPI between the ventral lateral thalamus and primary auditory cortex during a speech production task, and Zhang and colleagues (2014a) reported a negative PPI between the thalamus and medial prefrontal cortex during a stop signal task. Second, a recent animal electrophysiology study found that the increases in the thalamic action potential firing rate during sensory stimulation correlated with decreases in the amplitude of low-frequency local field potential (LFP) fluctuations of neurons from the barrel cortex (Poulet et al., 2012). BOLD fMRI signals are closely related to LFP signals (Logothetis et al., 2001), therefore an increase in thalamic action potential firing leading to a decrease in the amplitude of the LFP could be one possible mechanism for the strong negative PPIs we observed between these two regions during visuomotor stimulation, although clearly this is speculative. Thus, the presence of a strong PPI effect between those activated clusters and visual and motor cortices provides further evidence to the validity of our parcellation scheme. For example, it is consistent that thalamic nuclei would interact with visual and motor cortices during a visuomotor task. Our findings reveal that this occurs through negative PPIs with the thalamic nuclei, which sheds insight into mechanisms underlying thalamocortical interactions. Future work to understand the exact processes giving rise to these negative PPIs is warranted.
Limitations
There are potential limitations of our parcellation procedure that should be considered. First, the parcellation results were performed on group-averaged data. More work is needed to obtain stable individual parcellation results. Second, considering the convergence and divergence between functional connectivity and structural connectivity (Buckner et al., 2008; Honey et al., 2010), a multimodal diffusion-based anatomical scan (e.g., diffusion spectrum imaging) to assess structural connectivity combined with functional connectivity measurements would shed great light on the correspondence between structural and functional connectivity and perhaps result in a more robust thalamic parcellation. Third, improvements in the signal to noise ratio and spatial resolution would result in a parcellation of the thalamus with higher precision. Fourth, considering that thalamus is surrounded by the ventricular system, spatial smoothing might be a potential source of contamination of thalamic signals. In this study, to minimize the effect of smoothing, a 4-mm FWHM smooth kernel was used, with a 3 mm voxel size of normalized functional images. In addition, the seed-based functional connectivity analysis method has intrinsic shortcomings. For example, it is less sensitive in detecting interindividual variability than ICA-based analyses (Smith et al., 2014) and one must contend with the global signal regression problem. In this study, we used the aCompCor approach for removing physiological noise signals that contribute to global signals and, thus, obviated the issue of GSR.
Conclusion
In the current study, we used an unsupervised clustering approach to parcellate the thalamus based on resting-state functional connectivity profiles. Our optimal thalamic parcellation scheme resulting in five symmetric thalamic clusters was validated by assessing the distinct fingerprints of functional connectivity profiles of the resulting thalamic clusters with brain networks and by assessing the thalamic responses and PPIs during a visuomotor task.
Footnotes
Acknowledgments
This work was supported by China's National Strategic Basic Research Program (973) (2012CB720700 and 2015CB856400) and the Natural Science Foundation of China (81227003, 81430037, 31421003, 31200761, and 81201142).
Author Disclosure Statement
No competing financial interests exist.
References
Supplementary Material
Please find the following supplemental material available below.
For Open Access articles published under a Creative Commons License, all supplemental material carries the same license as the article it is associated with.
For non-Open Access articles published, all supplemental material carries a non-exclusive license, and permission requests for re-use of supplemental material or any part of supplemental material shall be sent directly to the copyright owner as specified in the copyright notice associated with the article.