
Abstract
Visual search is an important skill in navigating and locating objects (a target) among distractors in our environment. Efficient and faster target detection involves reciprocal interaction between a viewer's attentional resources as well as salient target characteristics. The neural correlates of visual search have been extensively investigated over the last decades, suggesting the involvement of a frontal–parietal network comprising the frontal eye fields (FEFs) and intraparietal sulcus (IPS). In addition, activity and connectivity of these network changes as the visual search become complex and more demanding. The current functional magnetic resonance imaging study examined the modulation of the frontal–parietal network in response to cognitive demand in 22 healthy adult participants. In addition to brain activity, changes in functional connectivity and effective connectivity in this network were examined in response to easy and difficult visual search. Results revealed significantly increased activation in FEF, IPS, and supplementary motor area, more so in difficult search than in easy search. Functional and effective connectivity analyses showed enhanced connectivity in the frontal–parietal network during difficult search and enhanced information transfer from left to right hemisphere during the difficult search process. Our overall findings suggest that cognitive demand significantly increases brain resources across all three measures of brain processing. In sum, we found that goal-directed visual search engages a network of frontal–parietal areas that are modulated in relation to cognitive demand.
Introduction
Visual search, the ability to locate a target among a complex array of stimuli, is one of the most widely studied topics in human attention and perception research (Eckstein, 2011; Nakayama and Martini, 2011). Visual search is a real-world task that people engage in their day-to-day life (e.g., searching for a friend in a crowded place, looking for a certain product in a supermarket, or when playing games such as Where is Waldo). Actively scanning the environment in search of a particular object (the target) among other objects (the distractors) that differ in their visual features is central to visual search. In laboratory experiments on visual target detection, each display contains multiple items and serves to categorically judge the presence or absence of the target. The search process is easy if the target stands out from the distractors, such as in feature search; however, the search is difficult when the distractors are more in number and are similar to the target, such as in conjunction search. Thus, the difficulty level of visual search tasks is influenced by two factors: the number of items within the array (set size) and target–distractor or distractor–distractor similarity.
Theoretical accounts of visual search hold that top-down preparation and attention are important components of efficient target detection (Duncan and Humphreys, 1989; Wolfe et al., 1989). Feature search requires bottom-up sensory-driven processing, in which salient target characteristics make the target stand out, helping in easier and quicker location, regardless of the number of distractors (e.g., 10 vs. 40). On the other hand, visual search requires top-down conceptually driven processing, in which the effect of salience is absent, requiring the individual to break down the search into smaller segments, making it more difficult with a relatively longer reaction time (Treisman and Gelade, 1980; Wolfe, 1994). In visual search, reaction time tends to increase with the number of items displayed, suggesting a serial search process that requires focused attention (Arguin et al., 1993).
Human neuroimaging studies have revealed a frontal–parietal network consisting of the frontal eye fields (FEFs), the intraparietal sulcus (IPS), and to some extent the supplementary motor area (SMA) as responsible for top-down representation and selection of spatial location in visual search (Fairhall et al., 2009; Yantis et al., 2002). On the other hand, the visual cortex has been associated with bottom-up sensory-driven mechanisms of visual attention (Kastner and Ungerleider, 2000). The localization of these regions appears broadly consistent with attention-related neural responses recorded in nonhuman primates [e.g., FEF and the lateral IPS, see Bisley and Goldberg (2003), Bruce and Goldberg (1985), Gottlieb et al. (1998), and Thompson et al. (2005) for more details]. The parietal cortex has been associated, in particular, with visual search. For example, lesion studies have found that damage to the posterior parietal cortex negatively affects participants' performance accuracy and reaction time in visual search (Aglioti et al., 1997; Friedman-Hill et al., 1995). In addition, transcranial magnetic stimulation (TMS) of the right parietal cortex has been found to impair visual search performance of participants by 100 msec after stimulus onset, but not during feature search (Ashbridge et al., 1997). Furthermore, the FEF plays a critical role in the control of eye movements and visual attention (Corbetta and Shulman, 1998; Schall, 2004) and SMA in goal-directed search (Fairhall et al., 2009).
While studies have looked at the brain activation in these regions using different visual search tasks, there are only a handful of studies examining other regions, networks, and their connectivity in mediating visual search. For instance, the dorsal network (bilateral FEF and IPS) and ventral network (right inferior frontal gyrus [RIFG], right anterior insula [RINSULA], right temporal–parietal junction [RTPJ], and right middle frontal gyrus [RMFG]) play a significant role in visual search. A functional interaction between the dorsal and ventral networks has been proposed such that task-relevant signals from the dorsal network filter stimulus-driven signals in the ventral network, whereas stimulus-driven circuit-breaking signals from the ventral network operate to reset the dorsal network, reorienting it toward relevant stimuli (Corbetta and Shulman, 2002; Fox et al., 2006). The dorsal network, along with the primary visual cortex, ventral network, and the frontal cortex appear to be critical in accomplishing successful visual search. In addition, previous studies have found a linear relationship between cognitive demand and the increase in use of brain resources, especially the functional activation in parietal and occipital cortices (de Fockert et al., 2001; Johnson et al., 2002; Schwartz et al., 2005; Tomasi et al., 2007).
A related article examined effective connectivity of the frontal–parietal network (bilateral FEF and IPS) in addition to visual cortex, where they found that attention modulated the causal influence of these regions to visual regions (Vossel et al., 2012). In this article, attentional resources were examined and dynamic causal modeling was used to measure the effective connectivity of this network. However, it has been previously documented that optimal visual search is also dependent on task difficulty (e.g., having more distractors for the location of a particular target can make the search more difficult), especially during conjunction search, therefore the flow of information between FEF and IPS remains unknown as a function of task difficulty (Keehn et al., 2013; Leonards et al., 2000; Pantazatos et al., 2012).
The current study examined the brain activation, functional, and effective connectivity of the cortical circuitry underlying a visual search task by manipulating different levels of cognitive demand (easy search vs. difficult search). For connectivity analysis, we focused on psychophysiological interactions (PPI) to examine regions that constitute the dorsal and ventral networks and their interaction during the two experimental conditions. We also examined the effective connectivity of the same network (frontal–parietal: FEF and IPS; and visual regions) used (Vossel et al., 2012) to better understand how this network behaves as a function of task difficulty. We hypothesized that the activation in dorsal network will increase as the level of difficulty in visual search increases and that task difficulty will modulate both functional and effective connectivity in regions from the frontal–parietal network. This study is unique in its examination of the functional and causal connectivity across brain areas that are part of the dorsal, ventral, and visual networks.
Materials and Methods
Participants
Twenty-five healthy university students (14 males and 11 females; mean age: 21.5 years) participated in this functional magnetic resonance imaging (fMRI) study. After exclusion of participants with excessive head motion, the final sample included 22 participants (11 males; 11 females; mean age/standard deviation: 21.5 years/±1.5; age range: 19–32 years). The participants were recruited through a screening questionnaire administered among students enrolled in the Introduction to Psychology (PY101) course in the Department of Psychology at the University of Alabama at Birmingham (UAB). Participants were not included if they had medical contradictions for MRI, were taking psychotropic medications, or had any history of neurodevelopmental or psychiatric disorder. Participants gave written informed consent to participate in the study, which was approved by the UAB Institutional Review Board.
Stimuli and experimental design
The fMRI task was a visual search task adapted from Joseph and colleagues (2009). The target letter in this experiment was the letter L and the distractor was the letter T. Letters were displayed in black font on a gray background and randomly displayed in any one of four orthogonal orientations. The trials were presented in a block design format with 42 trials grouped into 14 short randomly presented blocks, with each block consisting of 3 trials. There were two experimental conditions (easy search, difficult search), along with a fixation baseline. The easy search had 15 distractor letter arrays, whereas the difficult search had 25 distractors. Of 42 trials, 50% had 15 distractors and the other 50% had 25 distractors. Each baseline lasted for 24 sec. Each stimulus item was presented for 6 sec and the participants were asked to indicate, through button press, whether the target stimulus was present (50% of trials) or absent (50% of trials) in the stimulus array (Fig. 1).
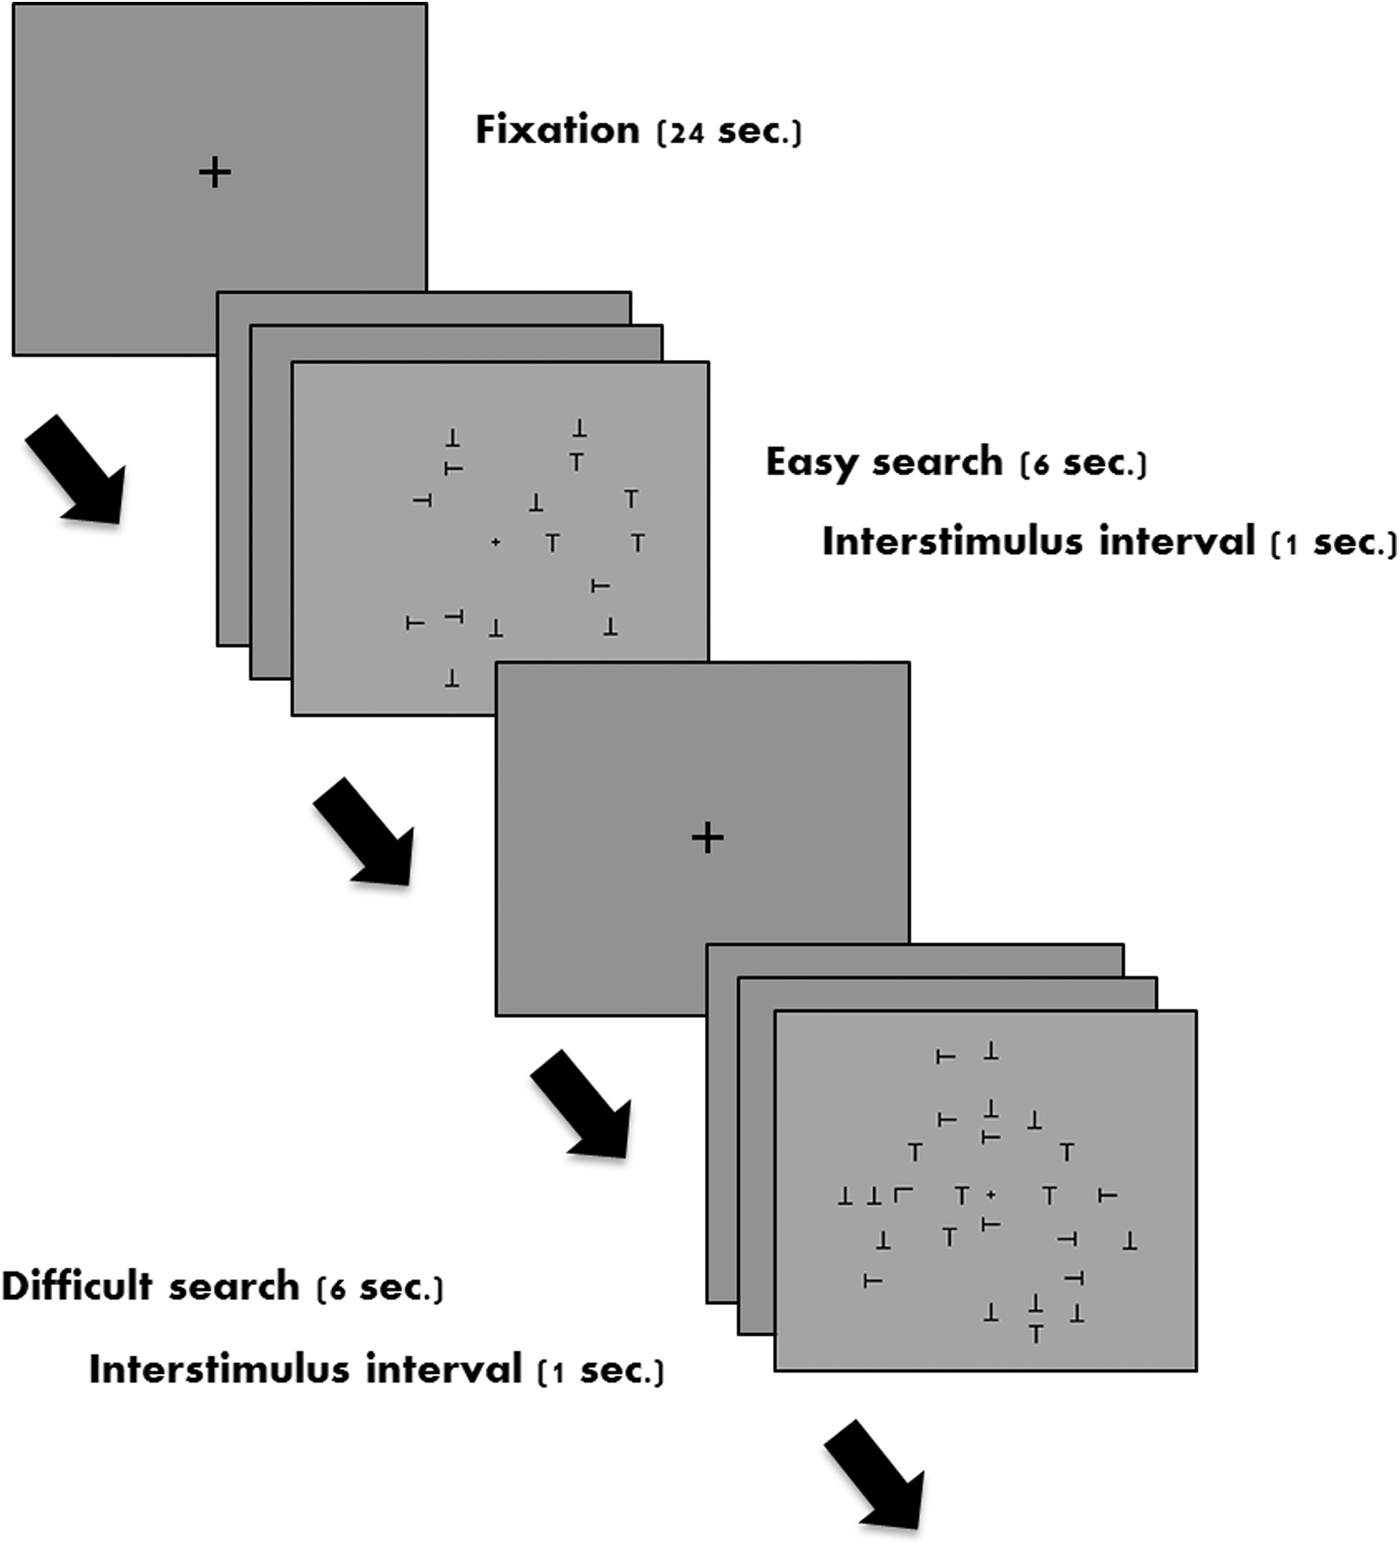
Sample experimental stimuli and timing diagram for stimulus presentation in the scanner. Top panel represents easy search (sample trial where target L is absent) and bottom panel represents difficult search (sample trial where target L is present).
MRI data acquisition
Imaging data were acquired using a 3T Siemens Allegra scanner (Siemens Medical, Inc., Erlangen, Germany) housed at the Civitan International Research Center, University of Alabama at Birmingham. Anatomical images were acquired using high-resolution T1-weighted scans using a 160 slice 3D Magnetization Prepared Rapid Acquisition Gradient Echo (MPRAGE) volume scan (TR = 200 msec; TE = 3.34 msec; flip angle = 12°; field of view (FOV) = 25.6 cm; matrix size = 256 × 256; slice thickness = 1 mm). Functional T2*-weighted images were obtained using a single-shot gradient-recalled echo-planar pulse sequence (TR = 1000 msec, TE = 30 msec, flip angle = 60°, FOV = 24 cm, matrix = 64 × 64). This sequence allowed rapid image acquisition and covered most of the brain (seventeen 5-mm-thick slices with a 1-mm gap in an oblique axial orientation) in a single cycle of scanning (1 TR) with an in-plane resolution of 3.75 × 3.75 × 5 mm3.
Data preprocessing for activation analysis
Functional images were preprocessed using a combination of Analysis of Functional NeuroImages software, AFNI (Cox, 1996), and FMRI software library, FSL (Smith et al., 2004). Functional images were slice-time corrected, and correction for head motion was performed by registering each functional volume to the middle time point of the scan. These images were then coregistered to the anatomical images through the FSL linear image registration tool, FLIRT (Jenkinson and Smith, 2001; Jenkinson et al., 2002). Both images were resampled (3 mm isotropic) and standardized to the atlas space of the MNI152 template through the FSL nonlinear registration tool, FNIRT, and a Gaussian spatial smoothing filter where a global full-width-at-half-maximum of 6 mm was applied.
fMRI activation analyses
After scaling individual functional images to a global mean of 100, whole-brain statistical analyses were performed on an individual basis using a general linear model approach with baseline, easy, and difficult trials as regressors of interest. Six rigid body motion parameters acquired from head motion correction were treated as nuisance regressors. The orthogonal contrast visual search (easy+difficult) versus baseline was computed and difficult versus easy was also computed. Areas of statistically significant activation were determined using one- and two-sample t-tests, and to correct for multiple comparisons, 10,000 Monte Carlo simulations were applied through AFNI 3dClustSim to maintain the familywise error rate at p < 0.05 for the whole brain.
Functional connectivity
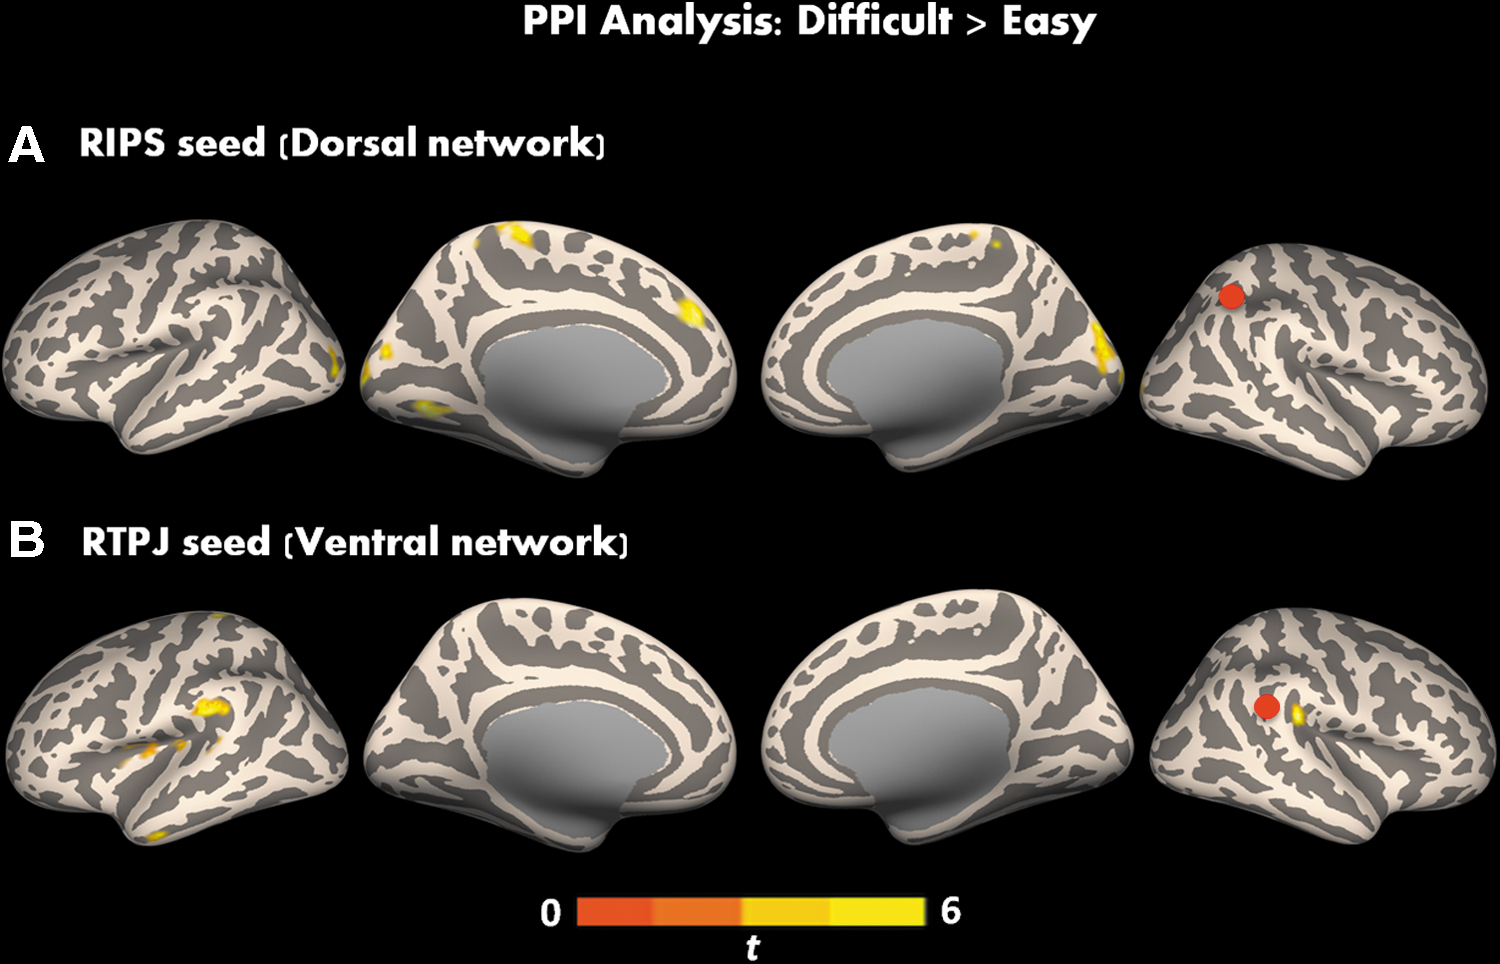
Functional connectivity was examined using a series of PPI analyses using the CONN toolbox (Whitfield-Gabrieli and Nieto-Castanon, 2012). Two seed regions were chosen to examine functional connectivity of the dorsal network (right intraparietal sulcus: RIPS) and ventral network (RTPJ), respectively. Locations were chosen based on their correspondence to nodes within dorsal and ventral attention networks (Corbetta and Shulman, 2002; Corbetta et al., 2008). PPI analysis is a method for estimating the functional coupling between a brain region and the rest of the brain in relation to their response to a particular cognitive task (Friston et al., 1997). PPI analysis uses three regressors: the physiological regressor, the psychological regressor, and the interaction regressor (physiological × psychological regressor). The physiological vector was the entire BOLD time series extracted from RIPS and RTPJ, and the psychological vector was the contrast difficult>easy. The interaction regressor modeled the change in RIPS and RTPJ connectivity between the conditions in the contrast. The regressors were used to model the BOLD time series in individual subjects, producing an estimate of differences in connectivity at each voxel, and correction for multiple comparisons was determined as described above.
For each participant, CONN implemented CompCor, a method for identifying principal components associated with segmented white matter and cerebrospinal fluid. Subsequently, the Artifact Detection Tools (ART) toolbox was used to detect outliers (composite volume-to-volume motion >1 mm and intensity >3 SDs) in the functional time series data and censor them from the functional connectivity analysis. These components (white matter and cerebrospinal fluid) were entered as nuisance variables along with realignment parameters and outliers of head motion detected by ART.
Effective connectivity
Effective connectivity (the causal influence of one region on another) analysis was conducted to further examine the strength and directionality of connections between cortical regions involved in top-down visual search. Seeds used for this analysis were based on the frontal–parietal network described in Vossel and colleagues (2012) and included bilateral visual cortex (LV1, RV1), bilateral intraparietal sulci (LIPS, RIPS), and bilateral frontal eye fields (LFEF and RFEF). Seeds for these regions were created using spherical binary masks (6 mm radius). We used the structural vector autoregression (SVAR) method described in Chen and colleagues (2011). SVAR can model both instantaneous (contemporaneous) and lagged effects among network regions using a unified analytical framework. For this particular analysis, we focused on examining lagged effects among all six ROIs given that no a priori assumptions about properties of all ROIs are needed. Therefore, determination of path coefficients for the lagged effects was strictly data driven. The AFNI program, 1dSVAR.R, was used for this, and the statistical analysis was implemented in R software (R Core Team, 2012). Residual time series for both easy and difficult trials for the selected ROIs were exported and used as input time series for the network modeling. Statistical analysis was performed at the individual subject level, and group effects for each condition were analyzed through linear mixed-effects meta-analysis using path coefficients for each subject. This analysis provided estimates of a group path coefficient and its statistical significance (p-value, two-tailed, uncorrected) for each interaction within the network. Finally, although correction for the multiple comparisons procedure on lagged coefficients is problematic because of the large number of parameters estimated, we still performed the multiple comparisons procedure by using the false discovery rate procedure.
Results
Overview
Our overall findings were (1) participants performed well above chance during easy and difficult trials, and RT was faster during the easy condition than the difficult condition; (2) visual search elicited significant brain activation in frontal and posterior regions, particularly in bilateral FEF, SMA, and IPS; (3) there was significantly increased activation during the difficult search than during easy search; (4) PPI analyses revealed the engagement of frontal–parietal regions while using the RIPS seed (dorsal network); when RTPJ seed (ventral network) was used, only bilateral temporal regions showed a modulation due to the tasks; and (5) effective connectivity analysis revealed a robust left to right information flow and more connections detected during the difficult trials in frontal–parietal and visual regions.
Behavioral data
Paired sample t-tests yielded no significant differences in performance accuracy between the conditions, [M easy = 92%, SD easy = 7.4; M difficult = 94%, SD difficult = 6.8; t(21) = 0.56, p = 0.58], but reaction time was faster during the easy condition than the difficult condition [M easy = 2855 msec, SD easy = 545; M difficult = 3247 msec, SD difficult = 605; t(21) = 3.97, p < 0.001]. In addition, performance accuracy and reaction time were not significantly correlated (r easy = −0.30, p = 0.15; r difficult = −0.26, p = 0.22).
Brain activation
In the contrast visual search versus baseline, we found robust patterns of activation in primary visual cortex, in the dorsal network, including bilateral FEF, IPS, and SMA, and in the ventral network, including bilateral insula, IFG, and MFG (Fig. 2A and Supplementary Table S1; Supplementary Data are available online at
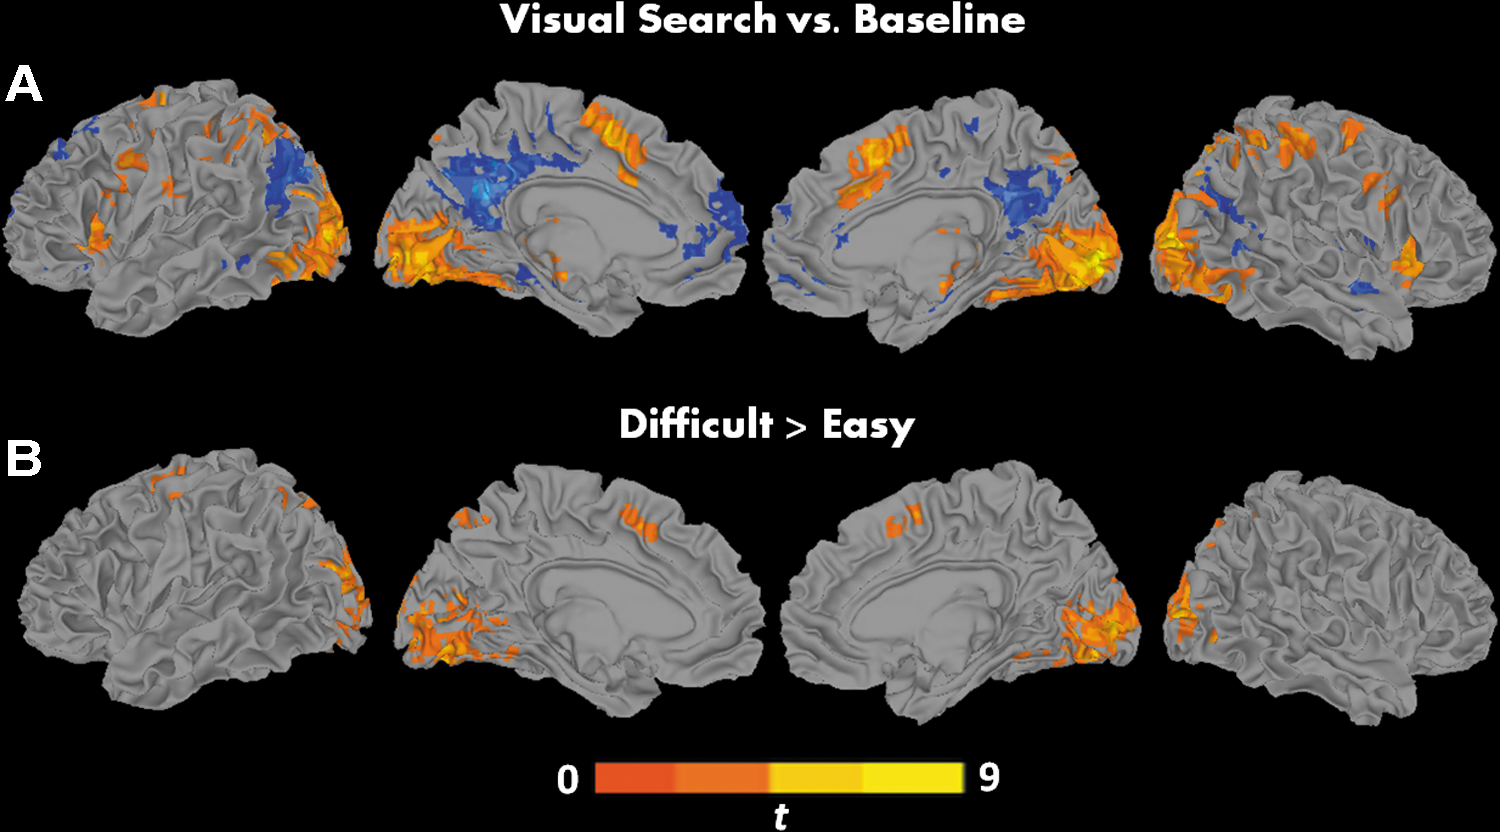
Clusters of significant activation for the contrasts
Differences in fMRI BOLD Activation for the Contrast Difficult Versus Easy
Hemi, hemisphere; L, left; R, right; vol, volume; fMRI, functional magnetic resonance imaging.
Functional connectivity
PPI analyses for the between-task comparison (difficult>easy) using the RIPS seed revealed significant connectivity with bilateral occipital pole, left lingual gyrus, right cerebellum, and medial prefrontal cortex (Fig. 3A and Table 2). On the other hand, the RTPJ seed showed significant connectivity with bilateral parietal operculum, left insula, inferior and middle temporal gyri, and postcentral gyrus (Fig. 3B and Table 2).
Clusters of significant changes in task-induced functional connectivity (using PPI) using
Significant Clusters for PPI Analyses for RIPS and RTPJ Seeds for the Contrast Difficult>Easy
PPI, psychophysiological interaction; RIPS, right intraparietal sulcus; RTPJ, right temporal–parietal junction.
Effective connectivity
During easy search trials, positive connections were detected and these were mostly from left to right hemisphere
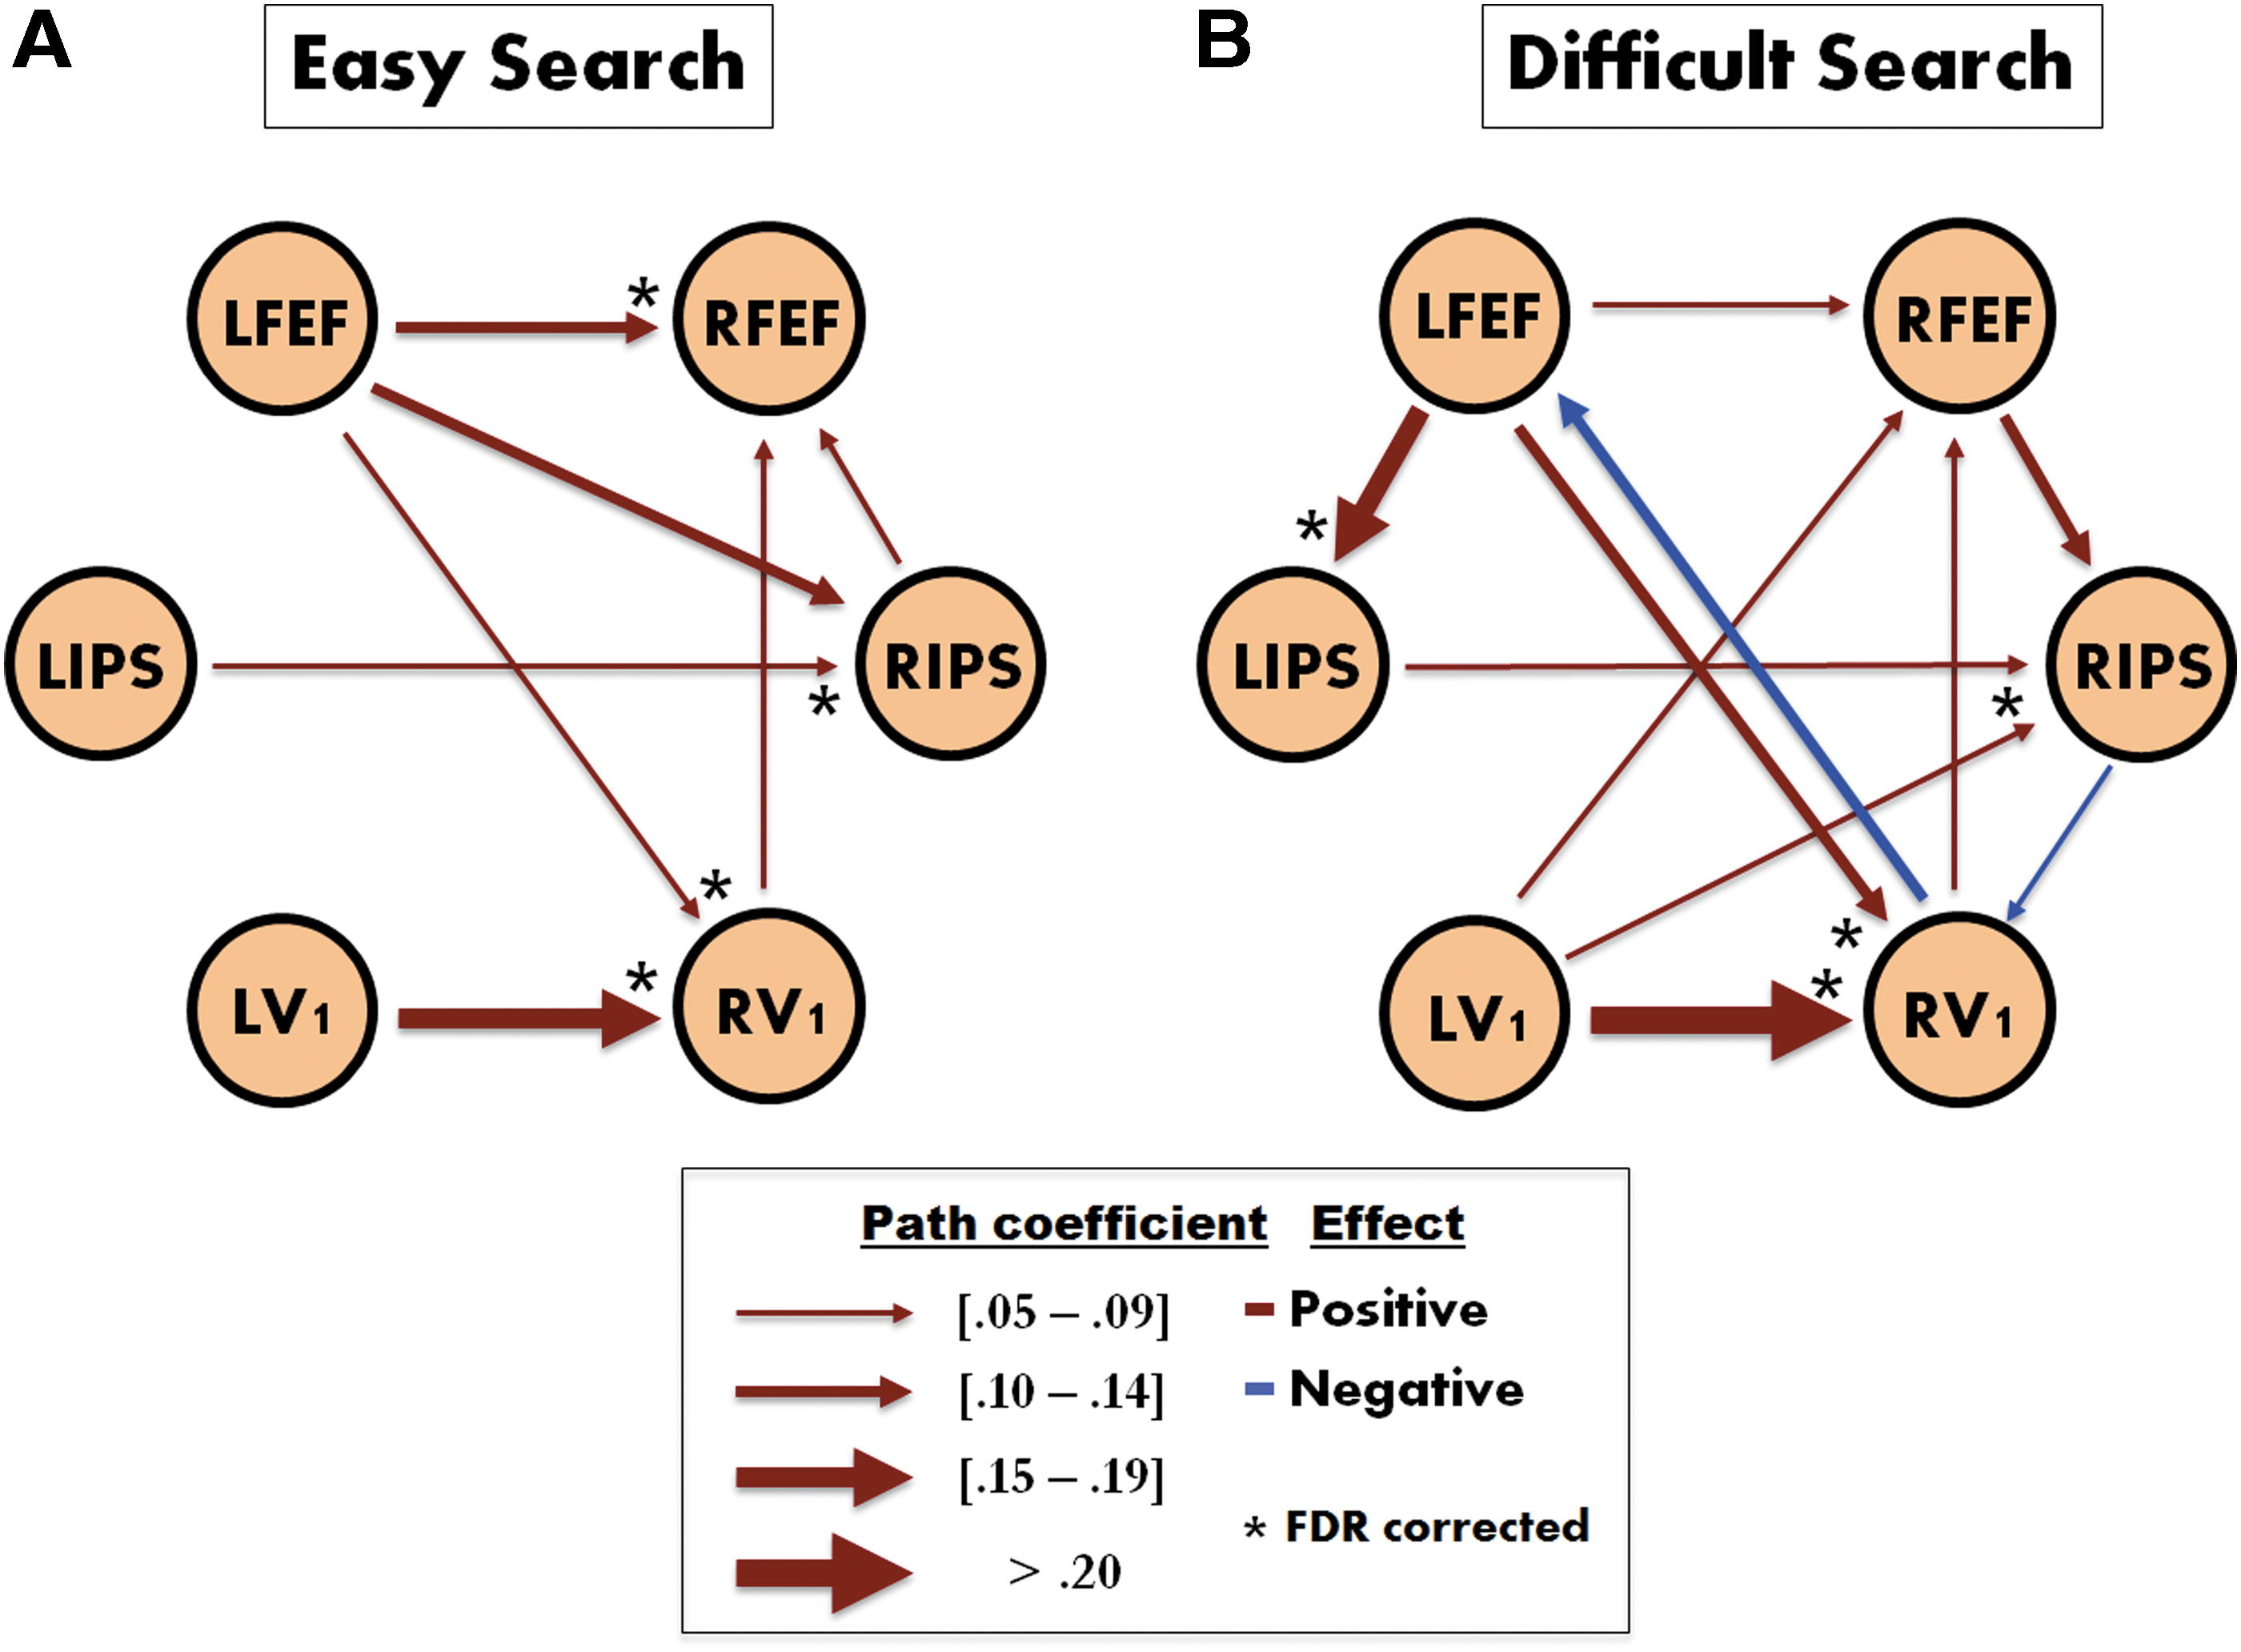
Significant (uncorrected and corrected) connections revealed by SVAR analysis during
Path Coefficients and Significance Level for Each Connection from Effective Connectivity Analysis
p < 0.05, uncorrected; ** p < 0.05, FDR corrected.
FDR, false discovery rate; LFEF, left frontal eye field; RFEF, right frontal eye field; LIPS, left intraparietal sulcus; RIPS, right intraparietal sulcus.
Discussion
Brain activation underlying visual search
The results of this study are largely consistent with previous findings of brain activation in attentional networks involved in visual search, most notably bilateral IPS, FEF, and anterior insula (Anderson et al., 2007; Corbetta et al., 1995; de Fockert et al., 2004; Donner et al., 2002; Fairhall et al., 2009; Pantazatos et al., 2012). Functional neuroimaging studies have consistently shown the coactivation of the dorsal network, FEF, and parietal cortex in tasks involving visual search (Corbetta and Shulman, 1998; Donner et al., 2000, 2002). Activity in the IPS has been typically associated with maintaining visual attention (Corbetta and Shulman, 2002), which is important in the current study where participants had to modulate attention to locate the target. Besides, frontal regions such as FEF and precentral gyrus have been associated with covert and overt attentional shifts (Beauchamp et al., 2001), giving support to the premotor theory of attention, which emphasizes the privileged role of the oculomotor system in spatial attention (Rizzolatti et al., 1987). Bilateral FEF activation found in the current study for both easy and difficult search underscores the role of this region in visual search. This is also supported by evidence from TMS studies (Lane et al., 2012). In addition, single- or double-pulse TMS studies have suggested that the involvement of FEF in a visual search task is 80 msec earlier than posterior parietal cortex (Ellison et al., 2014; Kalla et al., 2008). Thus, these frontal regions may be providing attentional support needed for visual search and may work in tandem with parietal cortex in facilitating successful search.
Attention is vital in visual search, as indicated by the IPS activation in the present study. Attention derives from a weaker activation of the same frontal–parietal circuits that (in other conditions) determine motor behavior toward specific spatial locations (Rizzolatti and Luppino, 2001). The role of attentional mechanisms in this task is also evident from increased activation seen in bilateral premotor cortex and insula, which has been associated with task-level control and focal attention (Eckert et al., 2009; Nelson et al., 2010). When difficult search was contrasted with easy search, we found significantly increased activation in relatively posterior brain regions as well as left superior frontal gyrus extending to precentral gyrus and SMA. It should be noted that previous studies have provided support for cognitive attentional load increase in these same regions, that is, more brain activity is detected with increase in cognitive demand (Culham et al., 2001; Muller et al., 2003; Silk et al., 2010). Activation in FEF and in IPS during visual search task in the present study suggests a more unitary and active frontal–parietal network that reflects successful attentional processing during goal-directed visual search. Overall, these findings are consistent with the visual search literature and with our primary hypothesis, confirming the reliance on more neural resources when the number of distractors increased.
Functional connectivity during visual search
Functional connectivity (via PPI analyses) revealed that connectivity was modulated by the experimental conditions for both RIPS and RTPJ seed regions. Functional connectivity of RIPS with occipital and medial prefrontal regions suggests perceiving the environment, which starts in occipital regions, and feeding that information forward to the parietal areas, which in turn interact with the frontal lobe in making decisions about the processed information (Jung and Haier, 2007). It should be noted that significant functional connectivity of the RIPS was mostly with left hemispheric regions. This stronger coupling could be related to recent work suggesting that parietal regions show stronger attention effects for the contralateral hemifield (Szczepanski et al., 2010). In the current task, difficult visual search may involve greater attention as the number of distractors is more compared with that in easy search, which may require functional coupling of RIPS with the contralateral hemisphere.
Another interesting finding was the functional coupling of RTPJ with insular and temporal regions, which are not typically considered part of the dorsal network. This is a relatively stable finding in visual search tasks, where the TPJ, a part of the ventral network, has shown reduced activation or connectivity during such tasks, which was the case in this study (Shulman et al., 2007; Todd et al., 2005). In addition, the functional coupling of RTPJ with dorsal network regions was not robust enough, which may be due to RTPJ suppression during top-down signaling that biases attention for task-relevant information during visual search (Corbetta et al., 2008). While there may be an important locus of functional interaction between dorsal and ventral attention systems during attention-demanding tasks (Fox et al., 2006), the exact role of each of these regions (e.g., TPJ and IPS) for attentional reorienting remains to be established.
Task-dependent changes in effective connectivity
Finally, to further understand the neural dynamics of visual search, an effective connectivity analysis was conducted by examining the information transfer among a set of regions selected from the findings of a previous study (Vossel et al., 2012). The results of this analysis showed that information flow within bilateral V1, IPS, and FEF changed as a function of task and revealed transfer of information from the left to the right hemisphere. Right hemisphere dominance has been found in studies of visual search similar to ours (Arrington et al., 2000; Macaluso et al., 2002; Shulman et al., 2010). Although these studies and others may suggest a preference for the right hemisphere in visual target detection, we did not find a lateralization effect in activation or connectivity results. Thus, the effective connectivity findings may suggest that both hemispheres are active, and transfer of information from left to right may be optimal for efficient visual search, especially during difficult trials. For example, as difficult trials require higher attentional resources, a greater need to coordinate information between left and right hemispheres may be needed and it is also possible that both hemispheres can operate, at least to some degree, in parallel as the cognitive demand increases (Parks and Madden, 2013). There is some previous evidence regarding this increase in cross-hemispheric effect during difficult trials, where cross-hemispheric effects were observed as a function of cognitive demand in visual search (Fairhall et al., 2009) and nonvisual search (Davis and Cabeza, 2015; Kitzbichler et al., 2011) tasks. This may also reflect the greater need to coordinate information between the regions of the dorsal–frontal–parietal network during active search (Vossel et al., 2012). Among the statistically significant connections, our finding that FEF exerts a causal influence on IPS has been previously observed in a visual attention study (Bressler et al., 2008). These findings and ours suggest that FEF has a greater modulatory effect on IPS than IPS on FEF during difficult visual search, which requires enhanced attentional resources given that we did not observe such connections during easy visual search.
There are a few limitations of this study that need to be taken into consideration. For instance, even though we instructed our participants to keep their eyes focused during each task, the chances of microsaccades occurring were high, and without the use of in-scanner eye tracking, the effects of eye movements could not be statistically controlled. The frontal–parietal network is known to be involved in attention and eye movement control. Another limitation could be the addition of more distractors in the difficult condition, possibly confounding the low-level perceptual load with higher-level processes (Raabe et al., 2013), and perhaps a better manipulation of task difficulty could have been used, for example, the distractors could have been modified to resemble the target letter (Geringswald et al., 2013). Finally, although our effective connectivity analysis suggested a flow of information from left to right as the cognitive demand increased, there exists some difficulty in estimating directionality of fMRI time series using current approaches (Smith et al., 2011). This is a topic that goes beyond the scope of this study; in addition, we did not find any significant correlations between effective connectivity and behavioral measures.
Conclusions
The findings of this study suggest the role of dorsal, ventral, and to some extent the visual networks in efficient visual search. In addition, it also provides evidence for how these networks are modulated in relation to task demand, with difficult visual search eliciting more neural resources than easy search. In sum, these findings suggest that greater brain resources are needed for optimal top-down visual search and thus contribute important information to the visual search fMRI literature.
Footnotes
Acknowledgments
This study was supported by the UAB Department of Psychology and UAB Department of Computer and Information Sciences Faculty funds. Special thanks to the participants who took part in this study and to Keya Kuruvilla and Michael Georgescu for their help with data collection.
Author Disclosure Statement
No competing financial interests exist.
References
Supplementary Material
Please find the following supplemental material available below.
For Open Access articles published under a Creative Commons License, all supplemental material carries the same license as the article it is associated with.
For non-Open Access articles published, all supplemental material carries a non-exclusive license, and permission requests for re-use of supplemental material or any part of supplemental material shall be sent directly to the copyright owner as specified in the copyright notice associated with the article.