
Abstract
Arterial spin labeling (ASL) is an increasingly established magnetic resonance imaging (MRI) technique that is finding broader applications in studying the healthy and diseased brain. This review addresses the use of ASL to assess brain function in the resting state. Following a brief technical description, we discuss the use of ASL in the following main categories: (1) resting-state functional connectivity (FC) measurement: the use of ASL-based cerebral blood flow (CBF) measurements as an alternative to the blood oxygen level-dependent (BOLD) technique to assess resting-state FC; (2) the link between network CBF and FC measurements: the use of network CBF as a surrogate of the metabolic activity within corresponding networks; and (3) the study of resting-state dynamic CBF-BOLD coupling and cerebral metabolism: the use of dynamic CBF information obtained using ASL to assess dynamic CBF-BOLD coupling and oxidative metabolism in the resting state. In addition, we summarize some future challenges and interesting research directions for ASL, including slice-accelerated (multiband) imaging as well as the effects of motion and other physiological confounds on perfusion-based FC measurement. In summary, this work reviews the state-of-the-art of ASL and establishes it as an increasingly viable MRI technique with high translational value in studying resting-state brain function.
Introduction
The importance of assessing brain function using resting-state functional magnetic resonance imaging (rs-fMRI) was suggested by the presence of consistent intrinsic metabolic and perfusion patterns in the brain in the absence of tasks (Gloor, 1969; Raichle, 2011). The widespread use of rs-fMRI is largely attributable to the seminal discovery of resting-state functional connectivity (FC) by Biswal and associates (1995), and rs-fMRI has since gained considerable attention in basic and clinical neuroscience (Biswal et al., 1995; Fox and Greicius, 2010). This rapid growth is fostered by the ability to bypass the hurdles of task performance and behavioral evaluations of experimental paradigms in assessing brain function, opening a new avenue for neuroimaging research in pediatrics (de Bie et al., 2012), aging (Andrews-Hanna et al., 2007; Hampson et al., 2010), and in a variety of neurologic and psychiatric diseases (Castellanos et al., 2013; Kenny et al., 2012).
To date, the majority of rs-fMRI studies have employed blood oxygen level-dependent (BOLD) contrast, focusing primarily on FC measures (van Dijk et al., 2010; Worsley et al., 1998), power spectral analyses (Duff et al., 2008; Handwerker et al., 2012; Rack-Gomer and Liu, 2012), or nonlinear complexity measures of rs-fMRI (Friston et al., 2014; Liu et al., 2013). Despite its success and widespread use, rs-fMRI based on the BOLD contrast has several shortcomings: (1) the BOLD signal is not neuronally specific due to numerous physiological and noise contributions to its contrast mechanism; (2) even in the absence of noise, the BOLD technique offers limited spatial specificity to the site of neuronal activity due to the contribution of draining veins to the BOLD contrast; (3) the BOLD signal alone does not provide a direct and quantitative measure of brain function during the resting state and cannot be used in isolation to derive neuronal metabolism metrics. The study of resting-state brain function is by no means limited to that of FC, and with the buildup of technical advances in recent years, arterial spin labeling (ASL) and dynamic blood flow-related metrics are becoming increasingly feasible alternatives to BOLD fMRI.
ASL has been used in conjunction with BOLD for assessing brain function both at rest and during task activation. ASL provides noninvasive and quantitative measurements of cerebral blood flow (CBF) using magnetically labeled arterial blood water as an endogenous tracer. Since CBF is normally coupled to glucose metabolism and neuronal activity (Akgoren et al., 1994; Hoge and Pike, 2001), it is a surrogate marker of brain function. Compared with BOLD, ASL has several potential advantages, notably (1) it offers increased spatial specificity to neuronal activity due to the capillary/tissue origin of the ASL signal; (2) it has the capacity for absolute quantification of CBF—a well-characterized physiological parameter that is critical to the viability of brain tissue; and (3) it can be used to generate dynamic CBF and BOLD measurements simultaneously, thereby allowing the computation of the cerebral metabolic rate of oxygen (CMRO2) (Hoge et al., 1999; Wong et al., 1997).
There has been an exponential growth in the translation of ASL in recent years, spanning the study of a spectrum of neurologic and psychiatric disorders, as well as pharmacological interventions. A comprehensive overview of clinical studies using ASL can be found in a recent review (Detre et al., 2012; Telischak et al., 2014) and will not be reiterated in this article. However, the integration of ASL as part of rs-fMRI studies is just emerging.
This review will discuss the use of ASL for characterizing resting-state brain function from the following three perspectives: (1) ASL perfusion-based FC measurement—the interaction among brain regions has important implications for cognitive function and has been linked to resting perfusion, so in this work, we will discuss the use of ASL connectivity as an alternative or supplement to BOLD; (2) using ASL perfusion to explain the physiological underpinnings of resting-state BOLD connectivity—network CBF may serve as a surrogate of the basal metabolic activity of the corresponding brain networks; and (3) using dynamic ASL to investigate CBF-BOLD coupling in resting state—this coupling underlies resting-state FC and intrinsic cerebral metabolism, and we discuss simultaneous CBF-BOLD measurements that offer physiological insight. We will also address future research directions and challenges along with plausible solutions.
Recent Technical Adances in ASL
Although ASL perfusion MRI was first introduced in the early 1990s (Detre et al., 1992; Williams et al., 1992), the relatively rapid growth of its technical development and clinical translation occurred mainly during the past 10 years. The main limitations of ASL have been the relatively low signal-to-noise ratio (SNR) due to the small arterial blood fraction (∼1%) as well as the arterial transit effects if the postlabeling delay is not long enough to allow labeled blood to reach the tissue (e.g., stroke).
In response, several key technologies have been developed during the past decade to maximize the SNR and temporal stability of ASL scans, including pseudocontinuous ASL (pCASL) (Dai et al., 2008; Wu et al., 2007), background suppression (BS), and three-dimensional (3D) fast imaging sequences, such as GRASE (a hybrid of gradient and spin echo) and stack of spirals. 3D acquisitions not only offer increased SNR compared with two-dimensional (2D) acquisitions such as echo-planar imaging (EPI) through the excitation of a larger volume but they are also ideally suited for BS, given the single excitation time point. A recent consensus article recommended pCASL with background-suppressed 3D acquisitions as the preferred common strategy for clinical applications (Alsop et al., 2014).
At present, the primary purpose of clinical ASL examinations is to provide quantitative resting CBF maps based on a single scan within a clinically acceptable time of a few minutes, with results shown to be comparable with 15O-water PET (Heijtel et al., 2014; Kilroy et al., 2014). Since an ASL scan contains multiple pairs of label and control acquisitions, it is also conceivable to perform FC analysis of perfusion time series in a manner similar to BOLD rs-fMRI. In this regard, a combination of pCASL with BS (Garcia et al., 2005; Ghariq et al., 2014) offers major advantages over conventional ASL acquisitions in terms of the temporal SNR and stability of the perfusion image series (Fig. 1).
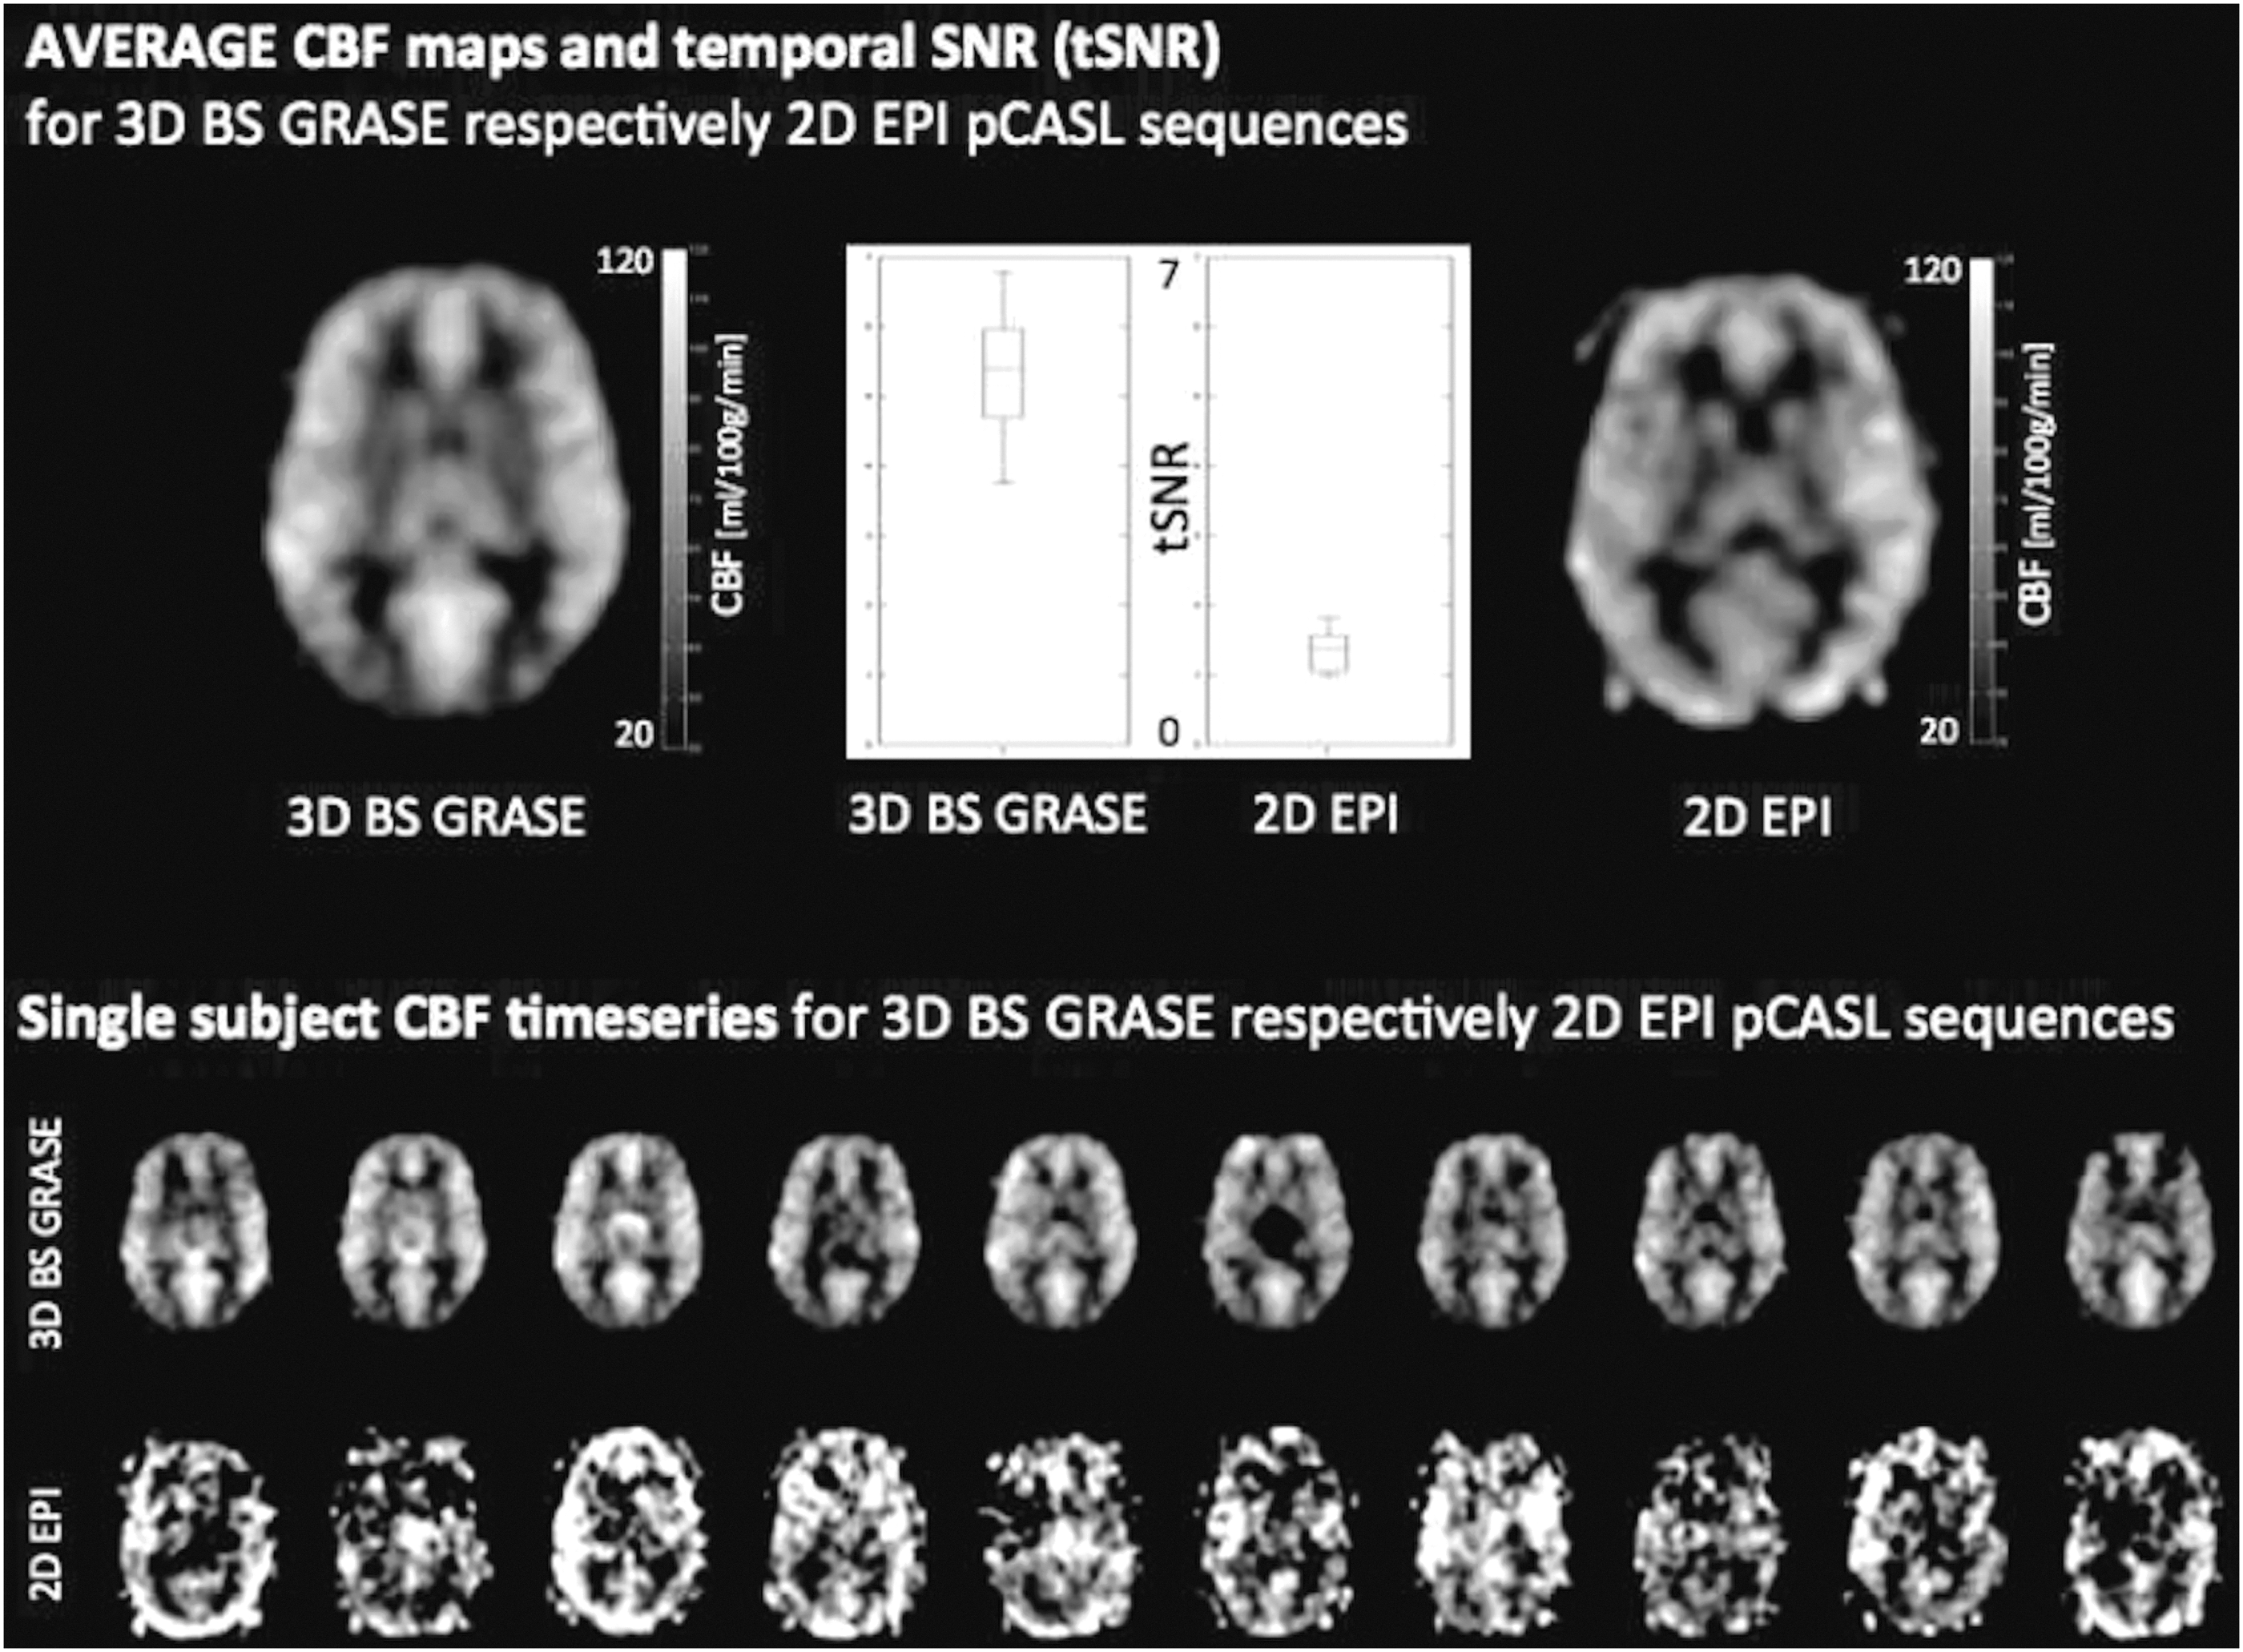
Comparison of temporal signal-to-noise ratio (SNR) and frame-by-frame perfusion image series by three-dimensional (3D) background suppression (BS) GRASE and two-dimensional (2D) echo-planar imaging (EPI) pseudocontinuous arterial spin labeling (pCASL). Although mean cerebral blood flow (CBF) maps are comparable, the temporal SNR (tSNR) of 3D GRASE pCASL is approximately three times that of 2D EPI pCASL, resulting in reliable frame-by-frame perfusion image series, while large variations exist in 2D EPI pCASL image series.
We note that 3D acquisitions for ASL have been demonstrated to increase spatial SNR with little effect on temporal SNR (Vidorreta et al., 2013). Due to the high image SNR (vs. thermal noise in the background) in both 3D GRASE and 2D EPI images (typically SNR>100), the temporal SNR is mainly determined by physiological noise. Therefore, we attribute the three-fold temporal SNR gain mainly to BS, consistent with the findings of Vidorreta and associates (2013). Furthermore, BS was recently shown to increase temporal SNR in 2D acquisitions (Wang et al., 2015) as well, although the effect was less pronounced than on 3D acquisitions.
We also note that 3D ASL acquisitions may suffer from spatial blurring due to modulations of k-space signals by the transverse (T 2) relaxation curve, especially along the slice/partition direction. For single-shot acquisitions, the full width at half-maximum of the point-spread function is on the order of 1.3–1.5 voxels along the slice direction (Vidorreta et al., 2013). In this regard, trade-offs between achieving adequate temporal and spatial resolution have to be made around single and multishot acquisitions at present. Recent developments to reduce the 3D readout by using techniques such as k-space sharing (Liang et al., 2012) may also improve the feasibility of 3D ASL for rs-fMRI applications.
ASL Signal Analysis Approaches
Minimizing BOLD effects
In analyses targeting the dynamic perfusion signal, it is imperative to minimize BOLD contamination. This was previously demonstrated by Aguirre and colleagues (2002) using sinc interpolation. Liu and Wong (2005) further demonstrated the use of low-pass filtering to isolate the unmodulated (by tag and control differences) CBF component, providing a general framework for describing the sinc interpolation method as well as alternative methods such as simple and surround subtraction. Specifically, the sinc interpolation method was expressed as demodulation, followed by low-pass filtering of the raw ASL time series, and when evaluated against the alternatives, demonstrated superior attenuation of spurious BOLD components. On the other hand, Chuang and colleagues (2008) used high-pass filtering to isolate the modulated CBF component, and subsequently demodulated it to produce the perfusion-related CBF component, assuming the control–tag-modulated BOLD effect is negligible. Based on this work, as the primary frequency distribution of the BOLD component is below 4/repetition time (TR) Hz, high-pass temporal filtering above this frequency can be applied to the raw ASL image series to minimize low-frequency BOLD fluctuations (Fig. 2). Compared with the high-pass filtering approach, the low-pass filtering approach may retain more BOLD contribution that can only be minimized through echo time minimization. Nonetheless, the method of Chuang and colleagues (2008) builds upon ASL signal models from previous work (Liu and Wong, 2005; Mumford et al., 2006) and produces results similar to those of sinc interpolation. Thus, there is no fundamental difference among these various preprocessing techniques.
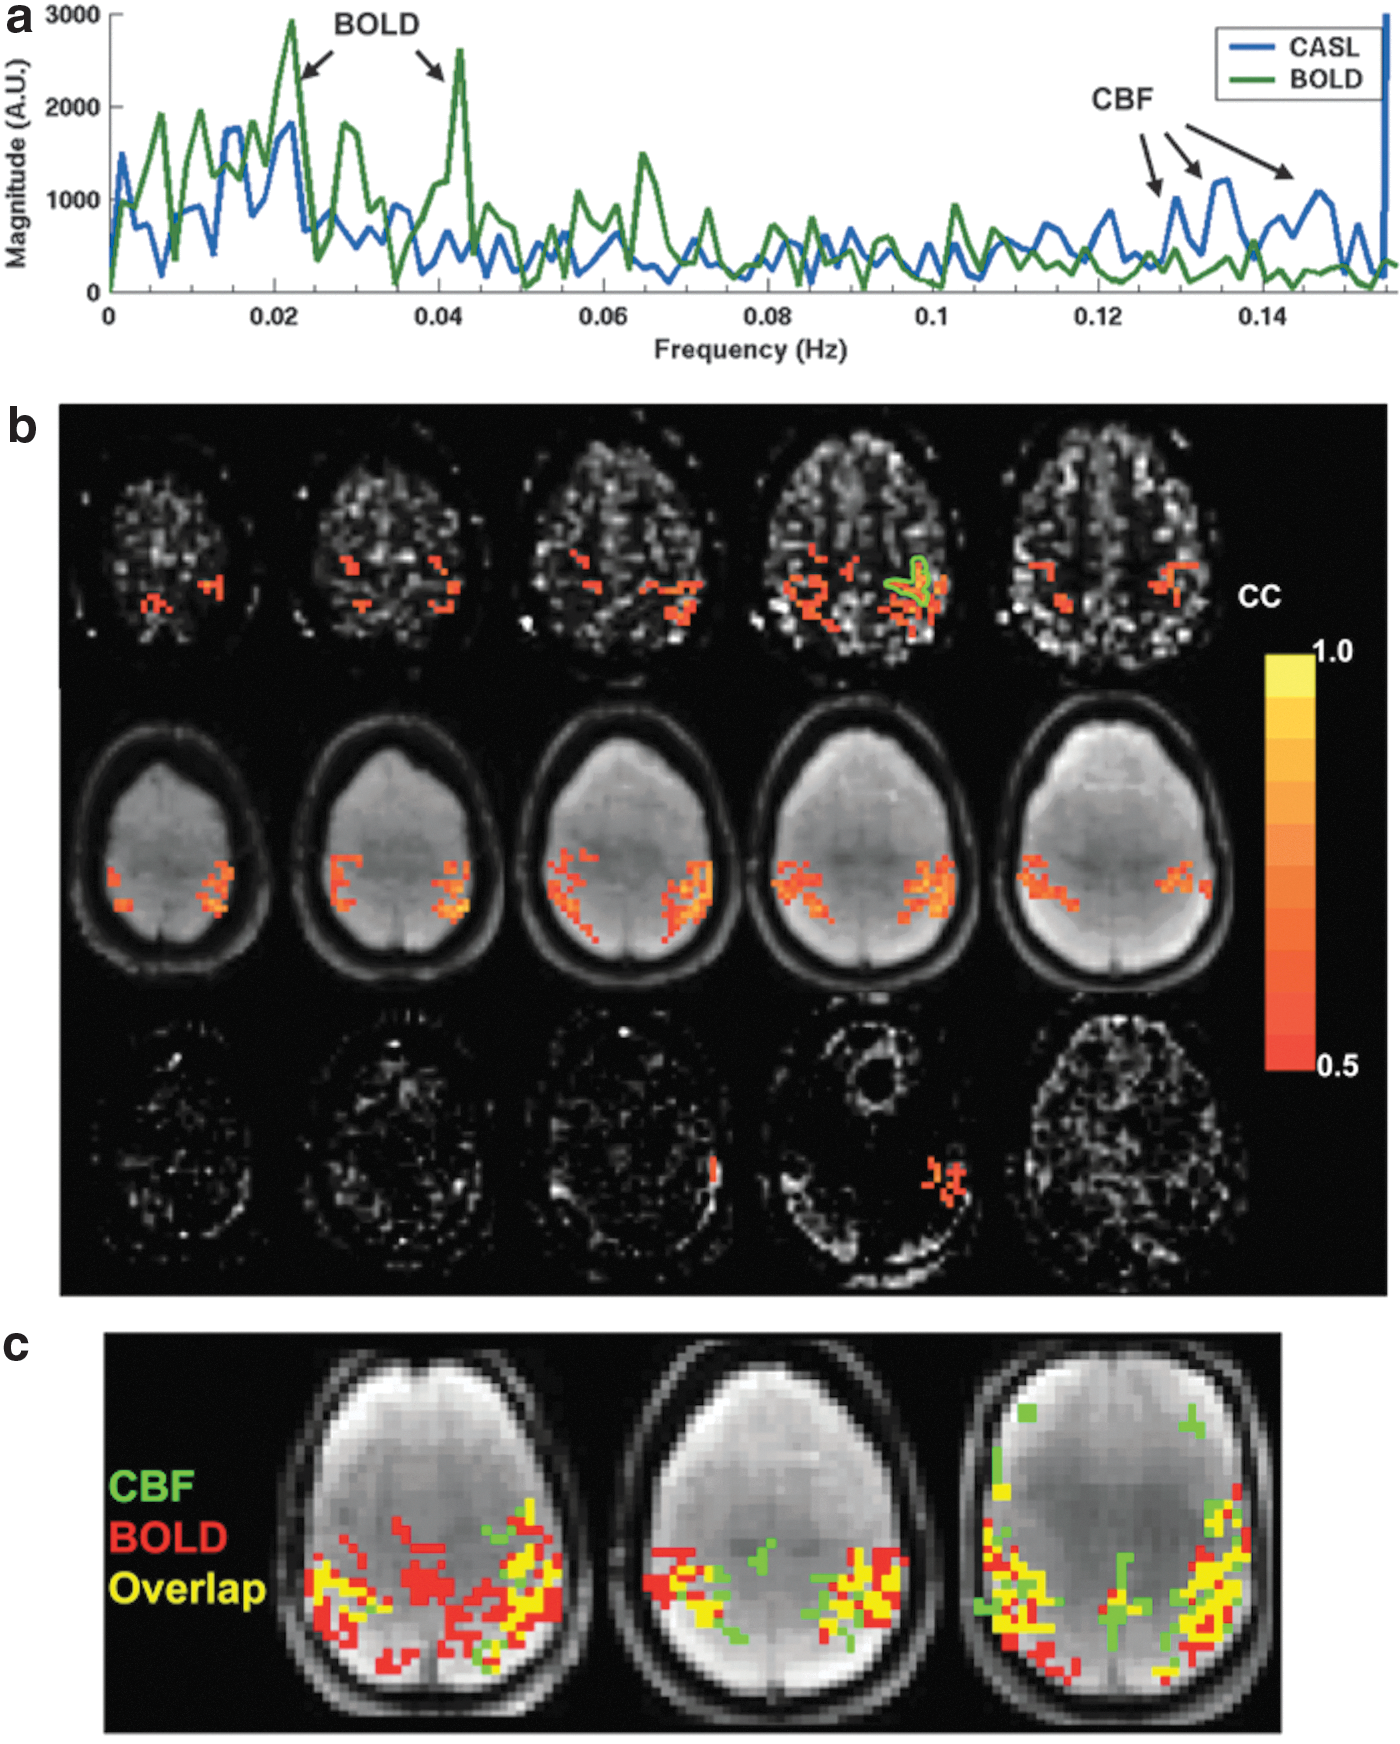
CBF-based resting-state functional connectivity (FC) measurement [Figure adapted with permission from Chuang et al. (2008)]
Minimizing physiological noise effects
In this review, we provide a brief overview of physiological denoising methods that could be applicable to ASL. This is by no means exhaustive, but a list of the most recent and/or widely applied methods in fMRI. Note that BS would not eliminate these noise effects from the CBF time course (Wu et al., 2009b).
RETROICOR [image-based method for retrospective correction of physiological motion effects (Glover et al., 2000)]
Involving regressing out the phase information of time-locked respiratory and cardiac noise, RETROICOR is a model-based method that has become a standard step in resting-state BOLD fMRI preprocessing. CBF time series is indeed susceptible to physiological noise as well, chiefly respiration and cardiac effects. However, applying RETROICOR on the ASL difference time series had minimal effect on signal quality (Restom et al., 2006). In fact, RETROICOR was most beneficial when applied to the tag and control time series separately before the subtraction step (Restom et al., 2006). It was further found that the effectiveness of RETROICOR depends on the type of ASL employed (Wu et al., 2009b), with CASL more affected by respiratory than cardiac noise.
CompCor [component-based noise correction (Behzadi et al., 2007)]
Partly data driven, CompCor uses principal signal components from white matter and cerebrospinal fluid regions as nuisance regressors in a general linear model. It has compared favorably against RETROICOR in task-based BOLD studies in terms of increasing the extent of activation detection (Behzadi et al., 2007). It was since applied successfully on ASL data (tag and control series separately) to control the effect of physiological noise.
Global signal regression (Desjardins et al., 2001)
Another general linear model-based approach, this method is simple and widely adopted in rs-fMRI. In addition to removing a large portion of physiological noise, this method may also correct global motion effects (Power et al., 2012). It has been shown that global signal regression improves tSNR and test–retest reliability of CASL-based CBF maps (Wang, 2012). However, the global perfusion signal will likely contain neuronal contributions (Leopold and Maier, 2012; Murphy et al., 2009), and regressing out the global signal will likely bias the perfusion time series just as it biases the BOLD time series and connectivity measures. Thus, the use of global signal regression is a controversial issue in FC calculations (Saad et al., 2013).
RVHRCOR [low-frequency respiratory and heart rate variability correction (Chang et al., 2013)]
This method includes as nuisance regressors low-frequency variations in respiration and cardiac pulsation instead of their time-locked components. It has been demonstrated to potentially reduce false positives in BOLD FC measurements (Chang and Glover, 2009a). The same principles should apply to ASL CBF data, but as for RETROICOR, RVHRCOR should be applied to tag and control time series independently. However, RVHRCOR has been shown to reduce the test–retest reproducibility of resting-state BOLD connectivity results (Birn et al., 2014) and mask drug effects on connectivity in pharmacological fMRI (Khalili-Mahani et al., 2013). Thus, the true significance of low-frequency physiological fluctuations and the benefits of their removal by RVRHCOR have yet to be elucidated.
APPLECOR and PEARCOR (Marx et al., 2013)
APPLECOR stands for affine parameterization of physiological large-scale error correction, while PEARCOR stands for parallel execution of APPLECOR and RVHRCOR. APPLECOR estimates the global noise regressors based on the detection and modeling of globally consistent spatial correlation patterns. In fact, the adoption of PEARCOR was shown to result in maximal suppression of temporal variability in resting-state BOLD default mode FC patterns when compared with RVHRCOR and global signal regression. In regard to application in ASL, similar recommendations apply as for RVHRCOR.
FIX (FMRIB independent component network analysis-based X-noisifier) (Salimi-Khorshidi et al., 2014)
Part of the FSL toolbox, FIX uses a trained classifier to automatically detect noise components from a standard independent component network analysis (ICA) based on numerous attributes of each independent component. This technique can be applied directly to the CBF-based ICA results instead of on the control and tag time series separately. This approach can be easily deployed in the absence of physiological recordings, but the effectiveness of this approach in view of the other approaches listed here has yet to be quantified. It would also call for a new classifier for CBF data sets that has to be trained and identified.
Perfusion-Based FC Mapping
While BOLD rs-fMRI is the dominant technique used in studies of resting-brain networks (RBNs), the possibility of using ASL perfusion MRI for assessing RBNs has been attracting increasing interest (Chuang et al., 2008; Zou et al., 2009) due to the closer coupling (relative to BOLD) between CBF and neuronal activity (Lauritzen, 2001; Wong et al., 1997). Resting-state FC based on CBF fluctuations was first demonstrated by Biswal and associates (1997) in the bilateral motor cortices. Subsequently, Chuang and colleagues (2008) proposed a theoretical framework in which CBF-based FC can be derived with minimal BOLD contaminations by taking advantage of the unique frequency modulation of control–tag alternations in the ASL time series. This analysis framework (see previous section for details) was later applied to examine connectivity in the default mode network (DMN), which was consistently identified using BOLD and CBF data (Fernández-Seara et al., 2011; Viviani et al., 2011; Zou et al., 2009). Viviani and colleagues (2011) demonstrated this equivalence in a large sample (N=265) by finding significant correlation with BOLD-based connectivity in the frontal eye field and intraparietal sulcus, as well as in the main nodes of the DMN.
More recent studies have employed a combination of 3D pCASL and ICA to explore CBF-based connectivity. Liang and associates (2012) used a 3D GRASE pCASL technique with view sharing to minimize image blurring while achieving whole-brain coverage at a TR of 3.75 sec. Their ICA-based results showed that CBF and BOLD data reveal remarkably similar RBNs, including the DMN, attention, auditory, sensorimotor, and visual networks. These findings were confirmed in a more quantitative comparison between ASL and BOLD FC in a more recent study (Jann et al., 2015a). In the latter study, also based on 3D GRASE pCASL, the similarity and reliability between BOLD- and CBF-based RBNs were quantitatively evaluated. Both separate and joint FC analyses of ASL and BOLD rs-fMRI data generated RBNs common to both imaging techniques, with a moderate-to-high level of spatial overlap as shown by Dice similarity coefficients (range: separate-ICA 0.35–0.80; joint-ICA 0.59–0.71). Specifically, test–retest analyses indicated more reliable spatial network patterns in BOLD (average intraclass correlation coefficient [ICC]=0.91±0.03 between sessions and 0.89±0.05 between scanners) than in ASL data (ICC=0.55±0.05 and 0.58±0.06, respectively). It bears mentioning that ASL provided an added benefit of highly reproducible network-specific quantitative CBF measurements (ICC=0.96±0.02 between sessions and 0.97±0.01 between scanners) that are complementary to FC as a metric of resting brain function (Jann et al., 2015a). The relationship between FC and resting CBF will be discussed in more detail in a later section.
Overall, existing work suggests that ASL and BOLD rs-fMRI have complementary strengths, and taken together, they may provide a powerful tool for better characterizing the spatiotemporal and quantitative properties of RBNs. Nevertheless, since ASL-based perfusion contrast is typically two- to threefold lower than BOLD contrast, it is reasonable to assume that the lower SNR would contribute to lower test–retest reliability of the CBF-based results. Indeed, higher SNR may indicate a greater capacity to faithfully represent underlying neuronal processes. However, as a general comment, we note that test–retest reliability alone may not be representative of accuracy in depicting underlying brain processes. As recently found (Birn et al., 2014), physiological noise processes such as respiration and cardiac pulsation can produce highly reproducible, but spurious, connectivity patterns in rs-fMRI. Thus, the true reliability of CBF-based measurements of resting-state brain function without potential modulation of physiological signals remains to be explored. Furthermore, improvements in the temporal resolution (Liang et al., 2012) and spatial coverage (Jann et al., 2015a) of 3D ASL remain in progress, as will be discussed in a later section (Fig. 3).
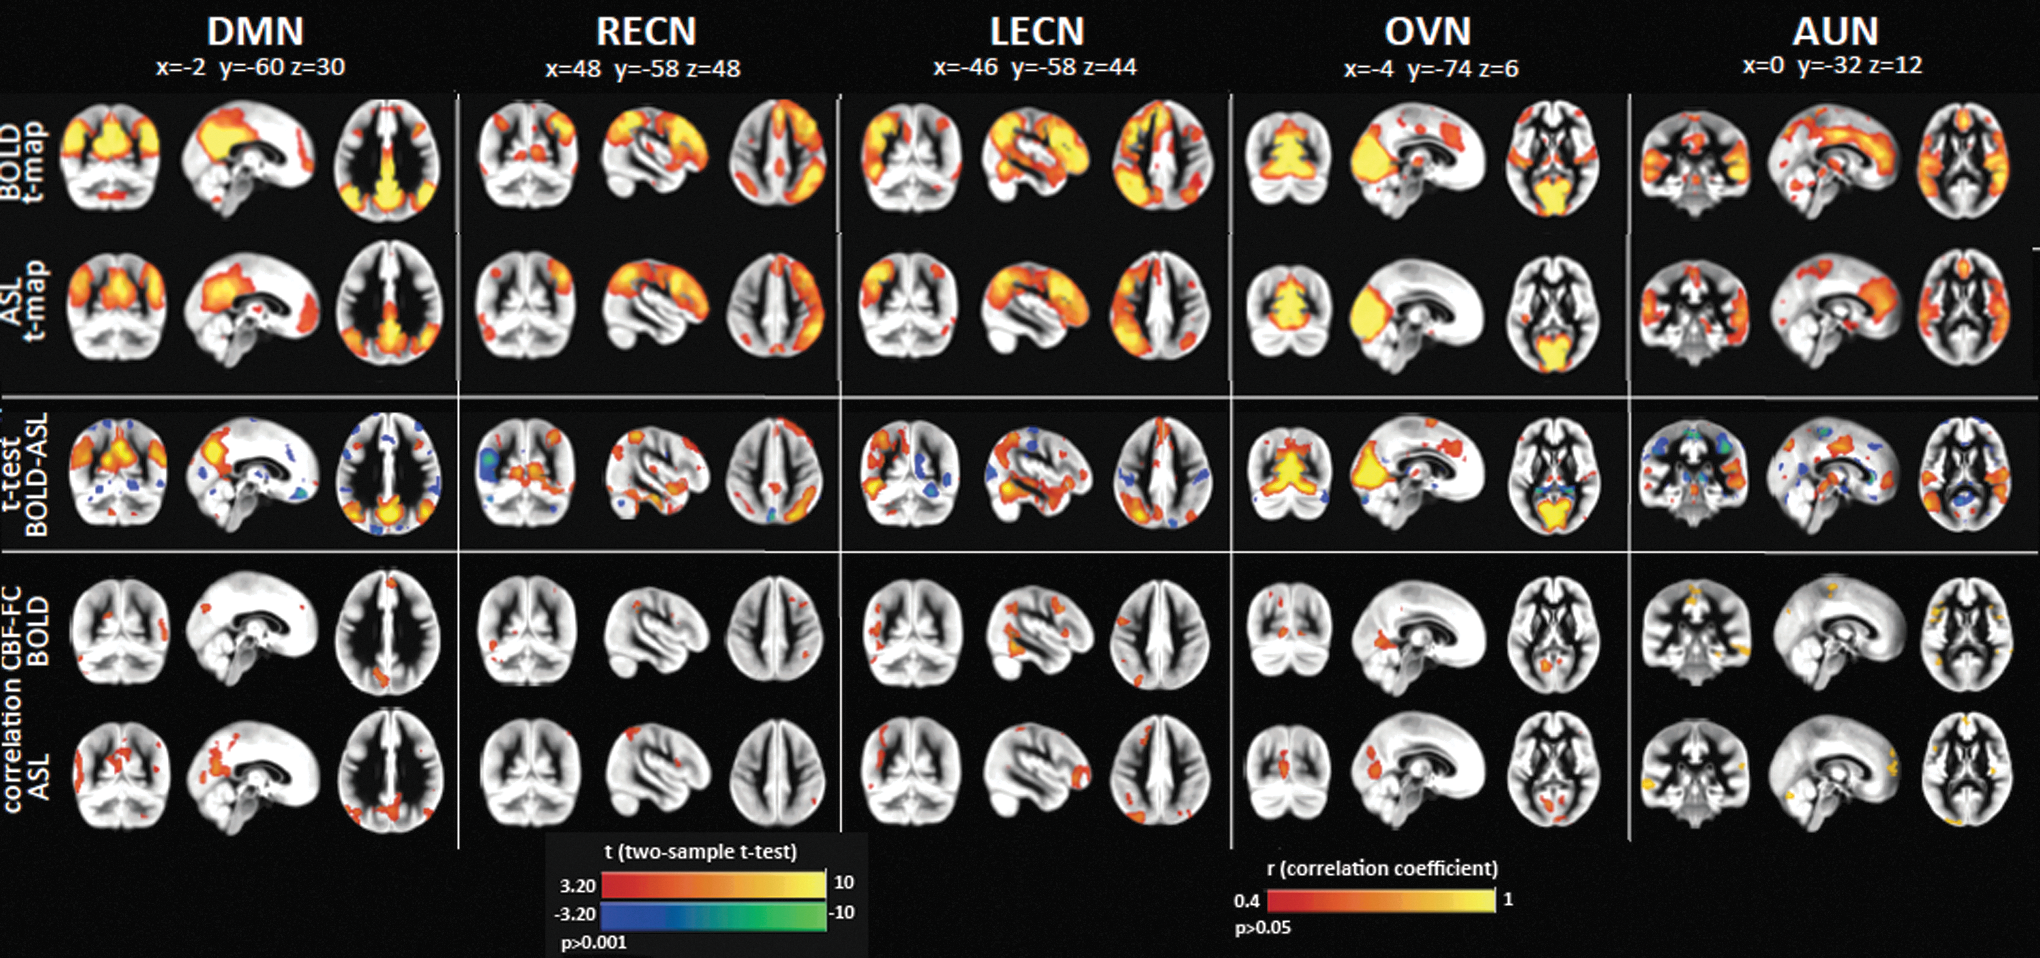
Similarities and differences between resting-state functional networks derived from BOLD and from CBF [Figure adapted with permission from Jann et al. (2015a)]. Group joint independent component network analysis (ICA) was used to derive five common resting-state brain networks: the default mode network (DMN), left and right executive control networks (LECN/RECN), occipital visual network (OVN), and auditory network (AUN). Meaningful resting-state networks were detected using both BOLD and CBF data. BOLD- and CBF-based FC maps are in the top two rows. Differences between BOLD and ASL were assessed by means of two-sample two-sided t-tests (significance threshold was set at p<0.001). Correlation maps between resting perfusion and FC are also shown (CBF-FC), with CBF-based connectivity maps more strongly associated with resting perfusion. Color images available online at
As ASL requires that T 2 weighting be minimized, it is less sensitive to magnetic field inhomogeneity effects compared with BOLD, thus allowing improved visualization of brain regions bordering high susceptibility gradients. Indeed, Jann and colleagues (2015a) showed that CBF-based FC analysis revealed greater connectivity of the DMN in the prefrontal cortex compared with BOLD, in agreement with findings by Tak and colleagues (2013). It was also found that the amplitude of low-frequency fluctuation (ALFF) computed from CBF time series was significantly different across RBNs and subjects (Fig. 4). The advantage of CBF ALFF compared with BOLD ALFF is that the former provides an absolute measure of the magnitude of temporal fluctuations in ml/100 g/min, facilitating the comparison of ALFF across studies and populations.
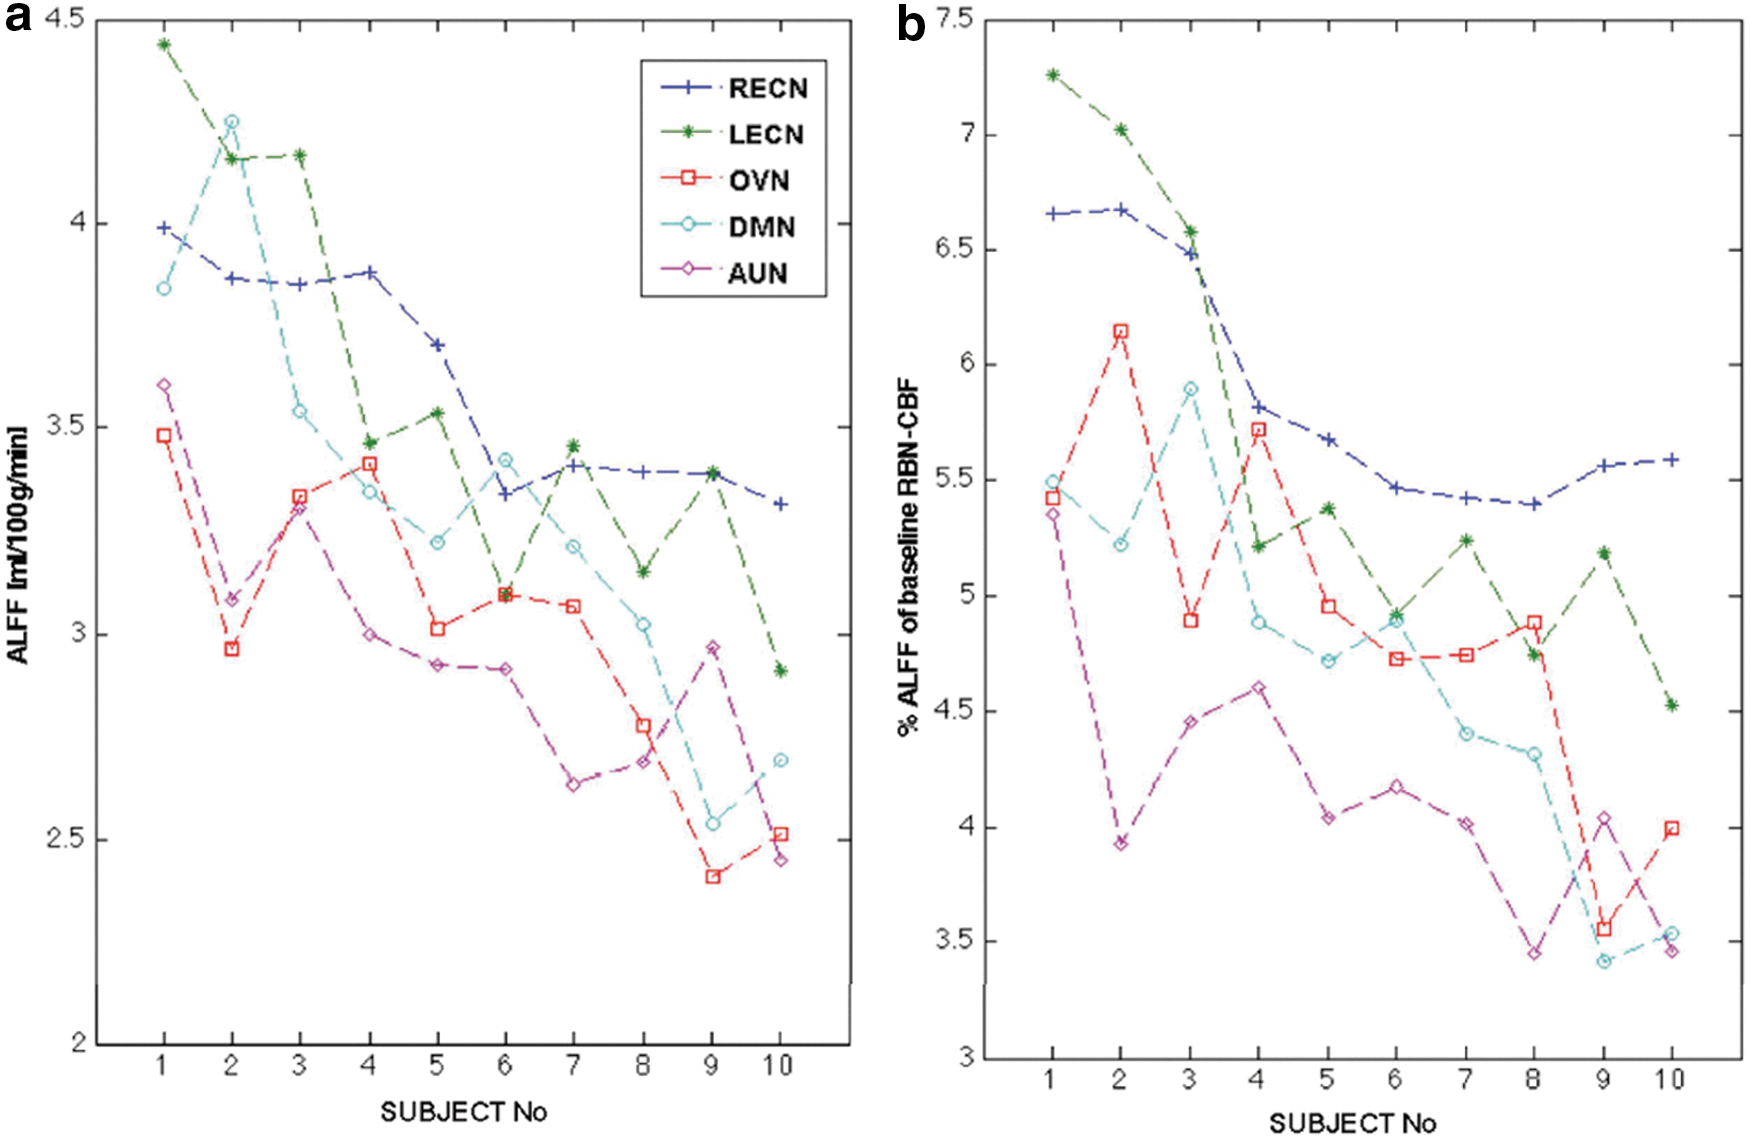
The relationship between CBF-based amplitude of low-frequency fluctuation (ALFF) and simultaneously measured resting perfusion [Figure reprinted with permission from Jann et al. (2015a)].
In addition to seed-based FC and ICA, the whole-brain CBF connectome has been explored using graph theory analysis. Liang and colleagues (2013) detected small-world network properties in CBF-based connectome and further found that nodal connectedness and centrality of BOLD connectivity are nonlinearly correlated with resting perfusion.
In principle, as ASL depends on vascular water exchange with tissue, it is inherently more heavily weighted toward the microvasculature than conventional BOLD (Wong et al., 1997), which typically emphasizes large veins. In addition, CBF is linearly related to cerebral oxidative metabolism (CMRO2), unlike BOLD. Furthermore, ASL can be used to provide quantitative CBF information, whereas BOLD is for the most part a relative measure. These factors indicate that in theory, CBF measurements are more representative of underlying neuronal activity.
In practice, CBF measurements are generated through some form of subtraction and are associated with significantly lower SNR compared with BOLD. This reduction in SNR may, in part, undermine the accuracy of quantitative CBF estimates. Moreover, the SNR disadvantage may lead to reduced sensitivity for neuronal events (Perthen et al., 2008) and may potentially have led to the lower reliability scores in CBF-based FC measurements (Jann et al., 2015a; Viviani et al., 2011). This may be exacerbated by ASL's need for longer TRs compared with techniques such as slice-accelerated BOLD (Wang et al., 2015), limiting the statistical power of CBF-based FC for a given acquisition duration. These are indeed concerning areas for future efforts. Nonetheless, the ASL family of techniques possesses several potential advantages over BOLD. First, while the resting-state BOLD signal is well known to exhibit a 1/f noise spectrum, the postsubtraction ASL noise spectrum is nearly flat, precluding biases introduced by autocorrelated noise (Wang et al., 2003). By the same token, the subtracted ASL time series is potentially less sensitive to motion and low-frequency drift effects (Liu et al., 2002), as well as low-frequency physiological noise. Likewise, CBF data may also be less biased by low-frequency physiological noise (Chang et al., 2009; Chang and Glover, 2009b; Golestani et al., 2015), which can account for up to 20% of the resting-state BOLD signal. Nonetheless, these advantages require further experimental verification in this rapidly evolving domain.
In summary, the ability to robustly capture spontaneous CBF fluctuations using ASL has opened up the enticing possibility of mapping CBF-based resting-state FC. Thus far, efforts in this direction have been successful, but have also raised issues in signal preprocessing and interpretation. For instance, due to the relatively low temporal resolution of ASL scans, perfusion time series from multiple subjects are often concatenated, for instance, in a group ICA (Jann et al., 2013, 2015a). In addition, as CBF and BOLD provide complementary information, it is appealing to combine ASL and BOLD for characterizing spatiotemporal and quantitative properties of specific brain networks, as proposed by a few recent studies (Jann et al., 2013; Zhu et al., 2013). Furthermore, joint CBF- and BOLD-based FC analyses offer mutual validation of findings using each modality, thereby improving confidence for statistical inferences. On the other hand, cross-modality differences in connectivity maps also drive the search for the neurovascular mechanisms underlying resting-state connectivity.
Explaining Resting-State BOLD Through Resting Perfusion
Approximately 80% of the brain's energy budget is allocated to resting-state neuronal activity and energetics (Shulman et al., 2004), of which CBF is a well-established surrogate measure. Thus, in the context of defining the mechanisms underlying rs-fMRI-based FC measurements, resting perfusion offers a unique insight regarding resting brain function. The association between resting CBF and FC may initially have been drawn from empirical observations that resting perfusion often appears to be elevated in regions exhibiting strong FC in BOLD rs-fMRI (Zou et al., 2009), for example, the DMN (Buckner, 2010; Di et al., 2012; Greicius et al., 2003). Such empirical observations were verified by several recent studies (Jann et al., 2015a; Li et al., 2012a, b), although not all such studies showed similar results (Viviani et al., 2011). The majority of these studies reported positive correlations between regional resting CBF and FC strength (either BOLD or ASL FC) (Fig. 5). Furthermore, this relationship has been found to be spatially heterogeneous and to be modulated by pharmacological agents in healthy individuals (Khalili-Mahani et al., 2014). Recent reports suggest that FC and CBF jointly represent the degree of optimization for a region to perform efficient processing of information and the metabolic cost associated with that processing (Tomasi et al., 2013). Thus, knowledge of the FC-CBF relationship provides complementary information on the brain's baseline functional organization.
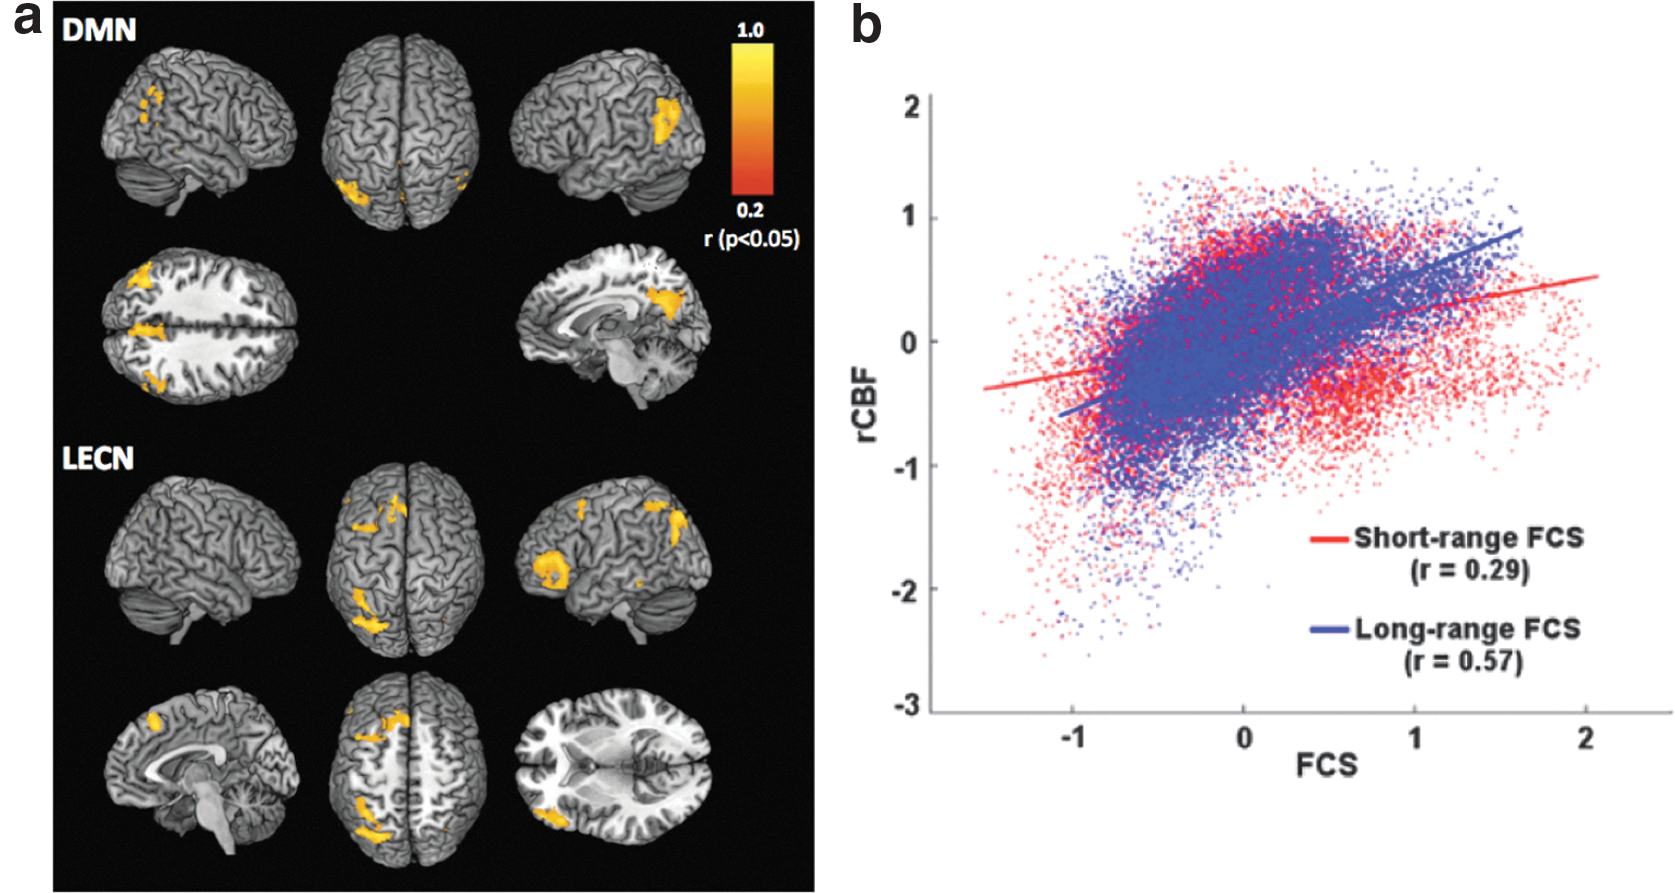
Links between FC and resting perfusion.
Both perfusion and FC, as well as their interactions, are found to be altered by disease (Kindler et al., 2015). For instance, a study in patients with Alzheimer's disease showed a lower CBF and FC in nodes of the DMN that were correlated with cognitive performance. Furthermore, medical treatment resulted in improvements in both measures, accompanied by reductions in disease severity (Li et al., 2012a). Hence, resting-state BOLD FC analysis, like its task-based counterpart (Liu et al., 2012), will likely benefit from including global and regional CBF for a better understanding of the interindividual variability, specifically in clinical populations where alterations in both parameters have been observed.
It is worth noting that negative associations between network CBF and FC have been reported in white matter (Aslan et al., 2011) and were explained with the hypothesis that more efficient networks with stronger FC require less energy, hence lower CBF, to maintain their function. The hypotheses for both positive and negative associations between CBF and FC require further evaluation. Finally, in addition to FC, other commonly used rs-fMRI metrics such as the ALFF and regional homogeneity have also been associated with regional perfusion. Both were found to correlate with resting CBF in the majority of cortical regions (Li et al., 2012b).
In summary, having demonstrated that network-specific CBF measurements are highly reproducible across time and scanners (Jann et al., 2015a), regional resting CBF is an important imaging marker that complements FC for characterizing resting brain function. To take the understanding of FC further, dynamic CBF will likely be required to probe the neurovascular physiology underlying resting-state BOLD.
Assessment of Resting-State Neurovascular Physiology
A better understanding of the neurovascular mechanisms underlying resting-state BOLD signals is a necessity to draw conclusions regarding brain function and metabolism from rs-fMRI data. The ability of ASL techniques to measure dynamic BOLD and CBF fluctuations simultaneously (Fukunaga et al., 2008; van Gelderen et al., 2005; Weber et al., 2013; Wu et al., 2009a) has made it possible to begin probing resting-state brain physiology.
This is an attractive but ambitious use of ASL that is in its early stages of development and warrants more detailed methodological discussion. Since the dynamic information in ASL data becomes critical at every time frame, signal preprocessing requirements become more stringent. As a case in point, in resting-state CBF calculations, physiological denoising is typically not used. However, when examining resting-state dynamics, all sources of bias must be minimized in the ASL signal, thus denoising becomes much more important (Wu et al., 2009b).
The close relationship between BOLD and CBF during tasks was first established by earlier work by Davis and colleagues (1998) based on BOLD and CBF data acquired within the same session. This coupling was confirmed and further defined by Hoge and associates (1999) using interleaved BOLD and CBF measurements. As described by Hoge's deoxyhemoglobin dilution model, BOLD and CBF changes due to task are only linearly related when both are relatively low. Beyond this linear range, the BOLD signal may vary with CBF in a sublinear manner. In addition, the hemodynamic delay associated with BOLD is typically longer than that of CBF. While the earlier works focused on positive signal changes, negative BOLD and CBF changes were also found to vary linearly with one another by later neuronal deactivation studies (Shmuel et al., 2006; Stefanovic et al., 2005). These studies set the stage for the resting-state investigation of BOLD-CBF coupling.
One of the earliest works targeting BOLD-CBF dynamics using ASL is by Fukunaga and colleagues (2008) who aimed to monitor resting-state oxidative metabolism fluctuations through a BOLD-CBF ratio. BOLD and CBF data were simultaneously obtained using a custom-pulsed ASL technique. Further analysis was performed using regions of interest (ROIs) identified from regions displaying high resting-state time series correlations, and ROIs were placed in the visual, lateral temporoparietal, sensorimotor, and prefrontal cortices. Significant correlation was observed primarily in gray matter, and a linear relationship was found between BOLD and CBF in the resting state in all ROIs. A very similar linear relationship was observed under visual stimulation (Fig. 6a), implying that similar CBF-BOLD coupling underlies both intrinsic and task-induced brain activity. One potential caveat of this work is that the resting-state CBF fluctuations were normalized to the global mean instead of to the voxel mean ASL signal, introducing added variability and reducing the sensitivity of resting BOLD-CBF analysis. In fact, this background-suppressed pulsed ASL technique may bias the BOLD measurements, and the lack of a postlabeling saturation may lead to inaccurate CBF measurements. Moreover, no regional distinction was made when accounting for the delay between the BOLD and CBF time courses. Furthermore, while BS was used in the ASL acquisition, the CBF time series was not corrected for physiological noise.
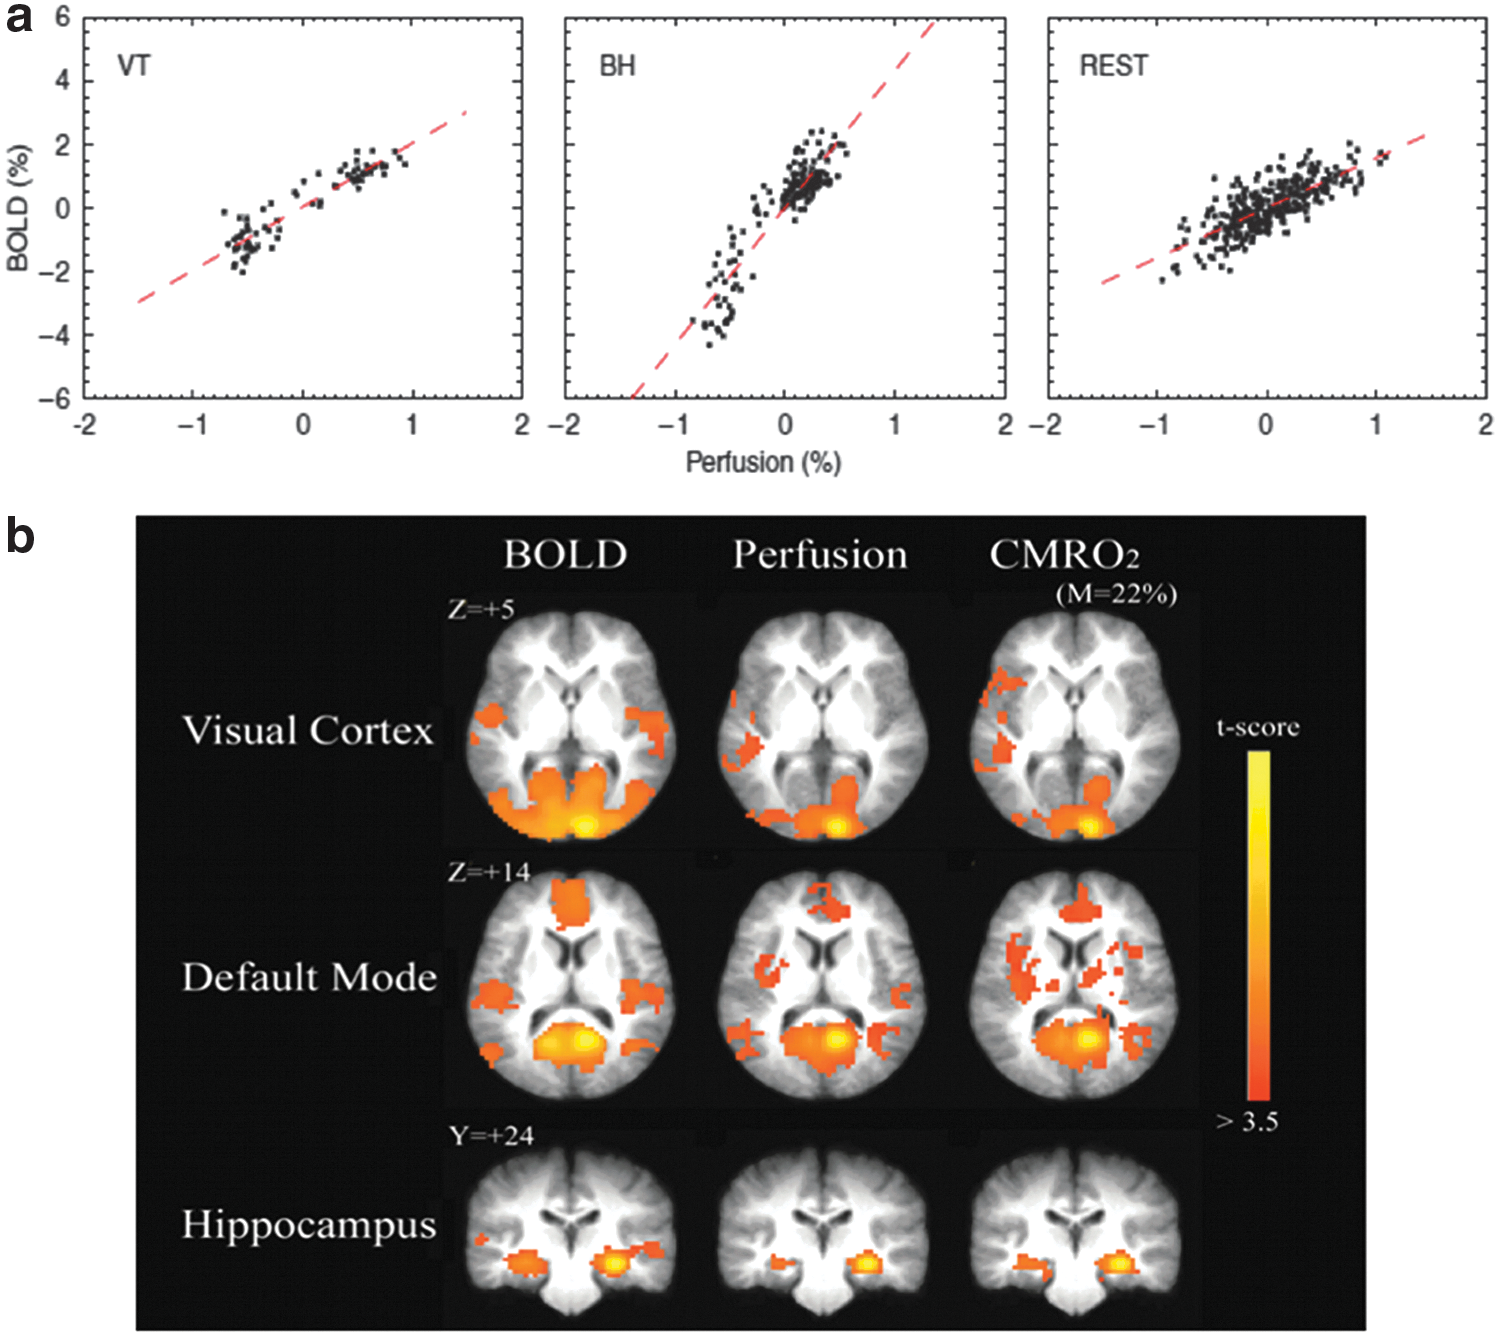
Measuring neurometabolic mechanisms of resting-state fMRI using ASL:
In a subsequent work by Wu and colleagues (2009a), pulsed ASL was used to obtain BOLD and CBF time courses. The PASL time series first underwent high-pass filtering to isolate the CBF component and low-pass filtering for the BOLD component, as suggested in Chuang and colleagues (2008). The CMRO2 time series were estimated from BOLD and CBF time courses by assuming the steady-state BOLD model with a fixed set of parameters for the entire brain. Sample resting-state time courses were taken from the visual, anterior cingulate, posterior cingulate, and hippocampal regions and are shown in Figure 6b. These regions were subsequently used as seeds in a resting-state connectivity analysis. This work aimed to demonstrate once again that the resting-state dynamic relationship between BOLD and CBF can be approximated as linear. Compared with prior work by Fukunaga and colleagues (2008), Wu and colleagues used a more complete ASL preprocessing approach, hence reducing the effect of CBF normalization bias mentioned earlier. However, physiological noise was not explicitly removed from ASL data, introducing potential uncertainty in the neuronal specificity of the BOLD-CBF relationship. The resting-state CMRO2 connectivity patterns highly resemble those of CBF, which on the one hand may confirm the tight relationship between CMRO2 and CBF, but on the other hand may also simply suggest that the CMRO2 estimates are dominated by CBF variability in the model employed. As a potential cross-validation of these results, it may provide insight to estimate dynamic CMRO2 change directly using simultaneous CBF-CBV-BOLD measurements (Yang et al., 2004).
In recent work by Tak and colleagues (2014), we used dual-echo 2D-EPI pCASL to assess the biophysical relationship between resting-state fluctuations in BOLD and CBF across the human brain. In this study, in addition to the previously described techniques to minimize BOLD-CBF cross talk (Chuang et al., 2008), we also employed physiological noise correction in the tag and control ASL images individually (Wu et al., 2009b). Moreover, to maximize the specificity of the findings to neuronal activity, the influence of global cardiac and respiratory fluctuations was excluded from the observed CBF-BOLD coupling. This work showed resting-state BOLD-CBF coupling strength to vary across the brain and was incidentally stronger for the most robustly reproduced resting-state functional networks (Fig. 7c), including the medial prefrontal, intraparietal sulcus, inferior parietal lobule, and posterior cingulate regions. Moreover, this coupling appeared to be strongly modulated by local macrovascular content, being negatively associated with large vessel occupancy in the voxel (Fig. 7d). While these findings demonstrate the feasibility of an ASL-based approach for investigating rs-fMRI physiology, a clear knowledge of neuronal and non-neuronal origins of the rs-fMRI signal remains elusive (Peng et al., 2013).
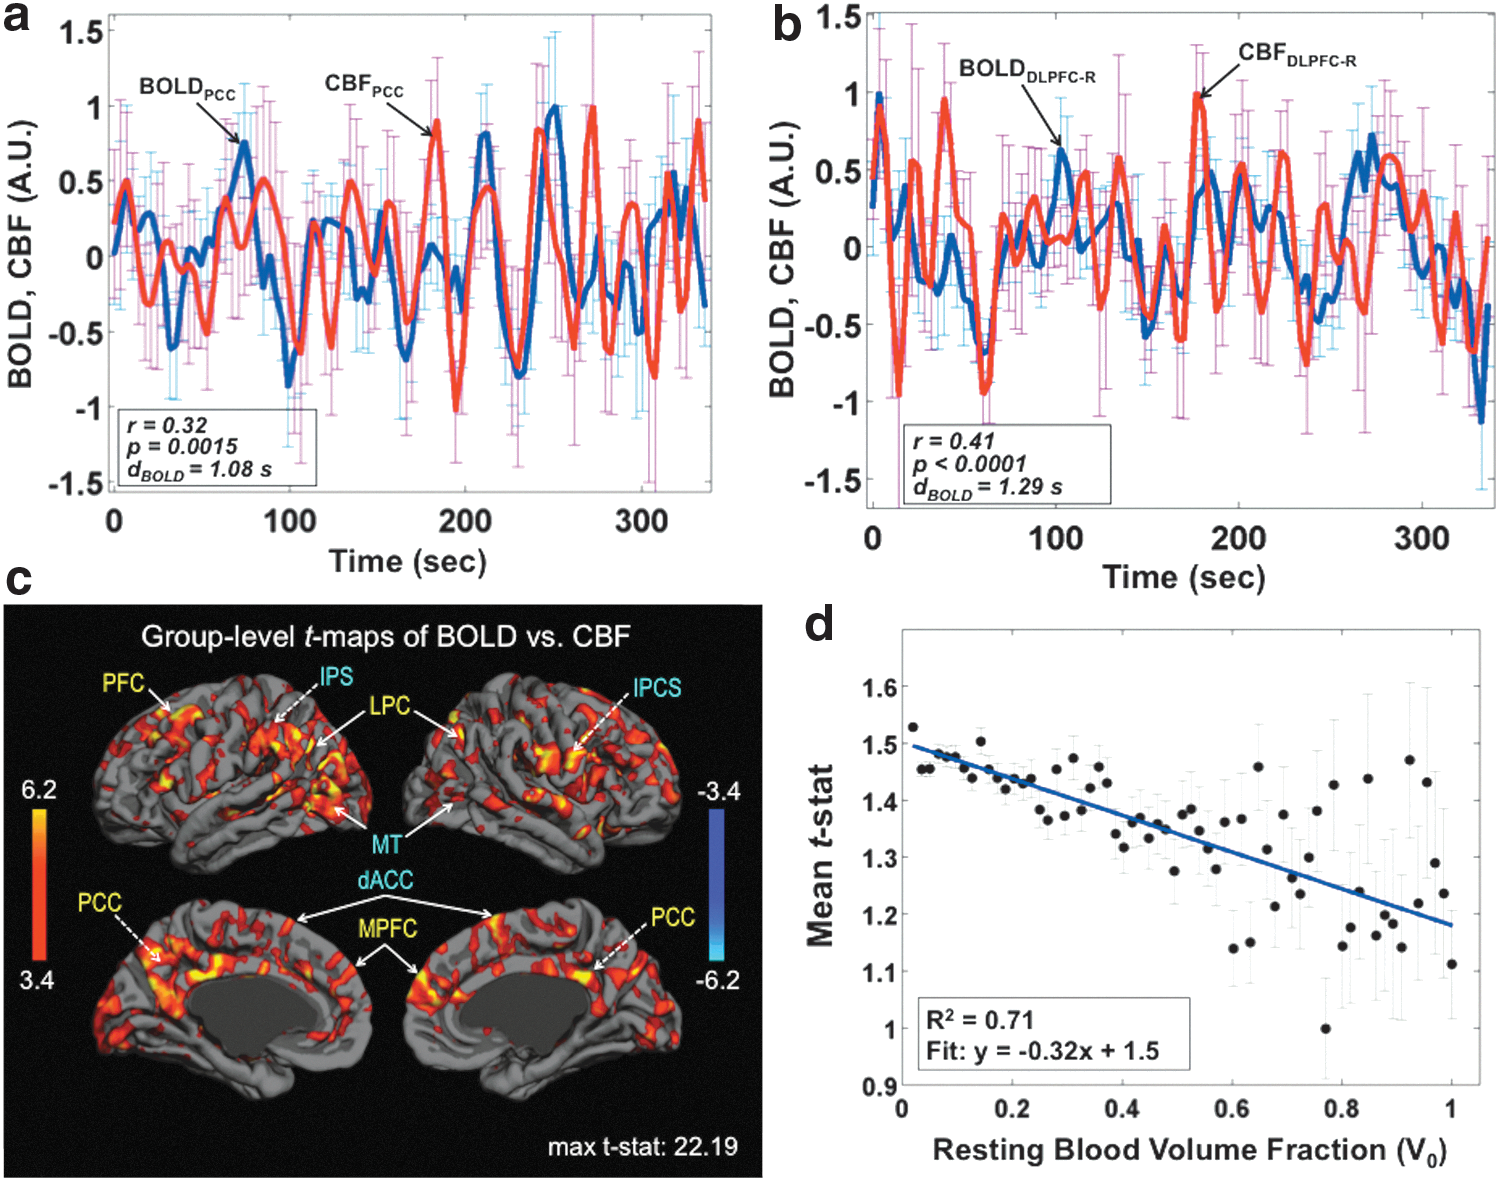
Spatial variability in the dynamic coupling between BOLD and CBF fluctuations in the resting state [adapted with permission from Tak et al. (2014)]. Sample time series corresponding to simultaneously acquired BOLD and CBF data in
Tak and colleagues' (2015) subsequent work took the CBF-BOLD coupling analysis one step further to examine the relationship between the degree of coupling and the corresponding FC measurements. The analysis demonstrated that resting-state FC strength, in this case based on the BOLD signal, is stronger in regions of stronger CBF-BOLD coupling (Fig. 8). This is the case within several major resting-state brain networks, including the default mode, dorsal attention, and primary motor-sensory regions. This finding complements a previous finding that CBF-BOLD coupling is stronger within the most robust functional network regions of the brain and further highlights the contribution of dynamic CBF fluctuations to BOLD FC. Future experiments may involve background-suppressed dual-echo pCASL for improved sensitivity to both BOLD and CBF contrast (Ghariq et al., 2014).
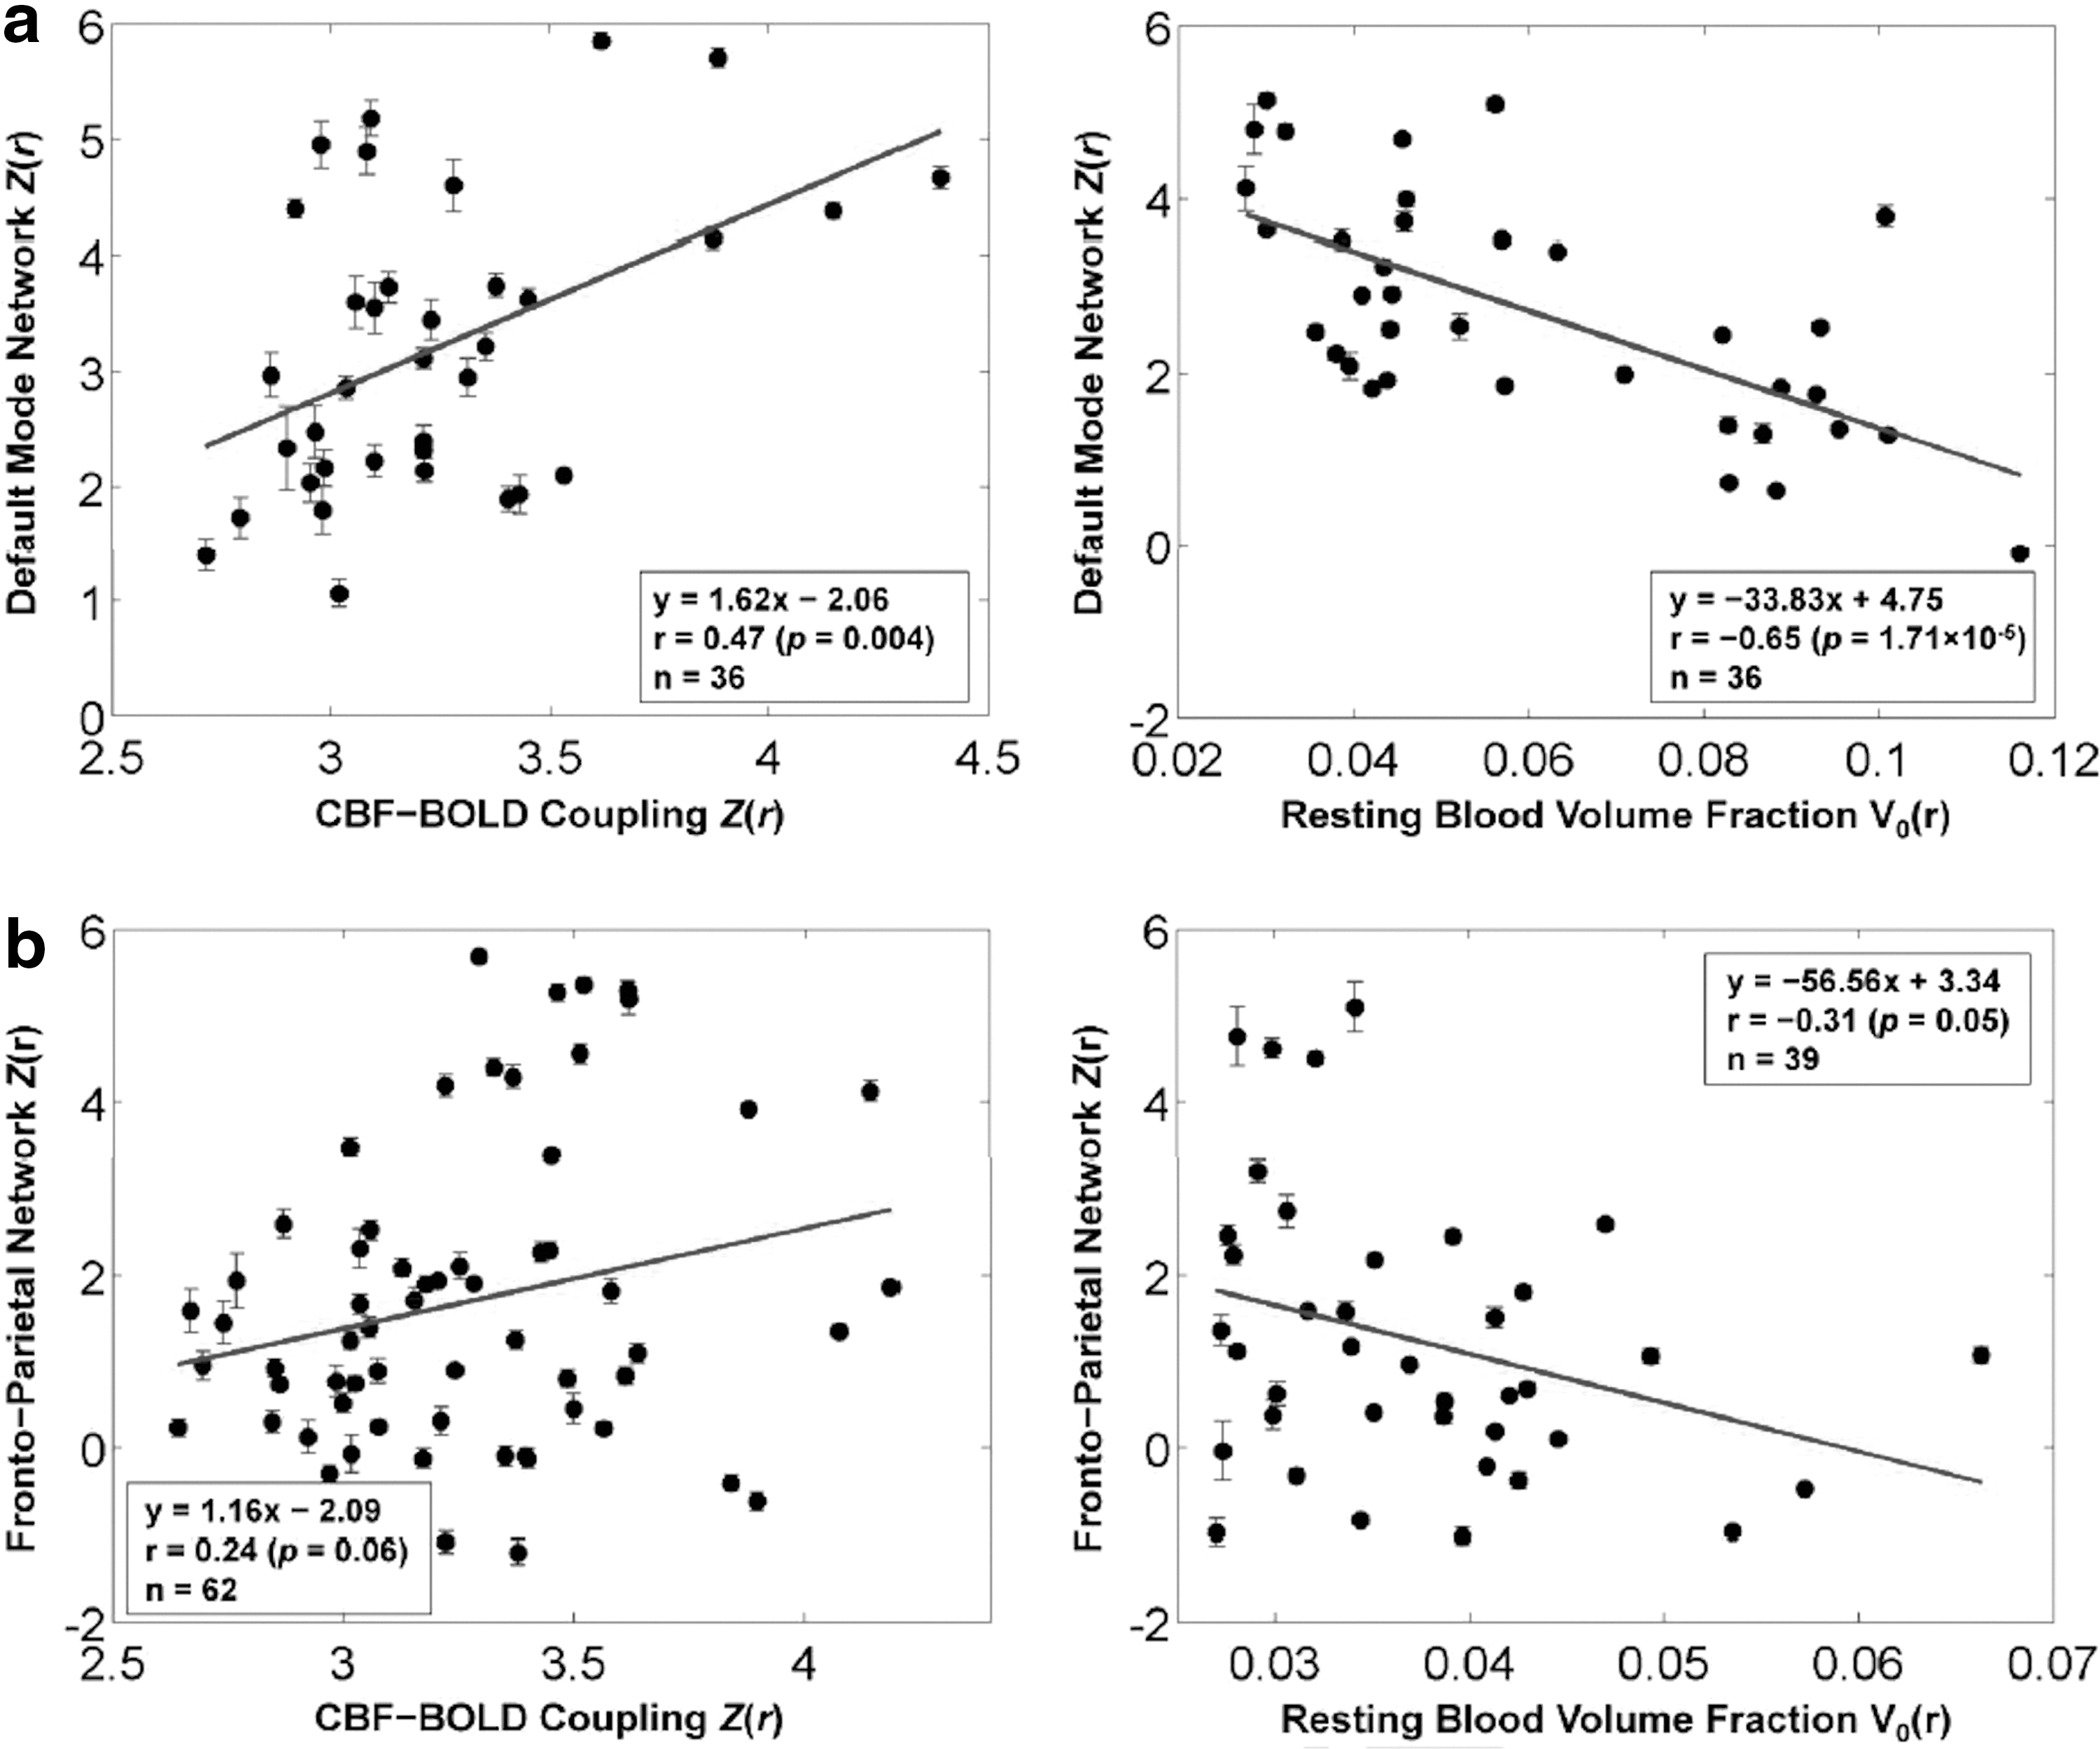
The relationship between dynamic CBF-BOLD coupling and BOLD-based FC [Figure adapted with permission from Tak et al. (2015)]. Resting-state FC strength, quantified in terms of z-scores, is significantly associated with the strength of CBF-BOLD coupling (also in terms of z-scores) shown here for two commonly observed networks:
In summary, the study of BOLD and CBF dynamics using ASL is a challenging but promising avenue of research. It offers the potential for accessing valuable information regarding the nature of resting-state activity that we are attempting to measure using fMRI. Most importantly, this new research direction could lead to innovative methods to assess brain health beyond FC, for instance, through the derivation of dynamic metrics based solely on resting-state temporal information.
Challenges and Future Directions
Effect of head motion and physiological processes in ASL-based FC
It has been shown that minimizing potential confounding influences of head motion and systemic physiological processes (e.g., respiration and heart rate) is essential for BOLD FC analysis (Chang and Glover, 2009a). Motion can be particularly concerning in pediatric, clinical, and elderly populations (Power et al., 2012; Satterthwaite et al., 2012; Van Dijk et al., 2012). Various strategies have been proposed, including scrubbing or censoring of corrupted images, regression of motion parameters, and/or global signals (Power et al., 2012, 2014; Satterthwaite et al., 2013). These methods are shown to be effective in alleviating, but not eliminating, the effects of motion on rs-fMRI.
In the case of ASL, the regression of noise components has proven to increase temporal SNR in the time series (Wang, 2012). However, the effect of head motion on perfusion-based FC analysis is complex and not well studied. Notably, similar areas seem to be affected by head motion in ASL (Jann et al., 2015b) and BOLD (Van Dijk et al., 2012). The pairwise subtraction of label and control images would magnify motion-related signal variation (SD) in the raw image time series by a factor of
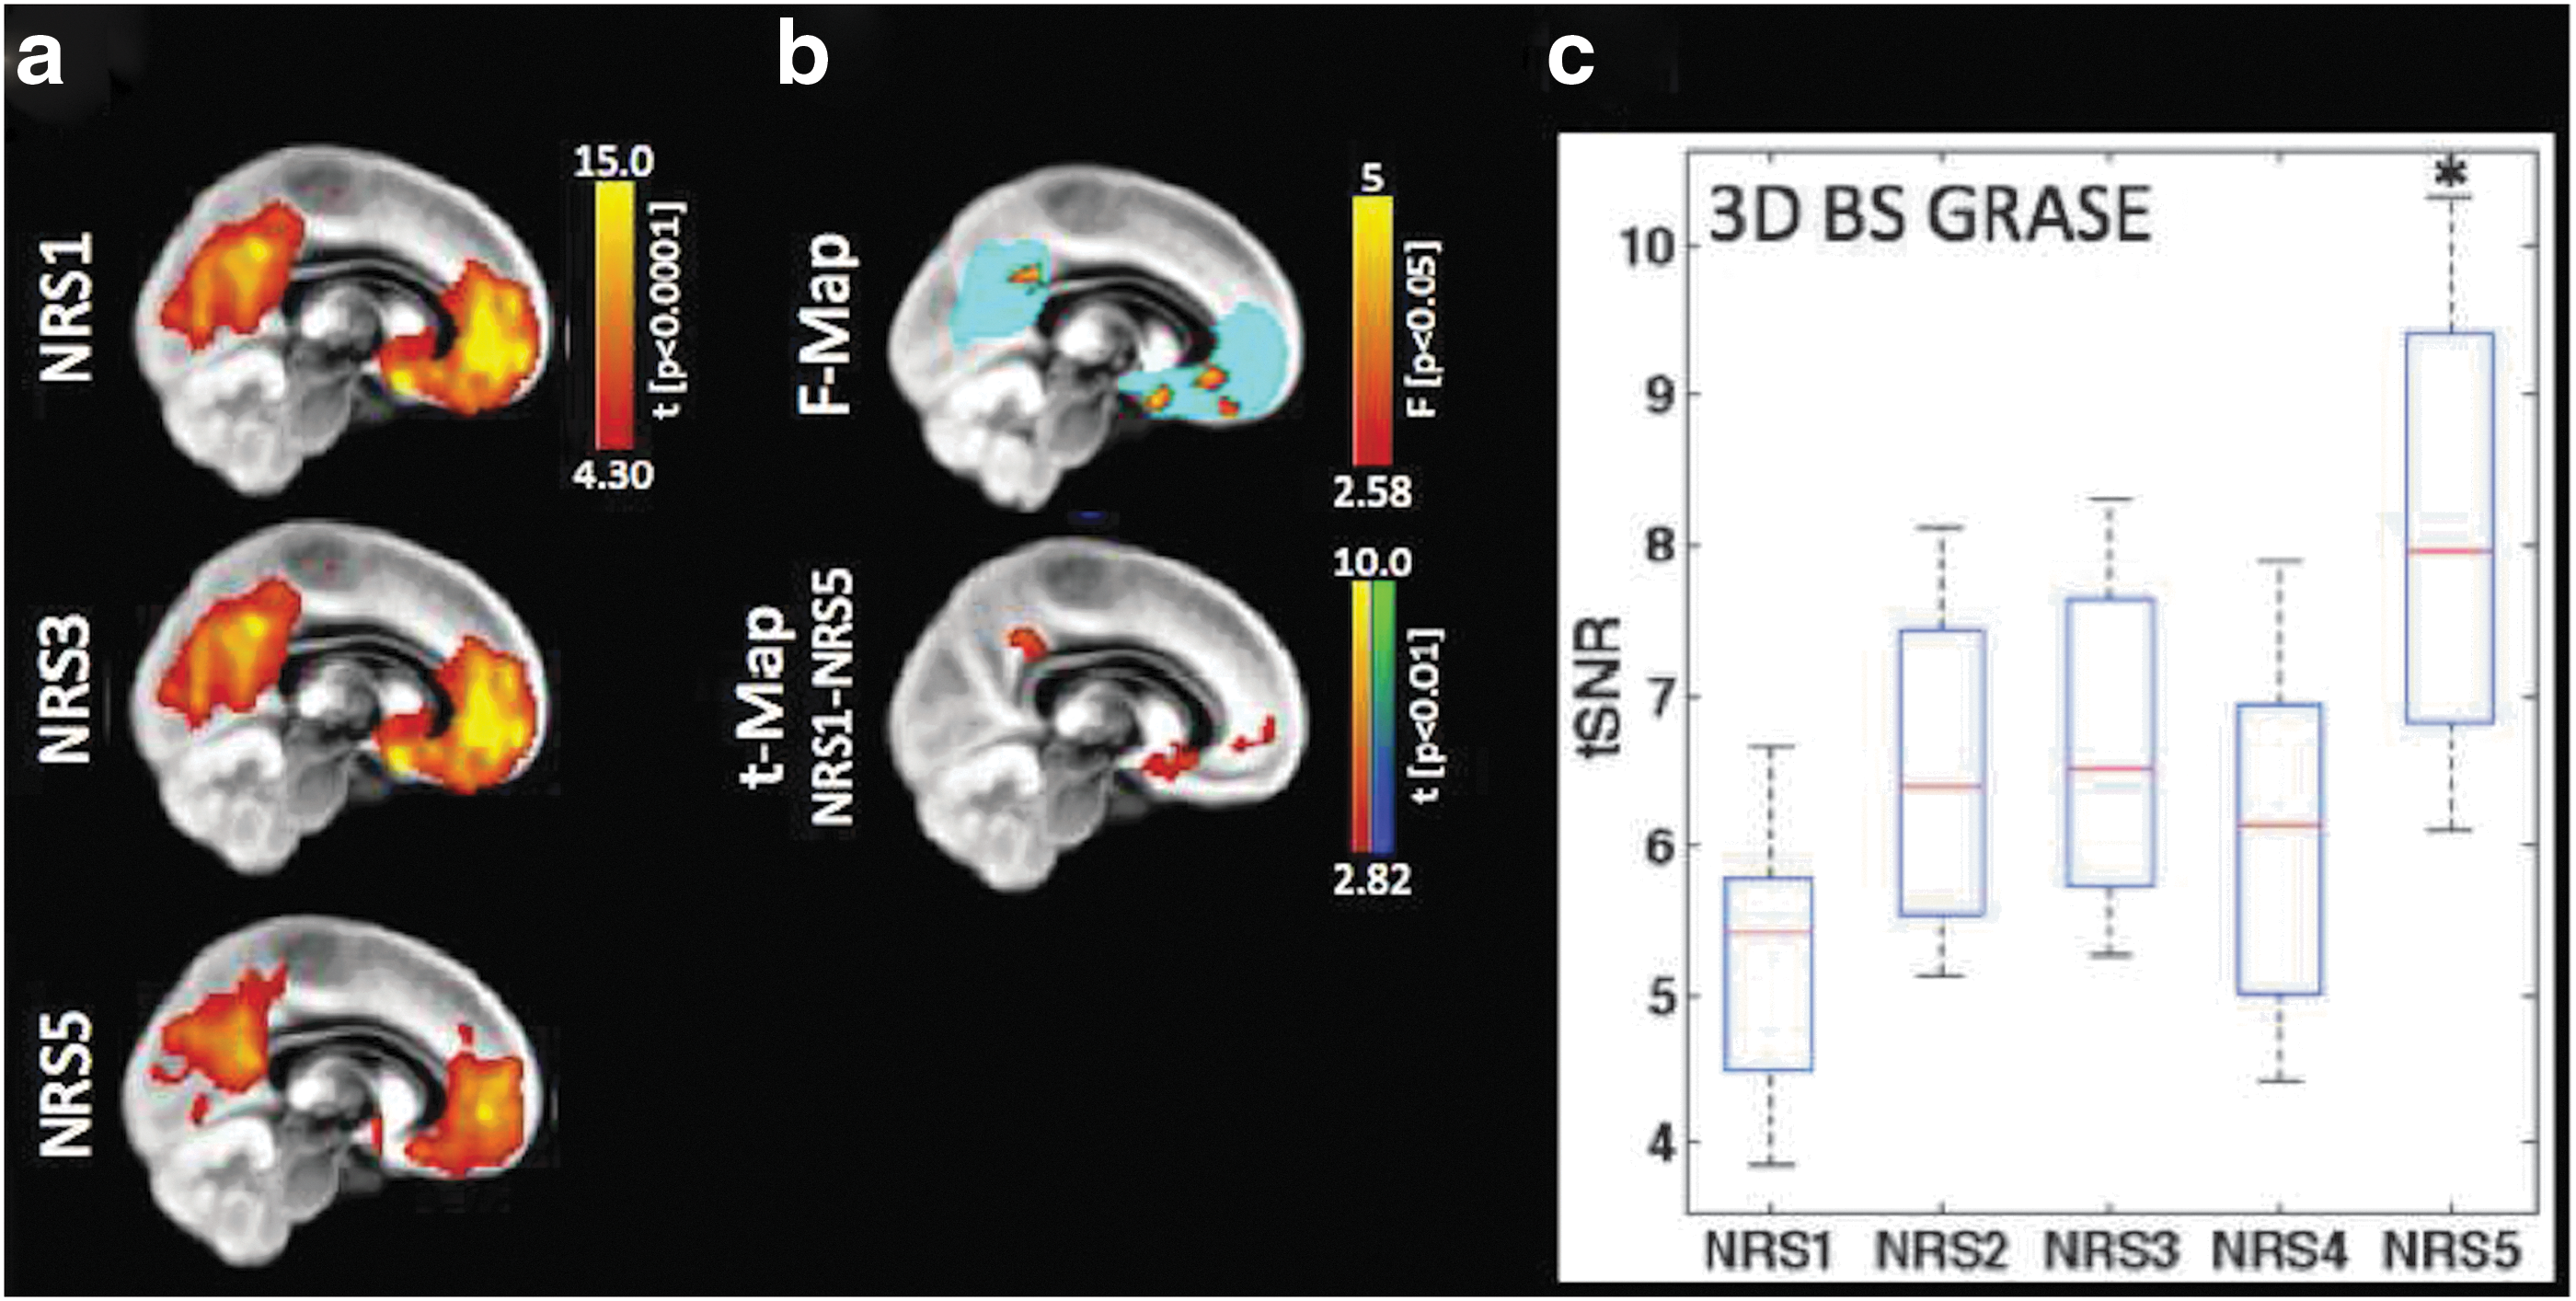
The effect of motion and noise regression strategies (NRS) on CBF-based FC calculations [Figure adapted with permission from Jann et al. (2015b)]. NRS1: no correction; NRS3: motion parameters regressed; NRS5: regressing out motion parameters plus fluctuations from white matter (WM)/cerebrospinal fluid (CSF).
Sampling requirements for ASL-based FC
Another main issue/challenge for perfusion-based rs-fMRI is the relatively low temporal resolution. Due to the pairwise subtraction of label and control acquisitions, as well as the requirement for a postlabeling delay, each perfusion image generally takes 6–8 sec to acquire, in contrast to the 1–3 sec required by conventional BOLD rs-fMRI. Past resting-state BOLD studies have demonstrated that increasing temporal resolution (Kalcher et al., 2014) and number of samples would enhance the detection of rs-fMRI networks (Olafsson et al., 2015), although the topography of the networks may not be influenced by the sampling rate (Niazy et al., 2011). Moreover, the strength and intersessional reproducibility of BOLD connectivity patterns are associated with different optimal scan durations (Birn et al., 2013; van Dijk et al., 2010).
Thus, with the aim of minimizing acquisition length given the low acquisition rate of ASL, the question remains—what ASL time series length would be adequate for the FC and dynamic analyses mentioned above? This issue remains to be systematically addressed in future studies.
Transit delay effects
Challenges and concerns regarding the integration of ASL as part of rs-fMRI studies have typically been concerned with the sensitivity and reliability of ASL CBF measurements, as well as measurement interpretation, especially in the presence of transit delay (Qiu et al., 2010; Wong et al., 1997). Promising alternative spin-labeling strategies such as velocity-selective ASL (VSASL) have been introduced to provide great transit delay immunity and spatial specificity (Wong et al., 2006). Based on the concept of velocity-selective labeling, VSASL has been validated against multidelay pCASL and ultimately xenon CT in patients with Moyamoya disease that would be associated with long transit delays (Qiu et al., 2012). General agreement has been achieved, although the correlation between VSASL and CT-based CBF measurements was moderate (r=0.55). Current implementations of VSASL result in reduced SNR compared with predecessors such as pCASL and may require compromises in spatial resolution (Qiu et al., 2012). The effectiveness of VSASL in rs-fMRI applications has yet to be examined.
While the exact impact of transit delay depends on the choice of ASL imaging parameters (e.g., postlabeling delay), past experiments indicate that arterial transit variability in ASL data can differ by up to 1 sec between gray matter regions (van Gelderen et al., 2008). The seed-based approach is by definition sensitive to uncertainty in transit delays, and synchrony between two delay-mismatched time courses may go undetected or be misinterpreted as being anticorrelated. ICA-based approaches employ higher-order statistics to isolate brain networks and are in theory less sensitive than seed-based approaches to transit time variability (Beckmann and Smith, 2004). However, in reality, sufficiently large transit time differences between regions can bias ICA results and create spurious networks (Calhoun et al., 2003). Given these considerations, delay-insensitive methods, such as those based on frequency analysis (Calhoun et al., 2003), cross coherence, and phase-locking measures (David et al., 2004), may provide less biased functional connectivity measurements in the presence of pronounced transit delays, such as observed in patient populations (Wang et al., 2013). Last, we note that these delay-related considerations are equally relevant for BOLD-based FC. Unlike for BOLD, however, delay effects on ASL CBF measurements can be reduced by optimizing imaging parameters.
ASL at ultrahigh field
ASL methods derive a dual benefit from high magnetic field strengths (Wang et al., 2002). In addition to increased sensitivity at high field, blood T 1 also increases, allowing more label to accumulate in brain tissue as well as increased postlabeling delay times to minimize arterial transit effects. The increased SNR can also be traded for higher spatial resolution. These advantages are complemented by the use of parallel imaging and array receiver coils (Wang et al., 2005). Recently, the feasibility of pCASL at 7 T has been demonstrated (Ghariq et al., 2012), expanding the horizon of ASL in new fMRI applications.
Multiband ASL
The literature reviewed so far is mostly based on ASL with nonslice-accelerated 2D EPI and 3D GRASE image acquisitions. High temporal resolution is particularly important for rs-fMRI applications of ASL, and recently, simultaneous multislice or multiband (MB) imaging has been attempted in ASL perfusion MRI, showing promise. MB techniques can be used to simultaneously acquire multiple slices using composite RF pulses (Feinberg et al., 2011; Kim et al., 2013; Li et al., 2014). Compared with standard 2D EPI-based ASL, MB-EPI ASL can reduce T 1 relaxation of the arterial label, improving spatial coverage and resolution with little SNR penalty. MB-EPI may also overcome the limitation of 3D GRASE in terms of spatial blurring caused by the T 2 relaxation during the long readout window. However, as an EPI technique, MB-EPI still suffers from geometric distortion and signal dropout from field inhomogeneity effects, especially at high and ultrahigh magnetic fields. Recently, a novel scheme was proposed for achieving high-fidelity distortion-free quantitative perfusion imaging by combining pCASL with MB-Turbo-FLASH (TFL) readout at both 3 and 7 T using the CAIPIRINHA technique (controlled aliasing in parallel imaging results in higher acceleration) (Wang et al., 2015). A comparison between MB-TFL and conventional EPI images is shown for 3 T (Fig. 10a, b) and 7 T (Fig. 10c, d). In particular, MB-TFL pCASL benefits from the additional use of BS to improve temporal SNR and minimize signal fluctuations (Fig. 10e, f). Therefore, MB-TFL pCASL with BS potentially offers the best alternative to 3D GRASE pCASL for perfusion-based rs-fMRI studies. A potentially even more appealing yet ambitious approach would see an integration of pCASL 3D acquisition and MB strategies for simultaneous multislab imaging to achieve high spatial and temporal resolutions for perfusion-based rs-fMRI.
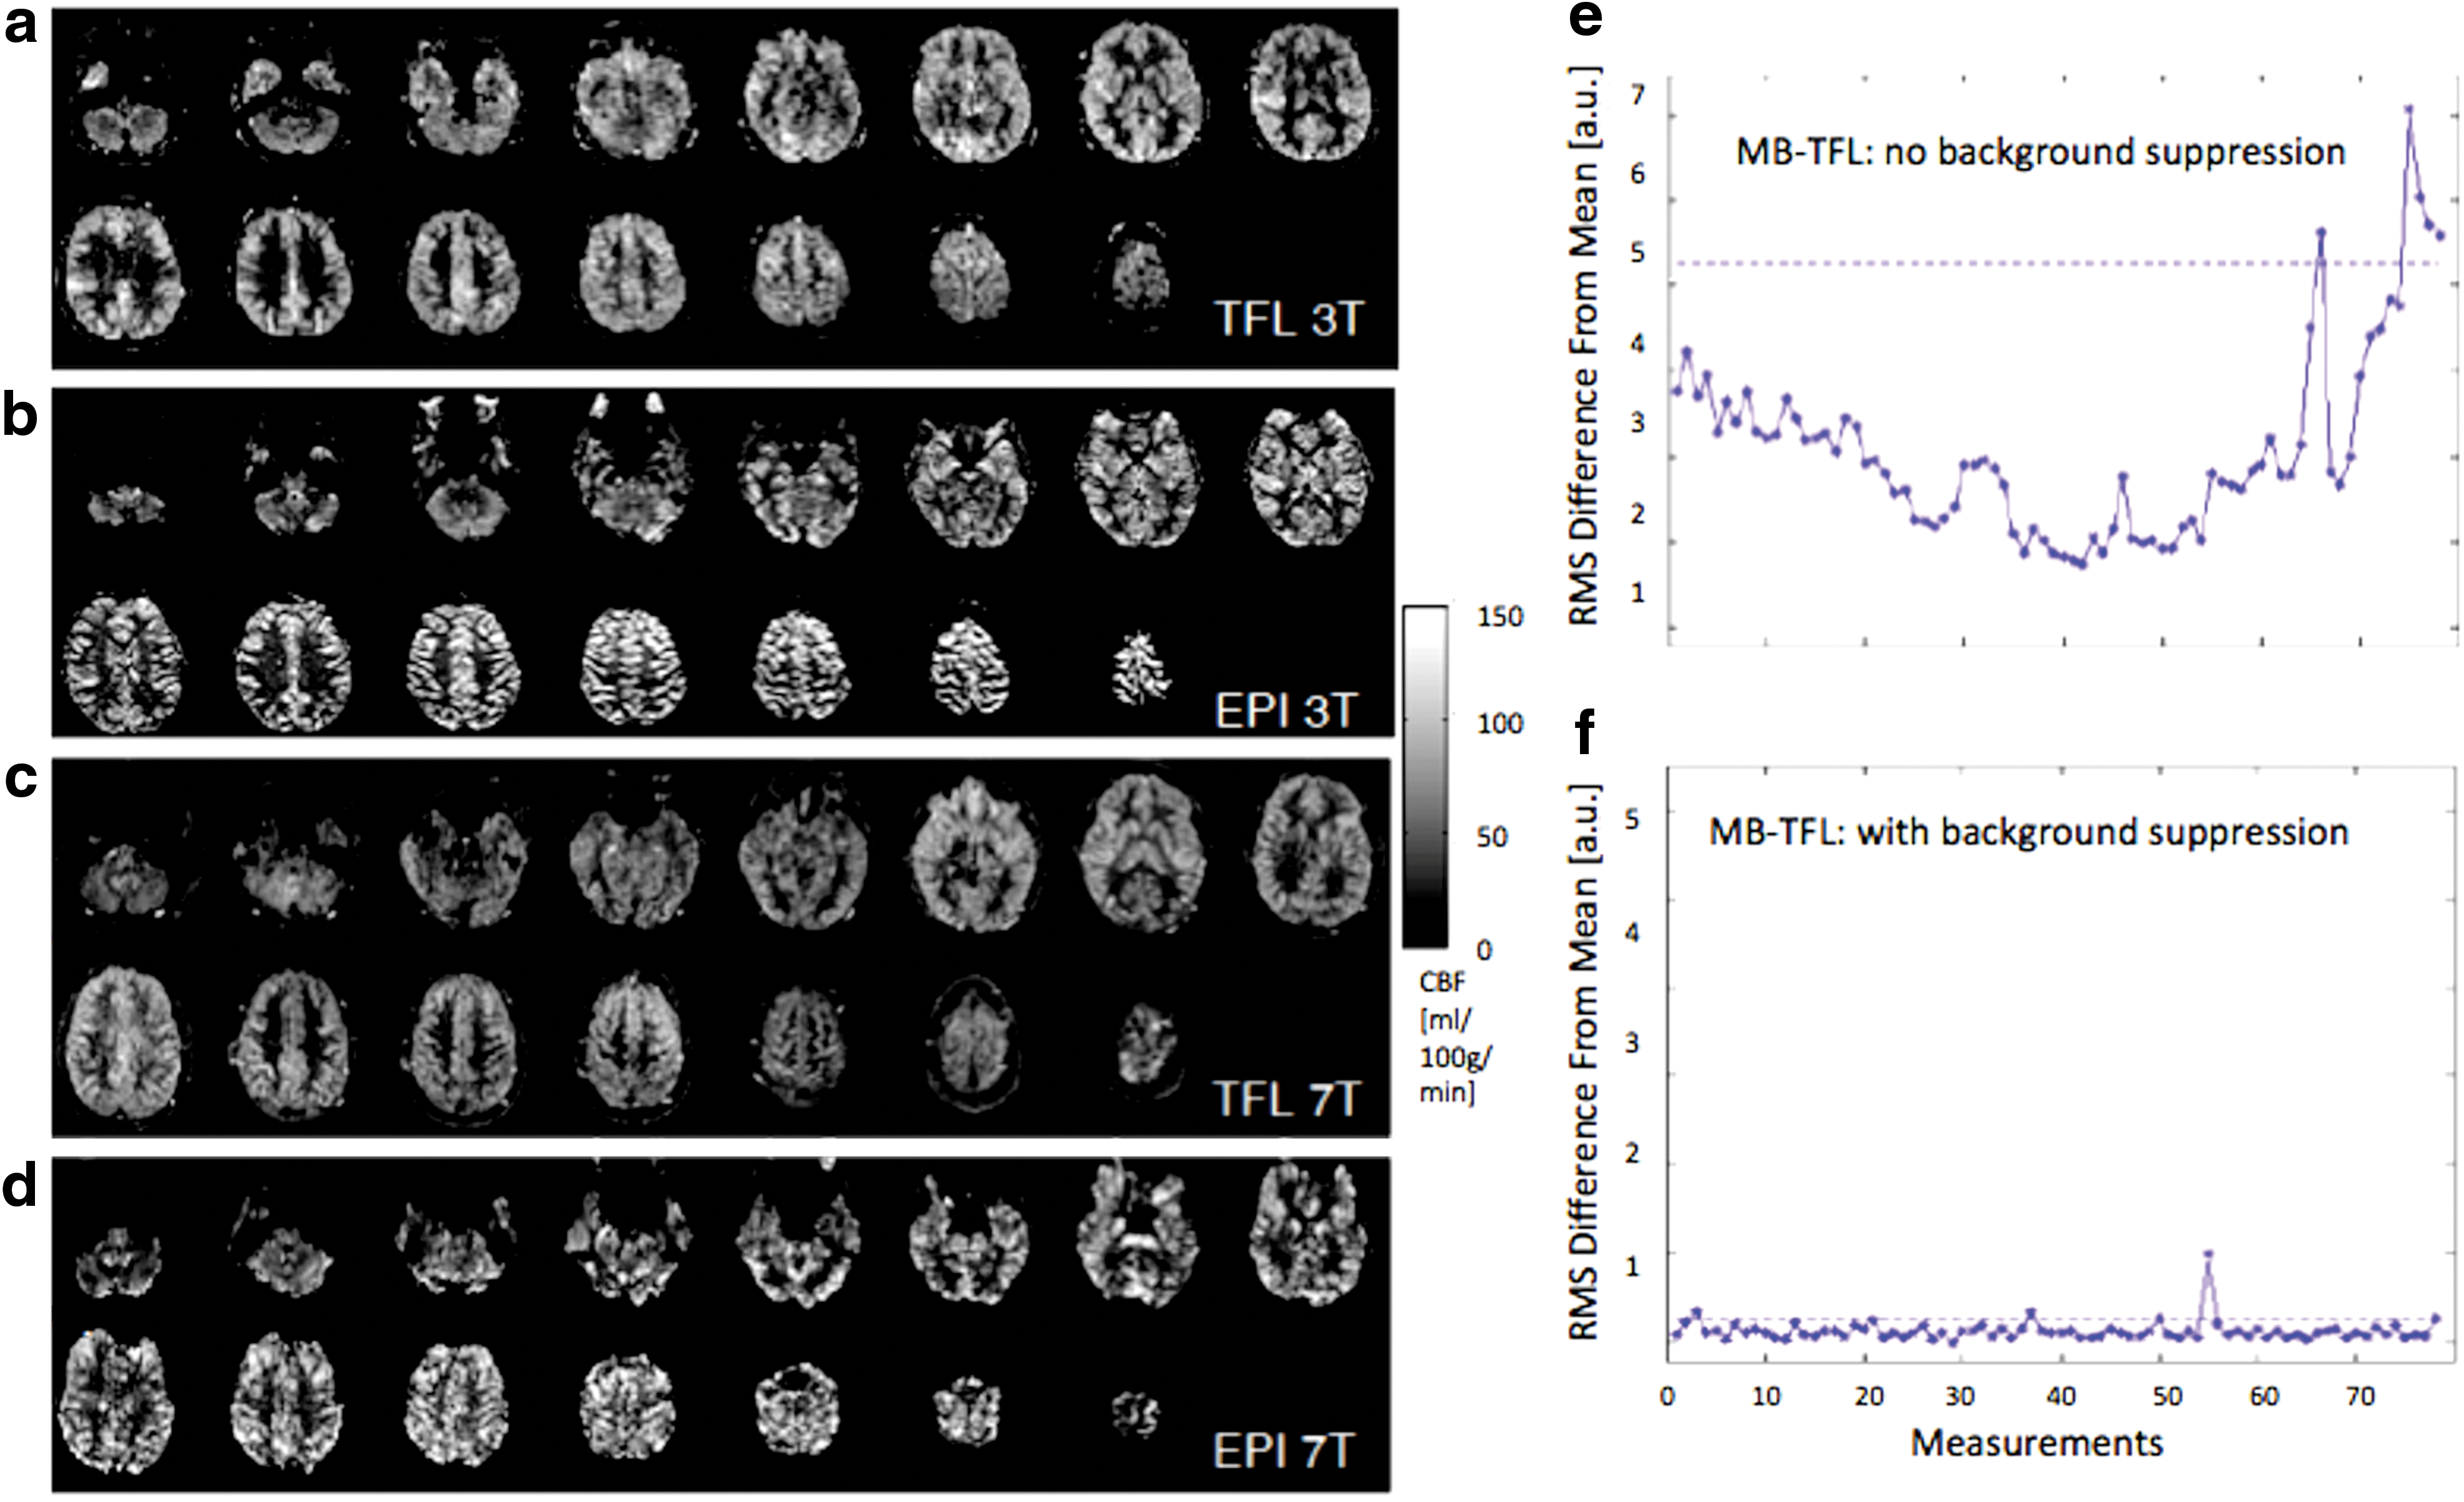
Slice-accelerated ASL acquisition for high temporal resolution [Figure adapted with permission from Wang et al. (2015)]. Shown here are sample CBF maps acquired using
Summary
ASL has experienced significant development in the past decade and its application has been rapidly expanding. While the majority of current ASL applications are confined to quantitative CBF mapping, several new avenues of application are rapidly emerging in assessing resting-state brain function. ASL is a powerful technique that offers multiple measures of brain function simultaneously. However, its appropriate application relies on an understanding of the physiology of the brain system being probed. In this review, we demonstrate the expanding role of ASL in neuroimaging applications, notably in investigating resting-state FC and CBF-BOLD coupling dynamics. While there remain technical challenges, ASL shows great promise in mapping the neurovascular and functional health of the resting brain, particularly as its versatile and noninvasive nature often make ASL the method of choice in the expanding realm of aging and clinical research.
Footnotes
Acknowledgments
The authors acknowledge the following sources of funding: Canadian Institutes of Health Research (App. 286286, J.J.C.), Natural Sciences and Engineering Research Council of Canada (App. 418443, J.J.C.), National Institutes of Health funds, P50 HD055784, R01-MH080892, R01-NS081077, and R01-EB014922, and California Department of Public Health Fund, CDPH 13-12008 (D.J.J.W.). K.J. has a fellowship funded by SNSF/SSMBS (grant no. 142743).
Author Disclosure Statement
No competing financial interests exist.