
Abstract
Objective metrics of technical performance (e.g., dexterity, time, and path length) are insufficient to fully characterize operator skill level, which may be encoded deep within neural function. Unlike reports that capture plasticity across days or weeks, this articles studies long-term plasticity in functional connectivity that occurs over years of professional task practice. Optical neuroimaging data are acquired from professional surgeons of varying experience on a complex bimanual coordination task with the aim of investigating learning-related disparity in frontal lobe functional connectivity that arises as a consequence of motor skill level. The results suggest that prefrontal and premotor seed connectivity is more critical during naïve versus expert performance. Given learning-related differences in connectivity, a least-squares support vector machine with a radial basis function kernel is employed to evaluate skill level using connectivity data. The results demonstrate discrimination of operator skill level with accuracy ≥0.82 and Multiclass Matthew's Correlation Coefficient ≥0.70. Furthermore, these indices are improved when local (i.e., within-region) rather than inter-regional (i.e., between-region) frontal connectivity is considered (p = 0.002). The results suggest that it is possible to classify operator skill level with good accuracy from functional connectivity data, upon which objective assessment and neurofeedback may be used to improve operator performance during technical skill training.
Introduction
N
Advances in functional neuroimaging technology have made it possible to monitor operators in more realistic settings and track evolution in brain behavior that accompanies motor skill level learning. To this end, there have been an increasing number of research studies focused on studying evoked cortical response to complex motor behavior in the context of open and minimally invasive surgery (MIS) (Bahrami et al., 2011; Duty et al., 2012; Leff et al., 2008a, 2008b; Ohuchida et al., 2009; Zhu et al., 2011). In this study, we used functional near-infrared spectroscopy (fNIRS), which has raised increasing interest in recent years for performing less constricted, hence more naturalistic, neuroscience experiments (Rodrigo et al., 2014).
Previous studies have exposed skill level-related differences in brain behavior and longitudinal changes in cortical excitation in line with technical skill level acquisition (Leff et al., 2011). For example, data suggest that cortical responses may be skill level dependent (Leff et al., 2008b). Greater activation within executive control centers such as the prefrontal cortex (PFC) has been observed in novices and PFC excitation appears to attenuate following practice (Leff et al., 2008a). In a study with 18 subjects, decreasing ratios of oxygenated hemoglobin were observed in supplementary motor area (SMA) and preSMA when learning a motor skill (Hatakenaka et al., 2007). Similarly, a decrease in cortical activation of the sensorimotor cortex was reported during the learning of a multijoint discrete motor task (Ikegami and Taga, 2008). This is commensurate with evidence that reorganization of brain function (i.e., neuroplasticity) accompanies motor skill level learning, such that operator skill level may be best reflected in the magnitude of regional brain excitation or shifts in activation foci (Draganski and May, 2008; Halsband and Lange, 2006; Kelly and Garavan, 2005).
Investigations of highly complex motor skill levels such as MIS have failed to demonstrate differences between naïve subjects and expert operators (Ohuchida et al., 2009). One theory is that for highly complex motor tasks such as MIS that require 2D to 3D perceptual transformation and precise inter-manual coordination, skill level-related disparity may manifest as differences in frontal lobe connectivity rather than changes in activation per se. This can be deduced from the cortical network differences reported by Sun and colleagues (2007) across early and late motor learning states, as well as the variations in cortical connectivity presented by James and colleagues (2013) during skill acquisition for a surgical task.
While longitudinal changes in network topologies have previously been studied in surgical learners, cortical interactions have only been tracked over days (James et al., 2013) and not months or years. In this study from our group (James et al., 2013), changes in the network cost across days of the practice were found among subjects of similar skill level.
One advantage of evaluations that incorporate master operators is that they facilitate interrogation of motor plasticity as a result of repeated practice of a technical skill level over many years. Indeed, few studies have investigated learning-related changes in connectivity across such timescales, and current reports are restricted to minutes or weeks (Coynel et al., 2010; Dayan and Cohen, 2011; Heitger et al., 2013; Heitger et al., 2012; Sun et al., 2007). Nevertheless, existing literature seems to suggest greater connectivity between frontal and cortical motor regions in early versus late learning (Sun et al., 2007) and longitudinal attenuation in functional integration in motor-related networks following extended practice (Coynel et al., 2010). Therefore, conceivably functional connectivity between associative and premotor regions may be expected to decrease in line with continued practice and increasing operator skill level.
Differences in functional connectivity may help discriminate operators based on their skill level. Classification of operator proficiency based on brain behavior may prove invaluable for objective assessment of technical skill levels, evaluation of trainee progress, and if interfaced with the operator or team, may improve performance or aid patient safety through cognitive biofeedback (Nan et al., 2012; Wang and Hsieh, 2013; Zoefel et al., 2011). While amplitude of the evoked response has been used for classification of operator states previously (Coyle et al., 2007; Naito et al., 2007; Power et al., 2012), there have been no such reports in surgeons. Indeed, while differences in amplitude signal change in executive control and motor cortical regions related to surgical skill level have been previously observed (Leff et al., 2008b; Ohuchida et al., 2009), it has not been possible to discriminate operators' performance based solely on these signal characteristics.
Classification of operator proficiency based on functional connectivity data represents a nontrivial high dimensionality problem, for which conventional statistics are ill-posed to solve. Machine learning (ML) techniques such as least-squares support vector machine (LS-SVM) generate predictive models that can discriminate data based on the complexity of multivariate relationships such as those arising from functional connectivity.
In this study, we aim to investigate and discriminate operator skill level during laparoscopic (keyhole) surgical maneuvers using brain connectivity derived from evoked optical imaging responses. Specifically, we employ optical topography (OT) to monitor operator brain function during a highly complex surgically relevant motor task (i.e., keyhole surgical suturing).
We hypothesize that frontal lobe connectivity in associative (prefrontal) and premotor seed regions will decrease in line with increasing operator experience. Functional connectivity computed from 1-sec epochs of filtered oxygenated and deoxygenated hemoglobin signals (HbO2 and HHb, respectively) was used to classify operator skill level. Additionally, analysis of the discriminatory performance of local (within-region) and inter-regional connectivity was performed. To facilitate this comparison, a single metric of performance named Multiclass Matthew's Correlation Coefficient (MMCC) (Jurman et al., 2012) was employed. The results demonstrate that ML-based discrimination of operator skill level is feasible and accurate, upon which educators may capitalize in the form of neural feedback training.
Materials and Methods
Experimental setup and neuroimaging data acquisition
Local Research Ethics Council approval was obtained (05/Q0403/142). Participants were screened for handedness (Oldfield, 1971), gender, and neuropsychiatric illness. Participants abstained from consumption of alcohol and caffeine for 24 h before the study date (Orihuela-Espina et al., 2010). Thirty-two right-handed male surgeons were recruited from the National Health Service (NHS) and Imperial College London to perform a complex visual-spatial task, namely simulated laparoscopic suturing (LS) (i.e., keyhole surgical stitching), in a box trainer (i-SIM; iSurgicals). The cohort included 12 novices (with no prior experience of MIS, mean age 22.4 ± 1.6 years), 11 trainees (limited MIS experience of less than 50 cases involving LS, mean age 33.8 ± 2.9 years), and 9 expert consultants (minimum of 50 independent cases requiring LS, mean age 42.7 ± 3.6 years).
Participants were required to perform the task thrice as per the fundamentals of laparoscopic surgery curriculum (FLS) (FLS, 2015). Statistical analysis on the FLS was performed using Kruskal–Wallis (KW), followed by Dunn's Test (DT) for multicomparisons. During each of the three sessions, the surgical procedure was segregated sequentially into three subtasks, namely needle insertion, double-throw knot tying, and single-throw knot tying, as highlighted in Figure 1.
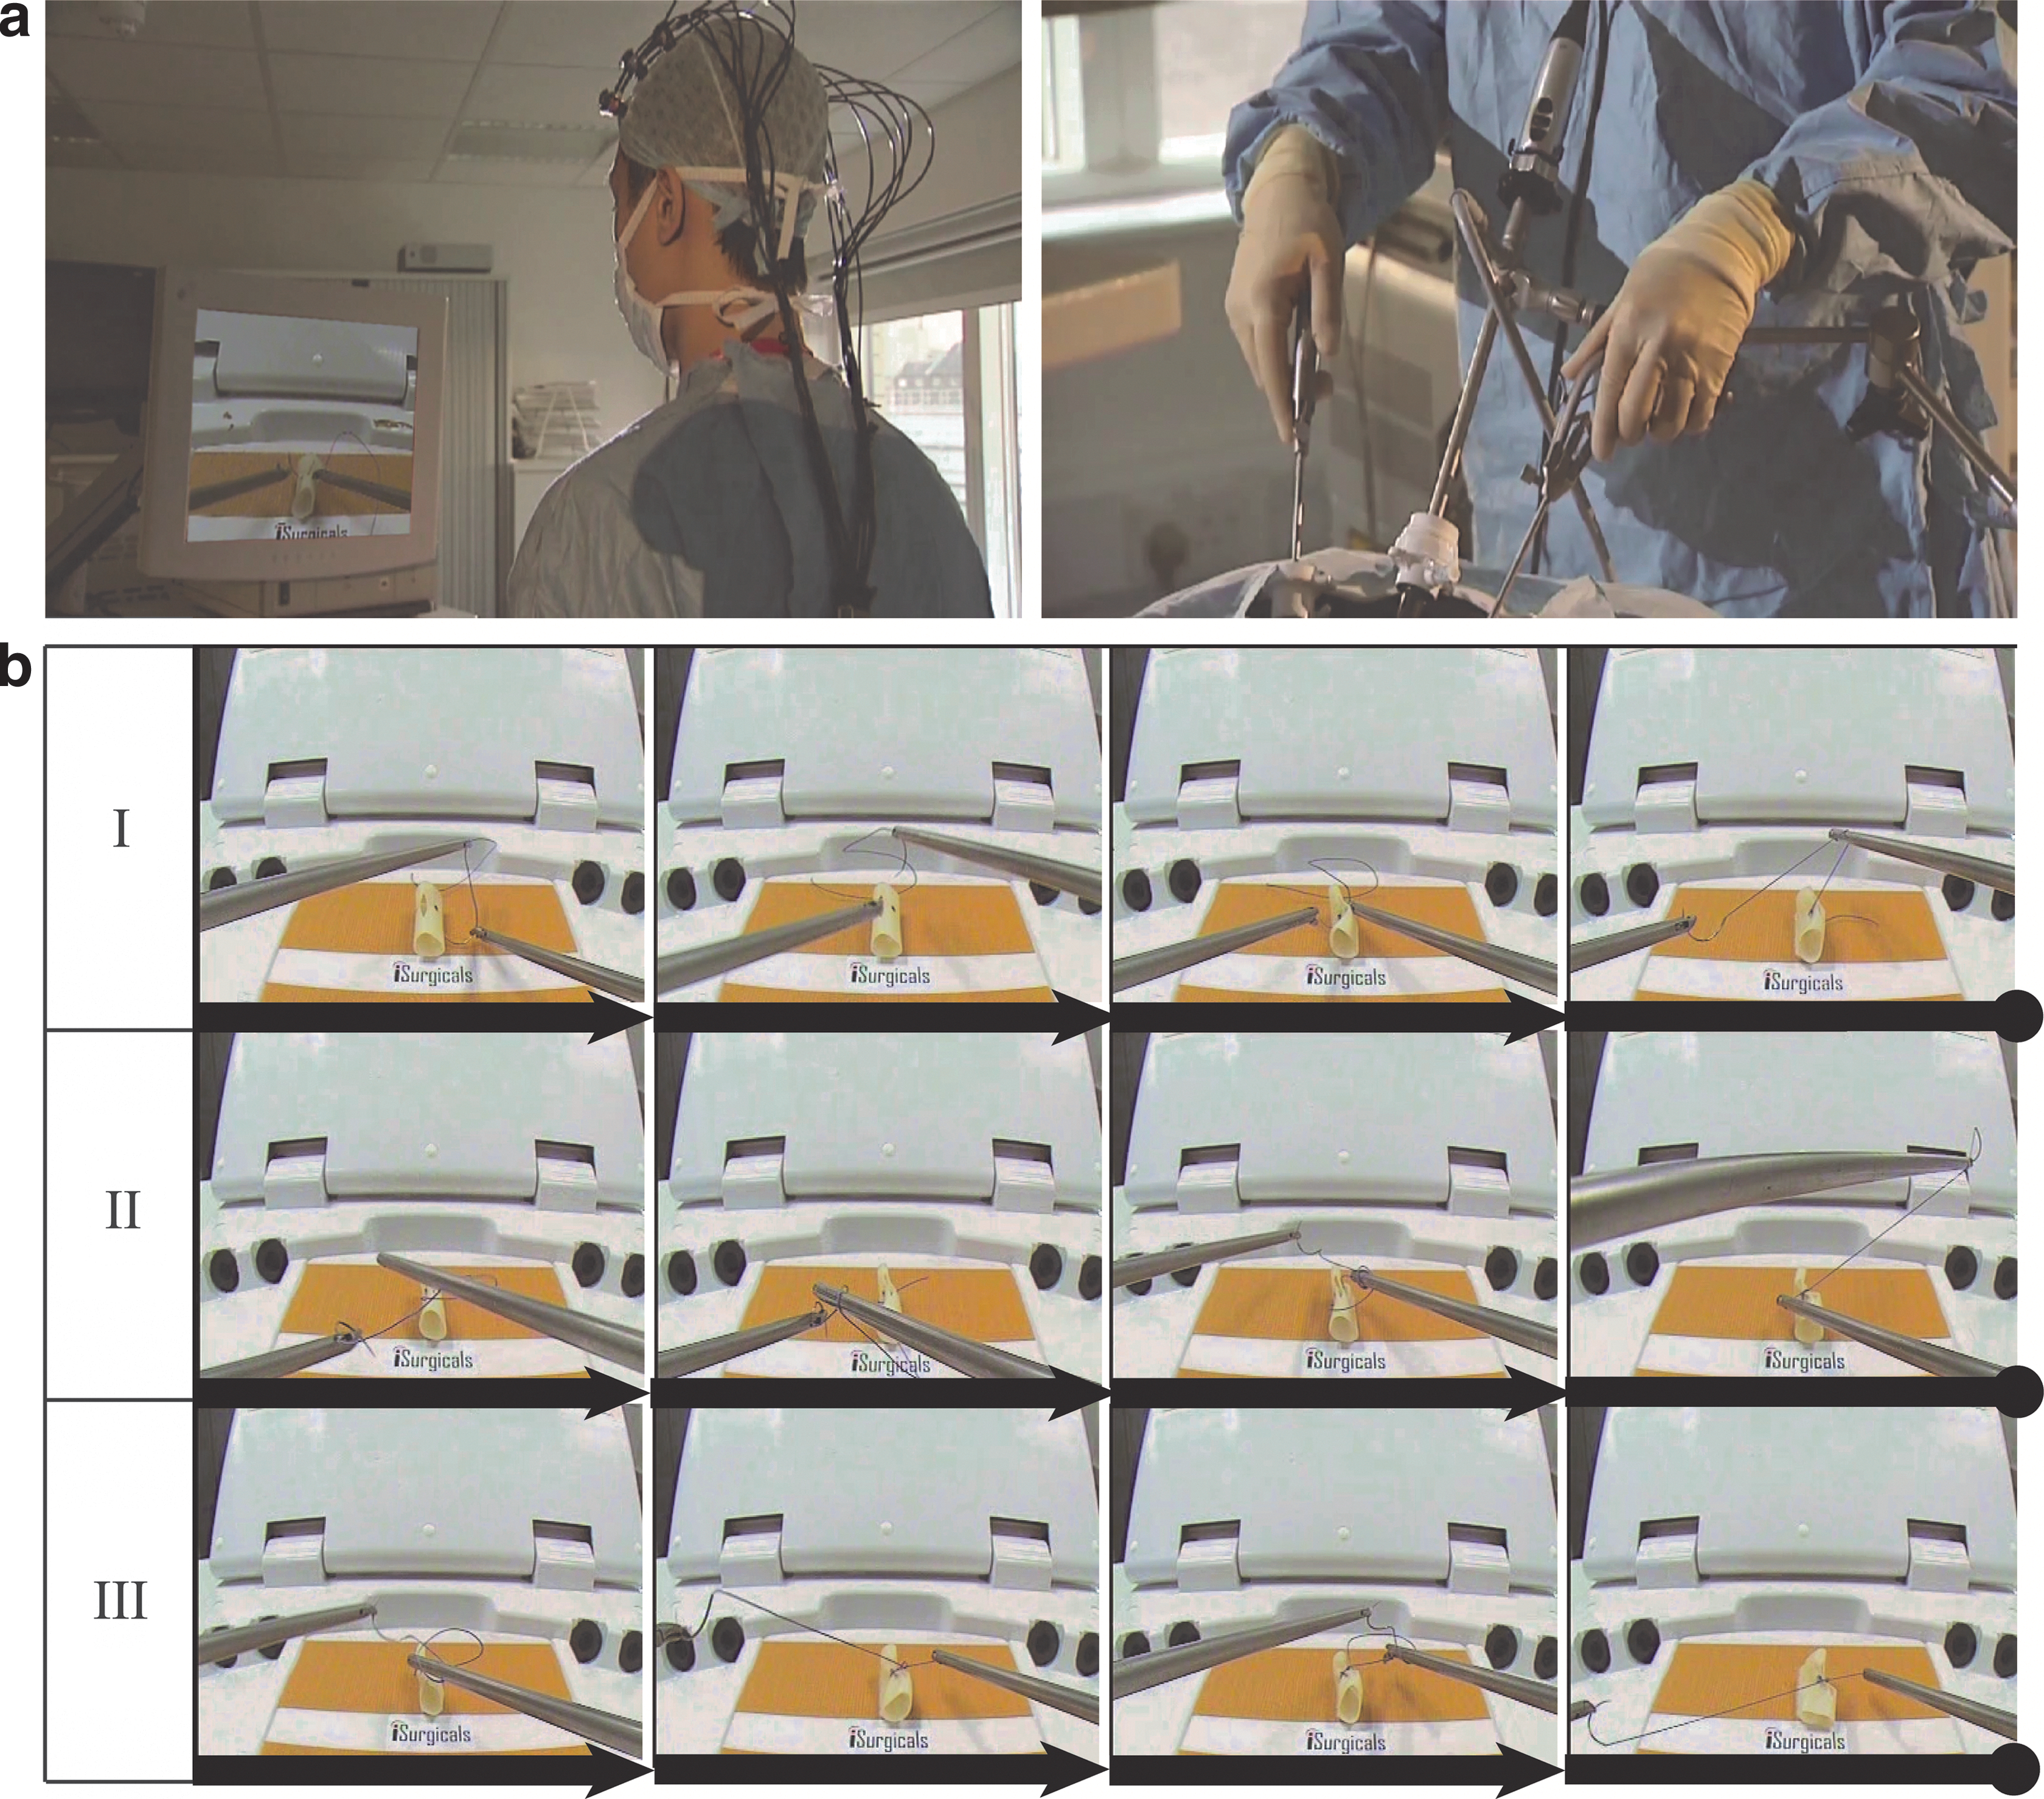
Before recording, the participants were allowed a brief familiarization session (15 min). The experimental design consisted of a sequence of continuous episodes of baseline motor rest (30 sec), subtask phases during which given LS maneuvers were executed (variable time i.e., self-paced), and intertrial recovery periods (40 sec). During the rest episodes, the participants were asked to remain still and regard the center of the monitor. Observable technical performance in LS was assessed by adoption of the FLS score [Score = 600–(time in seconds)–(penalties × 10)]. Penalties were measured as per needle entry and exit distance points from premarked points (mms), as well as gap between the edges of wound (mms), that is, an objective quantitative assessment. The derived score based on time and accuracy of performance was compared across experience groups using statistical tests of significance.
Cortical hemodynamic data were recorded at 10 Hz using a 44-channel OT system (ETG-4000; Hitachi Medical Corp). To capture functional behavior relating to motor skill level acquisition, channels were positioned over the PFC, premotor cortex (PMC), SMA, and motor cortex (M1) regions of the brain according to landmarks of the international 10-10 system (Jurcak et al., 2007) as illustrated in Figure 2.
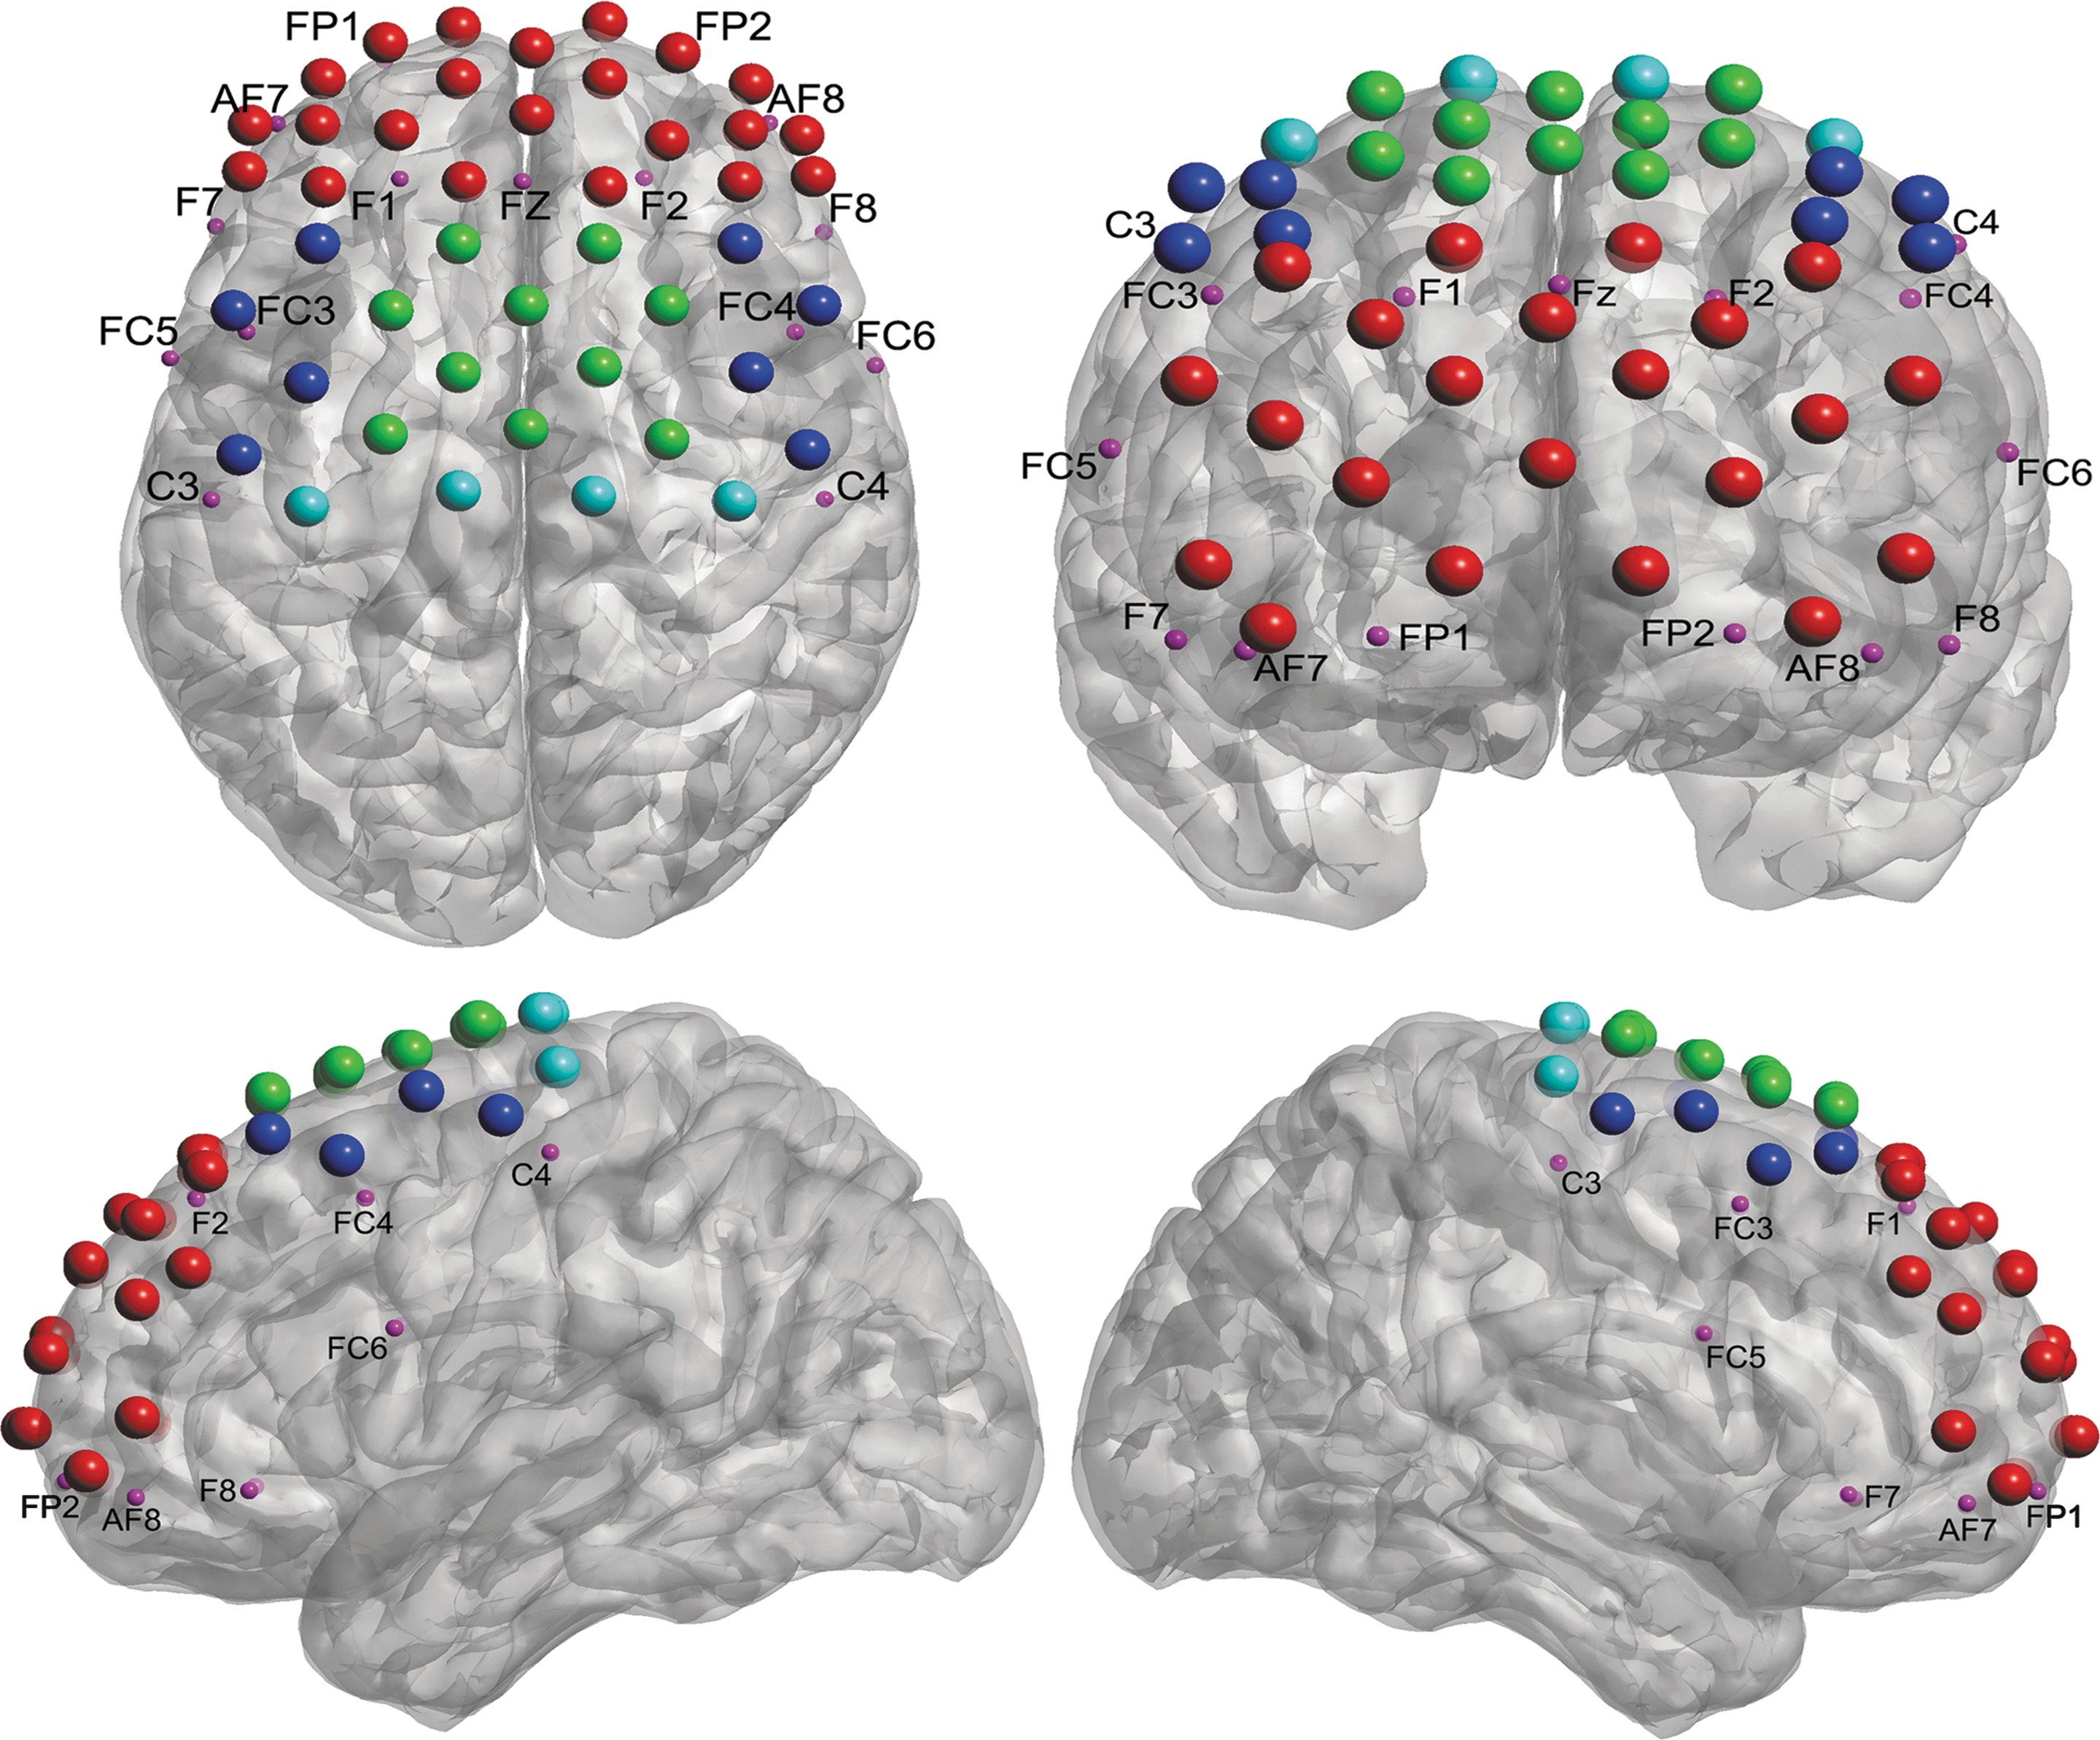
Registration of channel positions in MNI space, illustrating the approximate locations over the prefrontal cortex (red), supplementary motor area (green), premotor cortex (dark blue), and primary motor cortex (soft blue) relative to international 10-10 markers (magenta). Color images available online at
Optode positions were measured using a 3D digitizer. A stand-alone registration method was used to project NIRS probe positions into an MNI (Montreal Neurological Institute) coordinate space (Tsuzuki et al., 2012). As OT data may be influenced by changes in the systemic circulation (Obrig et al., 2000; Elwell et al., 1994), a portable electrocardiogram sensor was attached to the chest of each subject to continuously monitor the heart rate (HR) during the course of the experiment. Mean heart rate (MHR) and heart rate variability (MHRV) were extracted from the electrocardiogram sensor readings using R-R wave intervals. Statistical significance was computed using analysis of variance ANOVA over these measurements.
Denoising and filtering
For each channel of data, an average baseline was computed considering 10 sec of data before each task onset to allow for hemodynamic normalization after task offset. During this period, subjects were asked to refrain from any motion before task onset and not to engage in deliberate cognitive work. For each subtask, the first 6 sec of data were discarded, thereby allowing for the temporal delay between task onset and cortical hemodynamic change. At each channel, changes in the concentration of HbO2 and HHb were reconstructed from variations in light attenuation using the modified Beer–Lambert law (Delpy et al., 1988). To reduce systemic interference, the hemodynamic data were low-pass filtered, detrended for eliminating system drift, and integrity checked for eliminating noisy channels using Imperial College Neuroimage Analysis (ICNA) software (Orihuela-Espina et al., 2010).
Between-group differences in functional connectivity
The methodology for computing the between-group differences consists of the following sequential sets: (1) For every sample of hemoglobin data, the difference between the current value and the average baseline is computed. The resultant metrics are denoted by ΔHbO2 or ΔHHb. (2) ΔHbO2 and ΔHHb from channels belonging to the same region of interest (ROI) are grouped and averaged, resulting in (3) To obtain a single metric of interconnectivity, the Rv coefficients (Abdi, 2007; Josse et al., 2008) are calculated between the pairs of where we denote Rv coefficients with the function r, taking as inputs the mean-centered α and β matrices; and the indices ROI1 and ROI2 represent two distinct regions of interest. Once computed, Rv coefficients return values between 0 and 1 that can be interpreted as an approximation of the squared Pearson correlation coefficient (Abdi, 2007; Josse et al., 2008). (4) Fisher transformation is applied to the Rv coefficients yielding the Gaussian-distributed z scores. To obtain a single informational value, the z scores are averaged and the inverse Fisher transformation is applied, transforming the average back to its original Rv coefficient. The resultant average value is then considered as the inter-regional connectivity between two brain areas of a subject performing a given LS trial (session).
Statistical analysis of normalized z-scores for inter-regional connectivity was performed using the ANOVA test, followed by post hoc analysis using Tukey's honest significance difference (HSD).
ML from functional connectivity for operator skill level discrimination
Functional connectivity datasets for automated discrimination
Two subdatasets with different granularity are studied to classify operator skill level from fNIRS data: the session-based networks and time course-based networks. The former aims to classify operators based on data from an entire session, while the latter from every 1-sec time epoch within a session. Both are derived from the ΔHbO2 and ΔHHb readings of the original dataset captured at 10 Hz.
(1) Session-based networks: Rv coefficient is a scalar that determines the relationship of the joined signals, ΔHbO2 and ΔHHb, between two channels during a session (i.e., the duration of one trial). Each correlation matrix represents a session. Each element within the matrix corresponds to a scalar that represents the 2D relationship between two channels when jointly considering both signals of interest, namely ΔHbO2 and ΔHHb. The resulting dimensionality of the correlation matrix is 44×44, that is, one element for each channel, of which 22 are on the PFC, 10 are on the SMA, 8 are on the PMC, and 4 are on the M1.
(2) Time course-based networks: Due to the averaging used to construct an exemplar network across a whole session, some latent discriminatory information might be omitted. A short period connectivity network can be constructed using Spearman's correlations between channels, this time considering ΔHbO2 and ΔHHb separately. To increase the granularity, correlations are computed within 1-sec epochs across the whole session. Hence, each correlation matrix corresponds to a single epoch and each element within the matrix is a single correlation of either ΔHbO2 or ΔHHb between two channels. As a result, two 44 × 44 correlation matrices are generated, one for each hemoglobin species.
Classifier and parameter settings
For the analysis of the functional connectivity datasets, an LS-SVM with a nonlinear radial basis function kernel is used. In LS-SVMs, the parameters of the separating hyperplane are formulated as a closed-form linear system of equations (Gaonkar and Davatzikos, 2013; Suykens et al., 2002). The entire data are first divided into five cross-validation subsets and one is held out for testing. Before each test, optimization of the L2 internal regularization parameter is performed over a fivefold cross-validation process using only the training set. This prevents overfitting over the presence of irrelevant features. The optimization algorithm used is simulated annealing (Bertsimas and Tsitsiklis, 1993).
The present study is related to a multiclass problem (with K > 2 as the number of classes) since we aim to subclassify operator skill level into one of three groups (novices, trainees, and experts). Several binary LS-SVM models are trained and their outputs are later combined using a voting scheme. These individual binary LS-SVM models can be designed in two ways: (1) one class against the rest or one-versus-all (OVA), which requires training K large models; and (2) one-versus-one (OVO), where one binary LS-SVM is trained for each pairwise class and consists of K (K − 1)/2 simpler models (via a directed acyclic graph). Both methods can lead to similar results, although they can be used for different purposes (Galar et al., 2011). In the Classification of operator skill level section, the OVO method is used, while in the Discrimination capability section, both methods are employed.
Training and testing sets were separated through randomized fivefold cross-validation to ensure generalization to independent sets.
Performance measures for classification
To evaluate the performance of the classifier for each of the two subdatasets defined in the Functional connectivity datasets for automated discrimination section, standard metrics are computed from the true/false positive/negative (i.e., TP, TN, FP, FN) frequencies. These metrics of performance are as follows:
Considering the metrics presented in (2), every class would lead to an independent metric of performance, which is not desirable for assessing the overall performance. Instead, a practical metric of classification performance is the Matthew's Correlation Coefficient (MCC), which considers TP, TN, FP, and FN simultaneously. For binary class problems, the MCC is formulated as follows:
MCC can be reformulated to be multiclass and define a global performance metric representative of all classes (Gorodkin, 2004; Jurman et al., 2012). To make it multiclass, the whole multiclass confusion matrix can be used as the reference to compute the MCC statistics. The multiclass MCC (MMCC) is obtained from marginalizing the different dimensions of the confusion matrix C, which elements include all true/false positive/negative frequencies for each class. Each row of C represents a class prediction, while each column accounts for the true class. Hence, formula (3) becomes the following:
where
Predicting operator skill level
After training the classifier using a priori data, operator skill level can then be predicted for any new unseen (i.e., unlabeled) set of fNIRS data. Figure 3 summarizes the processing steps necessary to obtain these predictions: (1) A signal processing step comprises the following tasks: (a) Signal extraction: 1 Hz of hemoglobin data captured by each OT channel is stored in an independent buffer. (b) Signal filtering (Denoising and filtering section): Each signal in a buffer is denoised, smoothed, and baseline subtracted. (2) Functional connectivity: coefficients are computed as a proxy for functional connectivity for all between-channel signal pairs, thus generating a functional connectivity matrix. The elements of the resulting matrix are translated into a sample vector, in which each vector dimension corresponds to an element of the matrix. In the case where two functional connectivity matrices are generated (one for each hemoglobin species), the elements of both matrices are linked together within a same sample vector. (3) Skill level estimation: In advance of testing, an LS-SVM algorithm is trained and parameter optimization is performed as described in the Classifier and parameter settings section. The sample vector obtained in step 3 is tested against a support vector machine model by using one of the multiclass settings described in the Classifier and parameter settings section. New data samples are analyzed and a prediction is made regarding the likely skill level.
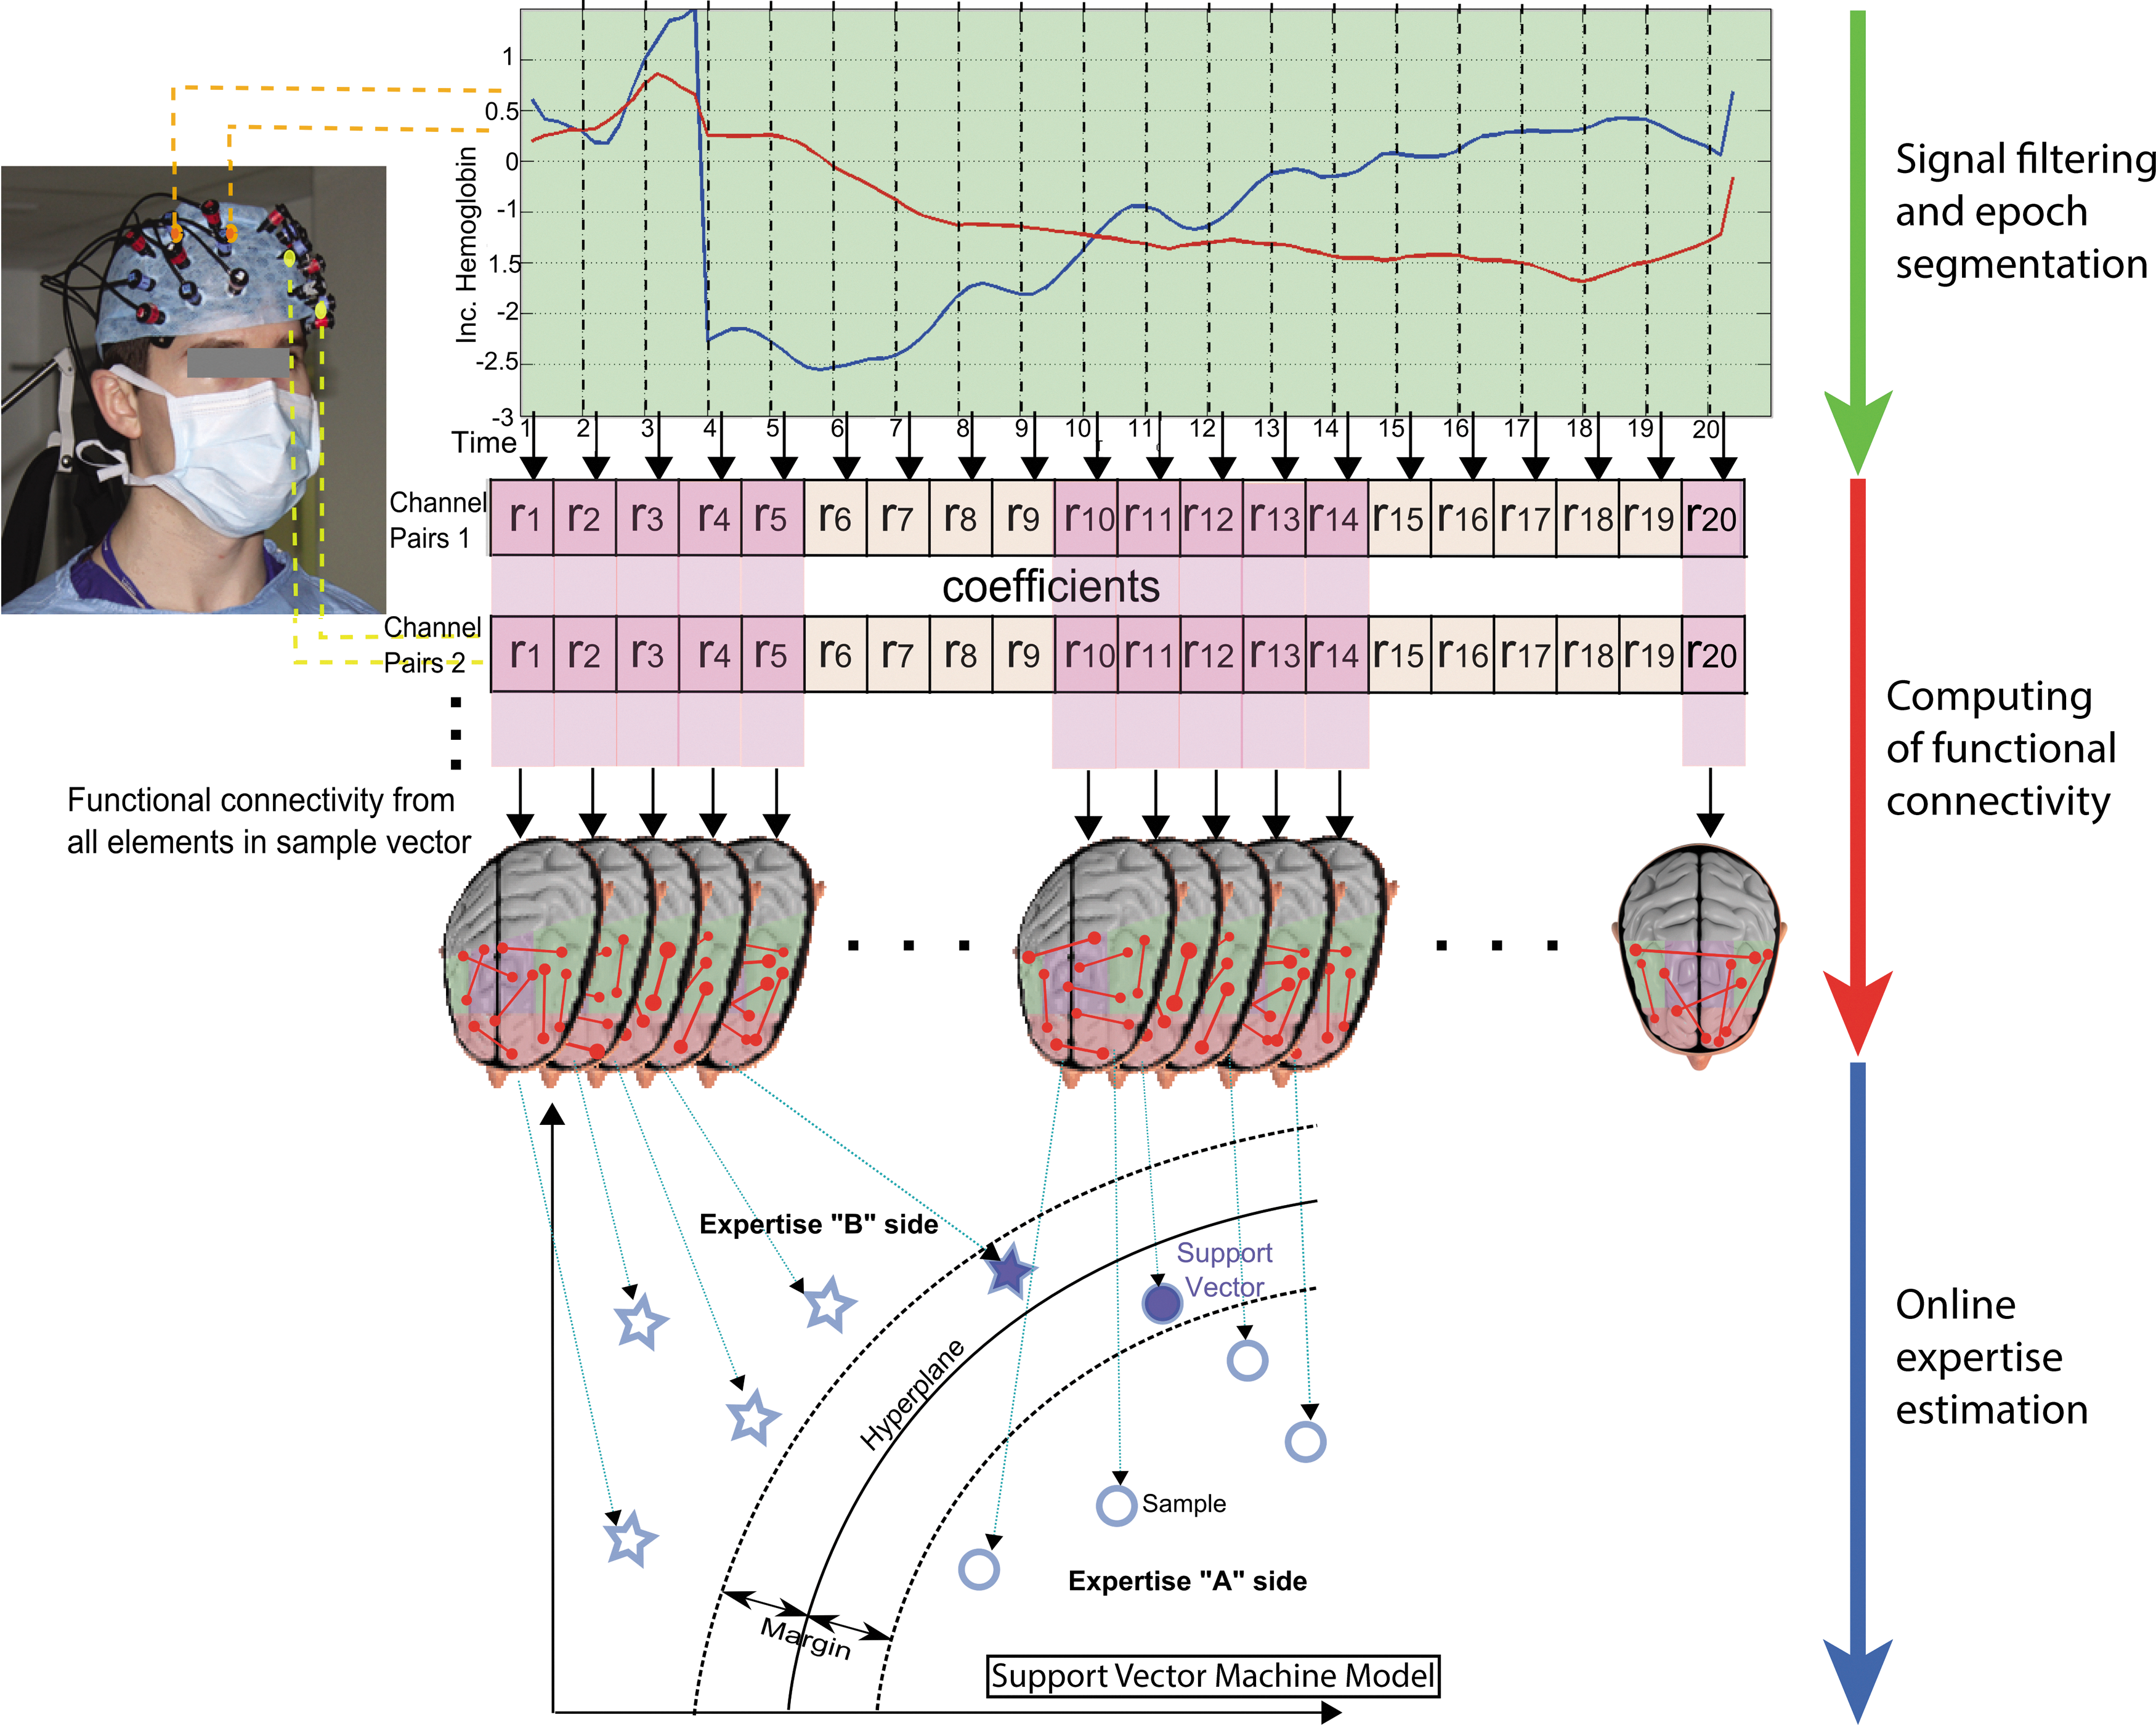
Schematic illustration of the processing steps and classification of the extended dataset using a large margin classifier, that is, LS-SVM. LS-SVM, least-squares support vector machine. Color images available online at
Evaluating discrimination capabilities by groups of connectivity
It is valuable to explore the relative importance of each brain area by considering the connectivity within and between brain areas in the frontal lobe, as opposed to solely considering classifier performance based on the fully connected adjacency matrix. The extended dataset is used in this analysis. In this regard, the classifier is adapted to consider only the within-region (local) or between-region (inter-regional) connectivity for a given brain ROI. As illustrated in Figure 4, for a given ROI the local, inter-regional, or combined functional connectivity data may be considered and defined as follows: (1) Local connectivity (within-region): Considers observed connections within a given brain region. In other words, it refers to the internal functional connectivity of a particular brain region without considering long-range connections to other brain regions. (2) Inter-regional connectivity: Involves observed connections between channels of different brain areas, capturing distant functional relationships between areas of the brain, pruning local connections within the region. (3) Combined (within-region and inter-regional): Includes all possible functional connections, both within a given ROI and between that ROI and other brain regions, thereby emphasizing all possible functional relationships exhibited by a specific area.
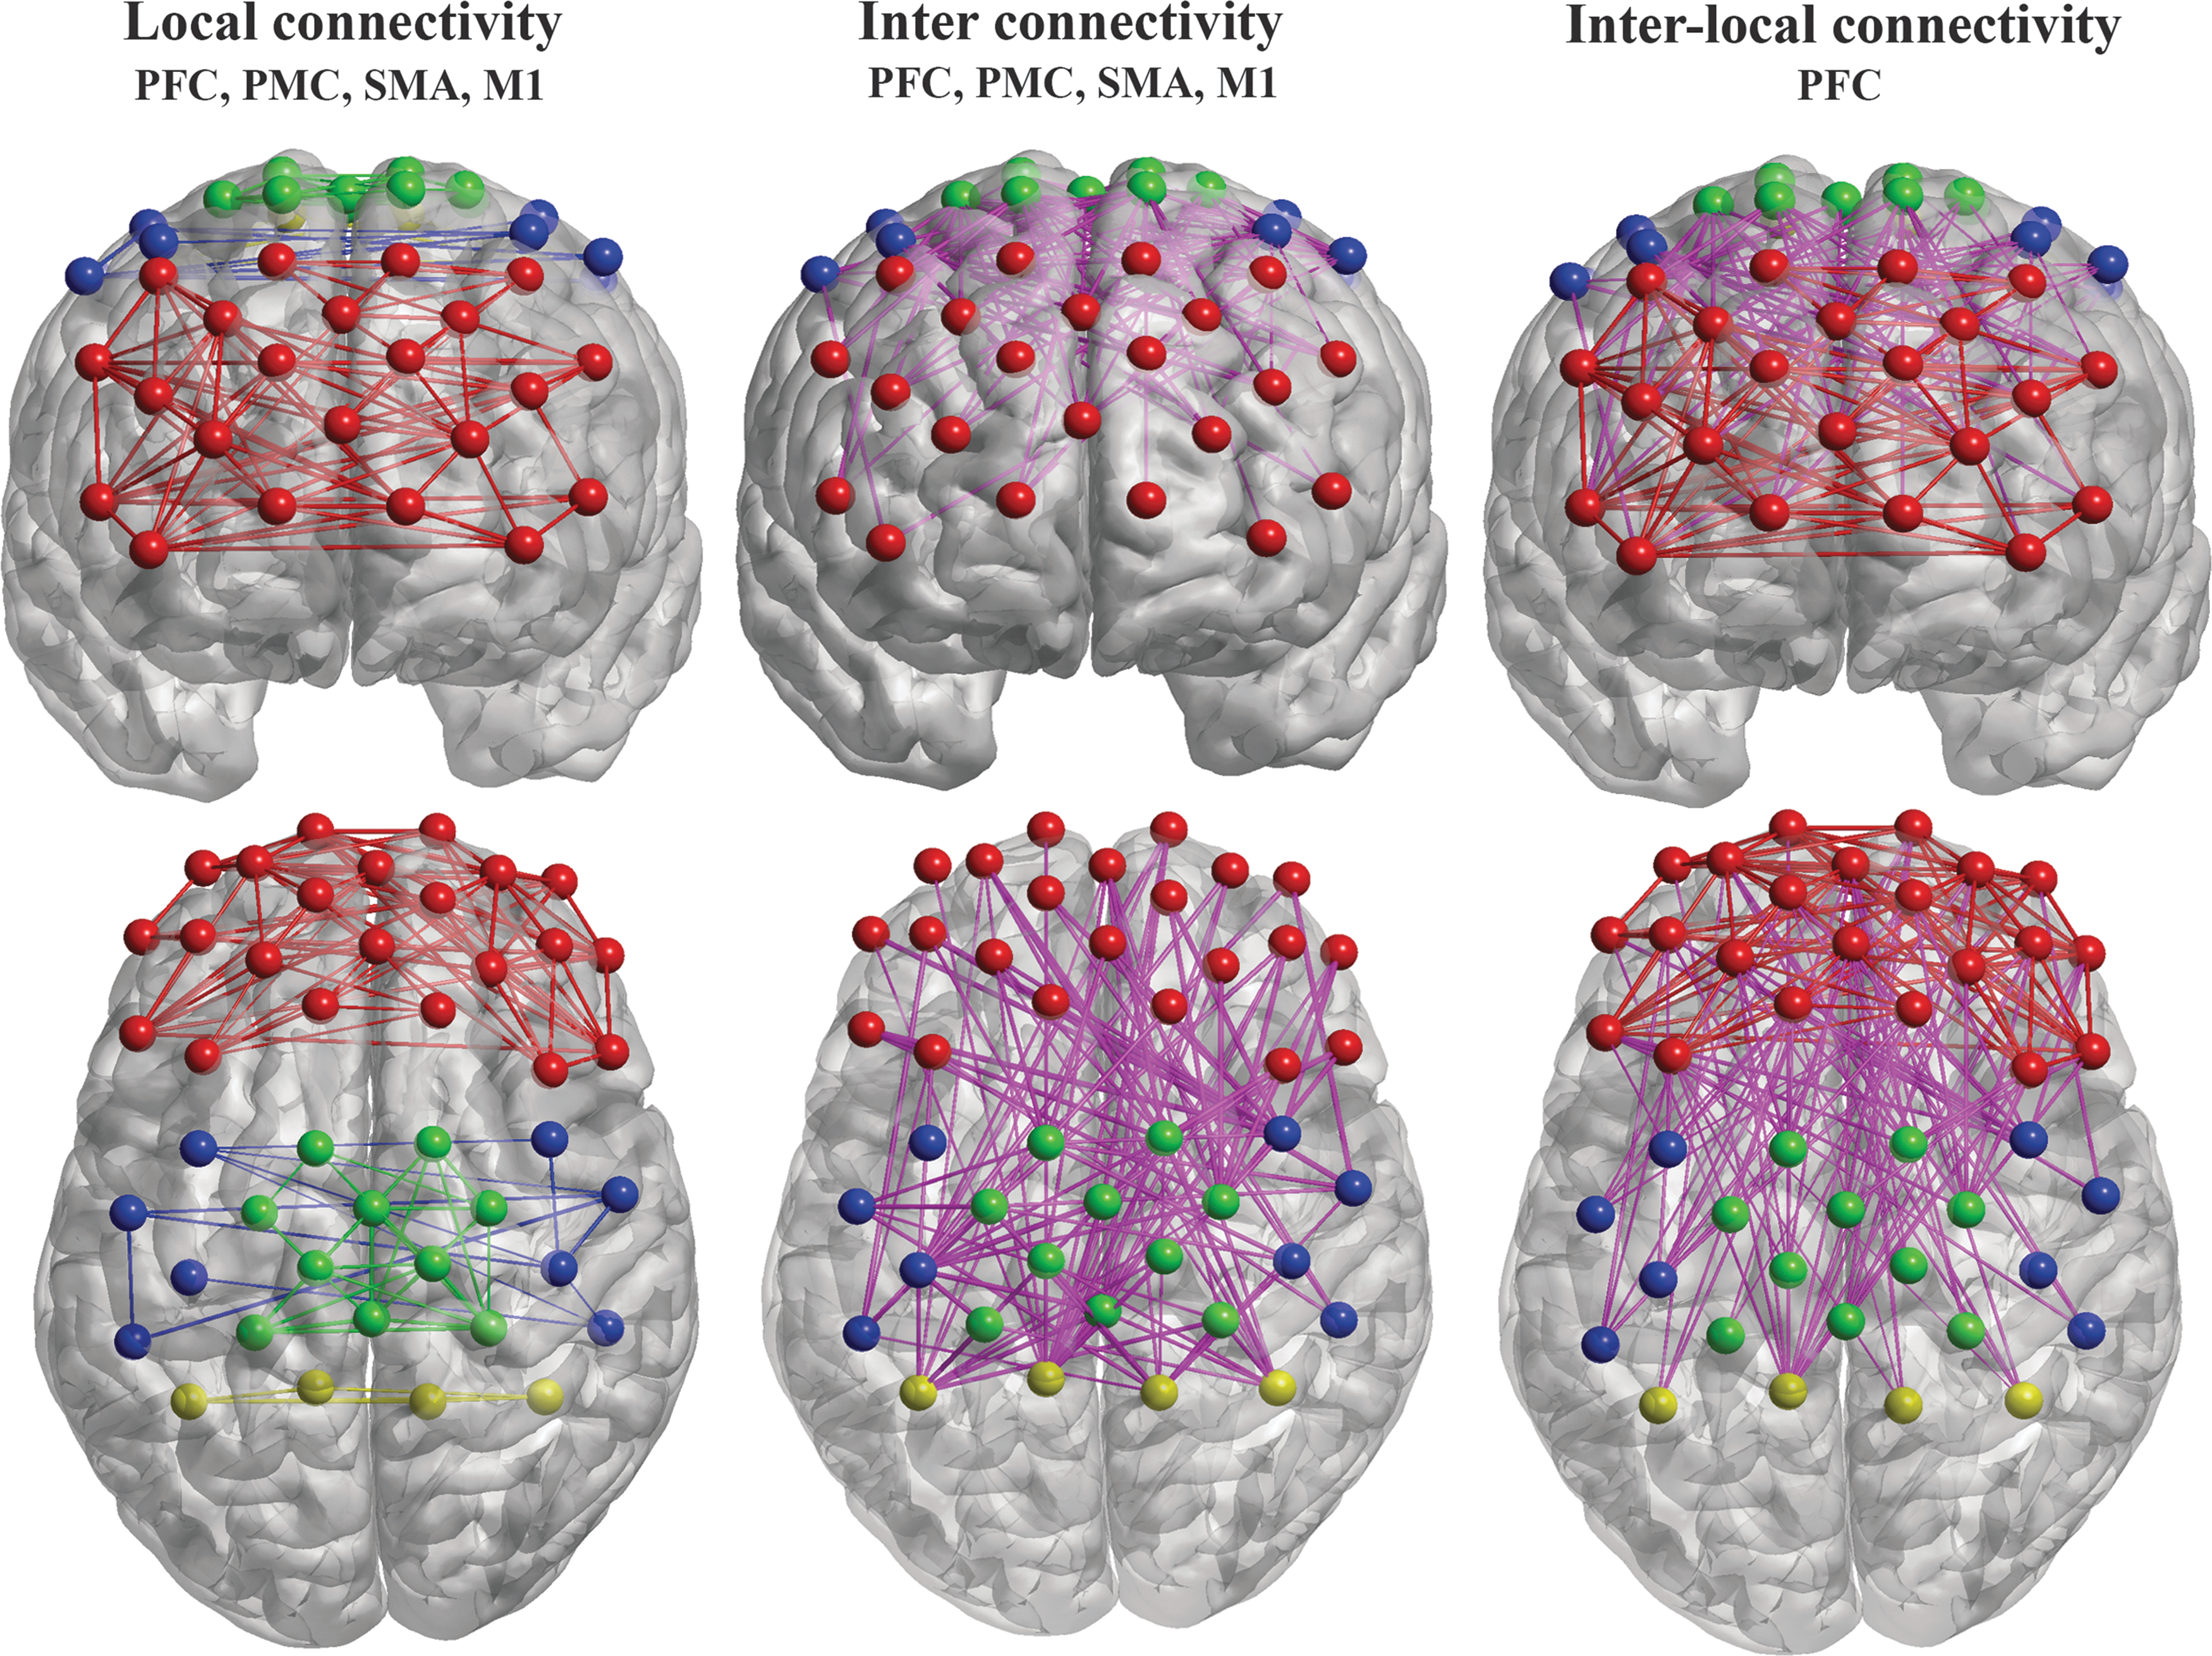
Graphical representation of local, inter-regional, and combined (interlocal regional) connectivity showing channels over the PFC (red), PMC (blue), SMA (green), and M1 (yellow). Each edge represents a functional connection between channels. Within-region connections (color coded by subregion) and inter-regional connections (magenta) are highlighted. PFC, prefrontal cortex; PMC, premotor cortex; SMA, supplementary motor area. Color images available online at
Two different classifier strategies are used in this study to analyze the performance of each classification for each subregion: (1) an overall multiclass classification following a one-versus-one strategy and (2) an independent binary skill level classification based on a one-versus-all strategy.
Results
Behavioral performance and cognitive load
Table 1 summarizes the results of task-related change in MHR, MHRV, and assessment of motor laparoscopic skill levels (FLS). As anticipated, technical performance was significantly different between groups (p < 0.001, chi-square = 58, df = 2, KW). Experts displayed superior performance (lower FLS scores) compared with trainees (p < 0.001, z = −32.2, DT) who in turn outperformed novices (p = 0.002, z = −22.8, DT). No statistically significant differences in task-related MHR (p = 0.87, F-value = 0.145, df = 2; ANOVA) and MHRV (p = 0.83, F-value = 0.182, df = 2; ANOVA) were found between groups. For all groups, the null hypothesis is retained under the Shapiro–Wilk test of normality for HRV (novices: p = 0.42, trainees: p = 0.42, experts: p = 0.50) and MHRV (novices: p = 0.61, trainees: p = 0.21, experts: p = 0.33).
FLS, fundamentals of laparoscopic surgery.
Learning-related changes in local and inter-regional connectivity
For all groups, the null hypothesis is retained under Shapiro–Wilk's (SW) test of normality (novices: p = 0.31, trainees: p = 0.11, experts: 0.09).
Needle insertion
Frontal lobe connectivity during needle insertion varied according to surgical skill level (Fig. 5). Correlations between PFC and PMC seed regions and other frontal motor cortical regions were observed to be lower in trainees and experts than novices. Overall, a significant main effect of skill level was observed for the interactions, PFC-SMA (p < 0.01, F-value = 20.06, df = 2; ANOVA), PFC-PMC (p < 0.01, F-value = 16.05, df = 2; ANOVA), and SMA-PMC (p < 0.01, F-value = 36.67, df = 2; ANOVA).
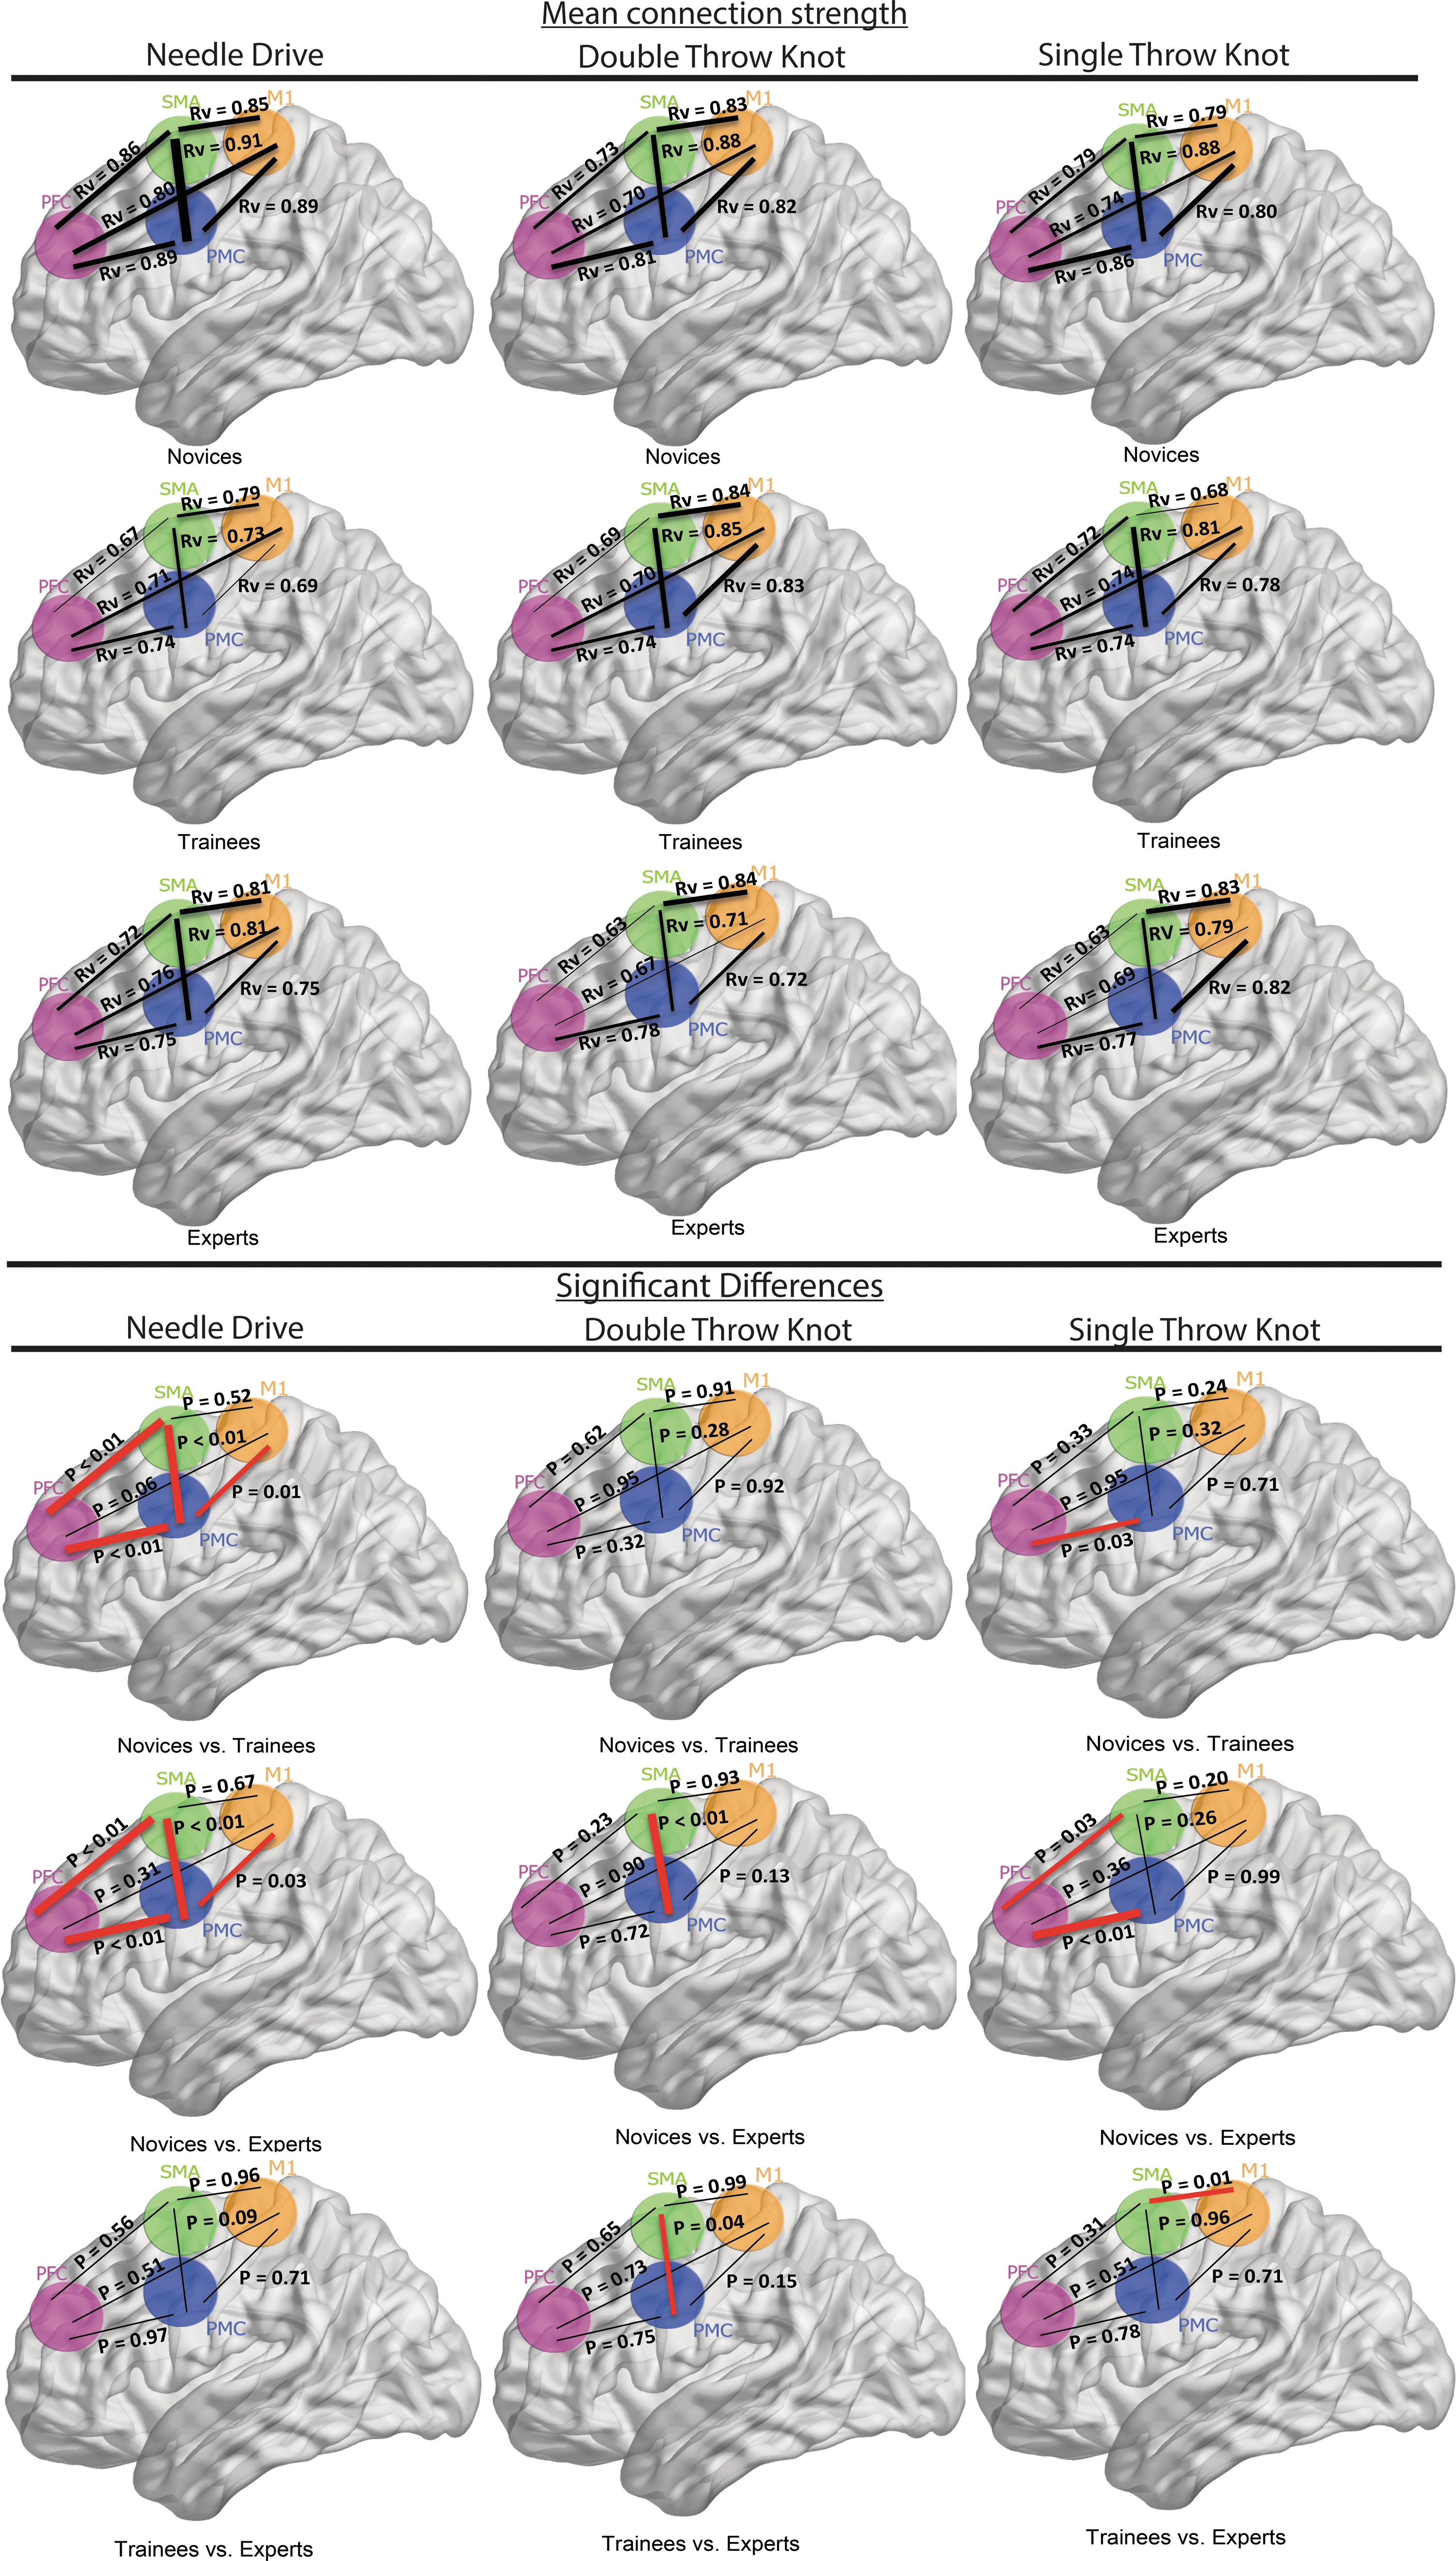
Sagittal brain views of learning-related changes in connectivity for the needle insertion, double-throw knot, and single-throw knot subtasks. The three sagittal brains at the top display the mean Rv connectivity strength, while the following three at the bottom show the significance strength of the statistical test. Areas are depicted as PFC (magenta), SMA (green), M1 (orange), and PMC (blue). Color images available online at
Upon post hoc analysis, no significant differences between trainees and experts were observed (PFC-SMA: p = 0.56, PFC-PMC: p = 0.97, SMA-PMC: p = 0.09; Tukey's HSD). However, comparisons between novices and trainees (PFC-SMA: p < 0.01, PFC-PMC: p < 0.01, SMA-PMC: p < 0.01; Tukey's HSD) and novices and experts were statistically significant (PFC-SMA: p < 0.01, PFC-PMC: p < 0.01; SMA-PMC: p < 0.01; Tukey's HSD). No main effect of skill level was observed for M1-PFC or M1-SMA seed interactions. However, a main effect of skill level was observed for M1-PMC interactions (p = 0.01; ANOVA). Post hoc analysis revealed no significant difference between trainees and experts, while differences between novices and trainees (p = 0.01; Tukey's HSD) and novices and experts (p = 0.03; Tukey's HSD) reached statistical threshold.
Double-throw knot tying
The strength of PFC-PMC interactions was not observed to depend on skill level (Fig. 5) for double-throw knot tying. No significant differences were found for PFC seed interactions. However, interactions between the PMC and other frontal lobe seed regions varied with skill level. For example, a main effect of skill level was observed for interactions between the SMA and PMC (p < 0.01, F-value = 8.574, df = 2; ANOVA). The interaction strength of this connection was significantly lower in experts than in novices (SMA-PMC: p < 0.01; Tukey's HSD). Of all frontal lobe interactions, differences between trainees and experts were only observed in SMA-PMC, the interaction strength being significantly lower in experts (SMA-PMC: p = 0.04; Tukey's HSD).
Single-throw knot tying
A significant main effect of skill level was observed for the interactions, PFC-PMC (p < 0.01, F-value = 11, df = 2; ANOVA), PFC-SMA (p = 0.03, F-value = 4.14, df = 2; ANOVA), and SMA-M1 (p = 0.01, F-value = 6.49, df = 2; ANOVA). For PFC seed interactions, the strength of association was observed to be significantly lower in experts than in novices (PFC-SMA: p = 0.03; PFC-PMC, p < 0.01; Tukey's HSD) and also lower for trainees between PFC-PMC (p = 0.03, Tukey's HSD) (Fig. 5). Interestingly, differences between experts and trainees were only evident in SMA-M1 interactions, the strength of association being significantly greater in experts (SMA-M1: p = 0.01; Tukey's HSD).
Classification of operator skill level
Tables 2 and 3 show the results of the classifier using the session-based networks (Table 2) and the time course-based networks (Table 3).
MMCC, Multiclass Matthew's Correlation Coefficient.
Classification using session-based networks yields a greater number of true positives than false positives in all subtasks, with low MMCC scores (<0.5) for certain trials. In contrast, the time course-based networks consistently achieve high MMCC scores (≥ 0.70) across subtasks. For this latter case, the classifier appears to perform equally well in each LS subtask. Overall, novice identification was highly precise (≥ 0.8 for all three subtasks) and sensitive (0.92 for needle insertion, 0.85 for double-throw knot, and 0.91 for single-throw knot), while trainee and expert identification was precise and specific (e.g., precision for trainees ≥0.83 and specificity ≥0.86 across all subtasks). The discrimination of experts also exhibits high specificity (≥ 0.95) and precision (≥ 0.76), but with lower sensitivity versus the other operator groups (0.63–0.67).
These results suggest that the variability in cortical hemodynamic responses between groups based on experience is potentially greater than the variability in responses across subtasks within a given experience group.
Discrimination capability: local versus inter-regional connectivity
Performance results for each brain area and connectivity type are presented in Table 4 for the OVO multiclass setting, which summarizes the overall classification over the entire set of categories, that is, a combination of three one-versus-one classifiers is used to determine the class of each sample (multiclass approach). Tables 5, 6, and 7 display results from the OVA setting, which summarize the classification of operator skill level, that is, three one-versus-all classifiers are used as three separate classifiers (independent binary classification of a determined skill level against the rest). MMCC data were analyzed using the Friedman test, followed by post hoc analysis using the Wilcoxon signed-rank test with a Bonferroni correction to establish statistical significance at p < 0.05.
Results averaged from all subtasks, means and standard deviations (±) are presented in this table.
PFC, prefrontal cortex; PMC, premotor cortex; SMA, supplementary motor area.
Results averaged from all subtasks, means and standard deviations (±) are presented in this table.
Results averaged from all subtasks, means and standard deviations (±) are presented in this table.
Results averaged from all subtasks, means and standard deviations (±) are presented in this table.
Analysis from OVO strategy, overall classification
The subset of connectivity (i.e., local vs. inter-regional vs. combined) was statistically significant (p < 0.001, chi-square = 18.167, df = 2; Friedman). Post hoc analysis revealed statistically significant differences in MMCC between local and inter-regional connectivity (p = 0.002, z-score = −3.059; Wilcoxon) and combined and inter-regional connectivity (p = 0.002, z-score = −3.059; Wilcoxon), but not local versus combined (p = 0.53, z-score: −0.628; Wilcoxon).
Statistically significant differences were observed in the MMCC between brain ROIs (p = 0.001, chi-square = 16.6, df = 2; Friedman), regardless of the type of connectivity considered. Upon post hoc analysis, MMCC values for M1 were significantly lower versus other frontal ROIs for M1 versus SMA (p = 0.008, z-score = −2.666; Wilcoxon) and M1 versus PMC (p = 0.008, z-score = −2.666; Wilcoxon). However, no other significant differences were observed in MMCC data between fontal ROIs.
Analysis from OVA strategy, one skill level against the rest classification
The type of network connectivity was compared using a within-skill level approach. Regardless of the skill level of the operator, the type of connectivity significantly affected performance of the classifier (p < 0.001, chi-square = 54.056, df = 2; Friedman). Indeed, performance was significantly poorer when inter-regional rather than local connectivity was considered (p < 0.001, z-score = −5.232; Wilcoxon). Similar to the results obtained for the OVO model, regardless of the connectivity data used, statistically significant differences were observed between regions in the performance of the classifier. Specifically, for all skill level groups, MMCC values from M1 were significantly lower than several other frontal brain regions for novices: M1 versus PFC (p = 0.008, z-score = −2.666; Wilcoxon), M1 versus SMA (p = 0.008, z-score = −2.666; Wilcoxon), and M1 versus PMC (p = 0.008, z-score = −2.666; Wilcoxon); trainees: M1 versus SMA (p = 0.008, z-score = −2.666; Wilcoxon); and experts: M1 versus PFC (p = 0.008, z-score = −2.666; Wilcoxon) and M1 versus SMA (p = 0.008, z-score = −2.666; Wilcoxon).
Discussion and Conclusion
Notwithstanding established models of motor skill level learning (Hikosaka et al., 2002) and evidence supporting learning-related changes in brain function (Coynel et al., 2010; Heitger et al., 2012; Sun et al., 2007), disparate technical performance does not necessarily translate into differences in functional activations on highly complex bimanual coordination tasks (Ohuchida et al., 2009). Our hypothesis is that differences in technical skill level on tasks of such complexity may be better reflected in differences in functional connectivity within associative and/or sensorimotor brain networks (Bullmore and Bassett, 2011; Coynel et al., 2010; Heitger et al., 2012; Hikosaka et al., 2002; Rissman et al., 2004).
In this study, skill level-related differences in frontal lobe connectivity were revealed, summarized as a reduction in connectivity strength between cortical regions involved in the associative network. This suggests that frontal lobe cortico-cortical connectivity on a bimanual coordination task varies according to operator skill level and technical skill level, thereby confirming the dynamic nature of coupling in cognitive–motor circuitry. In particular, interaction strength between prefrontal and premotor seeds and other motor-related cortical regions was found to attenuate with skill level. In other words, novices appear to depend on the interactions between associative and motor cortical networks more than experts. Of these frontal lobe interactions, PFC-SMA, PFC-PMC, and SMA-PMC connections were consistently stronger in novice operators, whereas SMA-M1 interactions remained stable or even increased in expert compared with trainee operators.
The findings of this study align with models of motor learning, implying a high level of integration, which decreases with practice in the associative/premotor network and between this and the sensorimotor network (Hikosaka et al., 2002). Moreover, the results are consistent with empirical data that suggest large-scale functional reorganization accompanies motor skill level learning (Bassett and Bullmore, 2006; Coynel et al., 2010; Heitger et al., 2012; Rissman et al., 2004; Sun et al., 2007).
Among studies investigating spatial and temporal changes in recruitment of brain regions involved in motor skill level learning (Hikosaka et al., 2002; Kelly and Garavan, 2005), few have interrogated functional connectivity (Bassett and Bullmore, 2006; Bernardi et al., 2013, Coynel et al., 2010; Heitger et al., 2012; Rissman et al., 2004; Sun et al., 2007). While investigations have explored changes in modularity and allegiance of network nodes (Bassett and Bullmore, 2006), variation in functional network econometrics (Heitger et al., 2012), and hierarchical integration within associative and sensorimotor networks (Coynel et al., 2010), only one study specifically interrogated changes in cortico-cortical connectivity during explicit bimanual motor skill level learning (Sun et al., 2007).
Commensurate with our findings, this study by Sun and colleagues (2007) demonstrated enhanced cortico-cortical network connectivity during early phases of explicit bimanual motor sequence learning. Interestingly, connectivity between higher cognitive centers (PFC) and the motor network (PMC) increased only during early learning and subsequently decreased during late within-session learning when subjects improved their performance (Sun et al., 2007). Fast motor learning is characterized by increased functional connectivity between dorsolateral PFC and PMC, possibly related to the heightened attentional demands required at this stage of skill level acquisition (Dayan and Cohen, 2011; Hikosaka et al., 2002).
Consistent with our findings, studies of slow motor learning suggest longitudinal changes in functional connectivity in premotor associative networks over extended practice schedules (Coynel et al., 2010). Slow learning (weeks) is accompanied by decreased integration, a metric reflecting functional interactions among several brain regions, in a premotor associative striatum cerebellar network (Coynel et al., 2010). The current analysis both supports and extends these findings, suggesting that attenuation in associative cortico-cortical network connectivity is durable across many years of practice, that is, from novice to trainee. More importantly, it appears that progression from intermediate (trainee) to advanced (expert) phases of skill level execution is potentially independent of further changes in connectivity strength within this associative cortico-cortical network.
Contrary to variation observed in the strength of connectivity between prefrontal and premotor regions associated with skill level, SMA-M1 connectivity strength was more stable and skill level-related differences were less apparent. Despite models of learning suggesting that integration in the sensorimotor network is anticipated to increase (Hikosaka et al., 2002), stability in the strength of SMA-M1 integration across motor skill level learning has been observed previously, further supporting the results of the current analysis (Coynel et al., 2010). It is plausible that gradual ongoing refinements in complex motor skill levels do not require sustained or progressive increase in SMA-M1 connectivity even if the representation of the trained task continues to gradually expand in these brain regions in association with slow skill level learning (Karni et al., 1998).
Moreover, correlation data obtained at 1-sec intervals of the time course were subsequently used as an input to an LS-SVM algorithm toward automated discrimination of operator skill level. Overall, the approach was found to precisely classify skill level, although it was significantly influenced by the subset of connectivity data under consideration. Specifically, local (within-region) connectivity significantly improved classifier performance. Passive brain–computer interfaces (pBCI) offer the potential to feedback implicitly derived information regarding user states. In this regard, through immediate automated categorization of short epochs of brain inputs, optical neuroimaging data, if appropriately decoded, may be interfaced with a learner toward improvements in motor skill level training (Ros et al., 2009).
Previous research on fNIRS-BCI has focused on modeling patterns of signal amplitude (Coyle et al., 2007; Naito et al., 2007; Power et al., 2012), failing to incorporate functional connectivity data. In this study, discriminatory patterns of operator skill level based on functional connectivity have been exposed through the multiclass ML approach, and were not revealed with a conventional analytical framework (Bahrami et al., 2011; Ohuchida et al., 2009).
The algorithm for classification of operator skill level states has proven to be accurate, sensitive, and specific for detection of operator skill level during LS, regardless of the subtask. This suggests that the algorithm is capable of capturing experience-related differences in frontal lobe connectivity equally well in each task phase.
While each LS subtask has a unique and specific goal, the rudimentary bimanual coordination required to achieve these goals may be similar and hence generic learning-related differences in frontal lobe connectivity may exist, thereby aiding discrimination. Moreover, the results highlight the importance of within-region correlations in discrimination of operator skill level. Indeed, in comparison with the results obtained with inter-regional connectivity data, classification was significantly superior when local connectivity was considered. Critically, these results were consistent across models (i.e., OVA and OVO).
Finally, classification results using M1 connectivity appeared inferior to the results obtained from other frontal regions possibly owing to a relative paucity of channel information and hence a smaller number of nodes. More importantly, the fact that classifier results were not consistently superior for any specific ROI suggests that the entire frontal lobe is equally informative.
Complex technical skills evaluated solely based on dexterity and simple end-points such as completion time and economy of motion oversimplify the perceptual-motor process involved and lack insights into associated cognitive function. Even sophisticated approaches such as capturing eye gaze can only provide insights into cognitive function based on fixation and tracking strategies (Andreu-Perez et al., 2016; Wilson et al., 2010). Brain imaging technologies, on the other hand, have the potential to infer cognitive processes more accurately through the detection of activation (i.e., recruitment) of brain areas with known functionality. When results of the classifier are provided online, these may be used as a pBCI to feedback data regarding skill level to the operator in the hope of improving the cognitive abilities required to execute the task.
Automated classification of skill level based on cortical connectivity rather than technical performance or abstracted end-points may serve to improve skill level learning by interfacing decoded brain data to the learner, trainer, or team. Incorporation of instrument motion tracking in conjunction with brain function may further improve workflow segmentation and proficiency detection.
We acknowledge potential confounds due to individual characteristics that were not controlled for, such as the potential influence of intellectual ability (IQ), which could be of interest to consider in future studies. Likewise, incorporating electrophysiological signals that overcome some of the limitations of optical imaging technology such as inferior temporal resolution may improve performance and be more practical for pBCI in surgery. Finally, future research could address the limitations associated with a cross-sectional approach and extend on the present findings by implementing longitudinal studies as well as studying other novel types of connectivity analyses (Kiani et al., 2014).
In summary, the current study highlights differences in frontal brain connectivity underpinning operator skill level on a complex bimanual coordination task. Operators well versed in bimanual coordination appear to depend less on associative and premotor connectivity than novices. Moreover, the disparity in learning-related changes in connectivity facilitates an algorithmic solution toward online classification of operator skill level, which is both highly accurate and precise. Automated classification of operator states may facilitate interfaces designed to enhance learning, performance, and patient safety.
Footnotes
Acknowledgments
The authors wish to thank the anonymous reviewers as well as the editorial team of Brain Connectivity for their detailed feedback and very helpful comments in enhancing the quality of this article.
Author Disclosure Statement
No competing financial interests exist.