
Abstract
Spatiotemporal activity that emerges spontaneously “at rest” has been proposed to reflect individual a priori biases in cognitive processing. This research focused on testing neurocognitive models of visual attention by studying the functional connectivity (FC) of the superior parietal lobule (SPL), given its central role in establishing priority maps during visual search tasks. Twenty-three human participants completed a functional magnetic resonance imaging session that featured a resting-state scan, followed by a visual search task based on the alphanumeric category effect. As expected, the behavioral results showed longer reaction times and more errors for the within-category (i.e., searching a target letter among letters) than the between-category search (i.e., searching a target letter among numbers). The within-category condition was related to greater activation of the superior and inferior parietal lobules, occipital cortex, inferior frontal cortex, dorsal anterior cingulate cortex, and the superior colliculus than the between-category search. The resting-state FC analysis of the SPL revealed a broad network that included connections with the inferotemporal cortex, dorsolateral prefrontal cortex, and dorsal frontal areas like the supplementary motor area and frontal eye field. Noteworthy, the regression analysis revealed that the more efficient participants in the visual search showed stronger FC between the SPL and areas of primary visual cortex (V1) related to the search task. We shed some light on how the SPL establishes a priority map of the environment during visual attention tasks and how FC is a valuable tool for assessing individual differences while performing cognitive tasks.
Introduction
Functional connectivity (FC) is a measure of the temporal dependency of functionally linked, but spatially separated, brain regions, which can be obtained from resting-state functional magnetic resonance imaging (rs-fMRI) data.
The interpretation of the FC is diverse. One recent proposal is that it may reflect differences among individuals and that these differences would be cognitive biases (Harmelech and Malach, 2013). Evidence in favor of this hypothesis comes from several studies that have correlated learning or performance measures with neural activity at rest (Baldassarre et al., 2012; Hampson et al., 2006; Sala-Llonch et al., 2012; Ventura-Campos et al., 2013). These studies generally indicate the capacity that FC (between distant areas) or regional homogeneity (within local voxels) has to predict individual differences while performing perception, memory, or intelligence tasks.
Most of these studies provide no supporting theory, but if we consider that FC is a powerful tool, neurocognitive models of information processing might be empirically tested. Hence, we set out to conduct the present study to validate visual attention processing models (Deco and Rolls, 2005; Posner and Petersen, 1990).
Theoretical visual attention models have described the relevant role of the superior parietal lobule (SPL; the equivalent of the lateral intraparietal area in the monkey), which establishes priority maps of the environment where stimuli are represented, according to their behavioral priority by incorporating both bottom–up and top–down influences (Bisley and Goldberg, 2010; Ptak, 2012).
Evidence in favor of this role comes from studies conducted in patients and in monkeys, using neuroimaging techniques (Bisley and Goldberg, 2010). For instance, fMRI studies have shown that the SPL [and the occipital cortex (OC)] is sensitive to the number of memorized objects and their complexity during visual search (Todd and Marois, 2004; Xu and Chun, 2006). In fact, visual attention models have predicted that OC uses the priority map to guide attention and to ensure that the higher order spatial properties of stimuli are represented in the network (Bisley and Goldberg, 2010). To exert attention and working memory functions, the SPL is also connected to the inferotemporal cortex (IT) and dorsolateral prefrontal cortex (DLPFC) (Deco and Rolls, 2005).
Visual search tasks offer the possibility of empirically proving visual attention models. During this task, the category effect has been described as a more efficient search, which only occurs when target and distractors do not belong to the same category (Brand, 1971). This effect is often studied using alphanumeric stimuli because the semantic categorization of numbers and letters is an automatic highly learned process. It also seems to occur preattentionally, probably in the primary visual cortex, and has some influence on the binding process (Esterman et al., 2004).
The main objectives of the present task and the rs-fMRI study were to (1) describe, for the first time, the neural basis of the categorization effect, (2) report the FC of the SPL in the resting state to show how its connectivity with cortical areas might support neurocognitive visual attention models, and (3) test the priority map function of SPL by investigating the modulating role of visual search performance on the FC between the SPL and primary visual cortex.
Materials and Methods
Participants
Twenty-three healthy undergraduate students from the Universitat Jaume I participated in this study (MAGE=22.26±2.36, 13 men) and they were paid for their participation. All the participants were right handed (Oldfield, 1971), had normal or corrected-to-normal vision, and reported neither neurological or psychiatric history nor past or current use of any drugs. They all provided written informed consent before scanning. The study was approved by the Ethics Committee of the Universitat Jaume I.
Stimuli
Search frames
The search frames consisted of black ink letters on a white background. Each search frame had six stimuli, arranged circularly around a fixation point (eccentricity=1°, stimulus separation=45°). The stimuli font family was Arial BOLD and font size was 37 points (x-Height=1.31 cm). The fixation point had the same font family and its font size was 18 points (x-Height=0.64 cm). The target stimuli under the letter conditions were B F J K, and the number conditions were 1 3 6 7. The letter distractors were C D G H L M, and the number distractors were 0 2 4 5 8 9. Each search frame consisted of either six distractors or five distractors and one target (Fig. 1). Targets and locations were randomized under all the conditions. Finally, no stimulus could appear twice in a row in the same location.
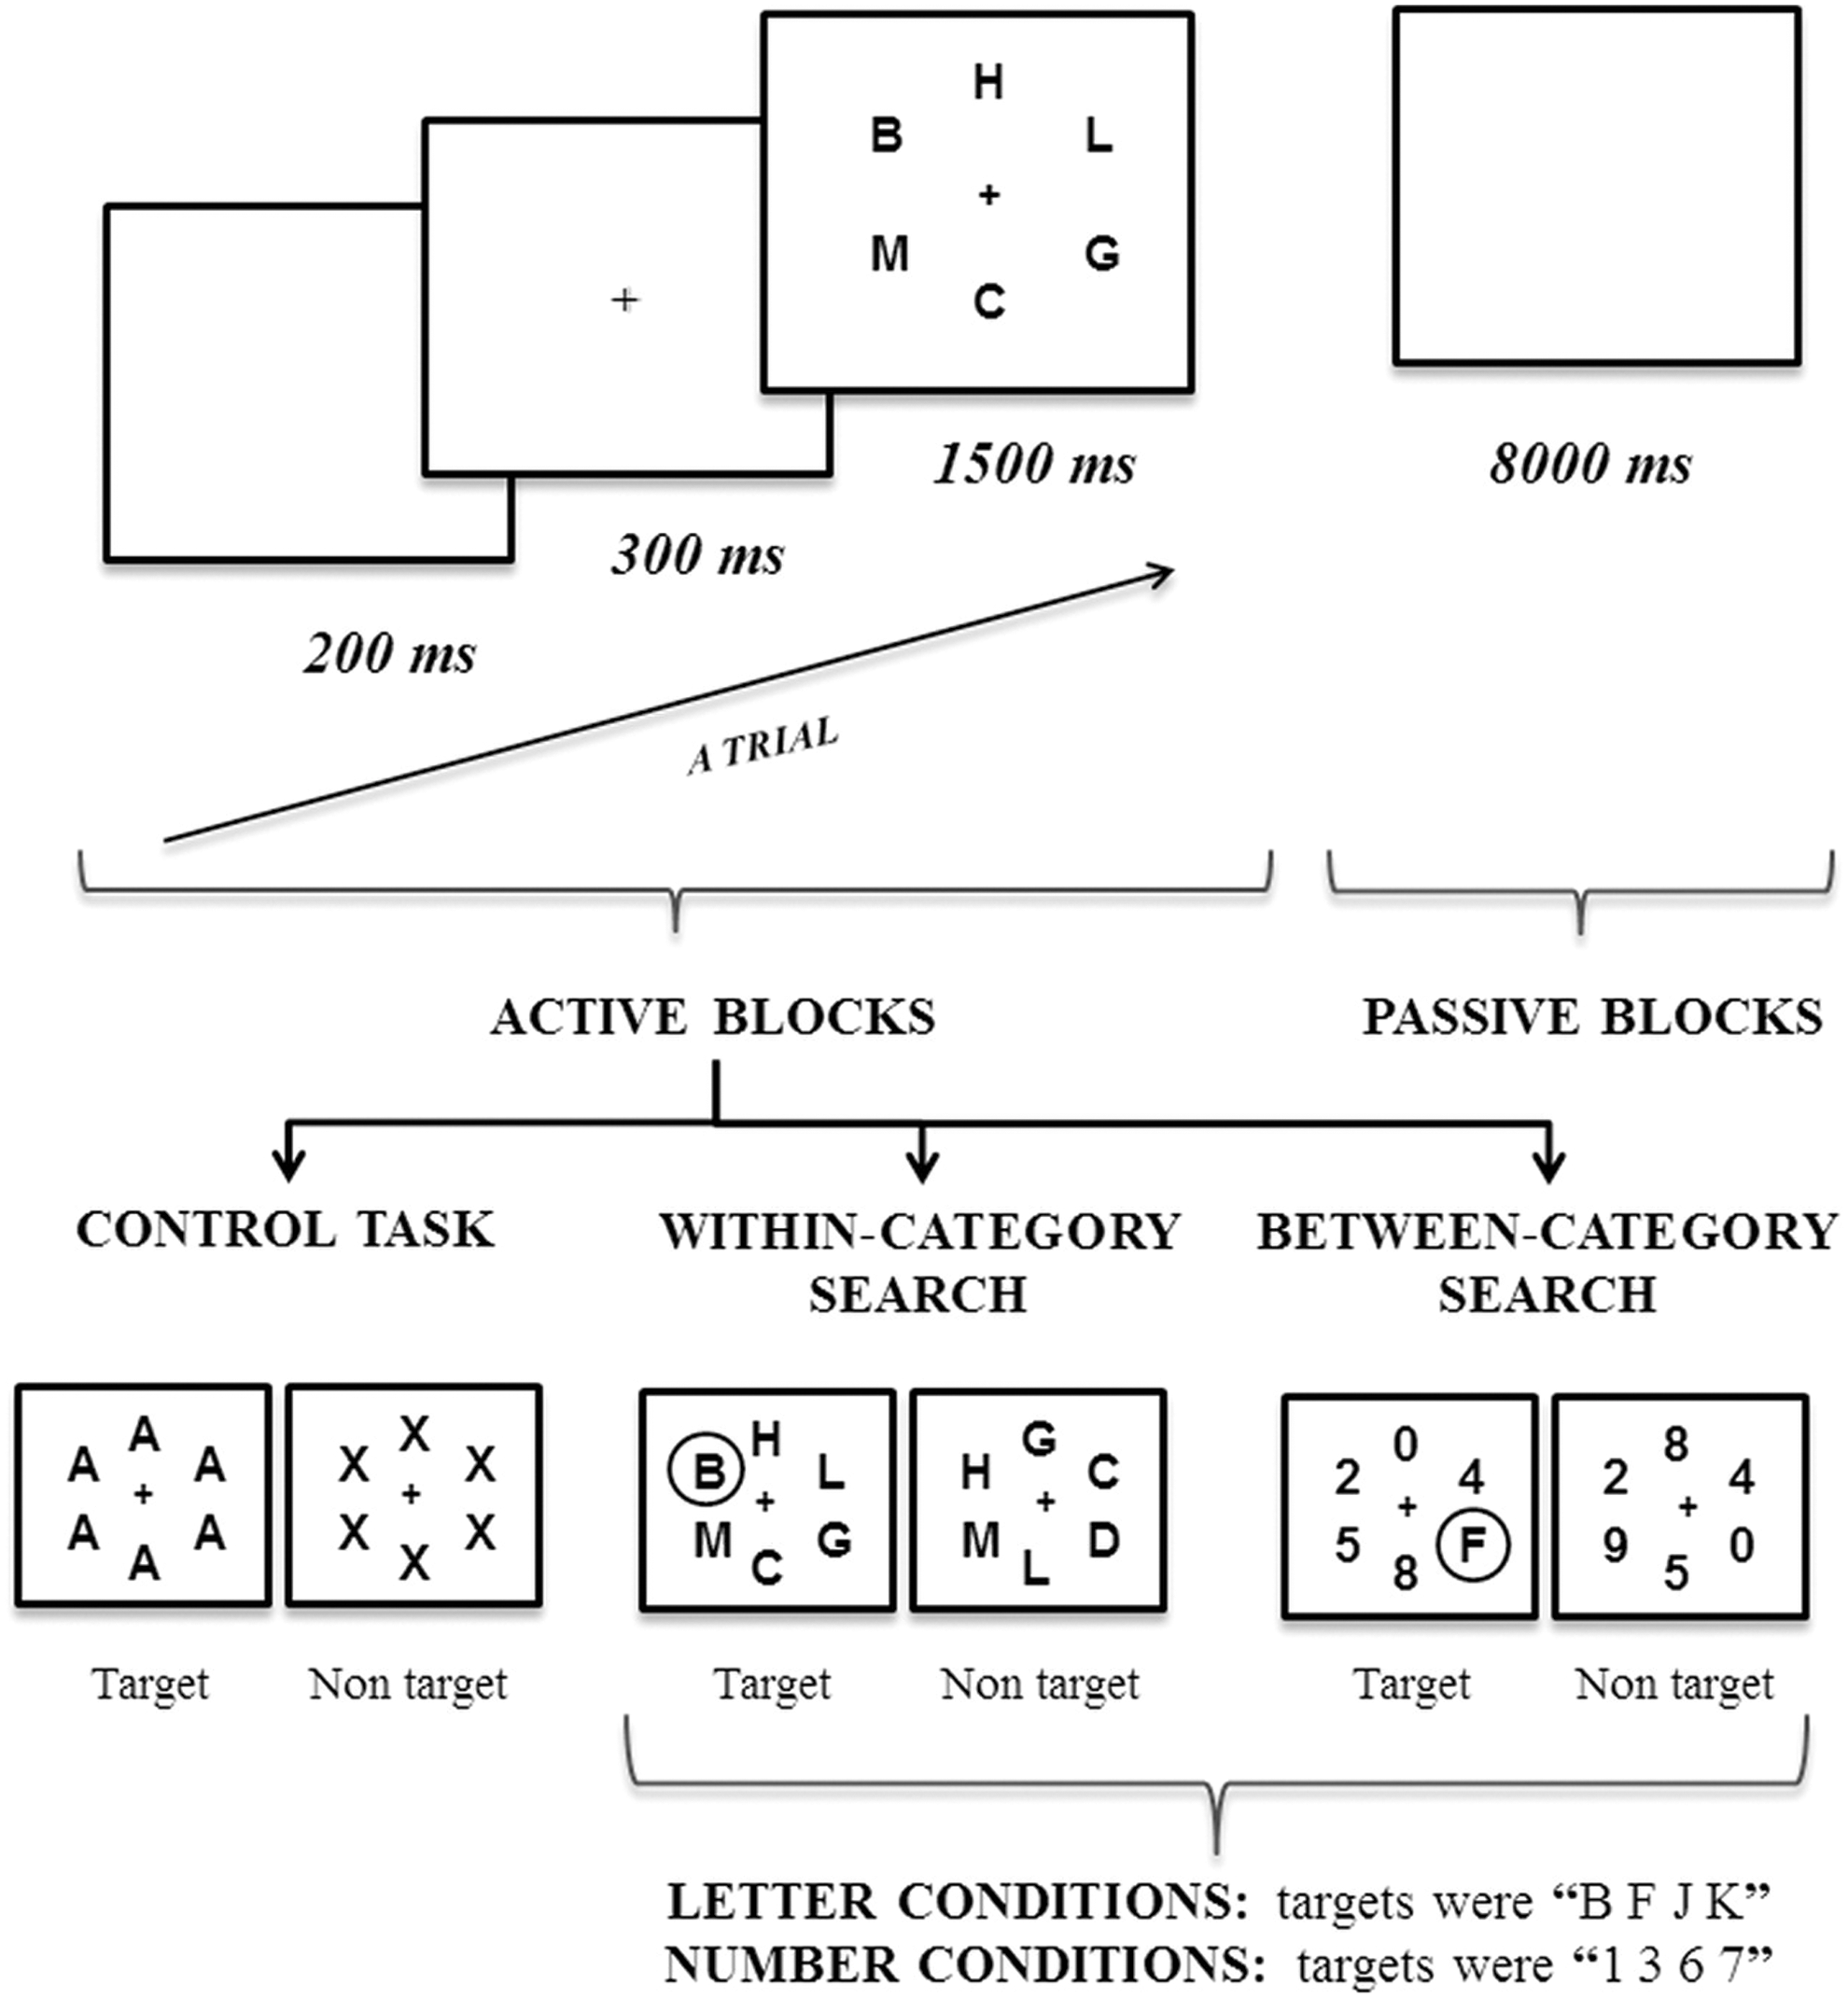
Schematic representation of the experiment procedure. The organization of the visual search task is illustrated with trial and block timing details; in addition, an example of the stimuli used in the control task and the search conditions is included. The targets have been circled for descriptive purposes.
Control task
The stimuli used in the control task were arranged and presented according to the search frames described above. There were only two types of frames, either a six A-letters array or a six X-letters array. Therefore, A's and X's were never blended in the display (Fig. 1).
Instruction display
At the beginning of each block, an instruction display informed participants which task they should perform. The instruction display presented targets in black ink on a white background in a single-centered row (font family/size: Arial BOLD/37 points (x-Height=1.31 cm). There were three different instruction displays: (1) A, which indicated to perform the control task; (2) B F J K, which indicated to search those letters; (3) 1 3 6 7, which indicated to search those numbers.
Experimental paradigm
To carry out this research, the classical visual search task was adapted to an fMRI block design. It entailed the manipulation of the following two factors: (1) searching a target among stimuli of the same category, namely a within-category search; (2) searching a target among stimuli of another category, namely a between-category search. There were two within-category search conditions and two between-category search conditions. During the within-category searches, participants could search for either target letters among distractor letters or target numbers among distractor numbers. In turn, during the between-category searches, participants could search for target letters among distractor numbers or target numbers among distractor letters.
The task design consisted of six search blocks per experimental condition (or 12 within-category and 12 between-category searches) and 12 control condition blocks. The task had 36 active blocks in all, counterbalanced throughout the task. In all the blocks, 50% of the trials constituted a target-present frame. Each block had 12 trials, which consisted of 300 ms of a fixation point, 1500 ms of a search frame, and 200 ms of a blank screen. Each block started by presenting the instruction display, which remained on the screen for 2000 ms. Every time a block finished, the screen remained completely blank for 8000 ms, which resulted in 36 passive blocks in all (Fig. 1). The entire task lasted 21 min.
During the task, participants had to give manual responses only with their right hand. The positive answers were made with the right thumb and the negative ones with the right forefinger. Participants had to give positive answers when they detected a target (either the As in the control task or the letters and numbers defined as targets under the visual search conditions) and negative answers when there were no targets. Participants were asked to answer as quickly as possible, but without compromising accuracy.
Practice
Participants received written instructions about how to do the task. Then, they did a practice task that very much resembled the in-scanner task: the stimulus design matched that used during the in-scanner task; a similar laptop was used, with the same display features and the same hardware for manual responses. Noteworthy, the practice stimuli were not used in the in-scanner task. The practice task included two blocks per search condition and four control blocks, and lasted 6 min and 8 sec (including the passive blocks and the instruction displays). Participants had to obtain 80% correct responses to be able to participate in the fMRI experiment, and all the participants included in this study reached this criteria (M% HITS=83.09±2.34).
Data acquisition
The fMRI data were acquired in a 1.5 T Siemens Avanto scanner (Siemens, Erlangen, Germany). Each participant was placed in the scanner in the supine position and fixation cushions were used to reduce head motion. First, participants completed an rs-fMRI session, in which the screen remained blank. Participants were instructed to remain still with eyes opened, not to think of anything in particular, and avoid sleeping. The rs-fMRI session was followed by the in-scanner performance of the visual search task (task-fMRI).
A gradient-echo T2*-weighted echo-planar MR sequence was used to obtain 270 volumes of rs-fMRI data (24 interleaved ascending slices, 3.5×3.5 mm in-plane voxel size, slice thickness 4 mm, interslice gap 0.8 mm, repetition time (TR)=2000 ms, echo time (TE)=48 ms, flip angle 90°, and 64×64 matrix) and 499 volumes for the fMRI task (29 interleaved ascending slices, 3.5×3.5 mm in-plane voxel size, slice thickness 3.6 mm, interslice gap 0.4 mm, TR=2500 ms, TE=50 ms, flip angle 90°, and 64×64 matrix). Task-based fMRI data acquisition was accurately synchronized with the stimuli presentation using an electronic trigger throughout the task.
Before the rs-fMRI and the task-fMRI scans, a high-resolution T1-weighted magnetization-prepared rapid gradient-echo anatomical image was obtained for each participant (19 interleaved slices, 1×1×1 mm in-plane voxel size, TR=2200 ms, TE=3.8 ms, flip angle 90°, 256×256×160 matrix). All the scanner acquisitions were done in parallel to the anterior–posterior commissure plane (AC-PC) to cover the entire brain. The total time inside the scanner was 40 min, distributed as follows: 10 min for the T1 scan, 9 min for the rs-fMRI scan, and 21 min for the task-fMRI scan.
Stimulus presentation was controlled through E-Prime software (Schneider et al., 2002), professional version 2.0, installed in a Hewlett-Packard portable workstation (screen resolution 800×600, refresh rate of 60 Hz). Participants watched the laptop screen through MRI-compatible goggles (VisuaStim, Resonance Technology, Inc., Northridge, CA) and their responses were collected through MRI-compatible response grips (NordicNeuroLab, Bergen, Norway). The E-Prime's log file saved several measures, including the stimuli presentation timing (onset) and duration, along with each participant's accuracy and reaction time (RT) to each stimulus.
Behavioral analysis
In terms of accuracy and RTs, participants' performance was processed with the IBM SPSS Statistics software (Version 22; Armonk, NY). A 2×2 analysis of variance (ANOVA) was conducted with Type of Search (within-category search vs. between-category search) and Type of Target (letters vs. numbers), as within-subject factors.
Preprocessing the task-fMRI data
fMRI data were processed by SPM8 (Wellcome Department of Imaging Neuroscience, London, England). Before preprocessing, each subject fMRI data set was aligned to the AC-PC plane using its own anatomical image. Subsequently, standard preprocessing was conducted, including correction of slice-timing differences for interleaved ascending acquisitions (using the middle slice, which was the 29th, as the reference slice) and the two-pass procedure in realignment (first, registration to the first image, then registration to the mean image) to correct head motion through acquisition. Spatial normalization was conducted using the mean resliced image as the source and the echo-planar image (EPI) provided by SPM8 as the template. During normalization to the Montreal Neurological Institute (MNI) space, functional images were resampled to 3 mm3. Finally, functional images were spatially smoothed using an isotropic Gaussian kernel of 6 mm full-width at half-maximum (FWHM).
Preprocessing the rs-fMRI data
The rs-fMRI datasets were processed with the DPARSF advanced software (Chao-Gan and Yu-Feng, 2010). Preprocessing included the slice-timing correction for interleaved ascending acquisitions (the 23th slice was used as the reference point) and realignment to correct involuntary head motion. Then, within the nuisance regression step and to reduce respiratory and cardiac effects on the blood-oxygenation level-dependent (BOLD) signal, several sources of spurious variance were removed: the linear trend in the time series, six parameters from rigid body head motion (obtained from motion correction), and three parameters corresponding to the global mean signal, the white matter signal, and the cerebrospinal fluid signal (Biswal et al., 1995). Next, spatial normalization to the MNI space (3 mm3) using EPI templates and spatial smoothing with an isotropic Gaussian kernel of 6-mm FWHM was conducted. Then, temporal filtering removed low- and high-frequency drift effects (0.01–0.08 Hz). Last, motion censoring (motion scrubbing) was conducted. Although no participant showed more than 0.5 mm of maximum displacement in any direction or 0.5° of any angular motion during the scan, three participants had less than 6.7 min of data (<200 volumes) after the scrubbing process, thus they were not included in the subsequent rs-fMRI analysis (Yan et al., 2013).
Task-fMRI data statistical analysis
The experimental effects in each voxel were estimated by the General Linear Model and by modeling the data at the block level. The BOLD signal was estimated by convolving stimuli with a canonical hemodynamic response function; six motion realignment parameters were included to explain signal variations due to head motion, that is, as covariates of no interest.
The first-level analyses resulted in the following three contrast images: (1) all the visual search conditions vs. control condition; (2) within-category search vs. control condition; and (3) between-category search vs. control condition. In the second-level analyses, t-statistics was computed to perform a whole-brain paired t-test to study the brain differences between the within-category and between-category searches in the entire brain. The results were below the threshold of p<0.05, familywise error (FWE) corrected for multiple comparisons at the voxel level. In addition, a whole-brain one-sample t-test, which tested all the visual search conditions>the control condition, was computed (p<0.05 FWE cluster corrected using a threshold of p<0.001 at the uncorrected voxel level, k=52); this result was saved as a binary image mask.
Definition of SPL regions of interest
The left and right anatomical regions (or masks), labeled as SPL in the automated anatomical labeling atlas (AAL) (Tzourio-Mazoyer et al., 2002), were used to localize the specific area of the left SPL and the right SPL involved in the visual search task by means of the SPM Wake Forest University PickAtlas software (Maldjian et al., 2003). For this purpose, small-volume correction was used when each AAL SPL mask was introduced as a region of interest in the within-category>between-category search paired t-test comparison. The results were below the threshold of p<0.05, FWE corrected for multiple comparisons at the voxel level. Then, the coordinates of the peak maxima activation of the t-test were used as the center for the definition of two 6-mm radius spheres (onward, seed regions) for further rs-fMRI analyses.
rs-fMRI data statistical analyses
The voxelwise FC analyses were performed separately with each SPL seed region and were processed by the DPARSF advanced software. For each participant, a whole-brain Pearson's correlation was performed and yielded an r-map. Subsequently, this individual r-map was normalized to a z-map with Fisher's z transformation. Finally, SPM 8 was used to conduct the following two different analyses: (1) a whole-brain one-sample t-test to reveal the connectivity between SPL and all the other voxels of the brain at rest (p<0.05 FWE cluster corrected using a threshold of p<0.001 at the uncorrected voxel level, left SPL k=89 voxels, and right SPL k=57 voxels) (Woo et al., 2014); (2) whole-brain multiple regression analyses between each participant's z-map and performance measures (accuracy scores and RTs).
In these multiple regression analyses, to localize the visual input related to the visual search, the one-sample t-test task-fMRI result was used as an inclusive binary-image mask (p<0.05 FWE cluster corrected using a threshold of p<0.001 at the uncorrected voxel level, k=52). The regressors were introduced as direct measures of each condition (e.g., the accuracy scores of searching letters among letters) or as subtractions of the within-category minus the between-category search (i.e., the general difference, the difference between the letter conditions or the difference between the number conditions). The multiple regression analyses results of the within-category search RTs>between-category search RTs were below the threshold of p<0.05, FWE cluster corrected using a threshold of p<0.001 uncorrected at the voxel level (k=40 voxels) (Woo et al., 2014).
Subsequently, Pearson's correlation analyses were conducted by means of SPSS between SPL-V1 FC z-values and (1) the subtraction of the within-category search RT minus the between-category search RT, (2) the same subtraction considering only the letter conditions, and (3) the same subtraction considering only the number conditions.
Results
Behavioral results
The behavioral results appear in Figure 2. Regarding accuracy, the 2×2 ANOVA yielded a main effect of Type of Search (F(1,22) =52.10 p=0.001) and indicated that the between-category search was better performed than the within-category search. This effect was significant for both letters and numbers (p<0.05). This main effect was driven by the significant Type of Search x Type of Target interaction (F(1,22) =5.12 p=0.034), which indicated that the main effect of Type of Search was stronger for letters than for numbers (see the left panel of Fig. 2).
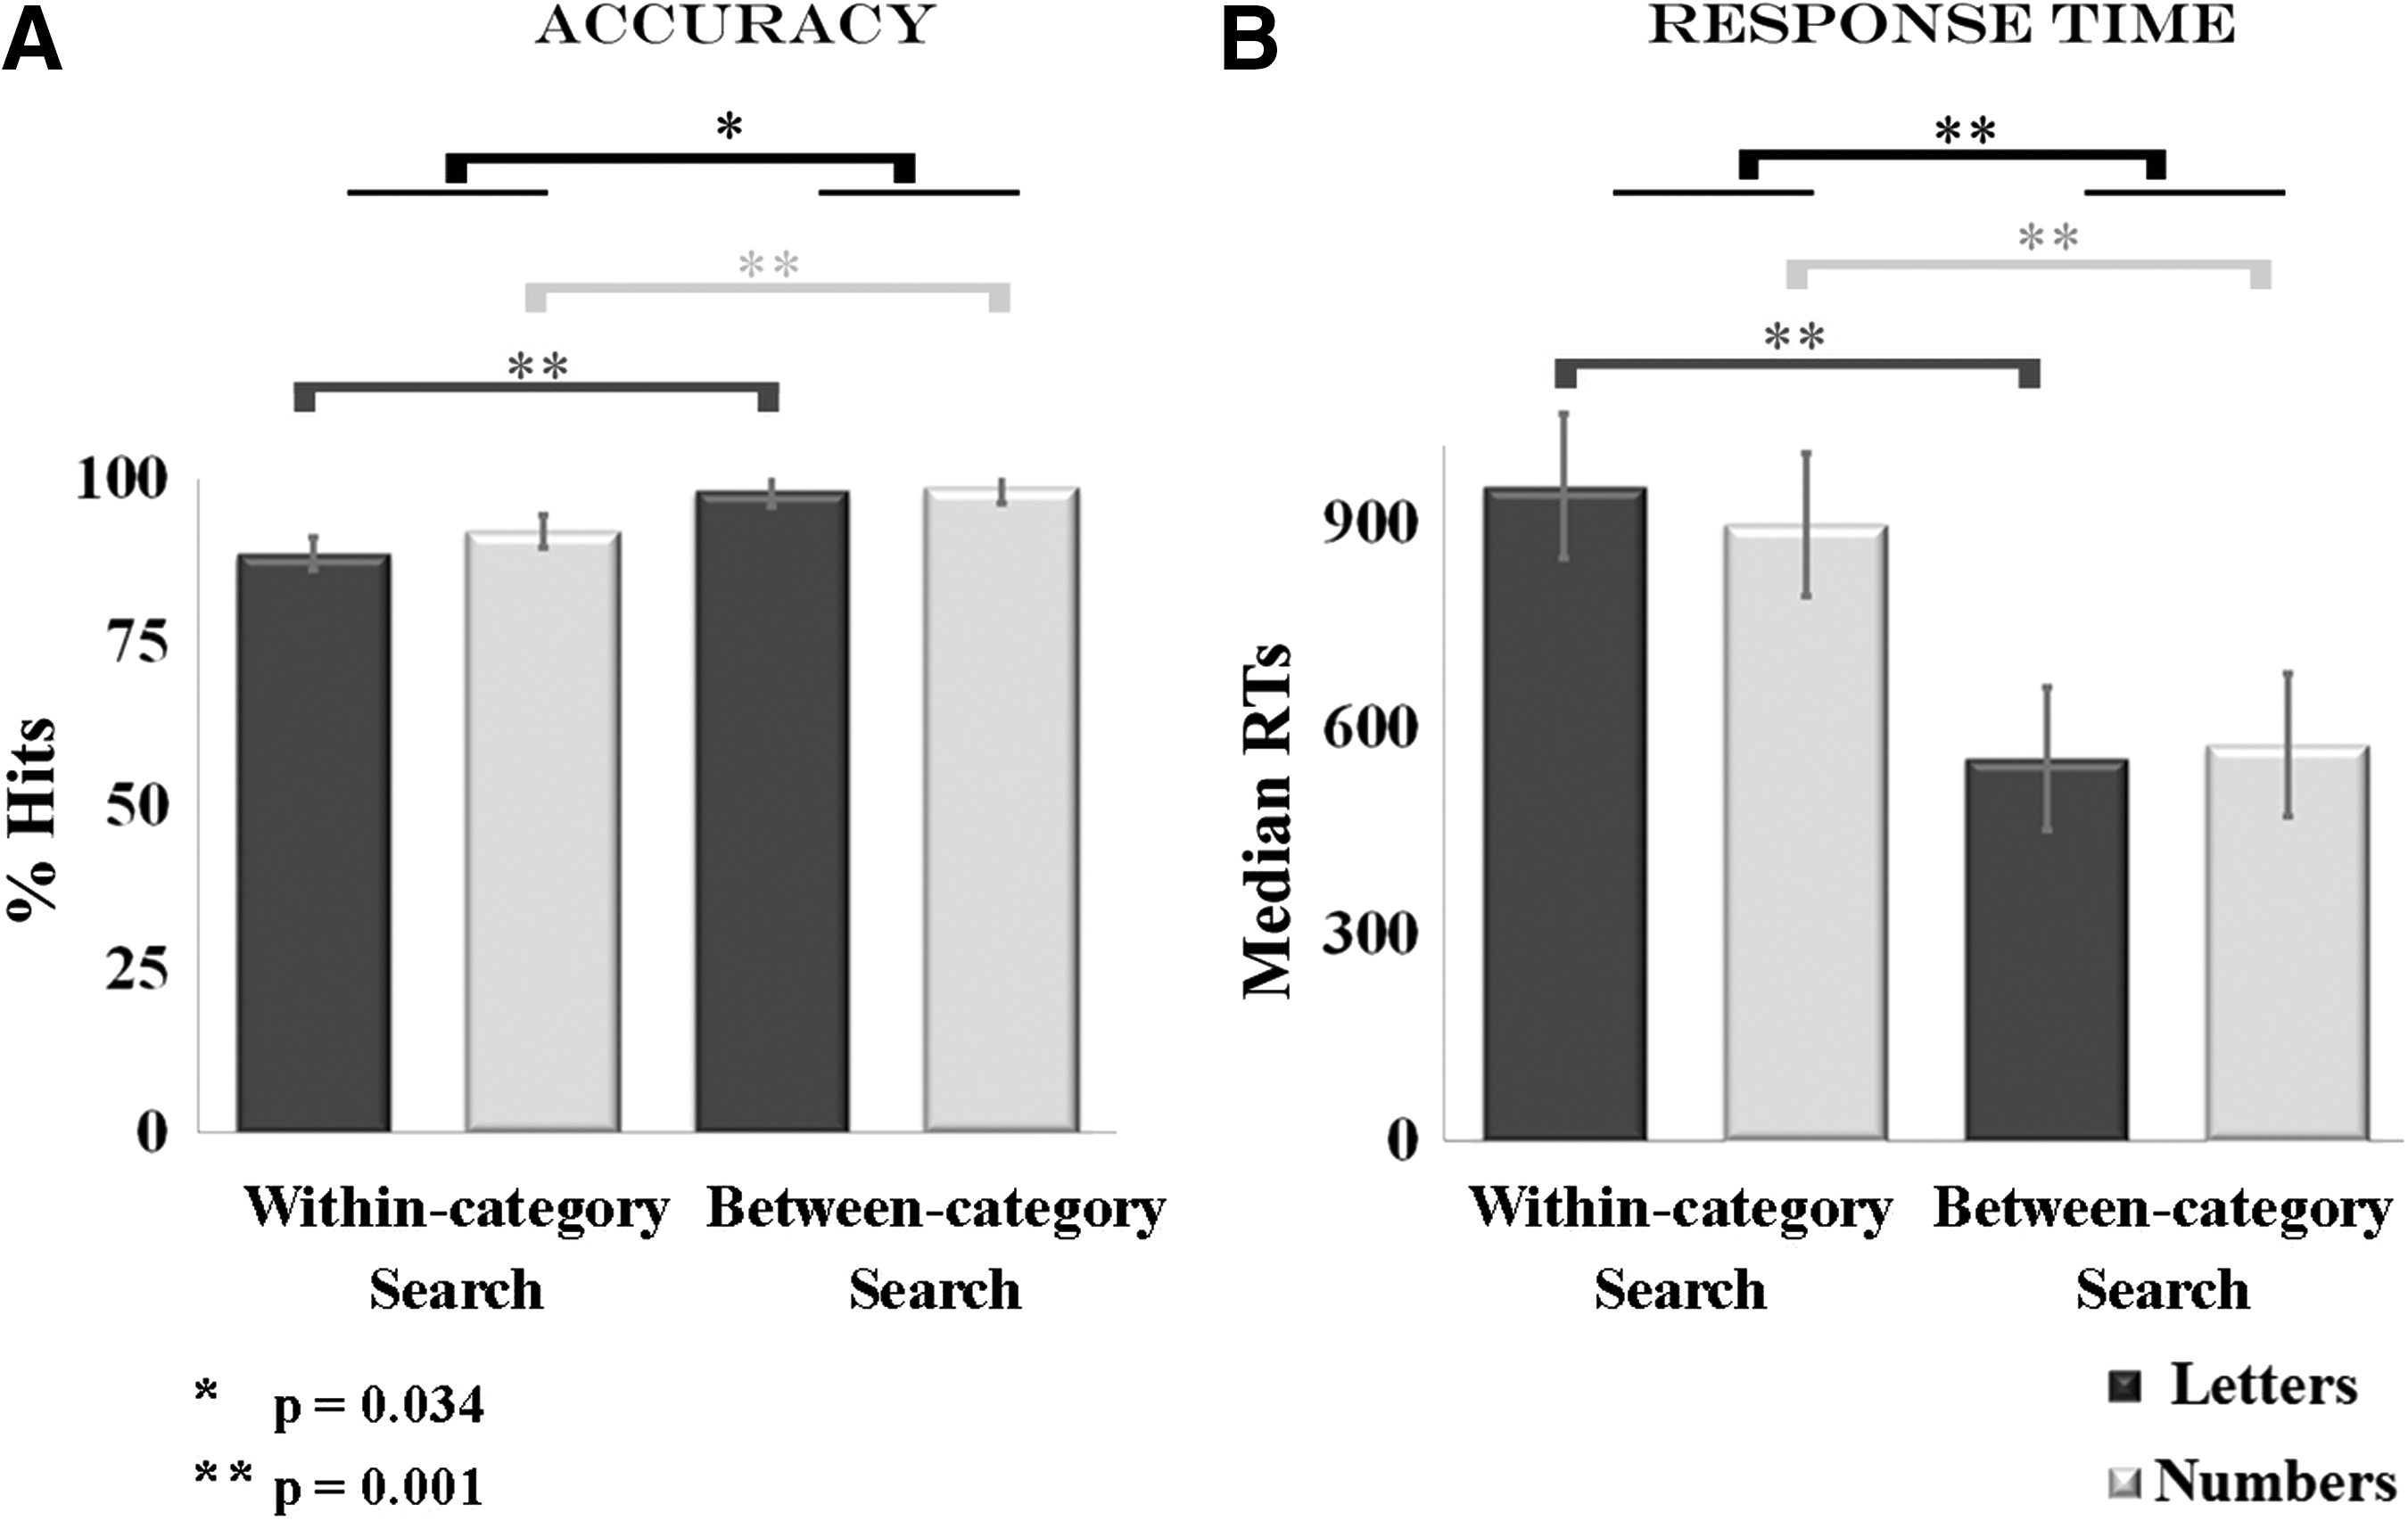
Visual search task behavioral performance.
Regarding RTs, a main Type of Search effect was also found (F(1,22) =339.66 p=0.001), which suggested that the within-category search was more slowly performed than the between-category search. Once again, this effect was significant for both letters and numbers (p<0.05). This interaction was qualified by the significant Type of Search x Type of Target interaction effect (F(1,22) =24.82 p=0.001), which indicated that the main effect of Type of Search was stronger for letters than for numbers (see right panel of Fig. 2).
fMRI task results
The paired t-test comparison of the within-category search minus the between-category search (p<0.05, FWE corrected for multiple comparisons at the voxel level) yielded greater activation in bilateral medial and lateral OC, bilateral fusiform gyrus, bilateral inferior parietal lobule (IPL) extending to intraparietal sulci and SPL, bilateral dorsal anterior cingulate cortex (dACC), bilateral DLPFC, bilateral anterior insula, bilateral superior colliculus, and bilateral cerebellum (anterior part and vermis). Left lateralized activation was observed in the frontal eye field (FEF) and in the thalamus (see Table 1 for detailed information about peak coordinates and z-values, and Fig. 3). No significant results were found in the reverse contrast.

Results of the visual search task-fMRI whole-brain analysis. Brain regions showing increased activation as a result of the whole-brain paired t-test comparison of the within-category minus the between-category search (p<0.05, FWE voxel corrected). The z coordinates are in the MNI space. L, left, R, right; fMRI, functional magnetic resonance imaging; FWE, familywise error. Color images available online at
Task-fMRI Analysis
List of significant brain activations as a result of the paired t-test comparison made between the within-category search and the between-category search contrast images. Whole-brain analyses conducted at p<0.05, FWE corrected for multiple comparisons at the voxel level. The x, y, and z coordinates are in the MNI space.
L, left; R, right; FEF, frontal eye field; fMRI, functional magnetic resonance imaging; FWE, familywise error; MNI, Montreal Neurological Institute.
Resting-state FC results
The connectivity analyses centered on studying the FC of the SPL with all the other brain voxels. For this purpose, task-related seed regions, left SPL (MNI: −21, −64, 40) and right SPL (MNI: 21, −64, 49), were used (Fig. 4).
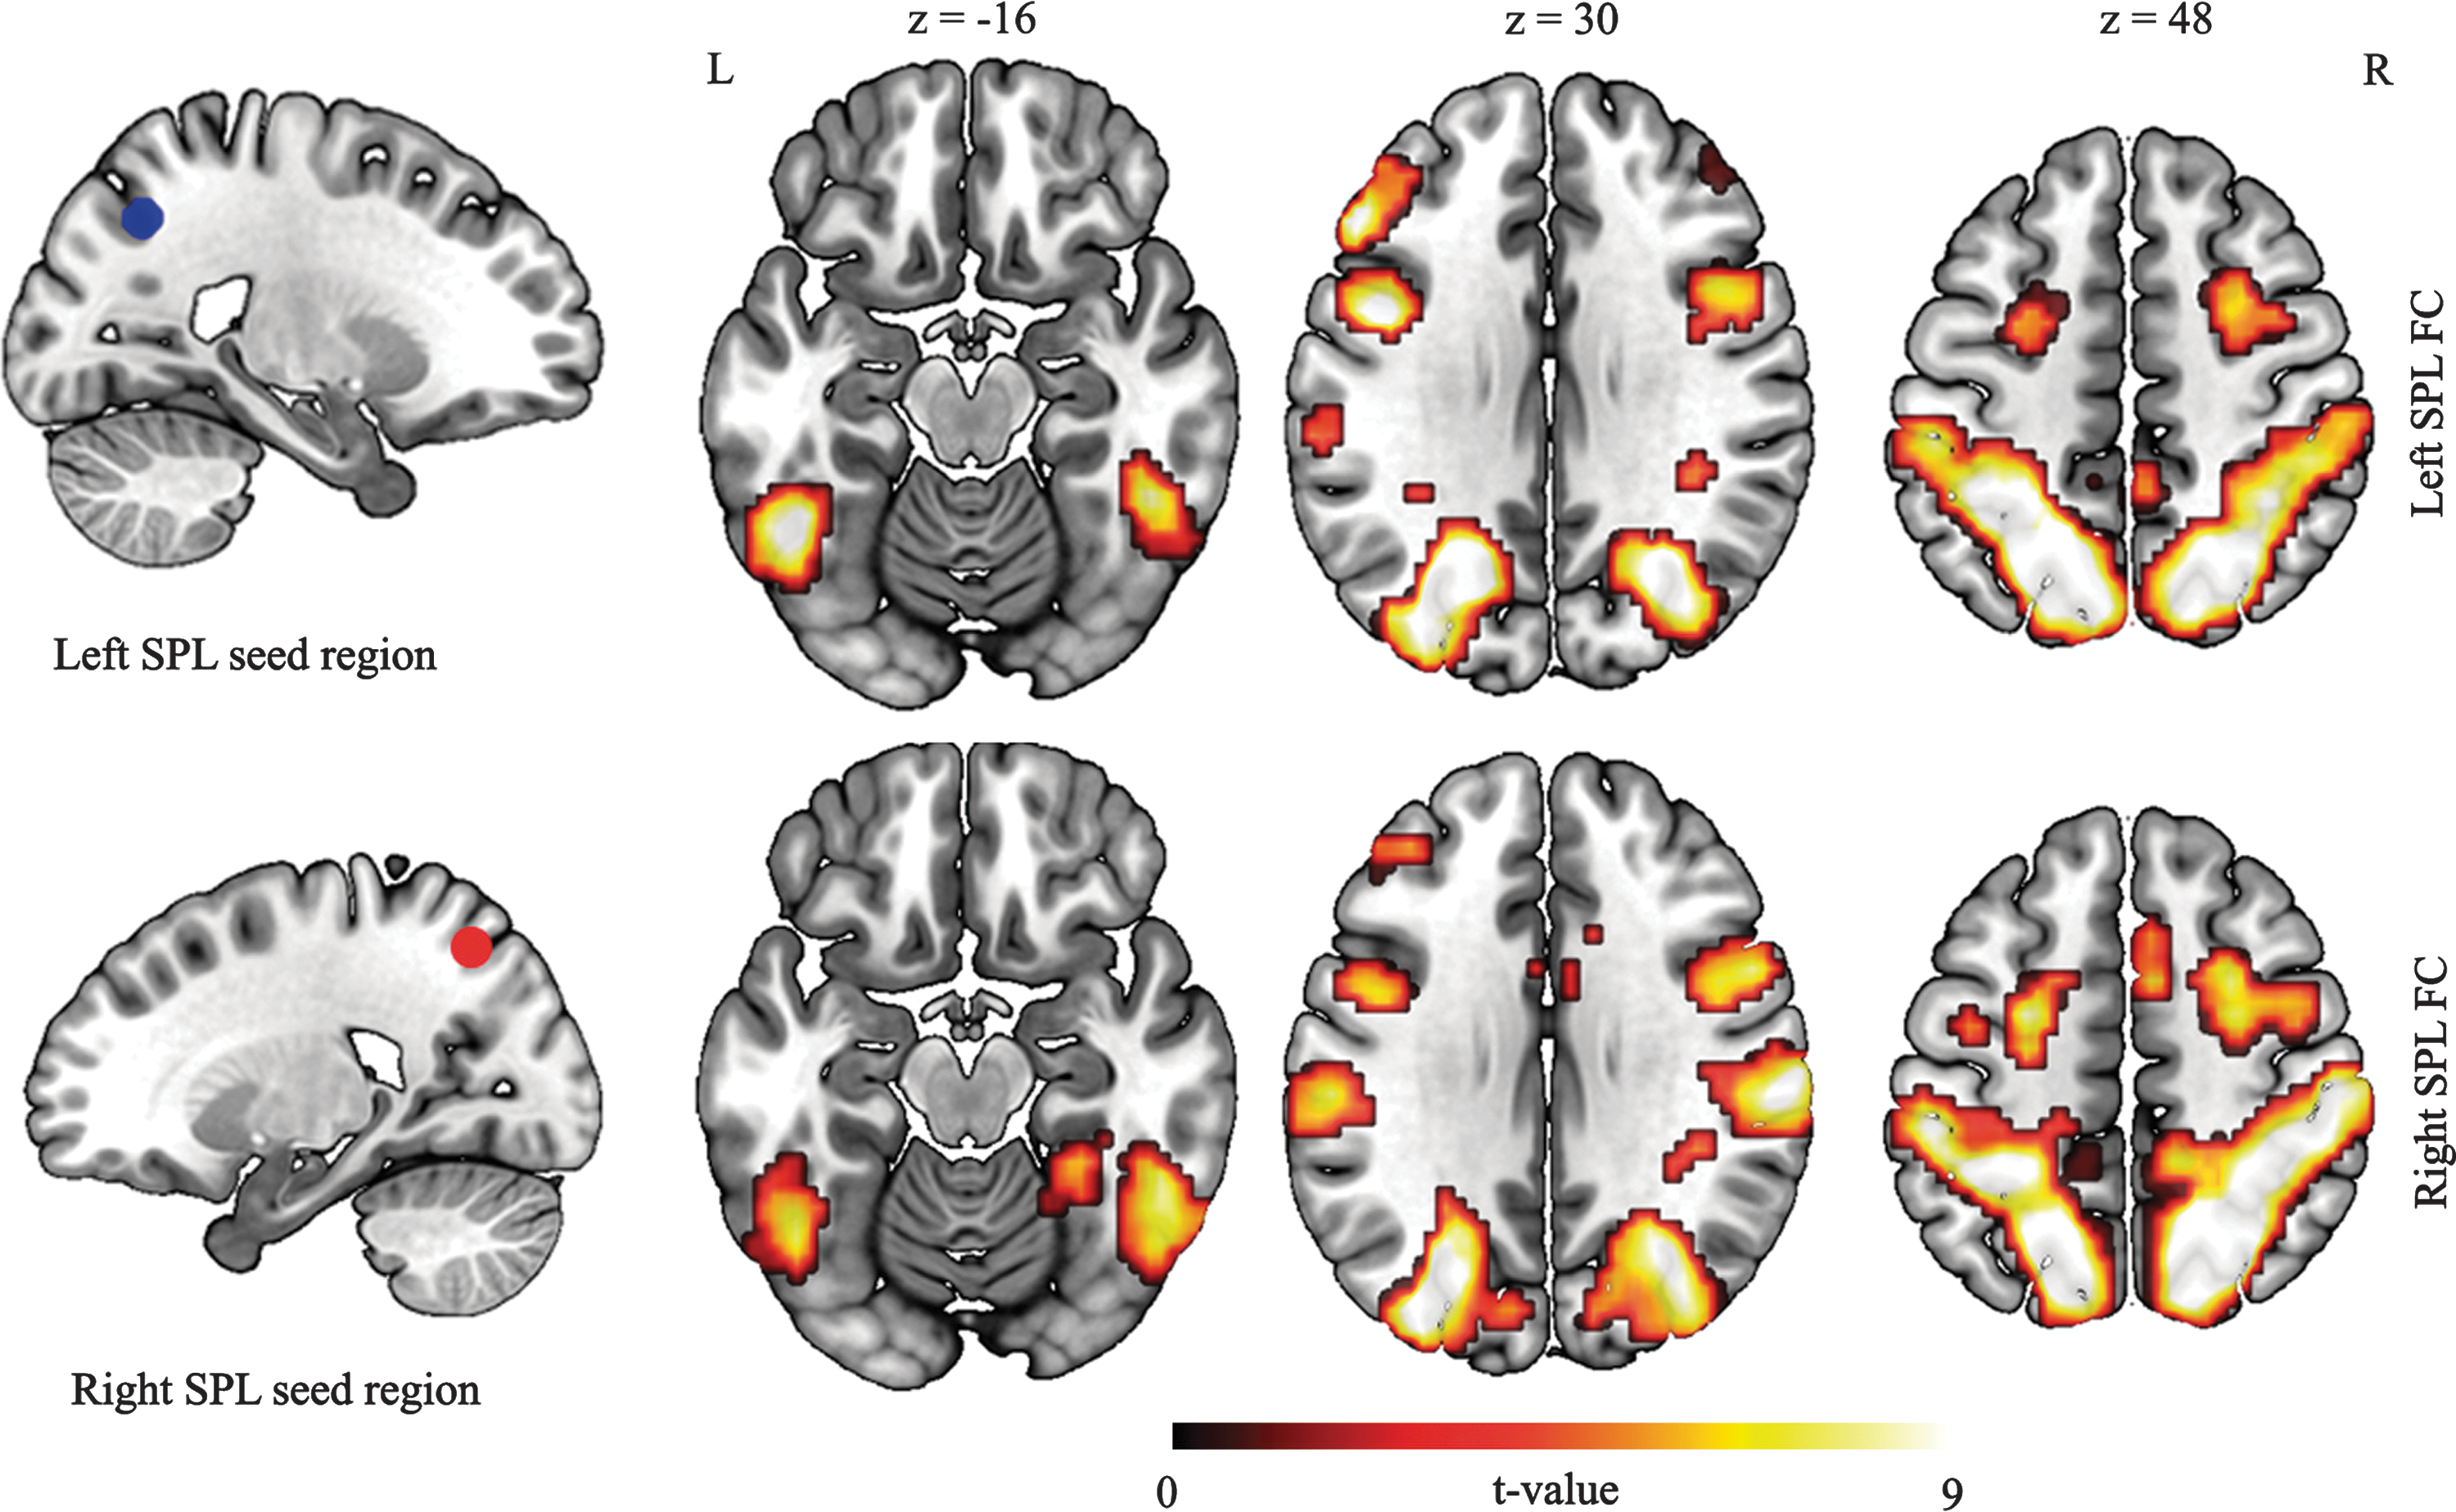
Results of the SPL functional connectivity analysis. The left and right SPL seed regions were obtained from the within-category search>between-category search task-fMRI and were defined as 6-mm-radius spheres. Brain regions showing a synchronous pattern of spontaneous fluctuations at rest were obtained after conducting a whole-brain one-sample t-test with the individual z-maps of each SPL performed (p<0.05 FWE cluster corrected). The z coordinates are in the MNI space. SPL, superior parietal lobule. Color images available online at
The FC analysis revealed that the brain regions connected with the left or the right SPL are similar (see Table 2 for detailed information). The conducted one-sample t-test analysis with the FC z-maps of the left SPL seed region revealed that the left SPL established significant brain connections in the resting state with the right SPL and IPL, bilateral posterior areas (precuneus, middle OC), bilateral IT and fusiform gyrus, bilateral supplementary motor area (SMA) and FEF, bilateral DLPFC (BA 9), and the bilateral inferior and middle frontal cortex (BA 44 and BA 45) (see upper part of Fig. 4). In turn, the right SPL was significantly connected to the bilateral middle and superior occipital gyrus, right lingual gyrus, bilateral fusiform gyrus, bilateral inferior and middle temporal gyrus, left SPL and IPL, right angular gyrus, bilateral SMA and FEF, left precentral gyrus, and finally the left cerebellum (see lower part of Fig. 4).
Functional Connectivity of the SPL Seed Regions
List of significant brain activations as a result of the one-sample t-test of the individual SPL FC z-maps. Whole-brain analyses conducted at p<0.05, FWE corrected for multiple comparisons at the cluster level (minimum cluster size k=89 voxels for left SPL and k=57 voxels for right SPL). The x, y, and z coordinates are in the MNI space.
SPL, superior parietal lobule; DLPFC, dorsolateral prefrontal cortex; SMA, supplementary motor area; FC, functional connectivity.
Regression analyses on FC
The FC analyses of the SPL allowed us to study the connectivity of the SPL with all the other brain regions. The results were restricted to visual search areas by means of an inclusive binary-image mask, which was obtained from the above-mentioned all search conditions>control task one-sample t-test (see Supplementary Data; Supplementary Data are available online at
The left SPL seed region FC z-maps gave significant results only when RTs expressed the general difference of the within-category minus the between-category search; this yielded a negative correlation between this measure and the connectivity of the SPL and the primary visual cortex (V1) (rpearson =−0.82, p<0.001, n=20) (Table 3 and Fig. 5). This correlation pattern was found only when RTs reflected the difference between the letter conditions (rpearson =−0.77, p<0.001, n=20) or the number conditions (rpearson = −0.81, p<0.001, n=20) (Table 3); that is, FC predicted participants' performance during the search task: the SPL-V1 correlation led to faster RTs in the within-category search (compared to the between-category search) and, in turn, the SPL-V1 anticorrelation led to slower RTs.
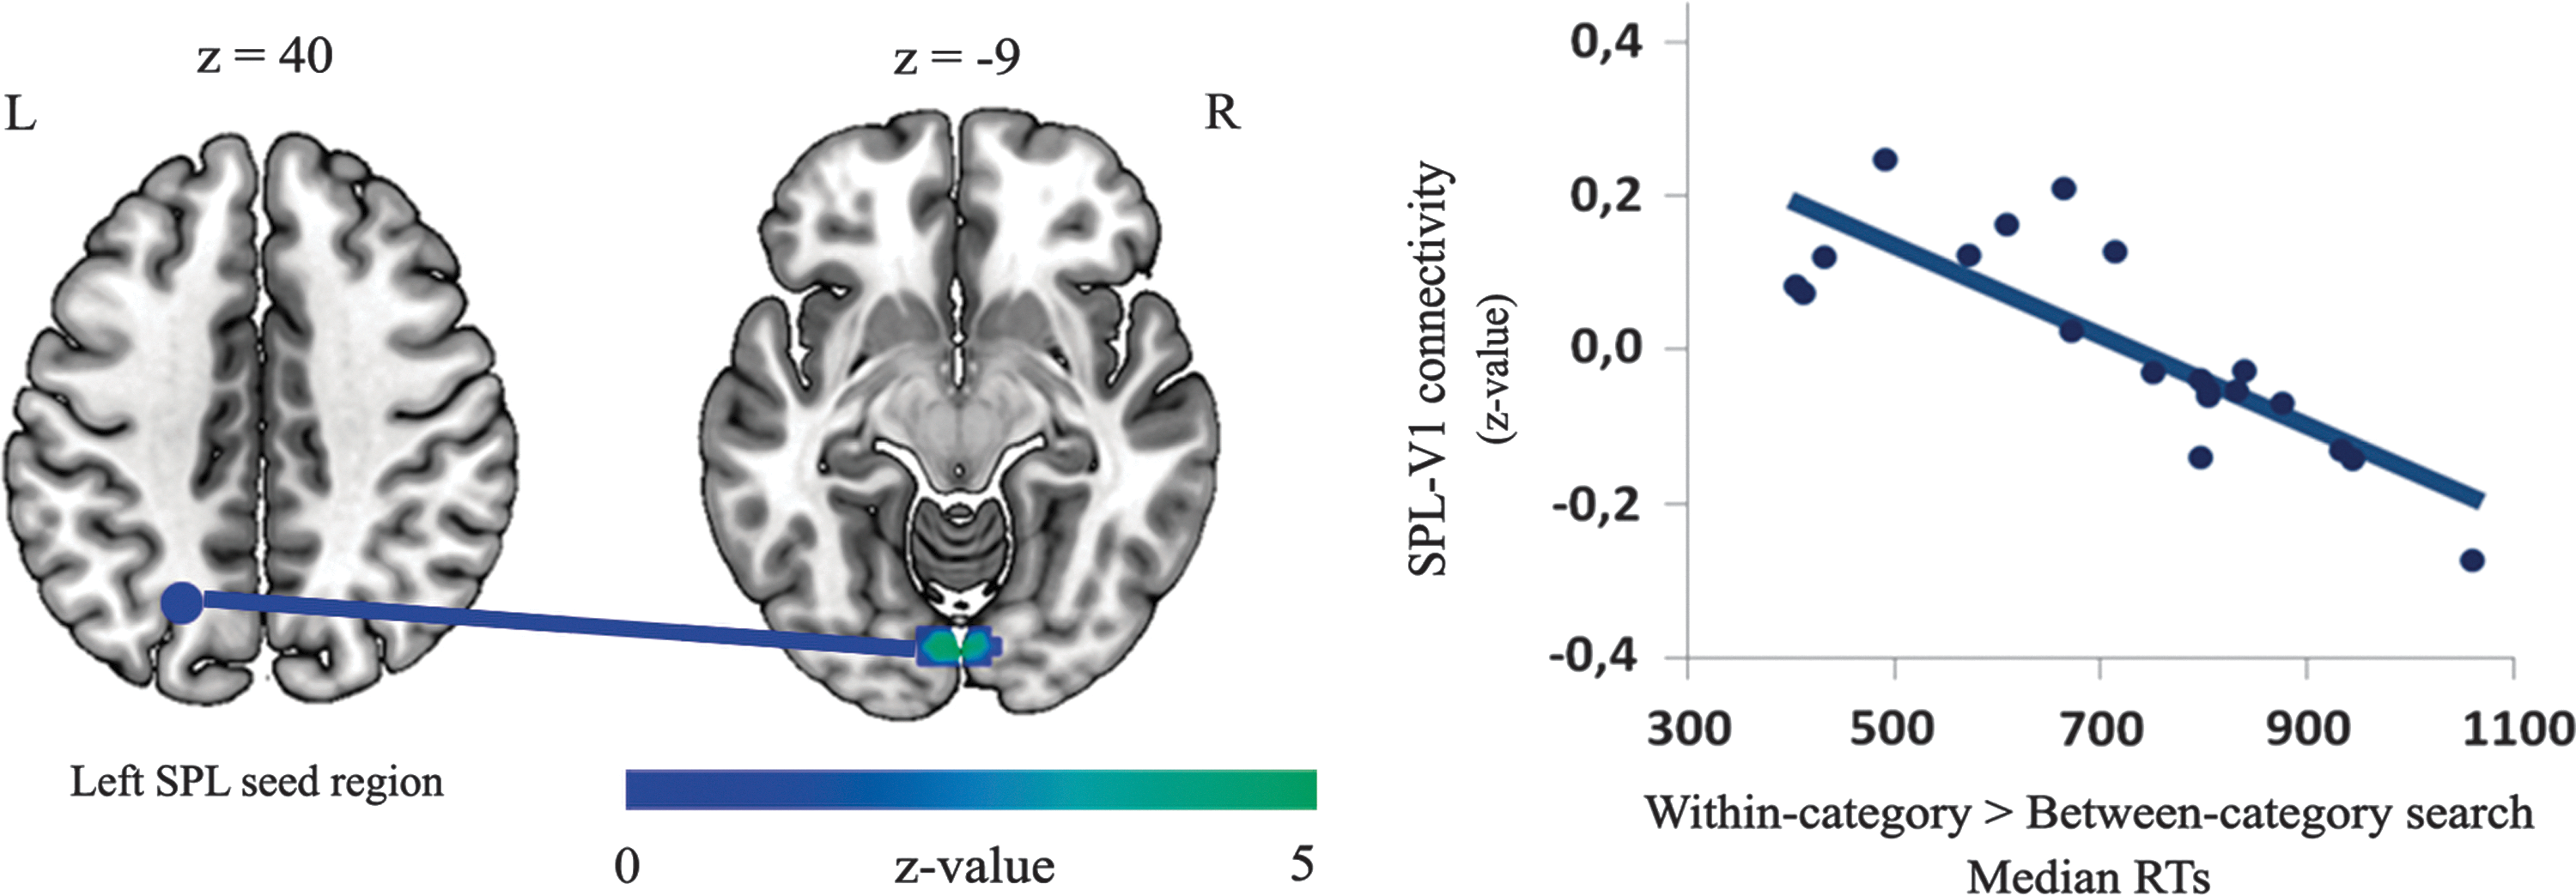
Results of the multiple regression rs-fMRI analysis. Results of the multiple regression analysis with the individual left SPL FC z-maps and the RTs as regressors. The connectivity between the SPL and V1 (p<0.05, FWE cluster corrected) (symbolic line) correlated negatively with the target-detection speed during the visual search task (rpearson
= −0.82, p<0.001, n=20; RT values expressed the general difference of the within-category minus the between-category search). FC, functional connectivity; rs-fMRI, resting-state fMRI. Color images available online at
Results of the Multiple Regression Analysis with the Left SPL FC z-maps and the Reaction Time Measures
(A) Results found when RTs expressed the general difference in search speed (within-category search RTs>between-category search RTs). Whole-brain analysis conducted p<0.05, FWE corrected for multiple comparisons at the cluster level (minimum k extent=40 voxels). (B) Results found when RTs expressed the difference in search speed under the letter conditions. Whole-brain analysis conducted p<0.001, uncorrected voxel level. (C) Results found when the RTs expressed the difference in search speed under the numbers conditions. Whole-brain analysis conducted p<0.001, uncorrected voxel level. The x, y, and z coordinates are in the MNI space.
N, negative correlation.
As multiple regression analyses results were located on the visual cortex and to ensure that activations correspond to area V1, the superposition of functional maps to cytoarchitectonic maps was conducted. The cluster peak maxima activation was located on V1 (62% of probability) and the majority of the cluster voxels belonged to that area (54% of probability) (overlap between structure and function toolkit from the SPM Anatomy Toolbox; Eickhoff et al., 2005, 2006, 2007). No other significant correlations with the left SPL or the right SPL seed regions were found when using RTs or accuracy measures.
Discussion
This research focused on the study of the FC of the SPL in the resting state and also on the capacity of FC to explain individual differences while performing visual search tasks. For this purpose, participants completed an fMRI session, which consisted of an rs-fMRI scan, followed by the performance of a visual search task. Significant behavioral and functional differences were found in relation to task performance. As expected, the within-category search led not only to lower accuracy scores and slower RTs than the between-category search but also an increased activation of the visual search brain-related areas, including the SPL, was observed.
Activation in the SPL served to localize the specific area in this region involved in the task. The voxelwise study of FC at rest revealed that this area of the SPL was functionally connected to spatially distant brain areas like the IT and the DLPFC. The connectivity relationship between the SPL and V1 also predicted performance during the visual search task. In line with the priority map model (Bisley and Goldberg, 2010), our results demonstrated that FC at rest between parietal and occipital areas was able to determine individual efficiency in terms of target detection during a complex new search. Thus, FC at rest may be used to test neurocognitive models of cognition.
As the categorization effect predicts, participants outperformed the between-category conditions compared to the within-category conditions (Brand, 1971). In fact, our behavioral results support the claim that learned artificial categories of stimuli, like alphanumeric stimuli, have an impact on attention, specifically object identification, because they are processed preattentionally in early visual processing stages (Esterman et al., 2004; Hamilton et al., 2006). According to recent accounts of visual search, selection of targets depends on task demands, whereas serial selection occurs under highly demanding conditions, such as the within-category searches of our visual search task; parallel selection is performed during less challenging tasks, such as between-category searches (Eimer and Grubert, 2014;Woodman and Luck, 2003; see Eimer 2014 for a review).
In contrast, the functional network involved in the visual search task—OC, IPL and SPL, FEF, insular cortex, dACC, DLPFC, inferior frontal gyrus, thalamus, superior colliculus—showed an increased BOLD signal under the within-category conditions compared to the between-category ones. Diverse areas, such as the posterior parietal cortex, FEF, DLPFC, or thalamus, participate in attentional selection processes by establishing priority maps and sending signals to the OC (Eimer, 2014). The activity in the inferior frontal gyrus and insula may be related to the processing of alphanumeric stimulus, whereas superior colliculus is involved in attentional movement (Posner and Petersen, 1990).
Taking all together, it could be argued that when targets and distractors share categorical features, a subsequent influence occurs on target identification, and hence, on attentional control demands. This condition could lead to the necessity of processing information in a serial mode and, in turn, this processing could be reflected in generally increased brain activation in visual search-related areas.
Activation of SPL areas is especially relevant when studying visual attention systems. The functional activation that occurred while the visual search task was performed came very close to that observed in previous studies (Todd and Marois, 2004; Xu and Chun, 2006; Yantis et al., 2002). The role of this area is to represent the visual world, including the relative relevance of stimuli for the task on a multiobject display.
Specifically, the SPL calculates a priority map of possible targets according to their behavioral and task relevance and takes into account bottom–up inputs from visual areas (Bisley and Goldberg, 2010). In addition, when a target number appears on a rapid serial visual presentation stream of letters, increased activation on the SPL is linked to a shift in attention (Yantis et al., 2002). Thus, the role that the SPL plays in our study might be related to the process that preattentionally establishes a map, which includes information about the category of each alphanumeric stimulus in the visual array to guide the focus of attention during the search task.
Having obtained the specific coordinates of the SPL from the fMRI search task, we calculated the FC of this area. It is widely assumed that FC reflects the interregional coherence of activity fluctuations in underlying neuronal networks. As predicted by some theoretical models of the visual attention system, such as the computational approach proposed by Deco and Rolls (2005), neurons in this specific area of the SPL, which were involved in visual search, synchronously fluctuated with both IT and DLPFC. In addition, other frontal regions like the SMA and FEF, also correlated with the SPL activity. Overall, our SPL FC represents a large-scale network that supports visual search and working memory tasks.
The only area in the model that did not show an obvious correlation with the SPL was V1. In FC studies of V1 at rest, strong correlations of V1 are found only with adjacent visual areas (i.e., V2, V3) (Shmuel and Leopold, 2008; Raemaekers et al., 2014). Since strong FC is usually observed within visual areas, we can expect lower correlations with other distant areas, such as the SPL.
Despite no evident correlation having been found between both areas, the relationship between SPL and V1 was driven by response speed when detecting targets in the same category: the faster the response during the within-category trials, the better correlated the FC pattern between the left SPL and bilateral V1 in the resting state; in turn, anticorrelated SPL-V1 connectivity was related to slower responses. This result is consistent with the idea that the top–down control of the attention function performed by the SPL, which allowed shifts of focus of attention through different objects in space, was made in conjunction with the primary visual cortex.
This is precisely what is proposed in the priority map model, which attributes the role of establishing priority maps to the SPL by creating a topographic map of the space where target-related and environment-related information is integrated, and it is also able to modulate its visual perception activity to control and direct attention to specific objects (Bisley and Goldberg, 2010; Ptak, 2012; Shomstein, 2012). Previous literature has related FC to the prediction of individual differences in perceptual working memory and language tasks, which either featured learning paradigms or did not (Baldassarre et al., 2012; Hampson et al., 2006; Sala-Llonch et al., 2012; Ventura-Campos et al., 2013; see Harmelech and Malach, 2013).
What our data support is that FC is a powerful tool to study the personal predisposition to processing information. In this particular case, the relationship between visual search task performance and connectivity between the SPL and V1 evidenced the role of the SPL in guiding the attention system and can serve to predict individual differences in search speed.
Conclusion
The visual search task has allowed us to characterize brain activity in the categorization effect and to link the task-related pattern of activation to information processing by the attention system. We have taken a further step using an FC analysis to test a hypothesis, which has stemmed from visual attention theoretical models. By studying the FC of the SPL, we provide empirical data that support a neurocomputational visual search model (Deco and Lee, 2004; Deco and Rolls, 2005). The SPL is a core node of a large-scale cortical network that includes DLPFC and IT, necessary to perform visual attention and working memory tasks. In addition, our analysis has also shed light on how the FC between spatially separated cortical regions, such as SPL and V1, is directly related to visual attention task performance.
Footnotes
Acknowledgments
This research was supported by grants from the Spanish Department of Economy and Competitiveness (PSI2013-47504-R) and the Jaume I University (P1·1B2013-63). Authors E.B., M.-A.P.-G., and A.M.-P. were supported by predoctoral graduate program grants (National FPU to E.B.; National FPI to M.-A.P.-G.; and Jaume I University FPI to A.M.-P.).
Author Disclosure Statement
No competing financial interests exist.
References
Supplementary Material
Please find the following supplemental material available below.
For Open Access articles published under a Creative Commons License, all supplemental material carries the same license as the article it is associated with.
For non-Open Access articles published, all supplemental material carries a non-exclusive license, and permission requests for re-use of supplemental material or any part of supplemental material shall be sent directly to the copyright owner as specified in the copyright notice associated with the article.