
Abstract
Individuals with focal epilepsy have heterogeneous sites of seizure origin. However, there may be brain regions that are common to most cases of intractable focal epilepsy. In this study, we aim to identify these using multivariate analysis of task-free functional MRI. Fourteen subjects with extratemporal focal epilepsy and 14 healthy controls were included in the study. Task-free functional MRI data were used to calculate voxel-wise regional connectivity with regional homogeneity (ReHo) and weighted degree centrality (DC w ), in addition to regional activity using fraction of amplitude of low-frequency fluctuations (fALFF). Multivariate pattern analysis was applied to each of these metrics to discriminate brain areas that differed between focal epilepsy subjects and healthy controls. ReHo and DC w classified focal epilepsy subjects from healthy controls with high accuracy (89.3% and 75%, respectively). However, fALFF did not significantly classify patients from controls. Increased regional network activity in epilepsy subjects was seen in the ipsilateral piriform cortex, insula, and thalamus, in addition to the dorsal anterior cingulate cortex and lateral frontal cortices. Decreased regional connectivity was observed in the ventromedial prefrontal cortex, as well as lateral temporal cortices. Patients with extratemporal focal epilepsy have common areas of abnormality (ReHo and DC w measures), including the ipsilateral piriform cortex, temporal neocortex, and ventromedial prefrontal cortex. ReHo shows additional increase in the “salience network” that includes anterior insula and anterior cingulate cortex. DC w showed additional effects in the ipsilateral thalamus and striatum. These brain areas may represent key regional network properties underlying focal epilepsy.
Introduction
People with focal epilepsy constitute a heterogeneous group of epilepsy patients, where the individual's symptomatology is largely dependent on the spatial location of seizure onset zones (Noachtar and Peters, 2009).
Despite its diverse nature, common areas of brain dysfunction in focal epilepsy patients have previously been identified using simultaneous electroencephalography recordings and functional magnetic resonance imaging (EEG-fMRI) (Fahoum et al., 2012; Flanagan et al., 2014; Laufs et al., 2011). Several areas are implicated in focal epilepsy, including the piriform cortex (Flanagan et al., 2014; Laufs et al., 2011), insula, thalamus, and cingulate areas (Fahoum et al., 2012), all showing increased blood oxygen level-dependent (BOLD) change during epileptiform discharges.
The ability to reliably detect patterns of brain differences between disease and healthy groups using individual-level information will provide clinically useful interpretation of neuroimaging data (Klöppel et al., 2012). Multivariate pattern analysis (MVPA) is a promising approach in this regard. MVPA considers overall brain differences between two groups (e.g., disease and control groups) and, consequently, uses these “group” parameters to classify each subject individually—providing a good estimate of group commonalities. MVPA has been increasingly used in neuroimaging (Norman et al., 2006; Pereira et al., 2009) due to its propensity to detect common markers to specific disease groups (Orrù et al., 2012), potentially by exploiting between-voxel variability over between-subject variability (Davis et al., 2014).
Dysregulation of local circuits and hyperexcitable assemblies of neurons (Neubauer et al., 2014; Shao and Dudek, 2005) play an integral role in seizure generation in focal epilepsy. Given the importance of regional dysregulation of neurons in focal epilepsy, we applied three frequently used model-free voxel measures of regional brain functioning in the absence of any task to classify brain areas that are commonly abnormal in subjects with extratemporal epilepsy.
Materials and Methods
Subjects
Included in the study were 14 patients with extratemporal lobe epilepsy (mean age: 31.8 ± 11.8 standard deviation (SD), eight female) who were enrolled in the Comprehensive Epilepsy Programme at Austin Hospital (Melbourne, Australia) for presurgical consideration between the years 2012 and 2015. Included in the study were also 14 age- and gender-matched healthy controls (mean age: 32.4 ± 10.0 SD, six female). This patient cohort has previously been published with an unrelated analysis of large-scale network modeling (Pedersen et al., 2015b). Table 1 outlines clinical information of all the subjects with focal epilepsy. Worthy of note is that half of the clinical cohort has some form of focal frontal lobe epilepsy (pt No. 2, 5, 7, 9, 10, 12, and 14), but in spatially and functionally disparate regions of the frontal lobe (including ventral and superior aspects of medial and lateral areas). Two patients have presumed seizure onset in areas proximate to the temporo-parieto-occipital junction (pt No. 1 and 13), but distant from mesial temporal structures. Six patients are MRI positive with structural imaging features of focal cortical dysplasia (Table 1). We also suspect that the MRI-negative patients also have a form of subtle occult dysplasia, however, not visible with standard structural imaging techniques. No subjects have structural imaging evidence of hippocampal sclerosis. In patients who underwent surgery (Table 1), all scans were performed before surgery. The study was approved by the Austin Health Human Research Ethics Committee, and all subjects gave written consent to participate in the study.
A Clinical Overview of All Epilepsy Patients
ACC, anterior cingulate cortex; AED, number of current antiepileptic drug; EEG, electroencephalography; F, female; FCD, focal cortical dysplasia; Front, frontal; iSPECT, ictal single-photon emission computed tomography; L, left; M, male; Mid, middle; MRI, magnetic resonance imaging; MF, multifocal; N, no; NF, nonfocal; PET, positron emission tomography; Pt No., patient number; PSYCH, neuropsychological and/or psychiatric problems; R, right; SF, seizure free; TPO, temporo-parieto-occipital junction; Y, yes; +, PET/iSPECT positive; −, PET/iSPECT negative.
Data preprocessing
All subjects were scanned with Siemens (Siemens, Erlanger, Germany) 3T Skyra and Trio scanners. Functional data were acquired using the echo-planar imaging sequence with 44 interleaved 3 mm slices, TR = 3000 ms, TE = 30 ms, voxel size = 3 × 3 × 3 mm, and acquisition matrix of 72 × 72. T1-weighted images were also acquired during the functional scans. Ten minutes (200 volumes) of task-free fMRI data were used for all subjects. Preprocessing was conducted using statistical parametric mapping (SPM) (Friston et al., 2007) and Data Processing Assistant for Resting-State fMRI (DPARSF) (Chao-Gan and Yu-Feng, 2010) in MATLAB R2013a (MathWorks, Inc., Natick, MA). Images were slice timed and realigned before coregistering the functional images to structural T1-weighted images. Tissue types were segmented into gray matter, white matter, and cerebrospinal fluid using a fast diffeomorphic registration algorithm (DARTEL—Ashburner, 2007). The images were then normalized to standard Montreal Neurological Institute space with a voxel size of 3 × 3 × 3 mm. The BOLD data were further detrended, and the average white matter and cerebrospinal fluid signal and 24 motion parameters (Friston et al., 1996) were regressed out from the data. The data were filtered between a frequency range of 0.01 and 0.08 Hz using an ideal rectangle filter approach.
No statistical difference was found in average in-scanner head movement between extratemporal lobe epilepsy subjects and healthy controls (two-sample t test, p = 0.40). However, to avoid temporal discontinuity within the fMRI time series, time points with head movement above 0.5 mm (in addition to the time point before and after the movement) were removed and replaced with an average nearest neighbor estimate (Power et al., 2012). Data used for fraction of amplitude of low-frequency fluctuations (fALFF) were not scrubbed, as fALFF are fairly robust to head movement, compared to regional homogeneity (ReHo) and degree centrality (DC w) (Yan et al., 2013). Data used to calculate fALFF and DC w were spatially smoothed with a 6 mm full width at half maximum Gaussian kernel, while ReHo data possess inherent smoothing properties and were, therefore, not spatially smoothed (Cole et al., 2010). All three metrics were converted to z-maps; for every voxel, the mean of all voxels was subtracted and the result was divided by the SD at that voxel for all subjects (Yan et al., 2013). To conduct ipsilateral versus contralateral analysis, focal epilepsy subjects with a left-sided seizure onset (N1 = 6) were flipped to the right hemisphere. An equal number of controls (N2 = 6), randomly selected using the randperm function in MATLAB, were also left-to-right flipped to avoid any systematic effects of hemispheric flipping.
Voxel-wise fMRI analysis
We used two metrics to measure task-free fMRI regional network properties, namely ReHo and weighted DCw
. ReHo (Zang et al., 2004) measures local connectivity and is defined as a Kendall's W score (Kendall and Gibbons, 1990) between a voxel and its adjacent voxels within a three-dimensional cube. It can be written as
where n is the number of time points in the time series, Ri
is the sum rank of the ith
time point over all neighboring voxels within the cube (i.e.,
Although DCw is preferentially measuring regional connectivity (Rubinov and Sporns, 2010), it is also a more global measure of brain connectivity compared to ReHo. DCw is a graph theoretic measure that adds the strength of edges between a node (voxel) and all other nodes in the adjacency matrix (Zuo et al., 2012), resulting in an estimate of total connectivity between a voxel and the rest of the brain. DCw is defined as
where G is the number of nodes connected to node i and aij denotes the functional correspondence between node i and j in the adjacency matrix (here consisting of 51603 voxels). Pearson correlation coefficients were used to estimate connectedness between voxel pairs with an adjacency matrix threshold at r > 0.25. We chose this threshold in all subjects, as this allows for tractable computation at this scale, is consistent with previous studies (Zuo et al., 2012), and Pearson correlation values above this can be meaningfully interpreted as showing functional connectivity between two voxels.
In addition to these network measures, we also examined the fALFF (Zou et al., 2008). This is a voxel-wise measure defined as the ratio of that part of the power spectrum of a time series that exists in the whole spectral range after frequency filtering (0.01–0.08 Hz in the context of BOLD signal) and the power spectrum of the entire time series.
Multivariate pattern analysis
To search for consistent spatial features differentiating extratemporal epilepsy from healthy controls, we used an MVPA approach, implemented with a linear support vector machine (SVM) algorithm (Cristianini and Shawe-Taylor, 2000). All calculations were performed using the PRoNTo toolbox (Schrouff et al., 2013) and followed the approach by Pedersen et al. (2015a), although in a different group of epilepsy patients.
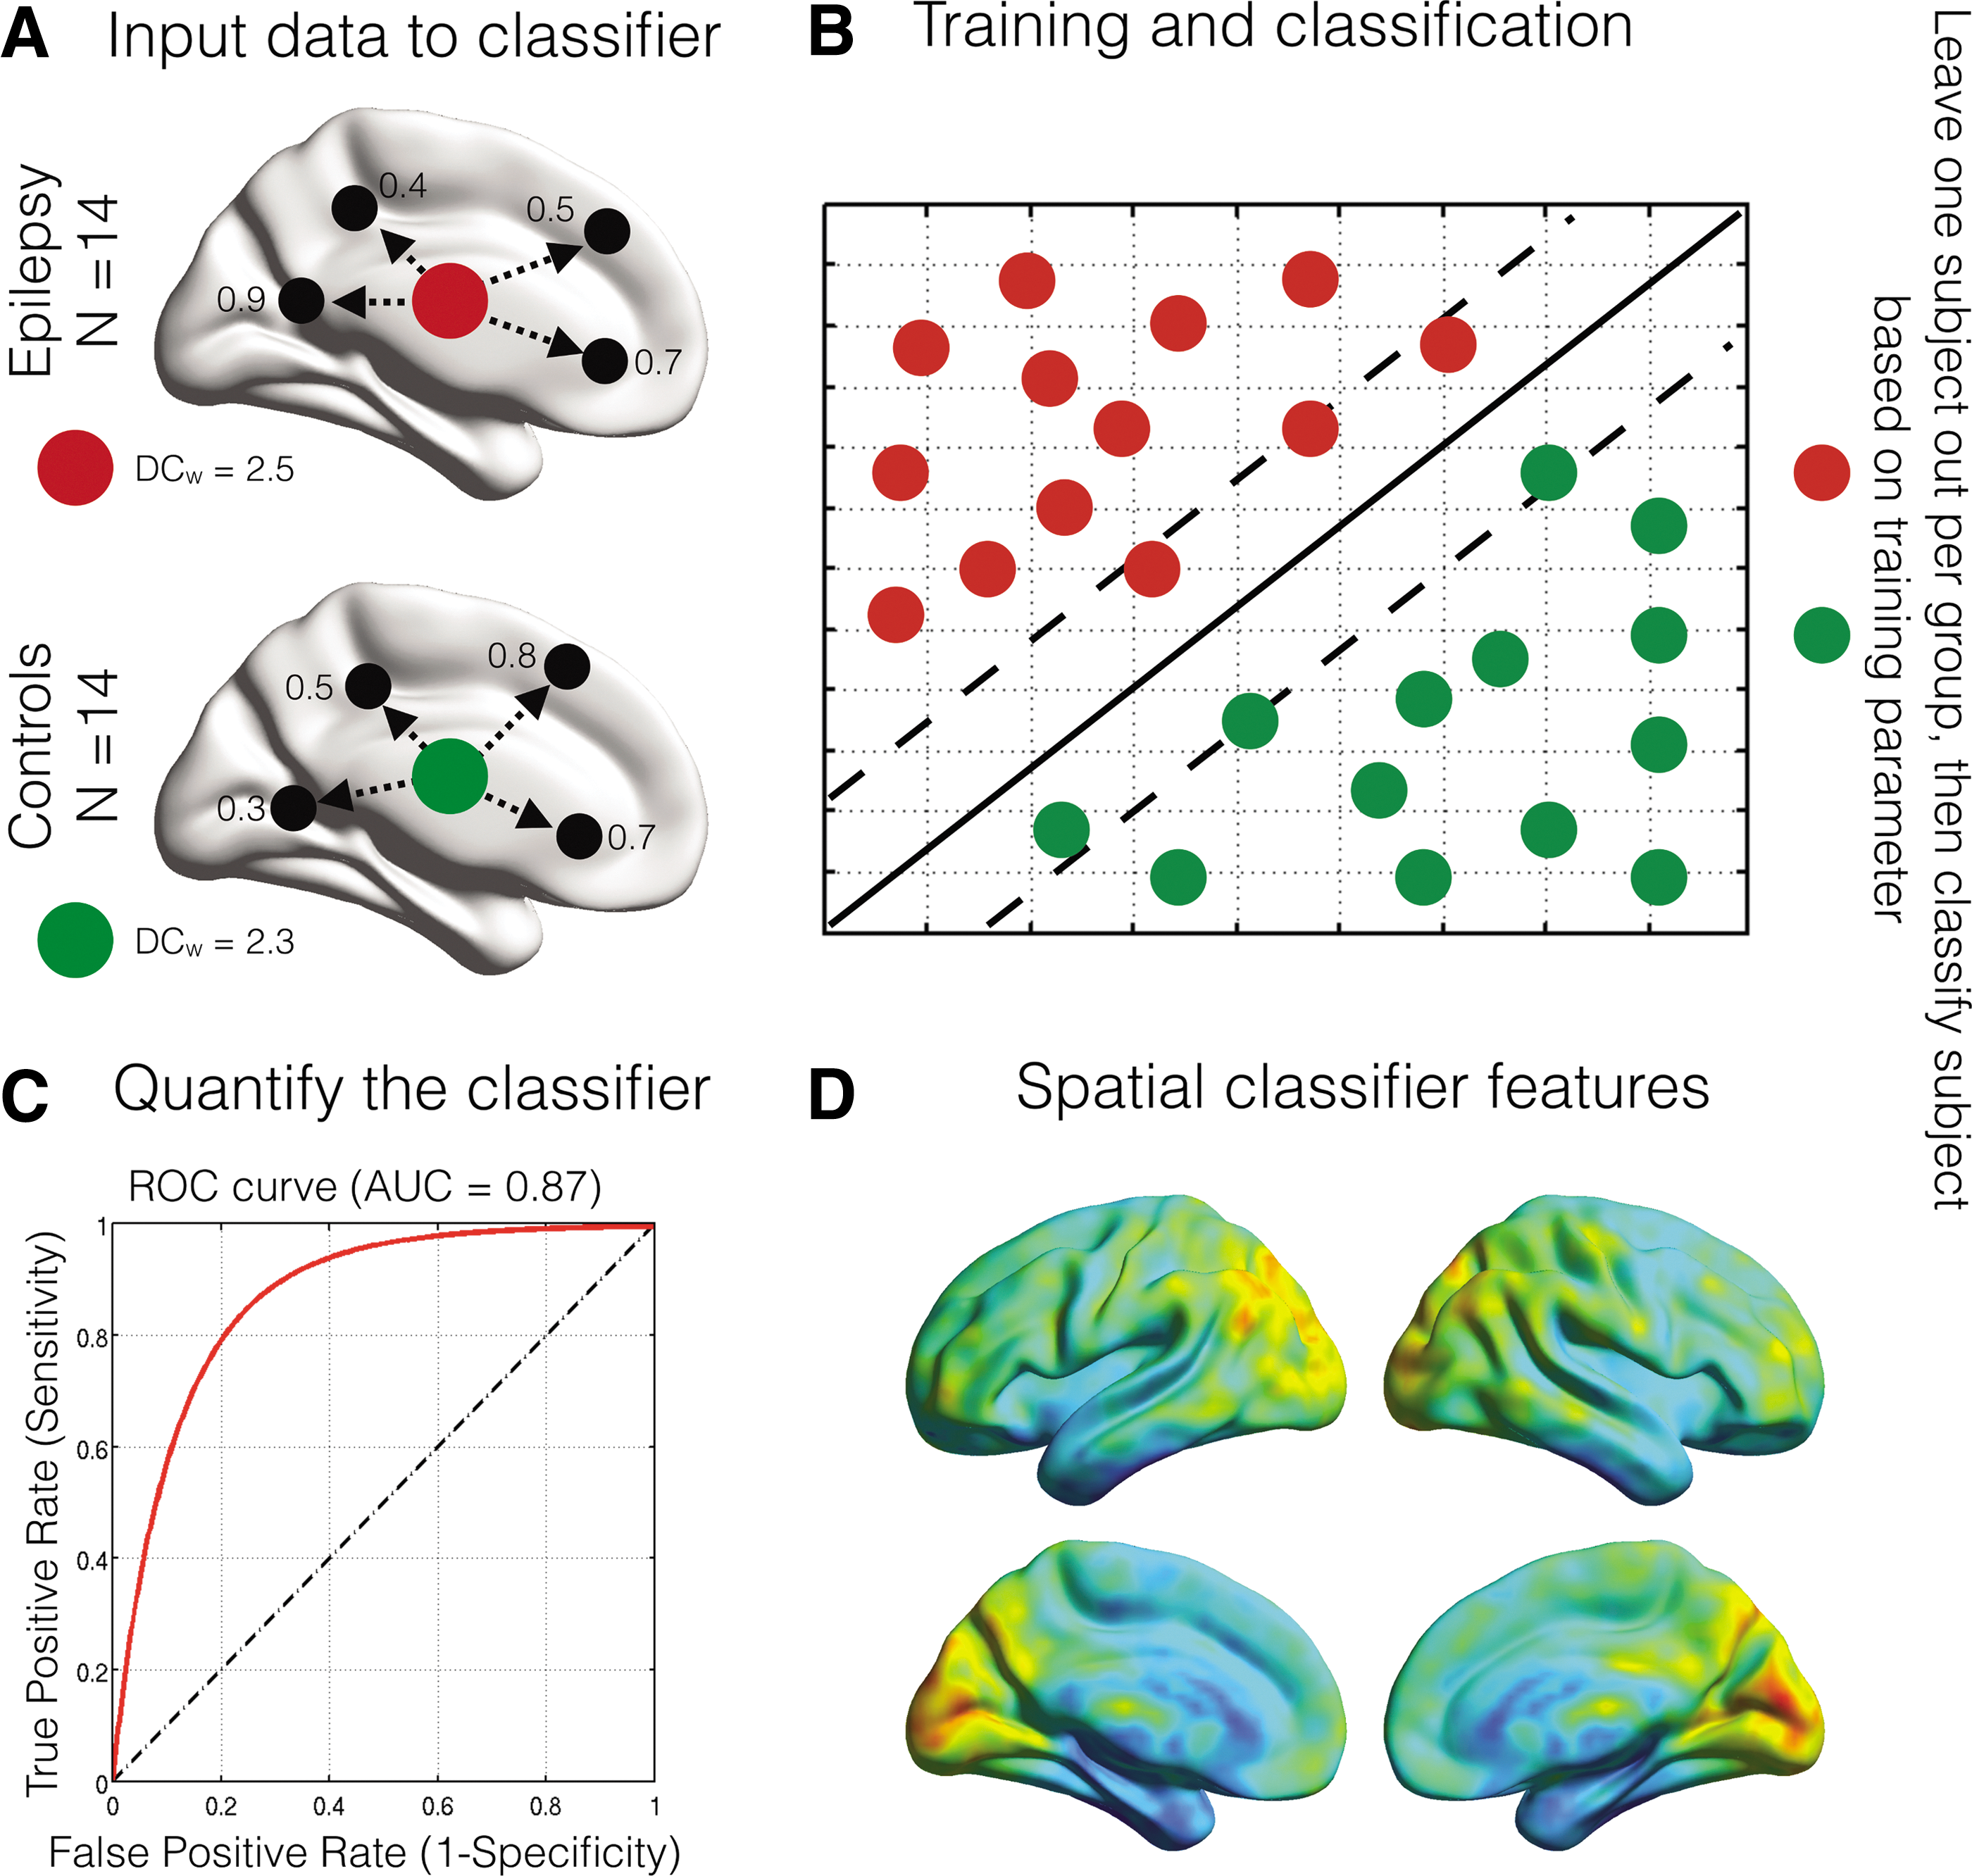
As outlined in Figure 1, voxel-wise regional fMRI metrics (ReHo, DC w , and fALFF) were used as separate inputs to the linear SVM algorithm and all subjects were labeled as either “epilepsy” or “control” subjects. Due to the ill-posed problem of overfitting data in MVPA, where the number of features (i.e., voxels) is much larger than the number of subjects to be classified, some form of dimensionality reduction is required in the feature space (Rasmussen et al., 2012). In this study, we used a linear kernel approach commonly used in machine learning analyses (Rasmussen et al., 2012; Shawe-Taylor, 2004). The linear kernel transforms the input features (voxels) to a lower dimensional space, where the number of features is the same size as the number of subjects. The cost parameter was in this study fixed and set to one.
An overview of the multivariate pattern analysis process.
The classifier was then trained to search for distinctive multivariate spatial features between the two groups. For each feature (Fig. 1A), the classifier obtains a hyperplane (solid diagonal line–Fig. 1B), by using linear support vectors (dotted diagonal lines–Fig. 1B) that optimally segregate feature information between the groups. The data are trained 14 times, leaving one subject out in each group per iteration, thus ensuring equal group sizes for each training step (Fig. 1B). Furthermore, the obtained training parameters (all subjects except for the two left out subjects) are used to classify subjects at an individual level. The total number of correctly classified subjects gives the overall accuracy of an MVPA classifier approach.
Receiver operator curves were used to estimate the predictive power of our MVPA approach. The area under the curve (AUC) estimates the trade-off between sensitivity and specificity of the classifier (Florkowski, 2008). To quantity the outcome of the classifier accuracy, p-values were obtained using nonparametric permutation tests (1000 permutations). For significant classifiers (p < 0.05, based on data permutations), spatial patterns can be used for interpreting features of importance when classifying epilepsy subjects from controls. Averaging the model weights from the 14 training parameters generates these spatial maps. However, no spatial statistical approaches exist to interpret these model weight maps. To delineate the largest spatial effects of the classifier, clusters of model features that encompassed at least 100 interconnected voxels after thresholding at the 95th percentile were extracted.
A more detailed step-by-step outline of the MVPA steps (linear SVM) is provided as Supplementary Data (Supplementary Data are available online at
Results
Relationships between fMRI metrics
First, we investigated the relationship between the three metrics used in the study. As seen in Figure 2, there is a positive relationship between ReHo and DC w , while fALFF are neither related with ReHo or DC w . This result suggests that ReHo and DC w share features of local connectedness, while fALFF represents a distinct construct.
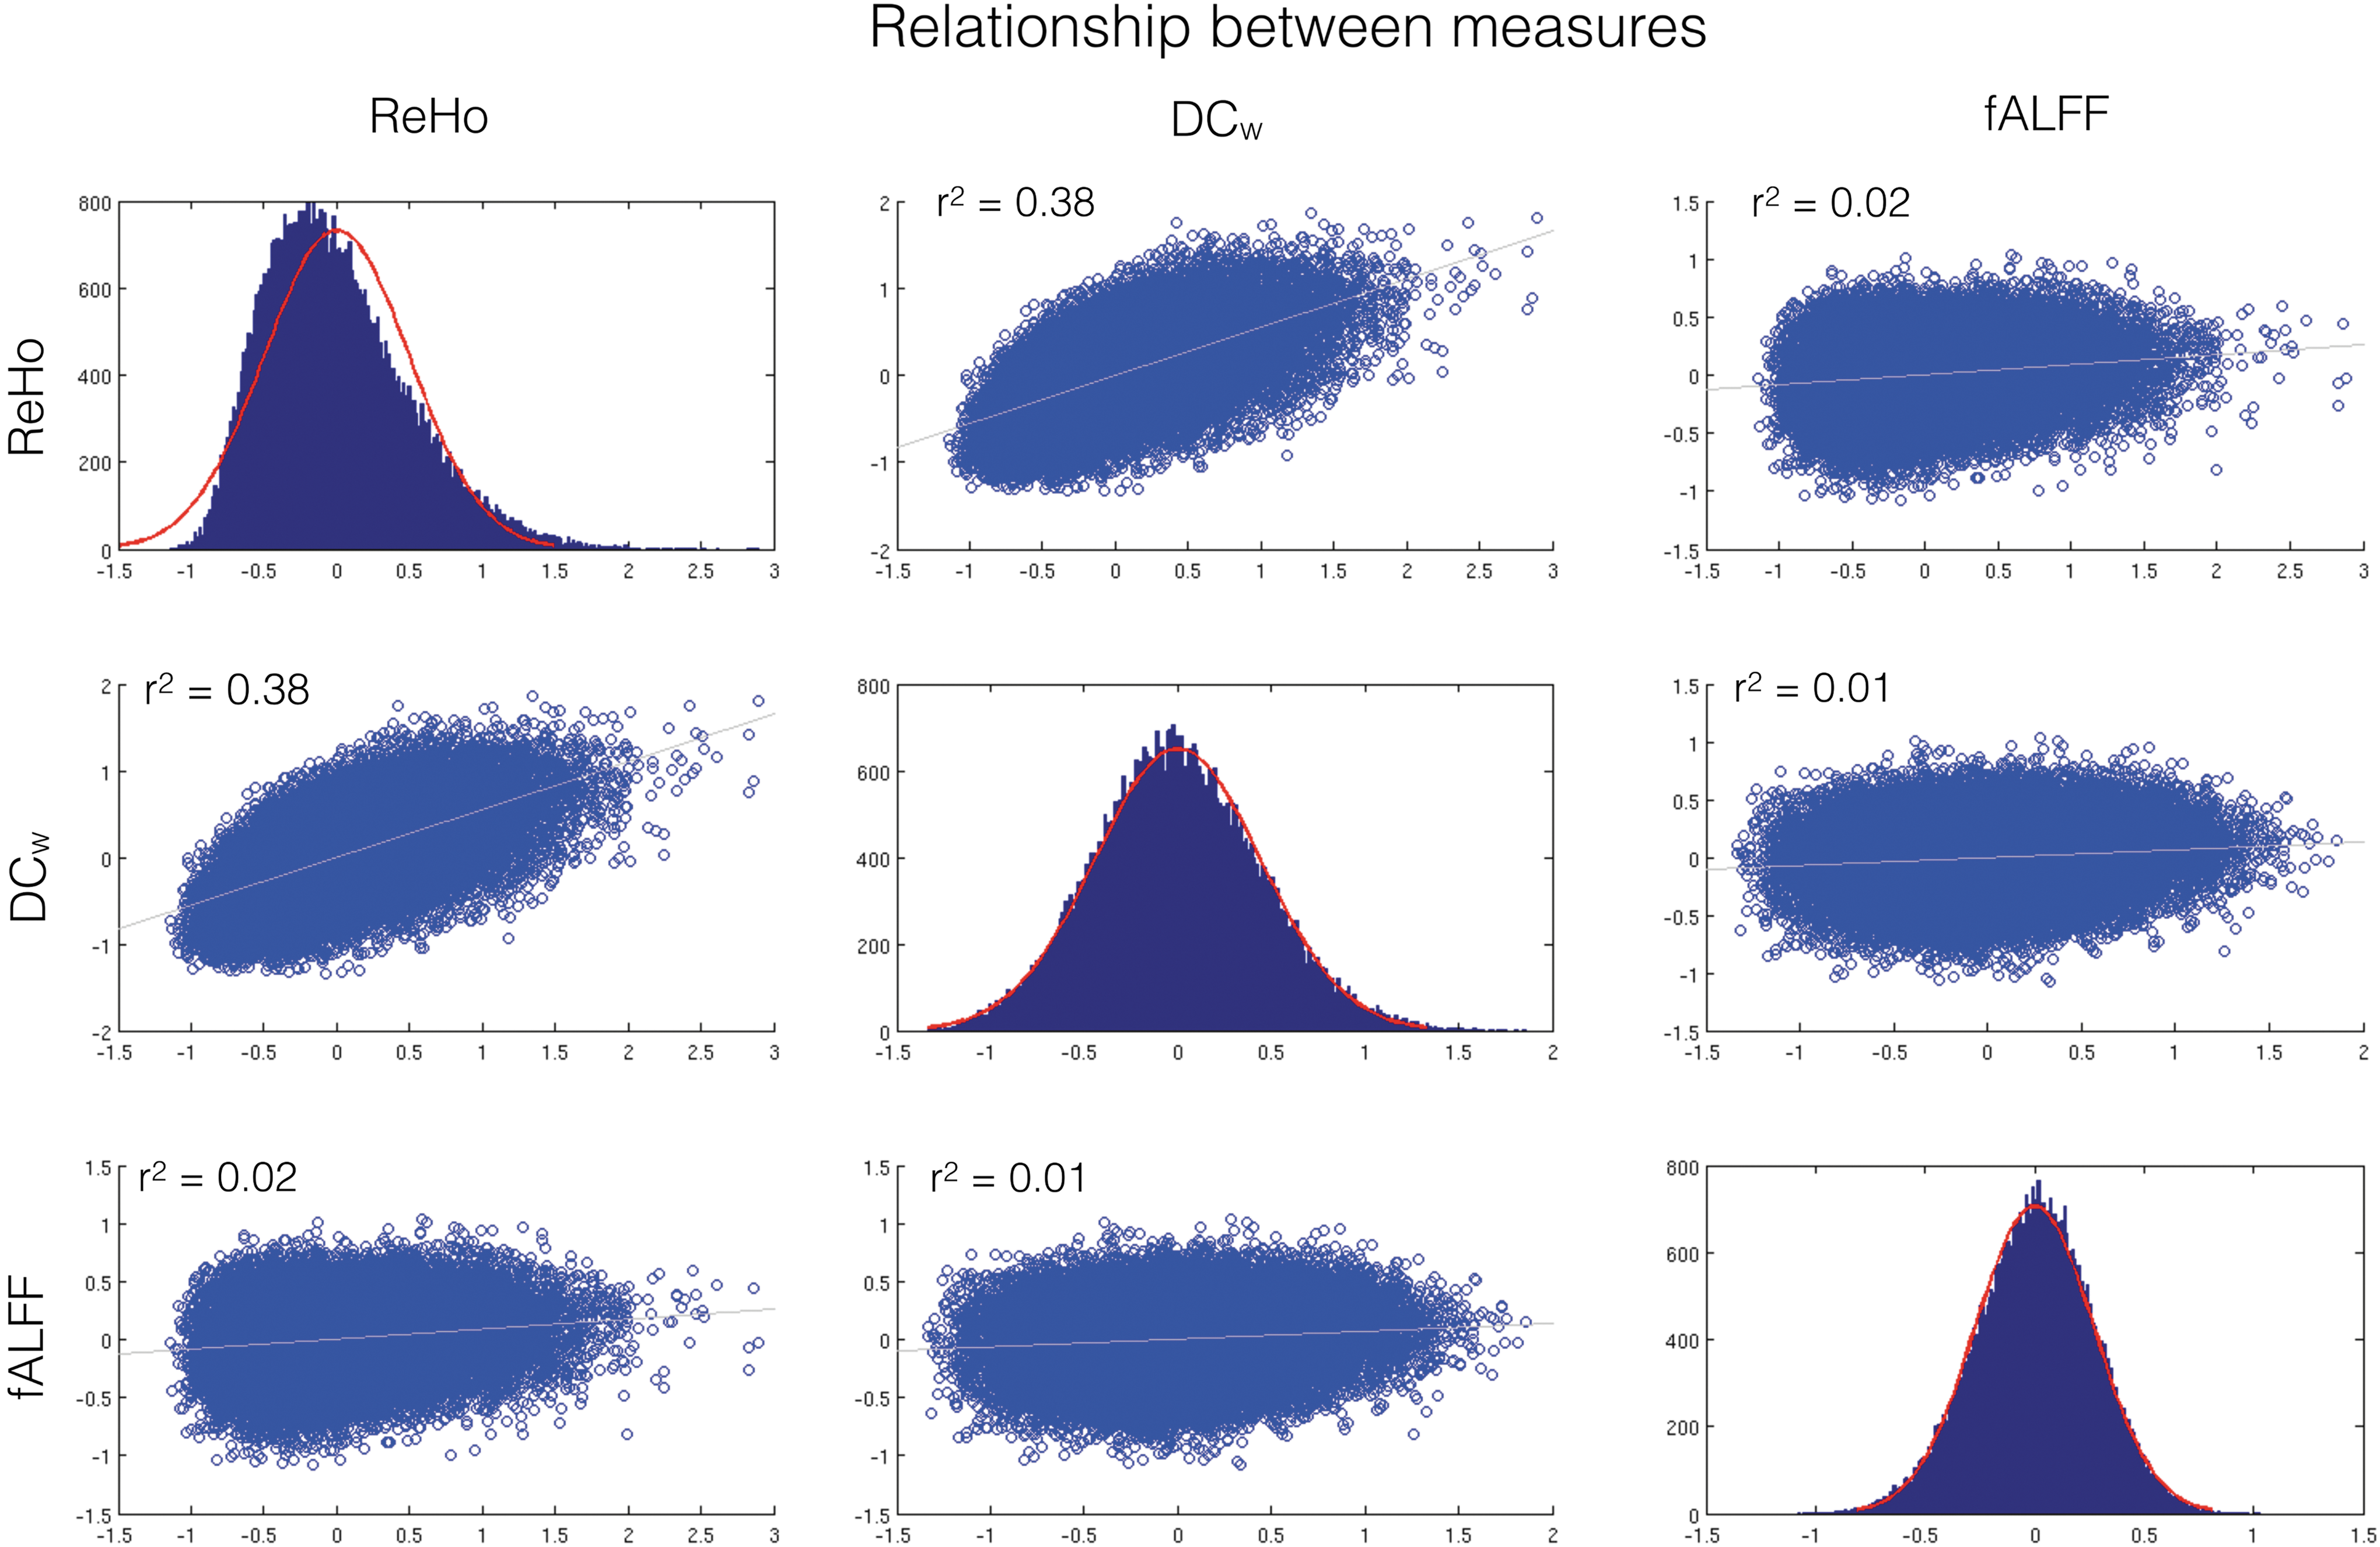
Data distributions and Pearson correlation coefficient overview of the regional functional magnetic resonance imaging (fMRI) metrics. Data plotted are based on average voxel-wise fMRI maps from the control group (N = 14). Regional homogeneity (ReHo) and DCw show a positive relationship, while a fraction of amplitude of low-frequency fluctuations (fALFF) are related to neither ReHo nor DCw. The red distributions on the diagonal plots show the fitted normal distribution and their corresponding data in blue. Color images available online at
Multivariate pattern analysis
The multivariate classifier distinguished extratemporal epilepsy patients from healthy controls with high accuracy for ReHo and DC w , with ReHo outperforming DC w (Table 2). Classifier estimates for fALFF were not significant between the two groups.
Overall Classifier Results Between Extratemporal Lobe Epilepsy Patients and Healthy Controls for ReHo, DCw, and fALFF
AUC, area under the curve; DC w, weighted degree centrality; fALFF, fraction of amplitude of low-frequency fluctuations; ReHo, regional homogeneity.
Spatial effects for significant classifiers
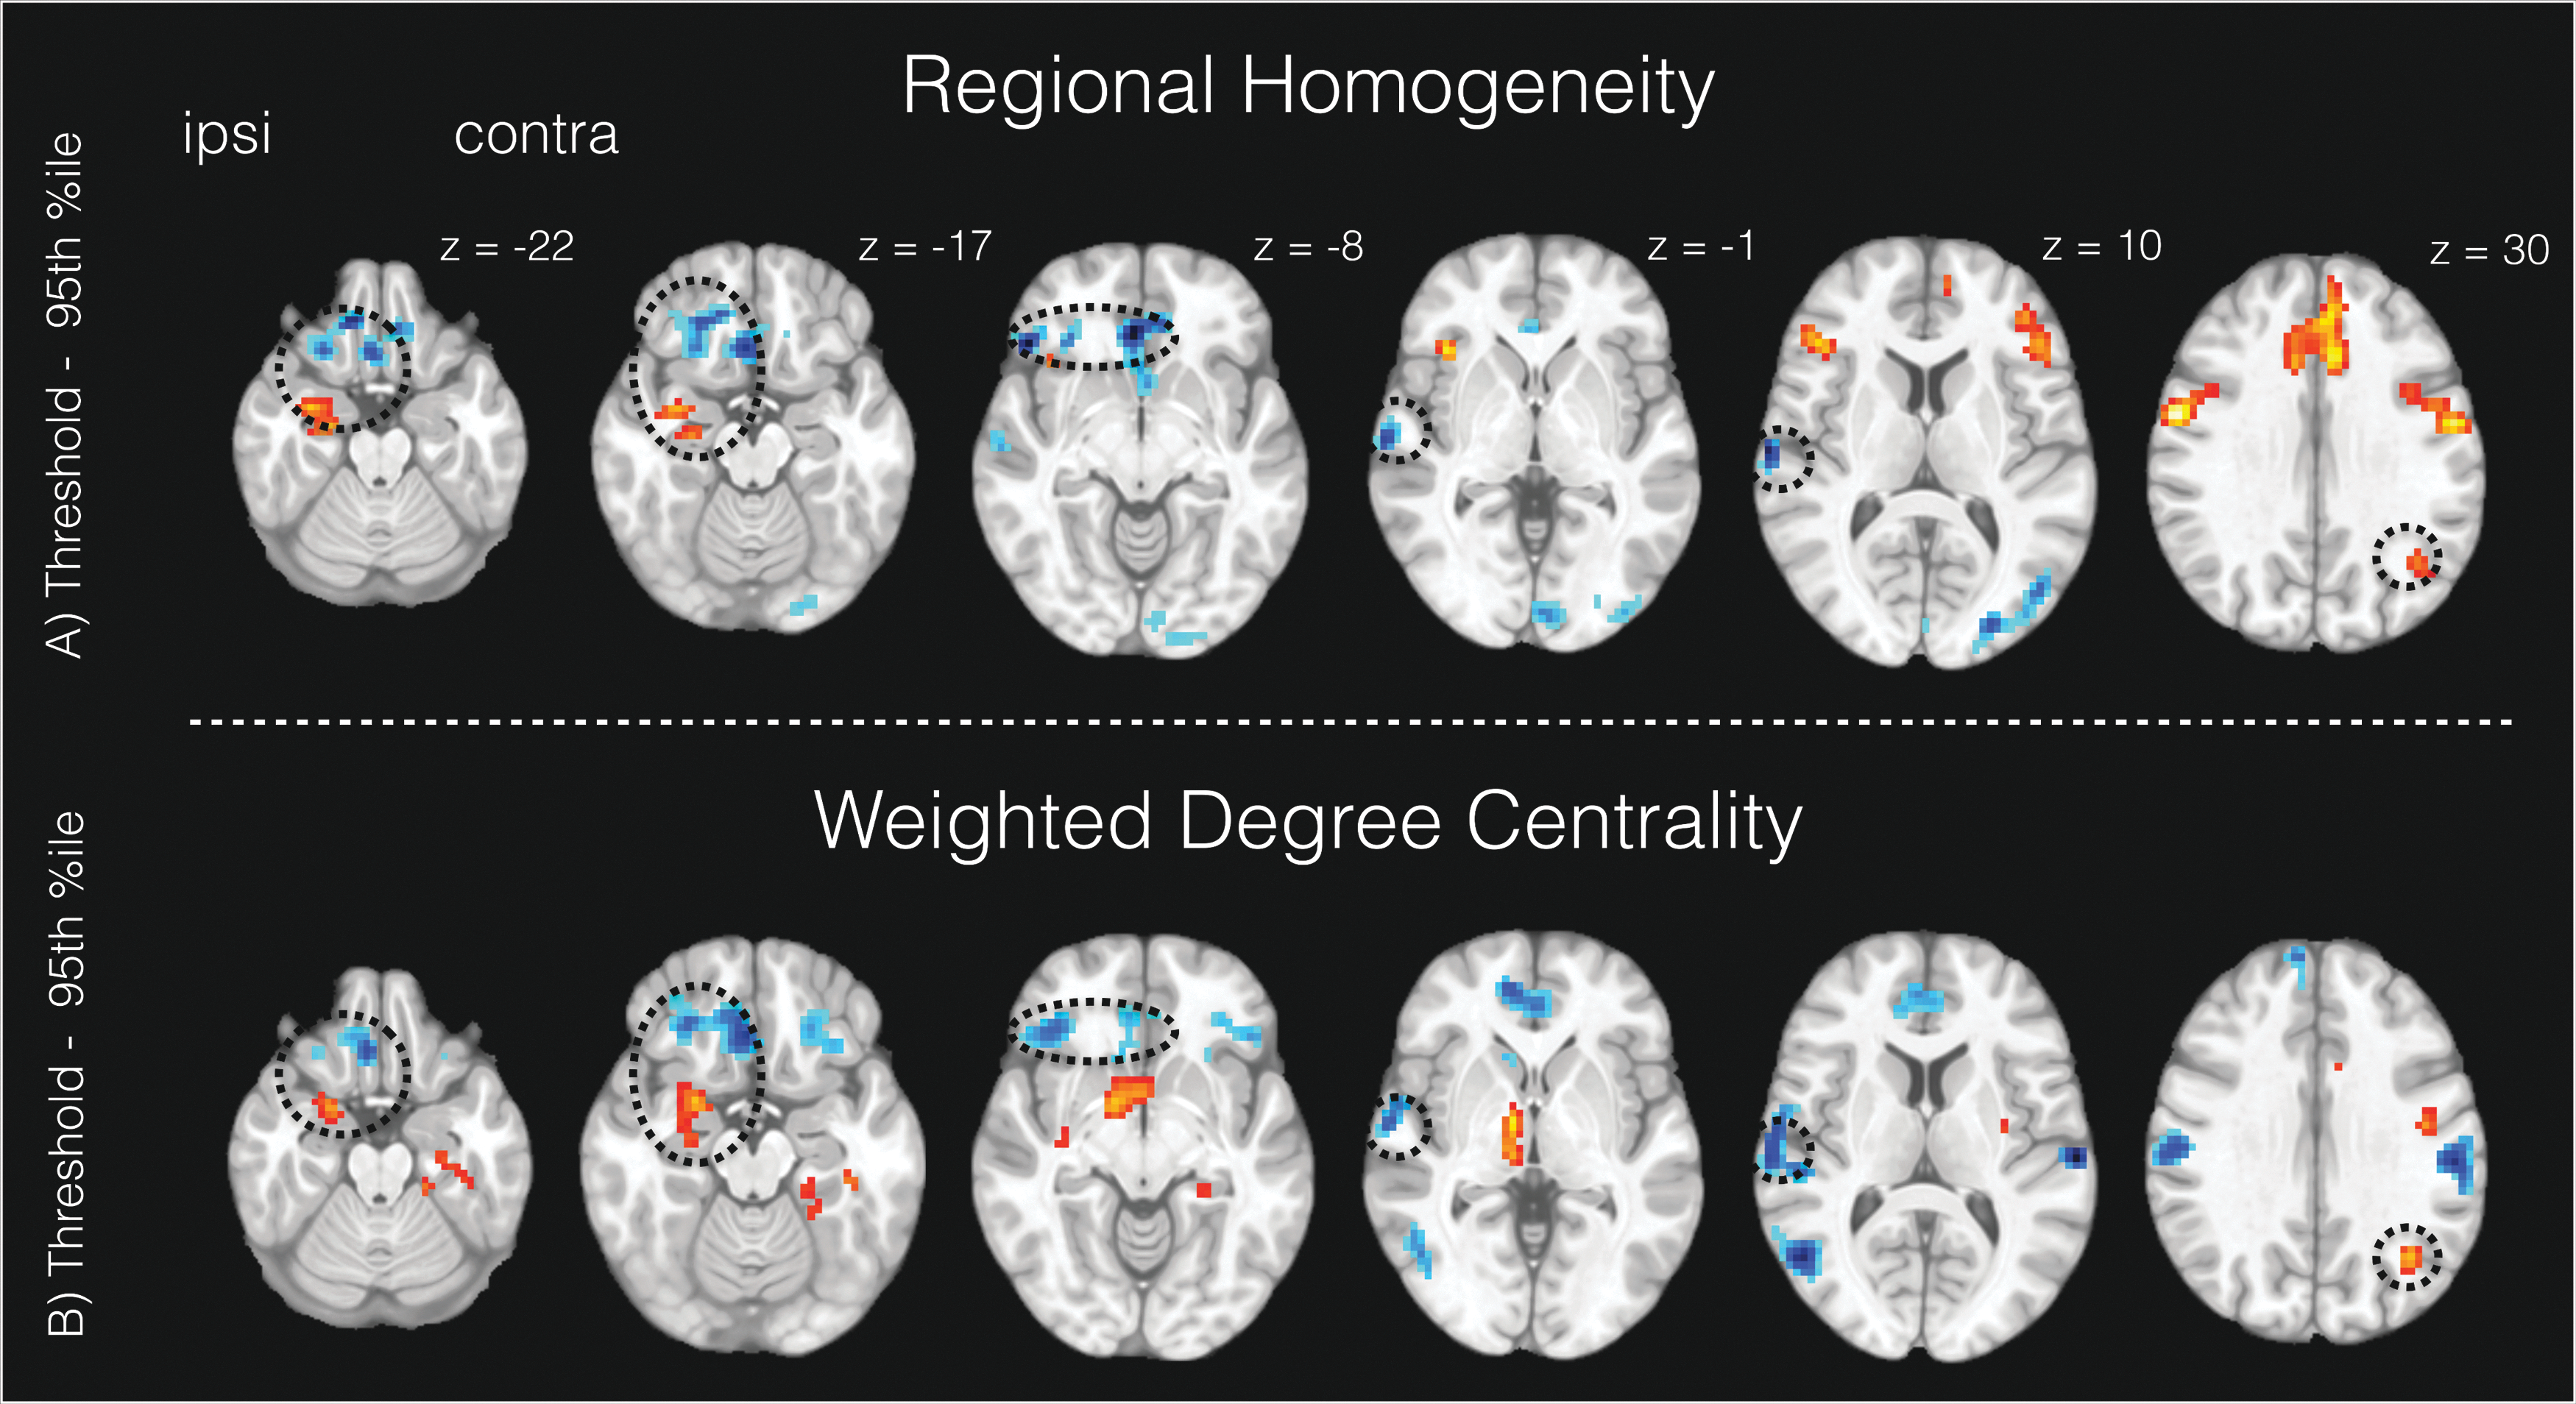
For ReHo, spatial features that were important to classify extratemporal lobe epilepsy from healthy controls included ipsilateral piriform cortex/anterior insula, dorsal anterior cingulate cortex, and bilateral lateral frontal areas (epilepsy > controls), in addition to the ventromedial prefrontal cortex and temporo-occipital and central midline cortices (epilepsy < controls; Fig. 3A). For DCw, the highest discriminating features between the groups were observed in the ipsilateral piriform cortex/thalamus (and the ventral striatum), contralateral parahippocampus, and bilateral superior frontal cortices (epilepsy > controls). Other important features for DCw included the ventromedial prefrontal cortex, lateral temporal cortices, and cortical motor areas (epilepsy < controls; Fig. 3B).
Important brain features for classifying focal epilepsy from controls in the significant classifiers.
Common features of extratemporal epilepsy
To quantify common brain features between ReHo and DCw, we calculated the intersection between the two brain maps seen in Figure 3 (Devlin, 1994). Common brain features between ReHo and DCw included the ipsilateral piriform cortex, ipsilateral ventrolateral and ventromedial prefrontal cortex, ipsilateral middle temporal gyrus, and contralateral inferior parietal gyrus. Circles in Figure 3 denote common features between ReHo and DCw.
Discussion
Common brain areas underlying extratemporal focal epilepsy
Using three disparate but complementary model-free fMRI measures (ReHo, DCw, and fALFF), we comprehensively assessed alterations of regional brain activity and connectivity in focal epilepsy. These measures, in combination with a multivariate classifier framework, were used with the aim of identifying brain regions that discriminated extratemporal focal epilepsy subjects from healthy controls. Our results show that several brain regions were important when classifying focal epilepsy subjects from healthy controls (Table 2 and Fig. 3), despite the heterogeneous epileptogenic nature of this patient group. This finding indicates the presence of common brain areas of abnormality in focal epilepsy; this is supported by simultaneous EEG-fMRI studies recorded during epileptogenic discharges (Fahoum et al., 2012; Flanagan et al., 2014; Laufs et al., 2011) and electrophysiological recordings showing converging spatiotemporal network patterns during focal seizures (see Kramer and Cash, 2012, for an overview).
Focal epilepsy—piriform and ventromedial prefrontal cortex
The piriform cortex, ventromedial prefrontal lobe, and the middle temporal gyrus of the seizure-affected hemisphere were altered in extratemporal epilepsy subjects, for both ReHo and DCw, compared to healthy controls (Fig. 3 circles). This indicates that these structures are commonly abnormal in extratemporal epilepsy subjects, regardless of the regional connectivity analysis method used.
The ipsilateral piriform cortex is likely to constitute an important node in focal epilepsy (Flanagan et al., 2014; Laufs et al., 2011). In contrast to these previous studies, our study consisted exclusively of subjects with seizure onset zones clinically considered to be distant from the mesial temporal lobes. Our analysis is based on task-free data, independent of epileptogenic discharges. Taken together, previous findings and our results give further support for a critical role of the piriform cortex in the focal epilepsies (Piredda, 1985; Vaughan and Jackson, 2014) as the piriform cortex projects to cortical and subcortical regions that include the entorhinal cortex, amygdala, orbitofrontal cortex, and insular cortex (for review see Vaughan and Jackson, 2014).
We also identified several other regions that may be important in extratemporal epilepsy. The brain area with the most prominent decrease of regional brain connectivity for both ReHo and DCw is the ventromedial prefrontal cortex. The ventromedial prefrontal cortex constitutes an integration node relaying information among cortical, subcortical, and limbic circuits supporting primary and higher order functions (Ongur and Price, 2000). The centromedial portions of the orbitofrontal cortex are functionally connected to a variety of brain areas, including the anterior insula, dorsal anterior cingulate cortex, lateral temporal areas, and the ventral striatum (Kahnt et al., 2012).
Focal epilepsy—salience network
The most reliable discrimination was obtained for ReHo estimates of local connectivity, with increased connectivity in the frontoinsular regions (Fig. 3A). This includes the dorsal anterior cingulate cortex, lateral frontal cortices, and ipsilateral anterior insula. These are areas that broadly correspond with earlier EEG-fMRI findings during epileptic discharges in frontal lobe epilepsy (Fahoum et al., 2012). The dorsal anterior cingulate cortex and anterior insula form the salience network (Menon and Uddin, 2010), which may play a role in epilepsy (Curwood et al., 2015), as well as other brain disorders (Goodkind et al., 2015). The suggestion that the salience network has a special and perhaps critical role in aspects of connectivity is the presence of spindle neurons, found in humans (and other great apes, dolphins, and whales), and is thought to support efficient brain connectivity (Allman et al., 2011).
Focal epilepsy—thalamostriatal areas
Increased connectivity in the superior frontal cortex, ipsilateral thalamo-ventrostriatal areas, and the contralateral parahippocampal gyrus was specific to DCw (Fig. 3B). These regions are thought to be highly central nodes with high connectivity to a variety of brain structures, that is, neural hubs (van den Heuvel and Sporns, 2011). Neural hubs are critically involved in disease states (Crossley et al., 2014), and DCw is more sensitive than ReHo for detecting such brain-wide effects. Of particular interest is the increased ipsilateral connectivity of thalamo-ventrostriatal areas. The specific role of the thalamus in focal epilepsy is still not completely understood (Bertram, 2013), but almost certainly plays a role in secondary generalization of seizures (Velasco et al., 1995).
Delineating epilepsy specific from behavioral and treatment effects
At the time of the scan, the majority of epilepsy subjects included in this study had neuropsychological deficiencies and/or psychiatric comorbidities and were on multiple antiepileptic drugs. Neuropsychological examination revealed that depression, working memory problems, and psychomotor retardation were present in the current epilepsy cohort. However, it is unlikely that the brain areas identified by our classifier are explained by such functional problems, as the brain structures that are common to both ReHo and DCw were lateralized to the ipsilateral hemisphere (Fig. 3 circles). Although brain effects that are linked to psychological or psychiatric comorbidities can be lateralized (Goldberg et al., 1998), these are unlikely to be specifically ipsilateral.
Whether abnormally connected brain structures precede the onset of epilepsy and are, thus, part of the etiology of the disorder, or are a secondary consequence of recurrent seizures or medications, will require further investigation in appropriate cohorts. Collecting data over several time points and with other appropriate control cohorts (e.g., people who are depressed) will also help assessing the reliability of clinical functional connectivity data.
Fraction of amplitude of low-frequency fluctuations
As opposed to ReHo and DCw, the MVPA algorithm did not discriminate focal epilepsy subjects from controls based on fALFF. fALFF detect alteration in the voxel-wise BOLD frequency. As frequency changes are one of the main markers of epileptogenic events, this is perhaps surprising. A study by Zhang et al., 2010, suggests that increased BOLD amplitude of low-frequency fluctuations is associated with interictal spikes in the mesial temporal lobe areas in subjects with temporal lobe epilepsy. Thus, fALFF may be more important for studying epileptic events than the task- and epileptic event-free state.
Limitations
Spatial model weights that are output by MVPA delineate voxels that are most important in classifying patients from controls (Mourão-Miranda et al., 2005), but the interpretability of these brain maps is debated. In many disciplines, the spatial outputs of a classifier are subordinate to the classification accuracy. In clinical neurosciences, however, it is not only of interest whether differences between clinical and control groups exist but also where in the brain such differences are expressed. The cost parameter set in SVM analysis is an important step in this regard. The cost parameter relates to the width of the support vector boundaries (Fig. 1B—diagonal lines) and impinges on the accuracy and spatial interpretation of the classifier (Rasmussen et al., 2012). Finding the optimal cost parameter can be done within a nested loop, where a range of different cost values are estimated. Then, the cost parameter that yields the highest classification accuracy is selected (Schrouff et al., 2013). Perhaps paradoxically, Rasmussen et al. (2012) found that when the cost versus accuracy parameter is optimized (i.e., which cost parameter yields the highest classification accuracy), the reproducibility of brain weight maps decreased. Therefore, there seem to be a trade-off relationship between SVM cost parameters and reproducibility of spatial information. Due to the extensive use of SVM in clinical research (Klöppel et al., 2012; Orrù et al., 2012), further development in interpreting MVPA spatial weights is of importance. In particular, using sparse MVPA models may improve the reproducibility of multivariate brain maps (Mohr et al., 2015; Rosa et al., 2015).
Conclusion
We demonstrate that patients with extratemporal focal epilepsy have common areas of brain abnormality, compared to healthy control subjects. Our findings highlight the importance of the ipsilateral piriform cortex, temporal neocortex, and ventromedial prefrontal cortex, as well as the “salience network” (insula and frontal cortex) and ipsilateral thalamus/striatum. We postulate that these brain regions constitute important nodes underlying focal epilepsy.
Footnotes
Acknowledgments
The authors acknowledge Mira Semmelroch for assistance with the patient data. This study was supported by the National Health and Medical Research Council (NHMRC) of Australia (program grant 628952). The Florey Institute of Neuroscience and Mental Health acknowledges the strong support from the Victorian Government and, in particular, the funding from the Operational Infrastructure Support Grant. G.J. is supported by an NHMRC practitioner fellowship (1060312). M.P. is supported by The University of Melbourne scholarships (MIRS & MIFRS). D.V. is supported by an NHMRC postgraduate scholarship.
Author Disclosure Statement
G.J. has received honoraria from UCB and royalties from Elsevier for Magnetic Resonance in Epilepsy, 2nd ed. The remaining authors have no competing financial interests to disclose.
References
Supplementary Material
Please find the following supplemental material available below.
For Open Access articles published under a Creative Commons License, all supplemental material carries the same license as the article it is associated with.
For non-Open Access articles published, all supplemental material carries a non-exclusive license, and permission requests for re-use of supplemental material or any part of supplemental material shall be sent directly to the copyright owner as specified in the copyright notice associated with the article.