
Abstract
Propofol is one of the most commonly used anesthetics in the world, but much remains unknown about the mechanisms by which it induces loss of consciousness. In this resting-state functional magnetic resonance imaging study, we examined qualitative and quantitative changes of resting-state networks (RSNs), total brain connectivity, and mean oscillation frequencies of the regional blood oxygenation level-dependent (BOLD) signal, associated with propofol-induced mild sedation and loss of responsiveness in healthy subjects. We found that detectability of RSNs diminished significantly with loss of responsiveness, and total brain connectivity decreased strongly in the frontal cortex, which was associated with increased mean oscillation frequencies of the BOLD signal. Our results suggest a pivotal role of the frontal cortex in propofol-induced loss of responsiveness.
Introduction
In the last two decades, neuroimaging has become a major addition to consciousness research. A growing number of studies have shown changes in brain functional connectivity (using resting-state functional magnetic resonance imaging [fMRI], as well as [high density] electroencephalography [EEG] combined with transcranial magnetic stimulation) and brain metabolism (using 18F-fluorodeoxyglucose positron emission tomography [FDG-PET]) during states of altered consciousness (Gosseries et al., 2014; Guldenmund et al., 2012a). With resting-state fMRI, emphasis has been on analysis of separate resting-state networks (RSNs) (Damoiseaux et al., 2006) and particularly the default mode network (DMN). This network is associated with internal awareness, and its intactness is therefore considered to be vital for consciousness (Guldenmund et al., 2012b). Indeed, the DMN connectivity has been shown to be decreased in deep sleep (Horovitz et al., 2009), general anesthesia (Boveroux et al., 2010; Guldenmund et al., 2013), and in patients in coma, vegetative state/unresponsive wakefulness syndrome (VS/UWS) (Laureys et al., 2010), and minimally conscious state (MCS) (Vanhaudenhuyse et al., 2010). Anesthesia studies have also specifically focused on the posterior cingulate cortex (PCC)/precuneus, showing propofol-induced alterations of the connectivity pattern (Amico et al., 2014; Liu et al., 2014; Stamatakis et al., 2010), while others indicated the involvement of a wide range of higher-order RSNs in the loss of responsiveness (expected to be a state of unconsciousness), like the external control network (ECN; left and right ECN components are frequently mentioned separately), important for externally oriented awareness (Boveroux et al., 2010; Liu et al., 2012), and the salience network, which is implicated in the detection of salient stimuli (Guldenmund et al., 2013). Furthermore, disconnection between higher-order RSNs and the thalamus has been found to be associated with propofol-induced loss of responsiveness (Boveroux et al., 2010; Guldenmund et al., 2013; Liu et al., 2013). In contrast, lower-order RSNs (auditory, sensorimotor, and visual RSNs) have not shown significant intranetwork decreases during unresponsiveness, although internetwork connectivity between auditory and visual RSNs has been shown to be affected (Boveroux et al., 2010).
Analysis of RSNs separately using resting-state fMRI can give valuable insight into the connectivity changes within each network. However, by limiting investigation to individual RSNs, a comprehensive representation of global brain connectivity changes is lost. Analysis of the total repertoire of brain connectivity of neuronal origin (total brain connectivity) could give new insights into the mechanisms underlying propofol-induced loss of responsiveness, which could supplement findings obtained by classical analysis methods. In this article, we apply a recently developed method to construct total brain connectivity maps and compare these with results from a method examining RSNs separately (Demertzi et al., 2014). In addition to the total brain connectivity analysis, we performed another method to examine global brain changes: analysis of the mean oscillation frequency of the blood oxygenation level-dependent (BOLD) signal. These methods allow for a comparison with other brain examination modalities that focus on global brain changes, such as EEG and PET. We expected to find that regions where higher-order RSNs overlap, such as the frontal cortex, are of great importance in propofol-induced unresponsiveness (Damoiseaux et al., 2006).
Materials and Methods
Subjects
We used previously published resting-state fMRI data of 20 healthy right-handed volunteers (Boveroux et al., 2010). One subject was excluded from the analysis due to the occurrence of hyperventilation, while data from another subject were discarded as they were acquired during a pilot session. The remaining 18 volunteers (mean age: 23 ± 4 years; 14 women) were used for our analysis. The study was approved by the Ethics Committee of the Faculty of Medicine of the University of Liège, Belgium, and subjects gave written informed consent.
Sedation protocol
Subjects fasted for at least 6 h for solids and 2 h for liquids before the sedation. They wore headphones and earplugs in the scanner. Propofol infusion, using a target-controlled infusion device (Diprifusor©-algorithm, Pharmacokinetics and Pharmacodynamics Software Server, Department of Anesthesia, Stanford University) to obtain constant effect-site concentrations, occurred through an intravenous catheter placed into a vein of the right forearm or hand. Blood pressure, pulse oximetry, and cardiac rhythm were monitored during the experiment. During all four levels of consciousness, blood pressure, electrocardiogram, breathing frequency, and pulse oximetry (Sp02) were continuously monitored. For the whole duration of the experiment, subjects were breathing spontaneously, while additional oxygen was delivered at 5 L/min through a loosely fitting plastic facemask. The level of consciousness was assessed using the Ramsay scale (Olson et al., 2007). The subjects were asked twice per consciousness level assessment to strongly squeeze the hand of the investigator. The awake states before sedation and after recovery of consciousness were Ramsay 2 (strong squeezing of the hand), mild sedation was Ramsay 3 (clear but slow squeezing), and propofol-induced unresponsiveness was Ramsay 5–6 (no response). In addition, a reaction time task was also given to the subjects before and after each session to help define the level of consciousness. This reaction task consisted of a block of 20 beeps delivered through the headphones, and the subjects were asked to press a keypad as fast as they could. After reaching the desired effect-site concentration, a 5-min equilibration period was established. Mean propofol plasma concentrations for wakefulness, mild sedation, unresponsiveness, and recovery were 0 μg/mL (standard deviation: 0), 1.75 μg/mL (standard deviation: 0.73), 3.06 μg/mL (standard deviation: 1.01), and 0.58 μg/mL (standard deviation: 0.27), respectively. These propofol measurements were based on arterial blood samples taken directly before and after each scan. Two certified anesthesiologists and complete resuscitation equipment were present throughout the experiment [for supplementary protocol information, see Boveroux and associates (2010)].
Data acquisition
T2*-weighted functional images were acquired on a 3T MR scanner (echo planar imaging sequence using 32 slices; matrix size 64 × 64 × 32; repetition time = 2460 ms; echo time = 40 ms; flip angle = 90°; voxel size = 3.45 × 3.45 × 3.00 mm3; field of view = 220 × 220 mm2). Ten-minute acquisitions were made during four different levels of consciousness: wakefulness, mild sedation, unresponsiveness, and recovery. A high-resolution T1-weighted image was acquired for each subject (T1-weighted 3D magnetization-prepared rapid gradient echo sequence).
Data analysis
Data were aligned, coregistered, spatially normalized into standard stereotactic Montreal Neurological Institute-space, and smoothed (8 mm full width at half-maximum) using Statistical Parametric Mapping 8 (SPM8;
For the total brain connectivity map construction, no template-driven spatial goodness-of-fit selection was performed. Instead, all independent components that survived the neuronality classifier were added up by summing voxel by voxel the square root of the absolute value of the corresponding z maps as in Equation (1):
where i is an index for the neuronal components. The square root was taken to reduce the sparsity of the spatial maps, as requested instead by the ICA decomposition, which looks for independence sparsity of components, before their combination to better cover the full cortex. A subsequent smoothing with a kernel of 16 mm was applied. A spatial map per subject per consciousness condition was then built. Four subjects were excluded because they did not have any detected neuronal components during unresponsiveness. A one-way analysis of variance compared the number of neuronal components in each condition after applying proportional scaling, consisting of the normalization of the value of each voxel by the average over all voxels. The total connectivity maps of the remaining 14 subjects were averaged per condition. Furthermore, the contrast representing the level of responsiveness mentioned earlier was used to examine the differences in total brain connectivity associated with decreasing responsiveness. In addition, a direct comparison between mild sedation and unresponsiveness (mild sedation: 1, unresponsiveness: −1) was performed.
The mean oscillation frequency of the BOLD signal was calculated as follows: First, the mean of the temporal component per voxel was subtracted to reduce the baseline signal and focus mainly on BOLD signal changes. Second, the Fourier transform was used to extract the power spectrum of the signal per voxel. Mean frequency was then calculated voxel by voxel by weighting each frequency with its own power to generate the frequency map. These maps were generated for each subject in each of the four conditions. Furthermore, a contrast representing the inverse of the level of consciousness (wakefulness: −1, mild sedation: 0.5, unresponsiveness: 1.5, and recovery: −1) was used to examine the differences in mean frequency associated with decreasing responsiveness. In addition, a direct comparison between mild sedation and unresponsiveness (mild sedation: −1, unresponsiveness: 1) was performed.
A possible reason for carefulness when interpreting fMRI data might be the potential influence of pCO2 levels on the BOLD signal. However, it has been shown that pCO2 levels do not seem to change the BOLD response to the neuronal activity (Birn et al., 2006; Wise et al., 2004). Furthermore, for our analysis, we are interested in correlations rather than specific regional effects and are therefore confident that pCO2 levels do not significantly influence our results (Corfield et al., 2001).
Results
We analyzed the detectability of 10 different RSNs for each level of consciousness, using the neuronality classifier and spatial properties for each one of the RSNs (Demertzi et al., 2014). The overall average detection rate of RSNs for each condition was 81% for wakefulness, 71% for mild sedation, 46% for unresponsiveness, and 80% for recovery. For 7 out of 10 RSNs, the number of subjects with neuronal components decreased from wakefulness to mild sedation and even further during unresponsiveness and increased again with recovery of consciousness (Fig. 1). We did not include the salience network and cerebellum in our further analysis of the effect of loss of responsiveness on RSN spatial integrity, given that these RSNs could only be detected in less than half of the subjects during the wakefulness condition.
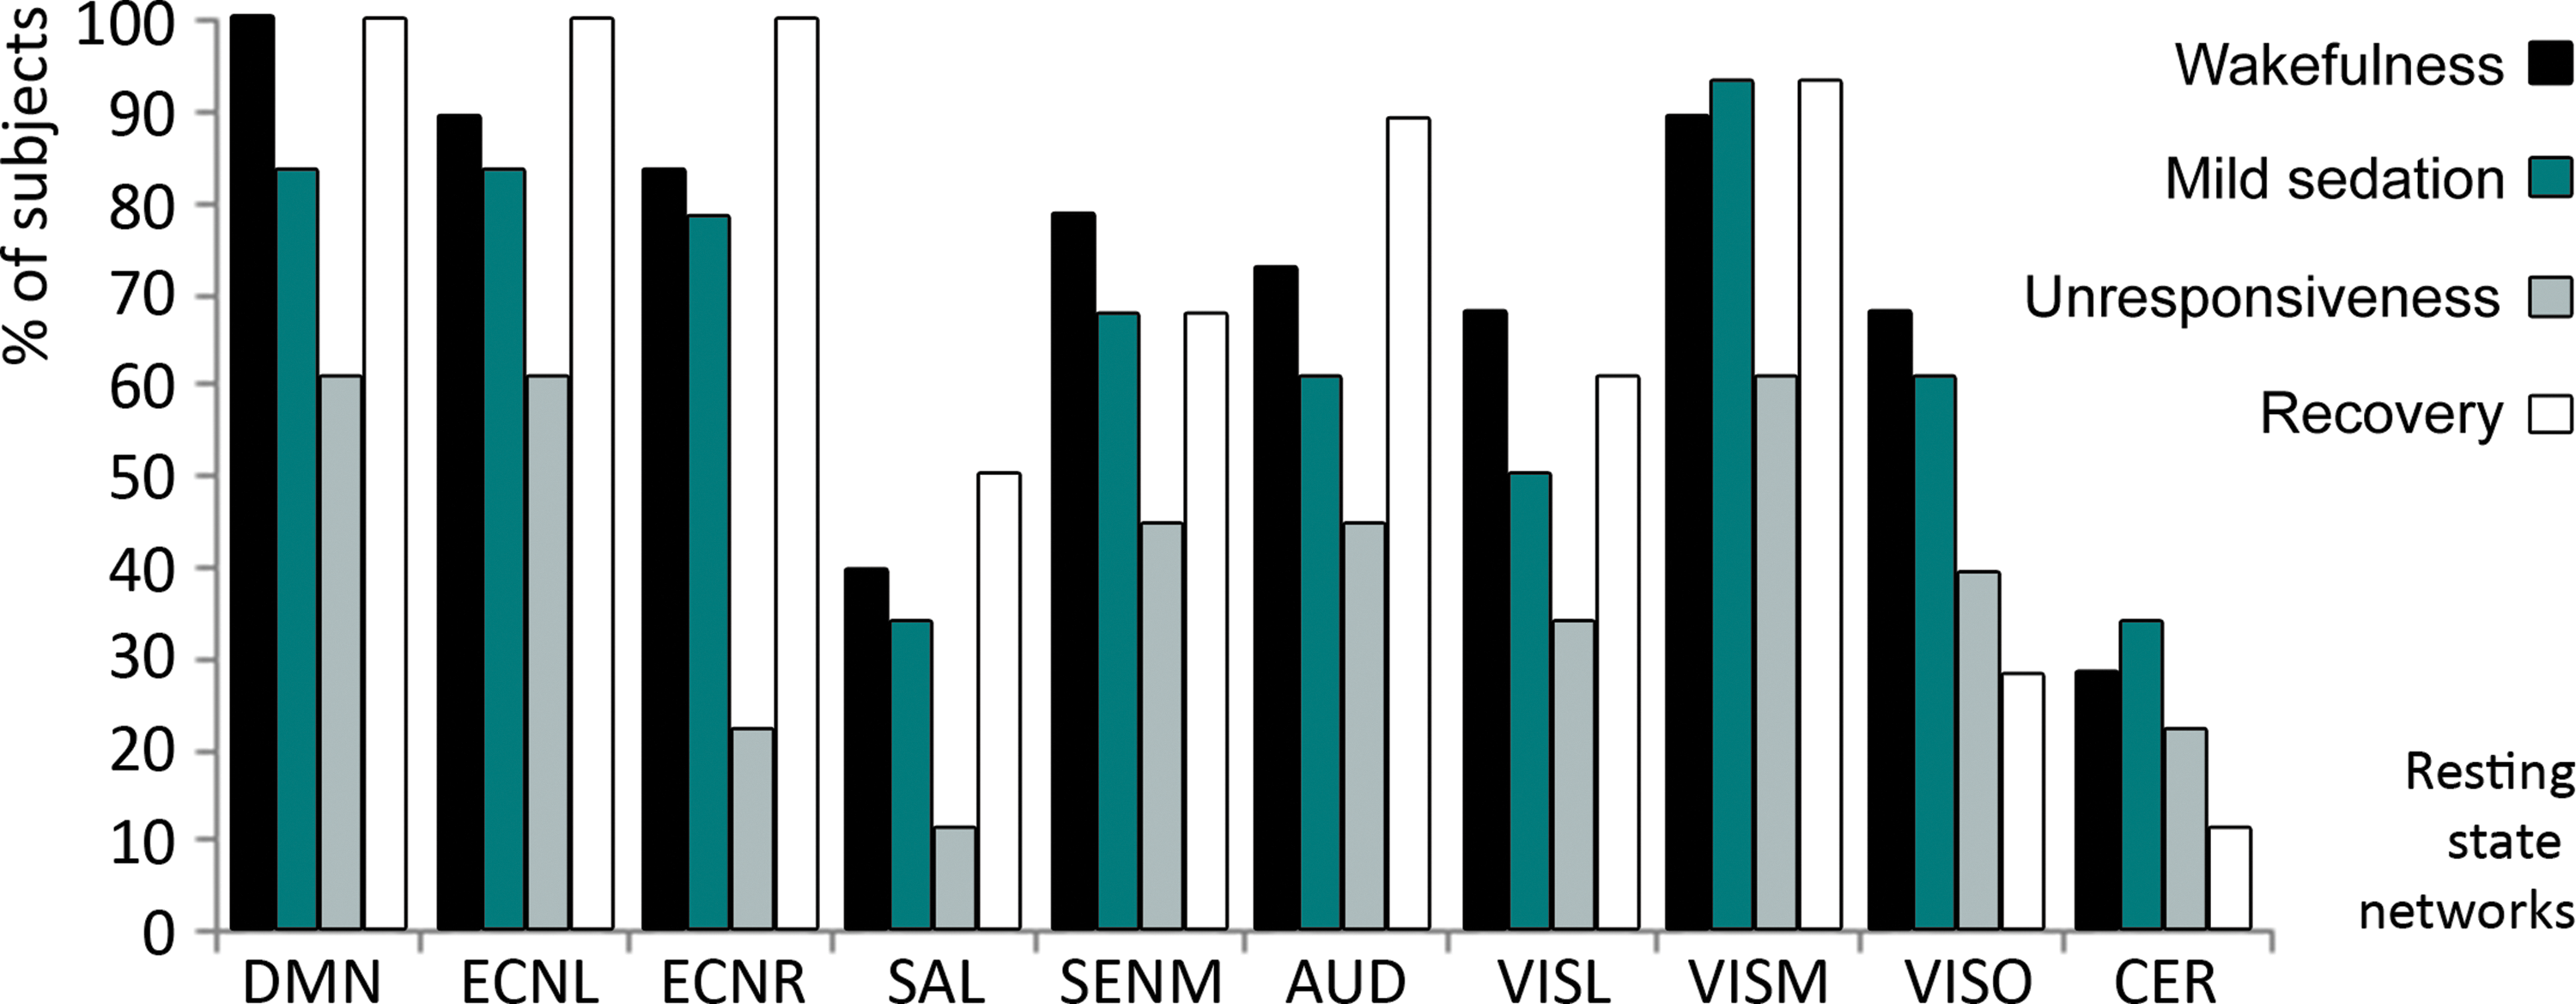
The percentage of subjects in which an RSN was detected, per RSN and condition. AUD, auditory network; DMN, default mode network; ECNL, left external control network; ECNR, right external control network; SENM, sensorimotor network; VISL, lateral visual network; VISM, medial visual network; VISO, occipital visual network. RSN, resting-state network.
For the remaining eight well-detected RSNs, a group-averaged scalar map was calculated per network and per consciousness condition (Fig. 2, left side). All RSNs were comparable to those described in literature (Damoiseaux et al., 2006), although the occipital visual component showed liberal spatial and temporal variability during recovery. For each condition, fingerprints calculated for each network indicated that the detected independent components were of neuronal origin (Fig. 2, right side) (De Martino et al., 2007). In mild sedation, no major spatial changes in connectivity within RSN components were observed. During unresponsiveness, the DMN encompassed only the PCC/precuneus and bilateral inferior parietal cortices, therefore lacking the connectivity to the medial prefrontal cortex seen during all other levels of consciousness. A decrease in the functional connectivity could also be detected in bilateral inferior frontal cortices of both left and right ECNs during unresponsiveness. Statistical analysis was consistent with these observed trends at a low threshold (p < 0.001 uncorrected, or p < 0.05 uncorrected), showing frontal disconnection with decreasing consciousness according to the contrast (wakefulness: 1, mild sedation: −0.5, unresponsiveness: −1.5, and recovery: 1) (Supplementary Fig. S1, left side; Supplementary Data are available online at
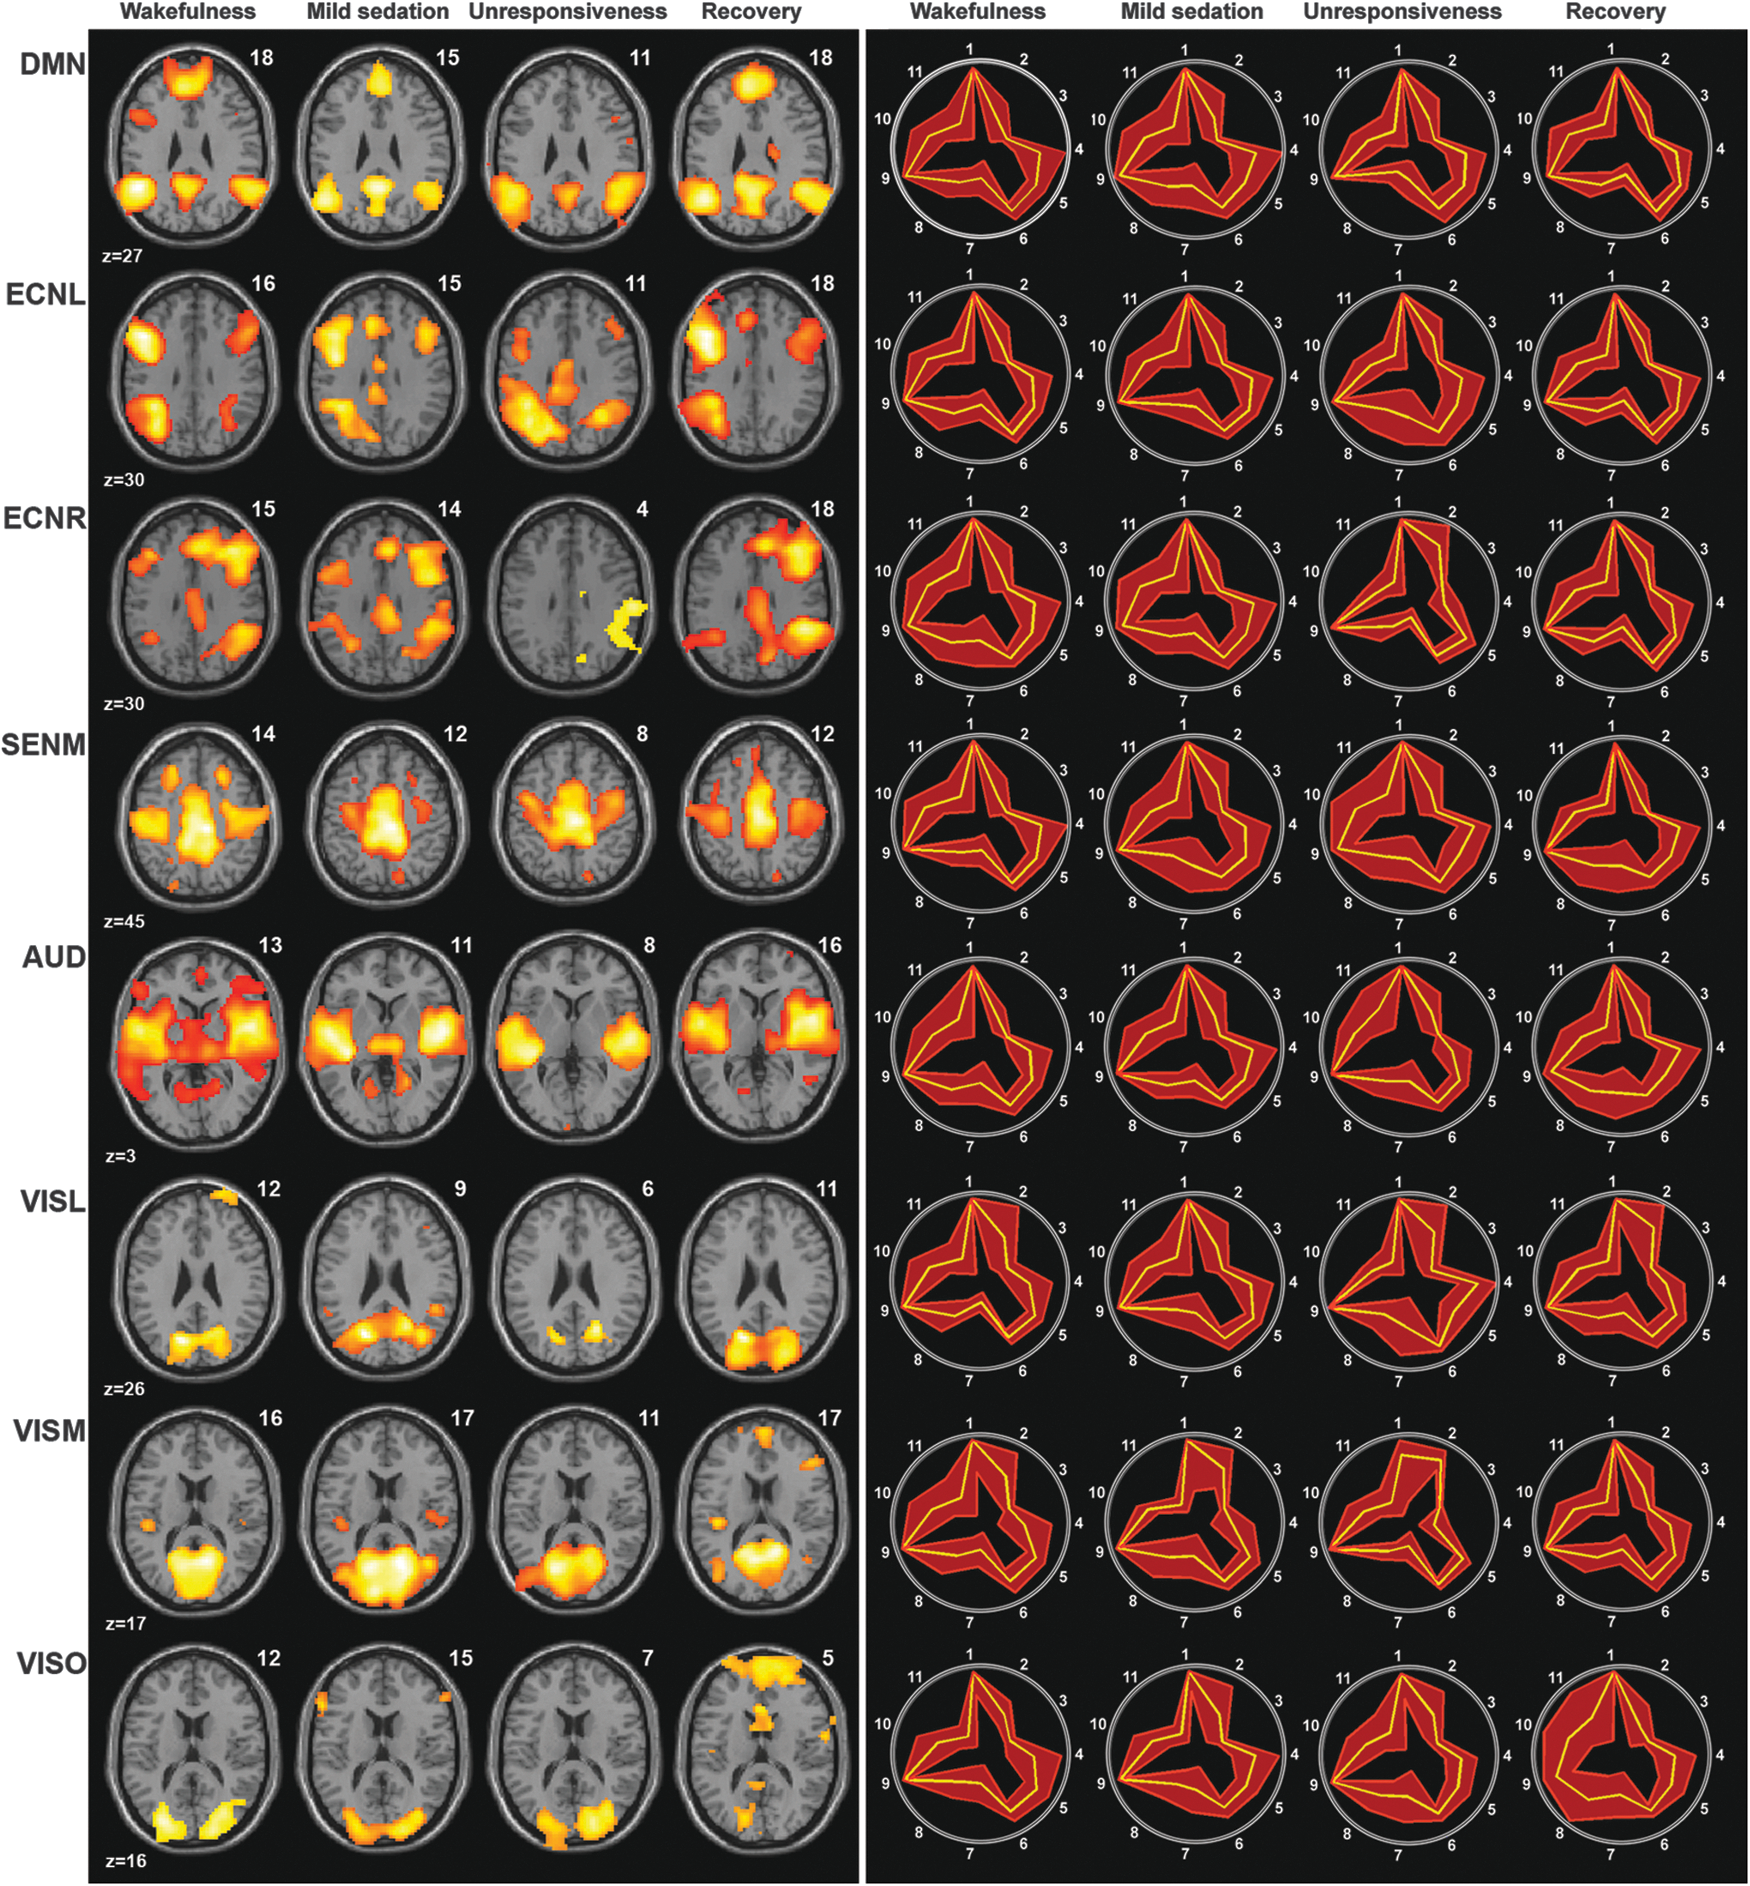
Left: spatial maps of the average of the detected RSNs per RSN and condition (false discovery rate corrected p < 0.05). Salience and cerebellum RSNs are not depicted due to low detectability. Numbers above the brain slices indicate the number of subjects in which the RSN was detected. Right: accompanying fingerprints; legend: 1, clustering; 2, skewness; 3, kurtosis; 4, spatial entropy; 5, one-lag autocorrelation; 6, temporal entropy; 7, 0–0.008 Hz; 8, 0.008–0.02 Hz; 9, 0.02–0.05 Hz; 10, 0.05–0.1 Hz; 11, 0.1–0.25 Hz. The yellow line represents the mean values, while the red lines represent the standard deviation.
A total brain connectivity map was constructed from all the independent components that were neuronal according to our neuronality classifier (Supplementary Fig. S2) (Demertzi et al., 2014). The number of detected neuronal components was significantly lower during unresponsiveness than during the other three conditions. Connectivity in the medial frontal cortex, bilateral inferior/medial frontal cortices, anterior temporal, and inferior parietal cortices, as well as the cerebellum and mesopontine area, decreased with loss of responsiveness (false discovery rate corrected p < 0.05; Fig. 3 and Table 1). These regions, with the exception of the mesopontine area, were also found in the direct comparison between mild sedation and unresponsiveness (false discovery rate corrected p < 0.05; Supplementary Fig. S3 and Supplementary Table S1).
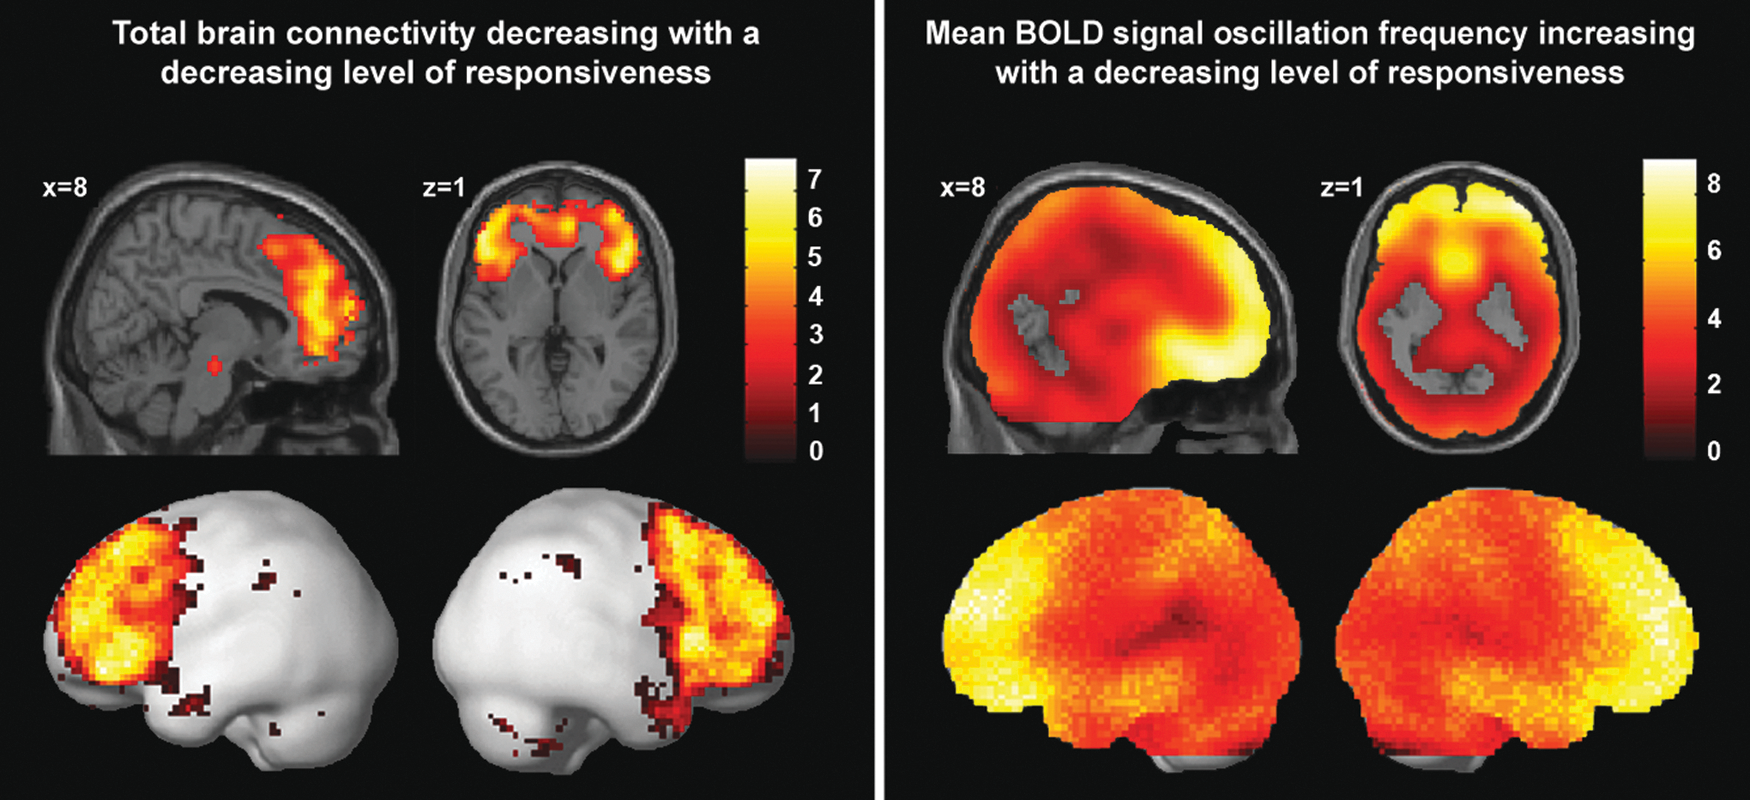
Left: brain regions in which decreased connectivity correlated with loss of responsiveness, using the following contrast—wakefulness: 1, mild sedation: −0.5, unresponsiveness: −1.5, and recovery: 1; at false discovery rate corrected p < 0.05. The total connectivity map was based on the data of 14 of the 18 subjects, as no neuronality was detected in four subjects during unresponsiveness. Right: brain regions in which loss of responsiveness correlated with increased mean oscillation frequencies of the BOLD signal, according to the contrast—wakefulness: −1, mild sedation: 0.5, unresponsiveness: 1.5, and recovery: −1; at false discovery rate corrected p < 0.05. This map was constructed using the data from all 18 subjects. BOLD, blood oxygenation level-dependent.
Regions in Which Connectivity Decreases Were Correlated to Loss of Responsiveness
FDR, false discovery rate.
Analysis of the mean oscillation frequency of the BOLD signal showed a strong widespread increase in the mean oscillation frequency during propofol-induced loss of responsiveness, with mean oscillation frequency values approaching or surpassing 0.1 Hz (Table 2 and Fig. 3). This effect appeared to be particularly strong in the frontal and temporal cortices. A direct contrast between mild sedation and unresponsiveness also showed particularly clear frequency increases in these regions (false discovery rate corrected p < 0.05; Supplementary Fig. S3).
Mean BOLD Signal Oscillation Frequency Analysis in DMN-Associated Regions
Average mean frequency in Hz.
BOLD, blood oxygenation level-dependent; DMN, default mode network; ICA, independent component analysis; RSN, resting-state network.
Discussion
In this study, we used a recently developed method to examine total brain connectivity changes during propofol-induced mild sedation and unresponsiveness and, subsequently, performed a study of the mean BOLD signal oscillation frequency. First, however, we examined detectability and connectivity changes for 10 well-documented RSNs (Damoiseaux et al., 2006).
Separate RSNs
In resting-state fMRI, an often used analysis routine is to identify RSNs in awake healthy controls and subsequently assume that these networks can be relatively reliably detected in different consciousness conditions and in patients with brain damage. In such an approach, an ICA component will be attributed to each known RSN, even if for certain RSNs there is no true component representing that RSN. Therefore, in our approach, we only considered RSNs that were reliably detected, based on spatial fit and temporal/data distribution information (neuronality) (De Martino et al., 2007). The neuronality classifier we used was created by machine learning that resulted in a good discriminator between neuronal and nonneuronal components (De Martino et al., 2007; Demertzi et al., 2014). Indeed, we found a significant difference in the RSN detectability between the consciousness conditions, being lowest during unresponsiveness. Although three different networks (DMN and ECN left and right) had a 100% detectability during wakefulness, recovery of consciousness, or both, none of the 10 RSNs could be detected in all the subjects during any of the sedation levels. This suggests that the detectability of RSNs is highly dependent on the brain state and level of consciousness, similar to findings in patients with disorders of consciousness (Demertzi et al., 2014). Of the four higher-order RSNs we considered, which were the DMN, left ECN, right ECN, and salience network, only the salience network had low detectability rates. Of the lower-order RSNs, the cerebellum had the lowest detectability rates. The remaining eight RSNs could be detected in above 70% of the subjects during wakefulness. They consisted of a spatial distribution similar to that described in literature (Damoiseaux et al., 2006). Interestingly, each of the eight well-detected RSNs had at least one frontal component, with which RSN connectivity had a tendency to decrease during loss of responsiveness. For the DMN and bilateral ECN, this involved core RSN structures, as previously indicated by alternative RSN examinations of this dataset (Boveroux et al., 2010; Guldenmund et al., 2013). With lower-order RSNs, it involved a form of frontal connectivity, which might be related, in part, to attention modulation processes (Ben-Simon et al., 2012). We also found indications that propofol-induced disconnections might occur within core regions of the lower-order RSNs. Combined with earlier findings of propofol-induced decreases in internetwork connectivity between the auditory and visual RSNs (Boveroux et al., 2010), these results suggest that the action of propofol is not limited to higher-order RSNs. Total brain connectivity analysis gave us further insight into propofol-induced frontal cortex connectivity changes.
Total brain connectivity
For each consciousness condition, we constructed a total brain connectivity map. This map consisted of independent components that were considered to be of neuronal origin, as assessed by the neuronality classifier, without applying spatial constraints. The number of components used for this map was significantly lower during unresponsiveness than during the other three conditions, suggesting a drop in neuronal low-frequency connectivity. When using a contrast to examine connectivity decreases of total brain connectivity during loss of responsiveness, we found that the decreases were mostly centered within the frontal cortex and anterior temporal cortex, while sparse connectivity decreases could also be detected in the bilateral inferior parietal cortices, cerebellum, and mesopontine area.
An interesting overlap of the total brain connectivity finding of frontal disconnection is found when comparing it to EEG measurements during propofol-induced unresponsiveness. EEG shows that during alert wakefulness, the alpha activity is prominent in the occipital and parietal cortices, while propofol-induced unresponsiveness results in an increase of highly coherent alpha waves in the frontal cortex in a process called anteriorization (Cimenser et al., 2011). Alpha anteriorization resembling that produced by propofol can also be found during sevoflurane-, isoflurane-, and thiopental-induced anesthesia (Gugino et al., 2001; John and Prichep, 2005; Supp et al., 2011; Tinker et al., 1977). Furthermore, a similar anteriorization is seen in cases of alpha coma (Niedermeyer, 1997). Recent research shows that the alpha activity might be a hallmark of selective inhibition of brain activity in a region to maintain, strengthen, or shift attentional focus established by other brain regions (Ben-Simon et al., 2012; Foxe and Snyder, 2011; Hanslmayr et al., 2011; Jensen and Mazaheri, 2010; Mathewson et al., 2011). Moreover, an increased alpha power has been related to a decrease in resting-state fMRI connectivity (Scheeringa et al., 2012). A model has been proposed that describes how thalamic activity might drive propofol-induced coherent alpha activity in the frontal lobe, inhibiting consciousness processes (Ching et al., 2010). Possible frontal cortex deactivation is also seen during nonrapid eye movement (non-REM) sleep, where increased slow delta waves are associated with decreased frontal cortex metabolism as measured with FDG-PET (Dang-Vu et al., 2010; Muzur et al., 2002). A similar slow-wave activity, being most prominent in frontal and inferior parietal cortices, has been observed during temporal lobe seizures (Blumenfeld, 2011). Increasing evidence suggests that the inhibition of feedback connectivity from anterior to posterior brain regions could be a main mechanism leading to loss of responsiveness (Jordan et al., 2013; Lee et al., 2013a, 2013b; Mashour, 2014). The overlap between the propofol-induced increase in highly coherent alpha activity in the frontal cortex and decreases in the frontal connectivity as seen with resting-state total connectivity fMRI, may underlie the potential usefulness of frontal EEG monitoring for the purpose of attaining a rough assessment of the level of consciousness of a patient sedated with propofol (Anderson and Jakobsson, 2004). However, future studies should study the process of frontal disconnection in more detail to be able to improve the sensitivity of the technique. Furthermore, as different anesthetics might use different pathways to disturb consciousness, frontal EEG monitoring could be less effective for certain anesthetics (Anderson and Jakobsson, 2004; Galante et al., 2015; Lee et al., 2013b; Punjasawadwong et al., 2014).
Numerous PET studies report on propofol-induced brain metabolism decreases. Regional cerebral blood flow (rCBF) PET studies have shown that propofol-induced unresponsiveness is associated most with decreased blood flow in the thalamus and PCC/precuneus (Bonhomme et al., 2001; Fiset et al., 1999; Kaisti et al., 2003; Schlunzen et al., 2012; Xie et al., 2011). Most severe reductions in glucose use were seen in the thalamus, parietal and frontal DMN regions, and occipital lobe (Schlunzen et al., 2012; Sun et al., 2008). The oxygen consumption was found to be most reduced in the occipital/precuneal cortex (Kaisti et al., 2003). In general, PET studies thus associate lost consciousness mostly with metabolic reductions in the thalamus and PCC/precuneus. However, these studies show absolute decreases in metabolism. When depicting the relative decreases, the emphasis of decreased rCBF can be found in most ECN- and DMN-related regions, with only a relatively minor decrease in rCBF in the thalamus (Kaisti et al., 2003). This is more similar to our total brain connectivity map. Frontal disconnection, as seen with total brain connectivity, might result in a decreased activity in frontoparietal RSNs, like the DMN and ECN, which we found using network-based analysis. Studies of brain metabolism during sleep have reported that REM sleep-associated reductions could be found in regions overlapping with bilateral ECNs, while non-REM sleep also showed pronounced decreases in the thalamus, posterior cingulate, and medial frontal cortex (Desseilles et al., 2011). It is tentative to speculate that this results in the deactivation of DMN and ECN activity in non-REM sleep, while in REM sleep, DMN functioning might be present, possibly underlying internal, but not external awareness aspects associated with REM sleep. Interestingly, restoration of medial frontoparietal activity during REM sleep was associated with increased metabolism in the pontine tegmentum, thalamus, and anterior cingulate cortex (Desseilles et al., 2011). This hints at a role of the thalamus and frontal cortex in the restoration of REM internal awareness. Indeed, restored thalamocortical connectivity has also been associated with the recovery of a patient from VS/UWS (Laureys et al., 2000, 2010), while an increased frontal cortex activity was found to accompany zolpidem-induced paradoxical improvements in behavioral responses of a patient in MCS (Brefel-Courbon et al., 2007).
Using classical resting-state fMRI with seed-voxel analysis and ICA, frontal disconnection has been found within the DMN and ECN during propofol-induced unresponsiveness (Boveroux et al., 2010; Guldenmund et al., 2013), as well as severe disintegration of the salience network (Guldenmund et al., 2013) and connectivity between higher-order networks and the thalamus (Boveroux et al., 2010; Guldenmund et al., 2013; Liu et al., 2013), and disruption of connectivity with the PCC/precuneus (Amico et al., 2014; Liu et al., 2014; Stamatakis et al., 2010). Disconnection of frontal DMN regions has also been observed in sevoflurane-induced sedation (Deshpande et al., 2010; Palanca et al., 2015), non-REM sleep (Horovitz et al., 2009; Samann et al., 2011), and MCS, VS/UWS and coma (Soddu et al., 2012; Vanhaudenhuyse et al., 2010). Interestingly, we found that a mesopontine area was also among the regions decreasing in the total brain connectivity map. The decreased connectivity between this region and DMN structures has previously been described for propofol-induced unresponsiveness (Boveroux et al., 2010; Guldenmund et al., 2013). The brainstem contains a major part of the ascending reticular arousal system (de Lecea et al., 2012; Saper et al., 2005). This main brain arousal system is composed of the brainstem, thalamus, and basal forebrain regions (Saper et al., 2005), and microinjection of pentobarbital in the mesopontine tegmental region in rats has been shown to result in a condition resembling general anesthesia (Devor and Zalkind, 2001).
For the construction of our total connectivity maps, we excluded four subjects where no neuronal RSNs were detected during unresponsiveness. This may have introduced a bias. We did not find aberrant propofol plasma concentrations in these subjects compared to the average for inducing loss of responsiveness and have no indications that anesthesia was deeper in these subjects. In addition, we did not find a lower RSN detection rate during wakefulness and recovery, although this does not exclude the possibility that neuronality signatures might already have been closer to nonneuronality than in other subjects, in a way that cannot be robustly detected using classical analysis. We did, however, find that not only the RSN detection rate in unresponsiveness was significantly lower than average but also in three of the four subjects, the RSN detection rate in mild sedation was also lower than average. Thus, we have to limit ourselves to the observation that propofol might affect the RSN connectivity distinctly in these subjects, and we cannot exclude that these subjects might have already had a distinct neuronality pattern during wakefulness. Future studies should examine neuronality patterns in more detail to better understand such differences between subjects. Uncertainty also exists about the best choice of contrasts for examining the effects of propofol on brain dynamics. Indeed, an upcoming detailed examination of separate levels of responsiveness could improve this modeling, thereby improving chances of finding further dynamics underlying loss of responsiveness (Liu et al., 2013).
Mean BOLD signal oscillation frequencies
Our frequency analysis showed widespread increases in the mean oscillation frequency of the BOLD signal with loss of responsiveness, to around a value of 0.1 Hz. This increase appeared especially clear in the frontal, temporal, and mesopontine areas; regions showing total brain connectivity disconnection during propofol-induced loss of responsiveness. The increase in BOLD signal frequency might be interpreted as a decrease of neuronal activity, producing a reduction of the BOLD signal, which we commonly declare to be of neuronal origin (0.02–0.05 Hz). This would cause the BOLD signal to end up being dominated by high-frequency contributions of around 0.1 Hz, which could be just the effect of the aliasing of heart-related high-frequency contributions. However, one might also hypothesize that an increase in the BOLD oscillation frequency might be the result of a change in nature of the neuronal activity, which we know to occur, and could be captured using the fMRI signal. Future studies should further explore these dynamics, as these increases in BOLD signal frequencies might also be expected to occur in other conditions of altered consciousness, such as sleep and disorders of consciousness (Guldenmund et al., 2012a, 2012b). Mean BOLD signal oscillation frequency analysis methods comparable to those used in this analysis might therefore be employed as a biomarker of the level of consciousness. This could be particularly useful when dealing with the challenging diagnosis of patients with disorders of consciousness (Guldenmund et al., 2012a; Laureys et al., 2000, 2004). The main RSN examined in these patients has traditionally been the DMN, as examination of its integrity has shown its potential as a biomarker of consciousness (Guldenmund et al., 2012b; Soddu et al., 2012; Vanhaudenhuyse et al., 2010). However, the traditional assessment of DMN integrity in patients with disorders of consciousness has often proved to be extremely challenging, making the search for alternative analysis methods such as total brain connectivity and mean BOLD signal oscillation frequency analysis of great importance. Examining mean frequencies of the BOLD signal oscillations in regions associated with the DMN (or other higher-order RSNs) in patients with disorders of consciousness and comparing them with those found in awake healthy controls, could indicate if regions show a marked increase in mean BOLD signal oscillation frequency. Strong increases within DMN regions might serve as a measure of disruption of the network, and thus likely consciousness (Guldenmund et al., 2012a, 2012b).
Conclusion
In this study, we examined propofol-induced brain changes using different methods. First, we examined the detection rate and integrity of 10 well-known RSNs, showing decreased detection rate and frontal cortex connectivity of these networks during unresponsiveness. Second, we examined total brain connectivity changes. This showed that the RSN connectivity with neuronal frequencies decreased with propofol administration in the frontal, temporal, and brainstem areas. Third, we examined mean BOLD signal oscillation frequency changes. Regions associated with those found disconnected with total brain connectivity analysis were found to show the highest frequency increases, although frequency increases were widespread. The frontal cortex disconnection shows great resemblance with the anteriorization behavior of alpha brain waves as seen with EEG, which have been associated with inhibited brain activity (Ben-Simon et al., 2012; Foxe and Snyder, 2011; Hanslmayr et al., 2011; Jensen and Mazaheri, 2010; Mathewson et al., 2011). The frontal cortex is thought to have an important steering role in pivotal cognitive aspects like attention and working memory (Benchenane et al., 2011), and given the widespread connectivity of the frontal cortex with other brain regions, its disruption could influence the activity in the whole brain to a degree where it might lead to alterations in the level of responsiveness. As severe structural injury in the frontal lobe may not necessarily lead to loss of responsiveness (Filley, 2010), it could be speculated that propofol-induced loss of responsiveness might be a result of activation of parts of finely orchestrated brain pathways leading to naturally occurring loss of consciousness, such as sleep, or inhibition of brain regions to focus attention (Ben-Simon et al., 2012; Foxe and Snyder, 2011; Hanslmayr et al., 2011; Jensen and Mazaheri, 2010; Mathewson et al., 2011; Scheeringa et al., 2012); pathways not (effectively) activated by structural brain injury in the frontal lobe. However, further research should provide more insight into frontal cortex functioning in relation to consciousness, and the relationship between brain connectivity, mean BOLD signal oscillation frequencies, metabolism, and the electrical oscillatory activity.
Summary Statement
We examined the effects of mild propofol sedation and propofol-induced unresponsiveness with resting-state fMRI, using a recently developed automatic ICA-based method for examining connectivity changes in 10 RSNs. We furthermore employed an automatic ICA-based method to examine changes in total brain connectivity by assembling all independent components of neuronal origin (as assessed with a neuronality classifier) into one scalar map. Our results show that propofol-induced loss of responsiveness is mostly associated with connectivity reductions in the frontal lobes. A frequency analysis indicated that the loss of responsiveness was furthermore linked to an increase in the mean oscillation frequency of the blood oxygen level-dependent signal.
Footnotes
Acknowledgments
This work was supported by the Canada Excellence Research Chair (CERC) and a discovery grant from the Natural Sciences and Engineering Research Council (NSERC), the Belgian National Funds for Scientific Research (Brussels, Belgium), the European Commission (Brussels, Belgium), the James McDonnell Foundation (Saint Louis, MO), the Mind Science Foundation (San Antonio, TX), the French Speaking Community Concerted Research Action (ARC, 06/11-340, Brussels, Belgium), the Fondation Médicale Reine Elisabeth (Brussels, Belgium), Belgian interuniversity attraction pole (Brussels, Belgium), the University of Liège (Liège, Belgium), and the University Hospital of Liège (Liège, Belgium).
Authors' Contributions
P.G. and I.S.G. were the primary authors of the text. P.G., I.S.G., M.B., S.L., F.G., and A.S. designed the project. P.G., I.S.G., K.B., and T.D. analyzed the data. A.S. and F.G. supervised the project. A.D., A.V., M.-A.B., and O.G. collected data. P.B., V.B., and M.K. were responsible for the propofol administration and monitoring. All authors have aided in the editing of the article and read and approved the final article.
Author Disclosure Statement
No competing financial interests exist.
References
Supplementary Material
Please find the following supplemental material available below.
For Open Access articles published under a Creative Commons License, all supplemental material carries the same license as the article it is associated with.
For non-Open Access articles published, all supplemental material carries a non-exclusive license, and permission requests for re-use of supplemental material or any part of supplemental material shall be sent directly to the copyright owner as specified in the copyright notice associated with the article.