
Abstract
Using noninvasive neuroimaging, researchers have shown that young children have bilateral and diffuse language networks, which become increasingly left lateralized and focal with development. Connectivity within the distributed pediatric language network has been minimally studied, and conventional neuroimaging approaches do not distinguish task-related signal changes from those that are task essential. In this study, we propose a novel multimodal method to map core language sites from patterns of information flux. We retrospectively analyze neuroimaging data collected in two groups of children, ages 5–18 years, performing verb generation in functional magnetic resonance imaging (fMRI) (n = 343) and magnetoencephalography (MEG) (n = 21). The fMRI data were conventionally analyzed and the group activation map parcellated to define node locations. Neuronal activity at each node was estimated from MEG data using a linearly constrained minimum variance beamformer, and effective connectivity within canonical frequency bands was computed using the phase slope index metric. We observed significant (p ≤ 0.05) effective connections in all subjects. The number of suprathreshold connections was significantly and linearly correlated with participant's age (r = 0.50, n = 21, p ≤ 0.05), suggesting that core language sites emerge as part of the normal developmental trajectory. Across frequencies, we observed significant effective connectivity among proximal left frontal nodes. Within the low frequency bands, information flux was rostrally directed within a focal, left frontal region, approximating Broca's area. At higher frequencies, we observed increased connectivity involving bilateral perisylvian nodes. Frequency-specific differences in patterns of information flux were resolved through fast (i.e., MEG) neuroimaging.
Introduction
Normal developmental changes in gross language representation have been well characterized using noninvasive neuroimaging. With functional magnetic resonance imaging (fMRI), and more recently, magnetoencephalography (MEG), researchers have shown that healthy young children have bilateral and diffuse language networks, which become increasingly left lateralized and focal with development (Brown et al., 2005; Holland et al., 2001; Kadis et al., 2011; Ressel et al., 2008).
An early distributed network is thought to confer a pediatric advantage in the event of cerebral insult. Adults with left perisylvian injury tend to develop severe and lasting aphasias, whereas young children with comparable insults experience minimal language disturbance and develop essentially normal language through childhood and adolescence (Ballantyne et al., 2008; Bates et al., 2001; Reilly et al., 1998; Vargha-Khadem et al., 1985; see also, Jacola et al., 2006; Tillema et al., 2008). Sparing of language is realized through functional engagement of the extracanonical cortex. The potential for both interhemispheric and intrahemispheric plasticity (i.e., establishment of an atypical language network) decreases with age, and relatively poor outcomes and failure to form atypical networks are seen with insults occurring after about age 5 or 6 years (Branch et al., 1964; Brazdil et al., 2003; Helmstaedter et al., 1997; Kadis et al., 2007, 2009; Rasmussen and Milner, 1977; Saltzman-Benaiah et al., 2003; Satz et al., 1988).
Normal developmental changes in language representation provide a compelling context in which the potential for effective plasticity would be expected to decrease with age. However, the timing for establishment of adult-typical representation does not perfectly track with the clinical outcome data. In fMRI, mature left lateralization and focalization of the BOLD activity is protracted in the developmental period, with adult-typical representation emerging in adolescence or young adulthood (e.g., Szaflarski et al., 2006). Similarly, in MEG language studies, dipoles fit to average waveforms and signature oscillatory activity tend to left lateralize and focalize in the teen years (Gummadavelli et al., 2013; Kadis et al., 2008, 2011; Ressel et al., 2008). The discord suggests that conventional neuroimaging approaches to language mapping fail to distinguish task-correlated hemodynamic or neuronal activity from that which is task essential (i.e., necessary and sufficient for task completion). The result is relatively broad “activation” maps for childhood function, which fail to delineate the core regions necessary for task completion.
Recent developments in neuroimaging technology, and particularly the high temporal resolution afforded by MEG, permit assessment of neuronal population dynamics, including characterization of transient activity and estimation of causal networks. In this study, we seek to estimate information flux (directional or effective connectivity) within the distributed pediatric expressive language network. We report on findings from two groups of children completing verb generation tasks in fMRI and MEG. Large-scale fMRI data are used to provide a spatial template of task-related activation. The group activation map is then segmented using a 200-unit random parcellation scheme (Craddock et al., 2012), with parcel centroids used to define network node locations. The neuromagnetic activity at each node is estimated from MEG recordings using a beamformer, and the time courses are subjected to effective connectivity analyses using the phase slope index (PSI) metric recently introduced by Nolte and associates (2008). Unlike many other electrophysiological metrics of effective connectivity, PSI remains insensitive to mixing/volume conduction, providing robust estimates of information flux between both proximal and distal node pairs. The pipeline capitalizes on the relative strengths of fMRI and MEG (spatial and temporal resolution, respectively) and is sensitive to the regional dynamics that is known to underlie all higher cognitive processes.
Method
We analyze fMRI and MEG data that were collected for two separate studies investigating developmental changes in language representation. The participants, tasks, and data acquisition have been documented previously (Holland et al., 2007; Kadis et al., 2011; see also, Kadis et al., 2008; Karunanayaka et al., 2010, 2011; Pang et al., 2011) and are described only briefly below. The focus of the current study is on integration of data from the two imaging modalities and the novel application of effective connectivity analyses for mapping a core functional network.
Data acquisition
Functional magnetic resonance imaging
Participants
The fMRI cohort included 343 typically developing children (170 males), ages 5–18 years (M = 12.0, SD = 3.8), studied at Cincinnati Children's Hospital Medical Center (Cincinnati, OH) between 2000 and 2006. This a slightly larger cohort than initially described in Holland and associates (2007), as recruitment continued beyond initial analysis and publication. All participants in the study were native English speakers, free from language disability, learning disability, and neurological disorder. Edinburgh Handedness Inventory (EHI; Oldfield, 1971) scores indicate that 318 were right handed, 22 left handed, and 3 ambidextrous. Parents provided consent, and children aged 8 years and older assented to participate. The study was approved by the Hospital's Institutional Review Board.
fMRI verb generation
Children alternately listened to recordings of concrete nouns generated by an adult female speaker (task block) or speech-frequency warble tones (control block). During the task block, children covertly generated action words corresponding to each noun. The noun stimuli were presented at a rate of once every 5 sec, in five 30-sec blocks. During the control block, children were asked to simply listen to each tone. Warble tones were presented every 5 sec, in six 30-sec blocks. Participants listened to a total of 30 nouns and 36 warble tones during the 5.5 min fMRI recordings.
Functional and structural MRI scanning was performed on a Bruker BioSpec 30/60 3T system (Bruker Medizintechnik, Karlsruhe, Germany). The fMRI scans were acquired using a T2*-weighted gradient echo EPI sequence (TE = 38 msec, TR = 3000 msec, FOV = 256 × 256 mm, slice thickness = 5 mm). At each of the 110 time points, 24 slices were acquired. The initial 10 time points (corresponding to a control block) were discarded to allow protons to reach T1 relaxation equilibrium. A T1-weighted whole brain structural image was acquired using a 3D MDEFT scan (TE = 4.3 msec, TR = 15.7 msec, voxel size = 1.0 × 1.0 × 1.5 mm).
Magnetoencephalography
Participants
The MEG cohort included 21 typically developing children (13 males), ages 5–18 years (M = 12.2, SD = 4.6), scanned at the Hospital for Sick Children (Toronto, ON) between 2007 and 2008. This a subset of participants described in Kadis and associates (2011); only subjects with structural MRIs of sufficient quality for automated segmentation and single-shell head modeling in SPM were included in this study (see forward modeling description under “Extraction of nodal time courses from MEG data” section, below). Participants were native English speakers, negative for history of neurological disorder, learning disability, and language disturbance. Children showed a typical distribution of hand preference, with 19 right handed and 2 ambidextrous, based on EHI scores. Parents provided consent, and children and adolescents assented to participate. The study was approved by the Hospital's Research Ethics Board.
MEG verb generation
Participants alternately viewed color pictures of everyday objects (task condition) or scrambled color images with a superimposed central fixation cross (control condition). Task stimuli were presented for 500 msec, and control stimuli were presented for 1500–2500 msec (jittered). The order of presentation was random within each condition. For the task condition, children were required to covertly generate a verb for each object viewed, as quickly as possible. For the control condition, children were asked to look at the central fixation cross. Overt assessment following MEG acquisition showed that all participants were able to perform the task, and children aged 5–10 had a mean accuracy of 85% across trials.
MEG scanning was performed on a 151-channel whole-head CTF system (MEG International Services Ltd., Coquitlam, BC, Canada). Subjects were tested in the supine position, with the projection screen positioned above the lower face and neck region, for comfortable viewing. Stimuli were presented within 2–3° of the center of the visual field to promote foveal projection. Head localization coils were placed at nasion and preauricular points to monitor movement. Data were acquired at 625 Hz, with an online 100-Hz low-pass filter. In all cases, head displacement was less than 5 mm from the beginning to end of acquisition. To facilitate MEG-MRI coregistration (required for accurate forward modeling in source analyses), multimodal radiographic markers were placed at the nasion and preauricular positions before acquiring structural images. MRI was conducted on a GE Signa Advantage 1.5T scanner (GE Medical, Milwaukee, WI). A whole brain T1-weighted image was acquired using a 3D-SPGR scan (TE = 4.2 msec, TR = 9 msec, voxel size = 0.94 × 0.94 × 1.50 mm).
Analyses
fMRI analyses
Image preprocessing and first-level analyses were carried out using the Cincinnati Children's Hospital Image Processing Software (CCHIPS; Schmithorst and Dardzinski, 2000). EPI data were corrected for geometric distortion due to B0 field inhomogeneity (Schmithorst et al., 2001) and coregistered to minimize motion effects (Thevenaz et al., 1998). An experienced rater identified landmarks on each subject's structural image, which were used to linearly transform structural and functional data to a standard space (Talairach and Tournoux, 1988). Functional data were cross correlated with a reference waveform reflecting the time course of task and control blocks, and a t-statistic (verbs minus tones) was computed on a voxel-wise basis.
Second-level analyses were carried out in SPM8 (
Parcellation of the activation map
As an initial step to interrogating the distributed expressive language network for patterns of effective connectivity, we parcellated the group map and established a set of cortical node locations. The group activation map was normalized to the MNI 152 subject average T1-weighted image template and binarized such that only suprathreshold voxels were retained. We cropped the resulting activation map using a gray matter mask (to isolate cortex; mask supplied with SPM8), resampled the image to 4.0 mm isotropic, and multiplied the activation by a random, 200-unit parcellation scheme (provided as a 4.0 mm isotropic image) recently introduced by Craddock and associates (2012). Centroids of cortical parcels with >10 active voxels serve as network nodes. The 200-unit parcellation scheme provides a good trade-off between anatomical interpretability and functional homogeneity (Craddock et al., 2012), and the node density approximates the specificity of our subsequent beamformer analyses (i.e., limited by the under determinacy of the inverse; source analyses described below).
Extraction of nodal time courses from MEG data
Preprocessing was carried out using FieldTrip (Oostenveld et al., 2011) in MATLAB R2014a. Each participant's MEG recording was imported and epoched from −450 to 950 msec, relative to the onset of target picture presentation. Trials were baseline corrected (using the −450 to 0 msec window as a baseline), and power line noise was attenuated using a 60-Hz discrete Fourier transform filter. Scanner jump artifacts were automatically identified and trials containing artifacts rejected from each dataset.
Forward modeling was conducted in SPM8. Each subject's T1-weighted MRI was imported, segmented, and then warped to the MNI 152 template to establish a normalization deformation field. The source model was constructed from a standard 8196-vertex cortical mesh that was warped to the individual subject's cortex using the inverse of the deformation. Fiducial locations were manually identified on each subject's structural MRI, facilitating coregistration with MEG data. Finally, realistic single-shell head models were constructed from the segmented images and lead fields computed using default conductivity parameters.
The neuronal activity at each network node was computed using FieldTrip's linearly constrained minimum variance beamformer (with 0.1% regularization, for spheres of 5 mm radius), implemented in SPM8. Trial data were then cropped to 350–750 msec from picture onset, to isolate neuromagnetic changes reflecting the generative period of the expressive language task (Kadis et al., 2011) in subsequent connectivity analyses.
Effective connectivity analyses
We estimated effective connectivity between each pair of network nodes using the PSI metric, recently introduced by Nolte and associates (2008; see also, Nolte and Müller, 2010; Haufe et al., 2013). PSI is computed from the complex coherency function for a pair of signals, and directionality is determined from phase differences in signals over a specified frequency range. When signal i drives (is driven by) signal j, the mean phase differences between i and j will increase (decrease) with frequency and PSI will be positive (negative). For convenience, PSI is often reported as a normalized value, obtained through division by an estimate of standard deviation (here, jackknife resampling was used). The normalized value, PSInorm, can then be interpreted as any z-value would, facilitating statistical thresholding and group-wise quantitation.
In the current study, we computed PSInorm for each node pair within canonical bands (delta, ∼2–4 Hz, low frequency limited by time window; theta, 4–8 Hz; alpha, 8–12 Hz; beta, 13–30 Hz; and gamma, 31–70 Hz) for each subject. To identify significant connections, data are thresholded at PSInorm ≥ 1.96. The value of ±1.96 corresponds to the critical value in a two-tailed normal deviate (z) test conducted at alpha = 0.05; because the PSI metrics for any given node pair are an additive inverse (i.e., the PSI for signal i driving j is the negative of PSI for j driving i), only one direction of flux need be considered.
Results
Network definition
Group analyses of the fMRI data revealed consistent activation across individuals in bilateral frontal (including insular cortex) and posterior temporal regions, and the left anterior cingulate and right occipital cortices. As expected, the activation encompasses canonical language regions of the left hemisphere (i.e., Broca's and Wernicke's areas) and, to a lesser extent, their right hemisphere homologues. Occipital activation has been previously noted in this task and likely relates to visualization associated with the stimulus and response (i.e., visualization of the everyday object and/or associated activities). Group activation is shown in Figure 1.
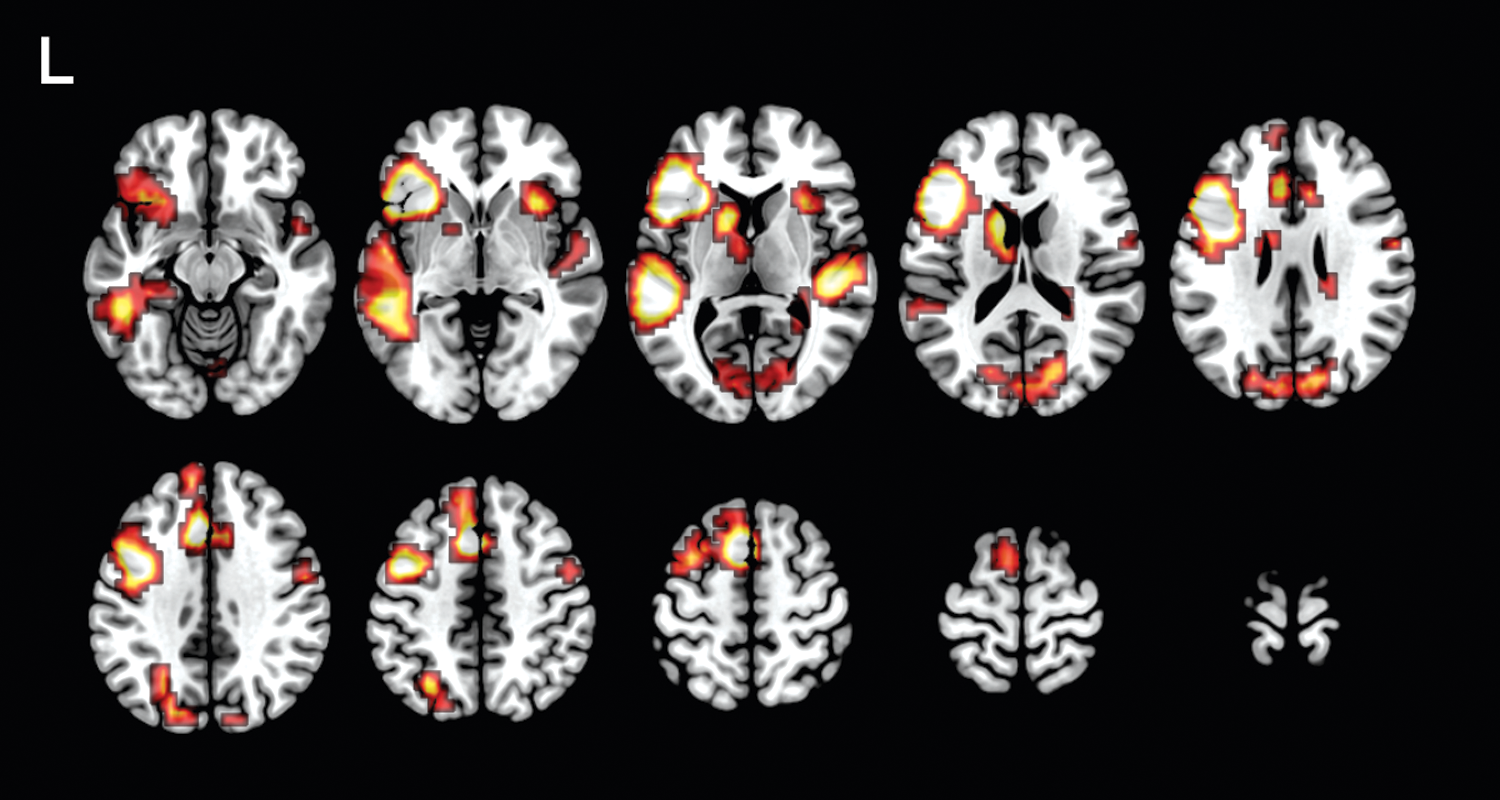
Group fMRI activation for verb generation. Colored areas depict significant fMRI activation in 343 children performing verb generation in fMRI, projected on a template brain (p < 0.01, FWE corrected; minimum clustering threshold of k = 8 voxels of 1.0 × 1.0 × 1.5 mm dimension). fMRI, functional magnetic resonance imaging.
The parcellation procedure yielded 27 cortical network nodes. Of these, 20 were located in the left hemisphere, with the largest cluster focused around the inferior, middle, and superior frontal cortices. The application of a 200-unit random parcellation scheme and the resulting set of network nodes are depicted in Figure 2. Node coordinates and their anatomical labels are presented in Supplementary Table S1 (Supplementary Data are available online at
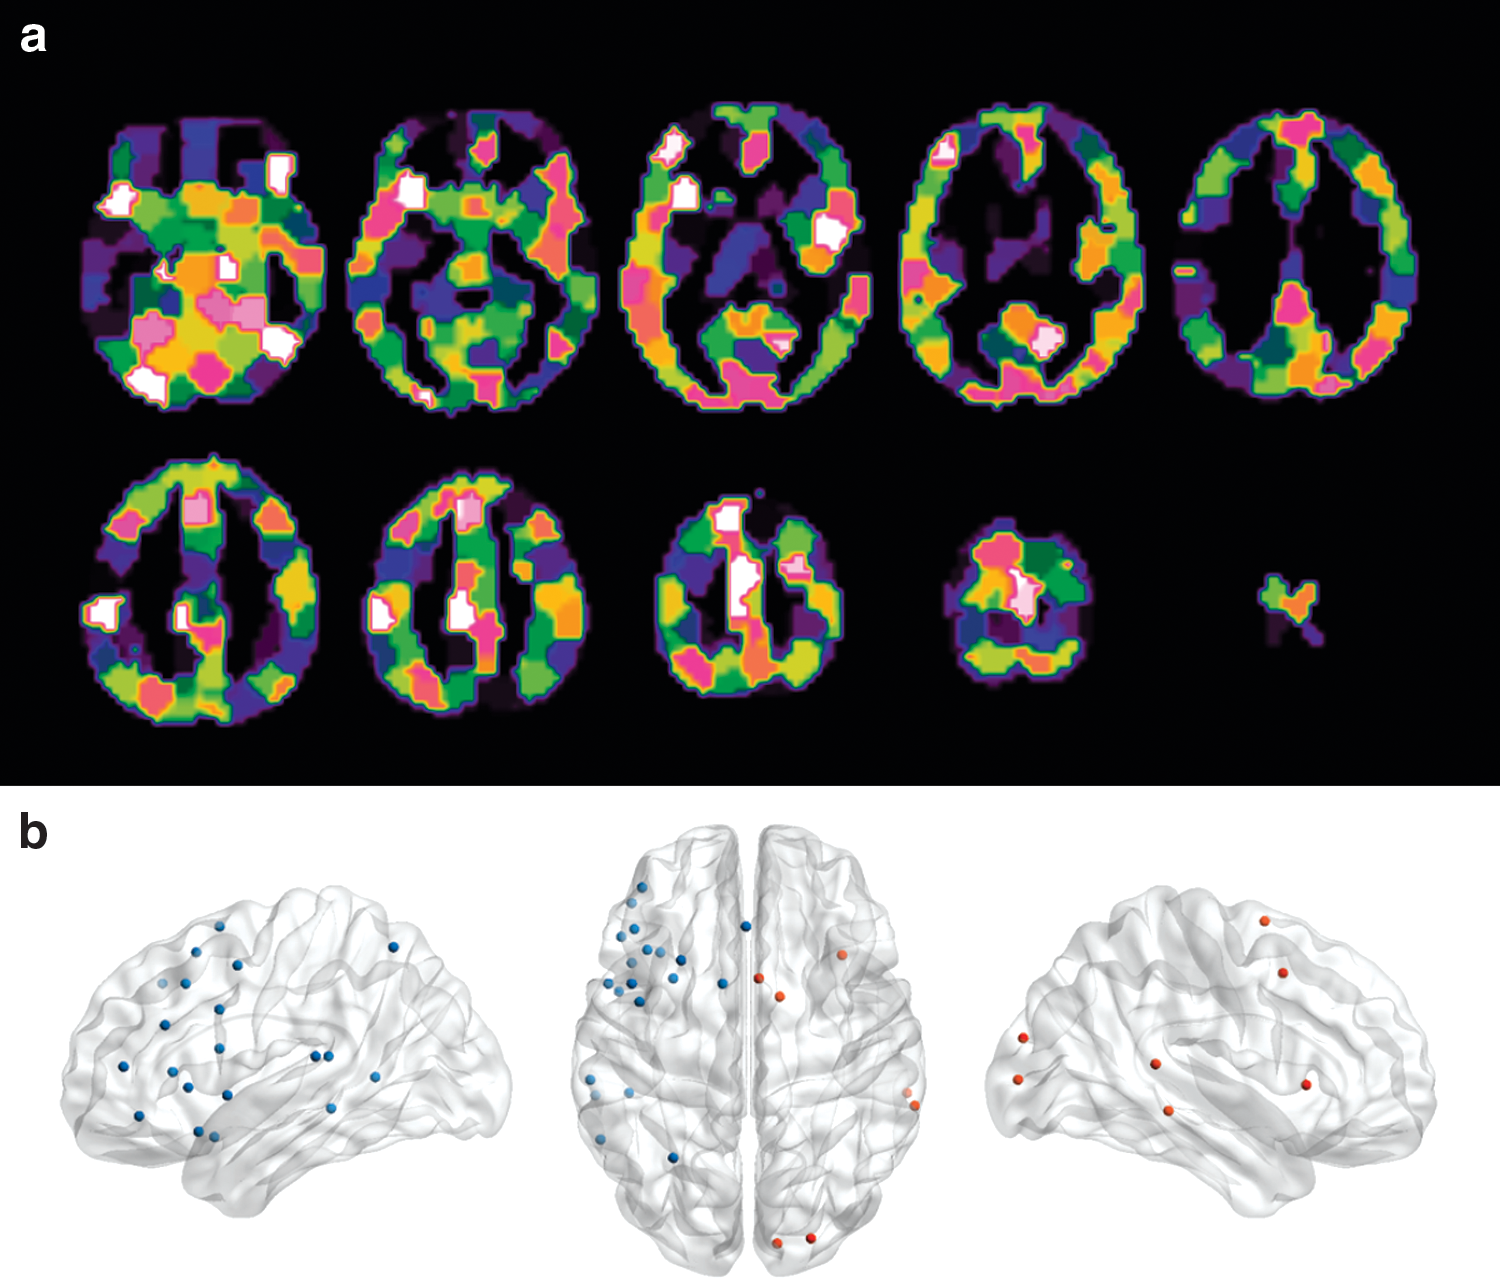
Parcellation and definition of the functional network.
Density of effective connections
Subjects had between 7 and 44 (M = 25.9, SD = 9.7) suprathreshold effective connections among network nodes, summed across all frequency bands. The number of surviving connections did not differ among frequency bands (p > 0.05).
Age-related changes in density of effective connections
The total number of suprathreshold connections was positively and linearly correlated with subject age (r = 0.50, n = 21, p ≤ 0.05), suggesting that older children and adolescents meaningfully engage a greater portion of the distributed network during verb generation than younger children do (Figure 3). Within any particular frequency band, the number of surviving effective connections failed to correlate with age (p > 0.05, uncorrected; Supplementary Fig. S1).
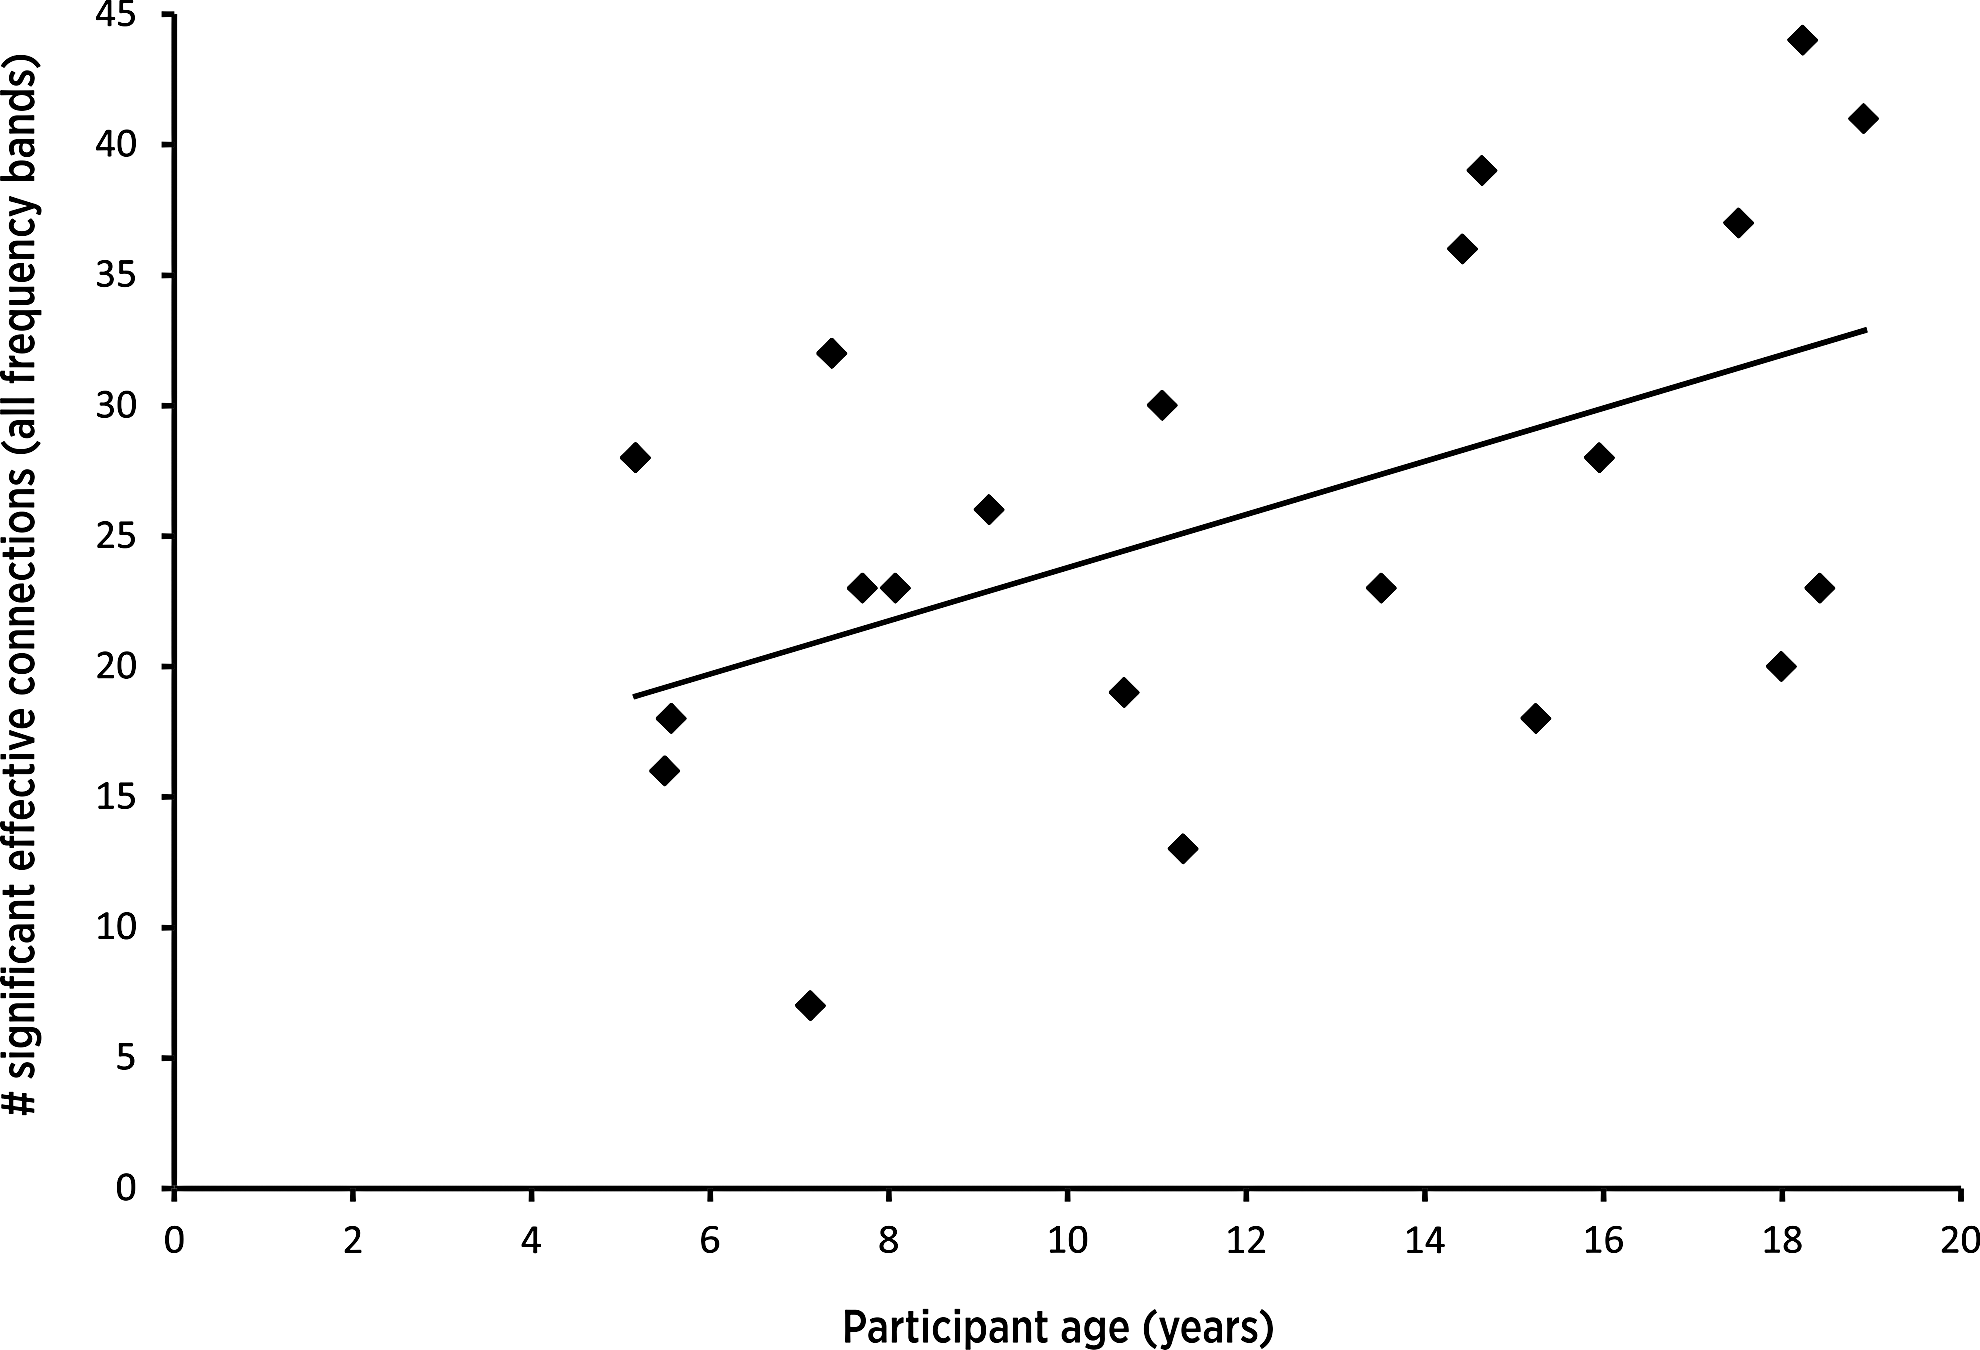
Age-related increase in number of significant effective connections. For each subject, the number of significant effective connections was summed across all frequency bands. Plot shows the significant age-related increase in the total number of suprathreshold (PSInorm ≥ 1.96) effective connections observed within the distributed network (r = 0.50, n = 21, p ≤ 0.5). PSI, phase slope index.
Patterns of effective connectivity across frequency spectra
To characterize frequency-related differences in patterns of information flux during verb generation in children, we plotted suprathreshold effective connections for each frequency bin across all subjects on a template brain (Fig. 4). We observed distinct patterns of information flux across the spectra. In general, low-frequency information flux was focused within the left frontal region; at higher frequencies, effective connectivity was increasingly observed between distal nodes.
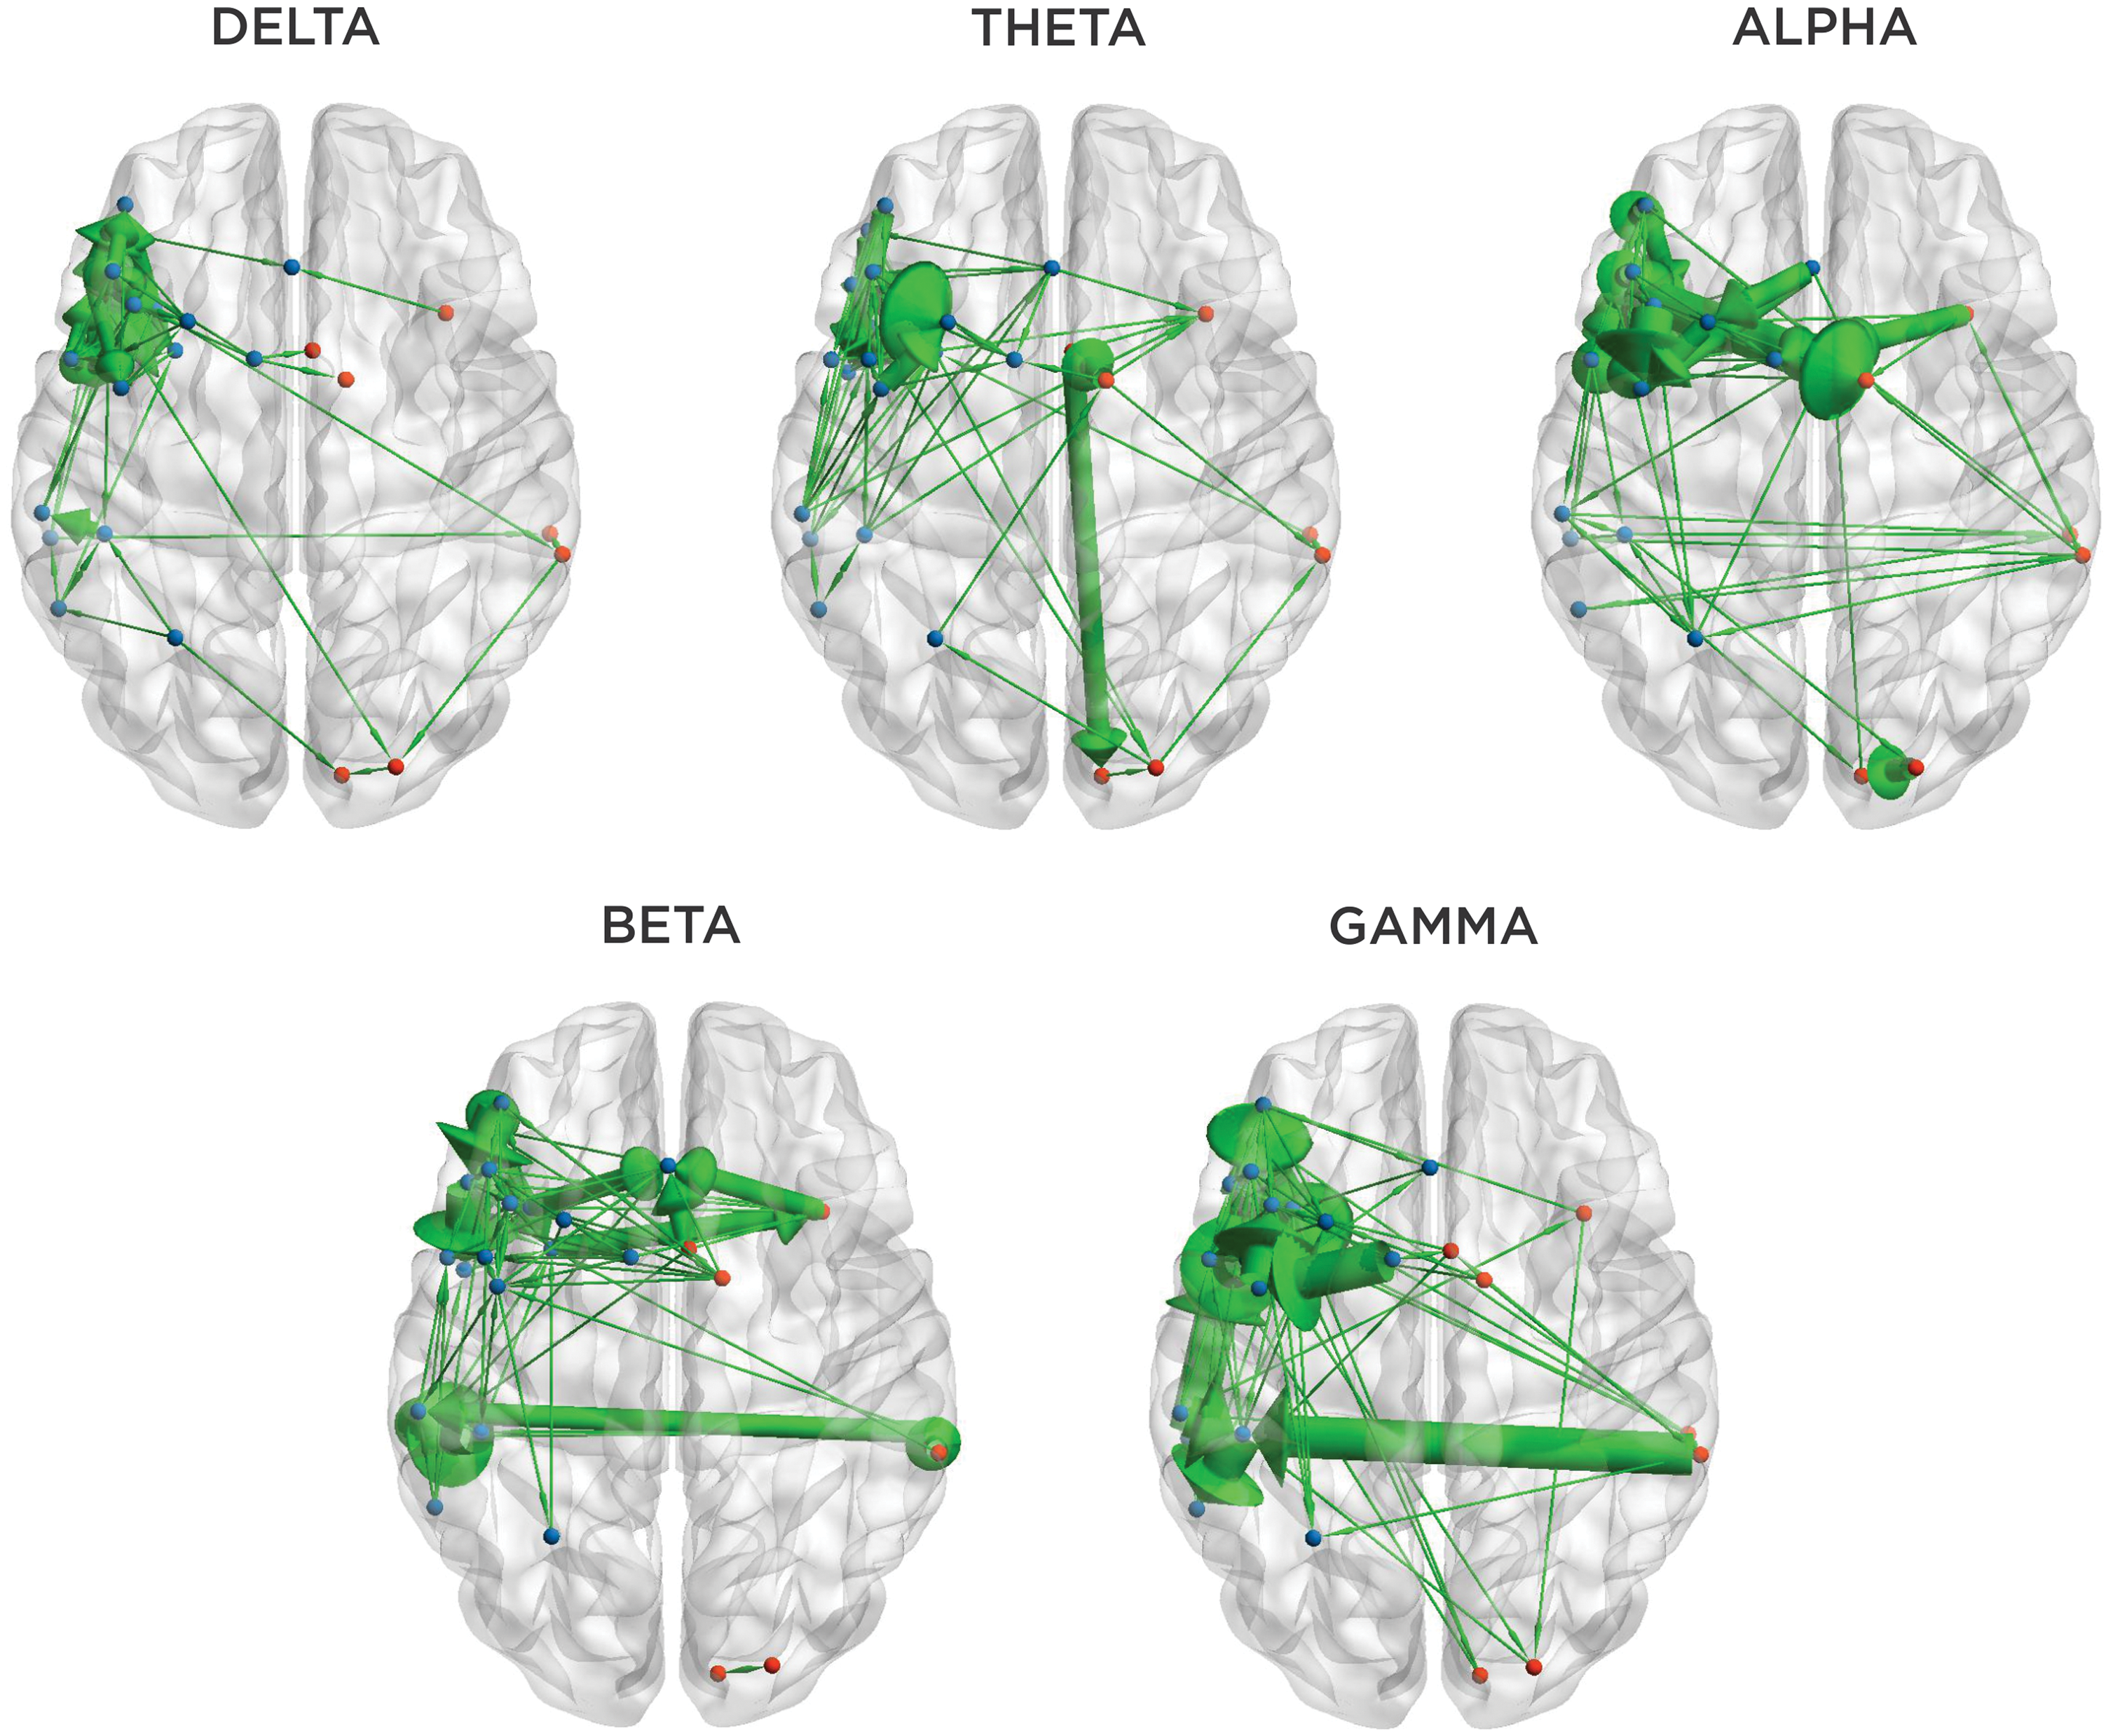
Effective connectivity within canonical frequency bands. Significant node-to-node effective connections are represented as green arrows, which indicate the direction of information flow. The thickness of each arrow reflects the relative frequency of suprathreshold effective connectivity across subjects.
Within the delta band, information flux was predominantly rostrally directed and focused among proximal nodes of the left inferior and middle frontal gyri. In the theta band, the spatial distribution of suprathreshold connections was somewhat broader.
We observed a high density of effective connections between putative Wernicke's and Broca's areas in the theta, beta, and gamma bands, which were predominantly rostrally directed.
In the alpha, beta, and gamma bands, we observed significant interhemispheric effective connectivity. In alpha and beta, bidirectional information transfer was observed between left and right frontal nodes and between left and right posterior temporal nodes. In gamma, the right posterior temporal region emerged as an important driver of both left posterior temporal (Wernicke's) and left frontal (Broca's) regions, although this region appears to be driven by the left posterior region at lower frequencies.
Across frequency bins, we observed significant information flux between Wernicke's and Broca's areas. However, only minimal effective connectivity was observed between right posterior temporal and right frontal regions, indicating that the right hemisphere language homologues do not simply mirror the function/connectivity of the canonical language regions in typically developing children.
Discussion
In this study, we integrated fMRI and MEG data to characterize information flux within the distributed pediatric expressive language network. The approach extends the conventional analysis of task-related changes in BOLD signal or oscillatory power in fMRI and MEG; in this study, we map function through patterns of significant effective connectivity, estimated from fast recordings of neuronal population activity. The framework can be easily generalized to characterize cortical transmission of information for other cognitive domains. The parcellation and MEG analysis approach could also be used to interrogate any arbitrarily defined brain network for patterns of effective connectivity (e.g., assess information flux within a theoretically derived network defined by anatomical boundaries), in the absence of available fMRI data.
Using thresholded normalized PSI to identify regions of significant information flux, we clearly resolved a core left frontal subnetwork consisting of 11 nodes in the inferior, middle, and superior frontal gyri and insula, which support verb generation (expressive language) in our pediatric sample. Although some degree of suprathreshold connectivity was observed between all nodal regions, only the left frontal regions showed significant information flux at all frequency bands studied. This preferential localization is consistent with the earliest accounts of expressive language disturbance following left inferior frontal injury (e.g., Broca, 1861; see also, Dronkers, 1996) and subsequent clinically informed models of gross language representation championed by Geschwind (1970, 1972). Localization is also consistent with previous neuroimaging studies of expressive language in both children (e.g., Karunanayaka et al., 2010, 2011) and adults (e.g., McCarthy et al., 1993; Szaflarski et al., 2006). In general, the left inferior and middle frontal cortex has been implicated in semantic processing and word retrieval; the insular cortex is involved in speech or articulatory planning (Price, 2012).
Uniquely, we observed changing patterns of effective connectivity among the 27 network nodes, depending on the frequency analyzed. In the delta band, rostrally directed effective connections were focused within the left frontal nodes. Progressing through theta, alpha, and beta bands, we see a transition to predominantly caudally directed connections among the same nodes. Findings highlight the variable nature of information flow that can occur among a fixed set of nodes, at different frequencies. Similarly, we observed changes in the spatial distribution of information flux across the spectra. In the delta and theta bands, we observe effective connectivity primarily between proximal left inferior frontal nodes; in the alpha and beta bands, we see increasing involvement of midline regions, and at beta and gamma, we observe bilateral posterior temporal nodes emerging as important drivers in the network. These spectrally resolved changes in patterns of information flux cannot be resolved in conventional neuroimaging. We expect that increased access to MEG for studying language will necessitate updates to the current network models, to account for the distinct patterns of connectivity that occur at various timescales.
Across frequency bands, the total number of suprathreshold effective connections was found to increase with age in our pediatric sample. The finding initially appears to run counter to the established literature showing relatively bilateral and extensive representation in the youngest children (e.g., Szaflarski et al., 2006; Kadis et al., 2011). However, we propose that patterns of significant information flux reveal the core components of a network—those regions that are engaged in a consistent coordinated manner and are necessary for function—reflecting the neural strategy used for task completion. We do not expect developmental changes in effective connectivity to track with developmental changes in task-related BOLD signal or oscillatory power distribution. Collectively, the data suggest that young children possess a broadly distributed expressive language network, as evidenced from conventional neuroimaging, with relatively few core (vulnerable) nodes. Relative plasticity for language representation in young children is possible because the broader network lacks established core nodes. With development, the extent of the overall network decreases, while patterns of information flux become entrained. A left lateralized, focal, core expressive language network emerges as part of the normal developmental trajectory, and plasticity is diminished. In the future, we hope to assess the stability of these connectivity patterns through adulthood.
In this study, fMRI data served as a “hard constraint” on subsequent MEG effective connectivity analyses. By applying an activation map that was established through large-scale investigation, we unambiguously focus on brain regions known to undergo task-related hemodynamic changes during verb generation in children. Parcellation of the fMRI activation map serves to reduce the number of comparisons needed to characterize information flux. We preferred a multimodal approach over unimodal MEG, since methods used to identify language cortex in fMRI have been relatively well established and the extent of cortex involved is easily interpreted from an activation map. In contrast, the choice of source localization approach in MEG will impact ensuing functional maps and most attempts to solve the inverse solution produce localizations that are difficult to interpret in terms of extent (e.g., equivalent current dipole analysis, beamforming).
The tasks used in each imaging modality were highly similar, but not identical. In fMRI, auditory noun stimuli were used; in MEG, pictures of everyday objects were preferred. According to current language models, the auditory or visual stimuli preferentially engage their respective sensory cortices; however, both versions of the task will ultimately require engagement of a broader stimulus modality-independent language network necessary for semantic processing, word retrieval, and articulatory planning related to verb generation (Price, 2012). Since the broad activation map was defined using an auditory fMRI paradigm, and effective connectivity was assessed from MEG data collected using a visual paradigm, the resulting effective connectivity map should reflect only the elements of the expressive language network that are modality nonspecific. In this way, we isolate the language-specific subprocesses involved in verb generation.
In the current analyses, we study information flux occurring between node pairs, without imparting any theoretical or anatomical restrictions on where network edges may be established. The data-driven approach is objective, but could potentially yield connectivity maps that do not reflect the underlying physiological structure of the language network. With the current approach, it is indeed possible to observe significant information flux between two regions that are not directly connected by any known fiber pathway. Furthermore, we limited our analyses to regions shown active in large-scale fMRI analyses; it is possible that nodes residing outside the defined network could also be involved in expressive language processing, particularly in individual subjects. These connections could not be resolved in the current analyses.
It is important to note that the PSI metric requires specification of both time and frequency ranges for computation. In this study, we cropped our data to a time window known to be relevant for verb generation in children (Kadis et al., 2011) and restricted analyses to within canonical frequency bands. Had we assessed phase slope across the broadband data, we would have failed to capture the changing direction of information flux among left frontal nodes and missed the changing patterns of connectivity that occur across the spectra. The choice of temporal and spectral window is not trivial; with additional experience, we anticipate proposing guidelines so researchers can make informed decisions about the parameters used in effective connectivity analyses with PSI and related metrics.
We are currently investigating other methods to integrate fMRI and MEG data, to map core language sites in healthy children and those undergoing investigations for epilepsy surgery. With continued development of multimodal neuroimaging and connectivity analyses, we will gain access to a better understanding of normal language development, plasticity, and representation in the brain.
Footnotes
Acknowledgments
The fMRI data were obtained through support from the National Institute of Child Health and Human Development (R01-HD38578; S.K.H.), and the MEG data were obtained through support from the University of Toronto (D.S.K./M.L.S.). The authors wish to acknowledge Akila Rajagopal and Thomas Maloney for their technical assistance with the study.
Author Disclosure Statement
No competing financial interests exist.
References
Supplementary Material
Please find the following supplemental material available below.
For Open Access articles published under a Creative Commons License, all supplemental material carries the same license as the article it is associated with.
For non-Open Access articles published, all supplemental material carries a non-exclusive license, and permission requests for re-use of supplemental material or any part of supplemental material shall be sent directly to the copyright owner as specified in the copyright notice associated with the article.