
Abstract
Tinnitus is a condition characterized by the perception of auditory phantom sounds. It is known as the result of complex interactions between auditory and nonauditory regions. However, previous structural imaging studies on tinnitus patients showed evidence of significant white matter changes caused by hearing loss that are positively correlated with aging. Current study focused on which aspects of tinnitus pathologies affect the white matter integrity the most. We used the diffusion tensor imaging technique to acquire images that have higher contrast in brain white matter to analyze how white matter is influenced by tinnitus-related factors using voxel-based methods, region of interest analysis, and deterministic tractography. As a result, white matter integrity in chronic tinnitus patients was both directly affected by age and also mediated by the hearing loss. The most important changes in white matter regions were found bilaterally in the anterior corona radiata, anterior corpus callosum, and bilateral sagittal strata. In the tractography analysis, the white matter integrity values in tracts of right parahippocampus were correlated with the subjective tinnitus loudness.
Introduction
The pathological characteristics of tinnitus, an auditory phantom perception (Jastreboff, 1990), are related to sensorineural trauma (Kreuzer et al., 2014), presbycusis, or noise exposure (Eggermont and Roberts, 2004). Although targeting the peripheral auditory nervous system as a treatment with hearing aids and maskers is sometimes successful (Hoare et al., 2011; Hobson et al., 2010; Moffat et al., 2009), more recent treatments focusing on the central nervous system using neuromodulation techniques seem to be promising (De Ridder et al., 2015; Folmer et al., 2015; Noreña and Farley, 2013). More studies indicate that tinnitus is the result of maladaptive plasticity, which involves a complex interaction among auditory pathways (Møller, 2007), auditory memory (De Ridder et al., 2011, 2006), the salience network (De Ridder et al., 2011), limbic structures (Leaver et al., 2011), and prefrontal cortex (PFC) (Faber et al., 2011; Vanneste et al., 2010, 2013). This has led to the concept of tinnitus as an emergent property of multiple parallel overlapping and interacting networks (De Ridder et al., 2014). Therefore, it has become important to identify possible tinnitus-related disruptions on a network scale, both functionally (Maudoux et al., 2012; Schlee et al., 2008, 2009; Vanneste et al., 2011) and structurally (Crippa et al., 2010; Husain et al., 2011).
Tinnitus sufferers seem to have disrupted white matter integrity in tracts involving connectivity of the PFC, temporal lobe, thalamus, and limbic system (Aldhafeeri et al., 2012). The white matter changes seem to be asymmetric and lateralized predominantly to left anterior thalamic radiations and the superior and inferior longitudinal fasciculus (Benson et al., 2014). However, it has been shown that the white matter integrity correlates more with hearing loss than the tinnitus per se (Husain et al., 2011), and similar results were found for gray matter changes in tinnitus patients (Vanneste et al., 2015). As hearing loss and aging are highly correlated (Huang and Tang, 2010), this might influence the interpretation of white matter changes in tinnitus even more, and it remains theoretically possible that tinnitus is a symptom related to functional connectivity changes rather than structural changes.
The aim of this study is to identify the changes in white matter integrity in tinnitus patients and analyze the influence of tinnitus-related factors (i.e., age, tinnitus duration, tinnitus distress, subjective loudness, and hearing loss). A voxel-based correlation analysis with these factors was initially performed, followed by an analysis of more specific bundles of white matter fibers using the standard atlas (JHU-ICBM;
Materials and Methods
Subjects
Forty-one chronic tinnitus outpatients were recruited from the multidisciplinary Tinnitus Research Initiative Clinic of the University Hospital of Antwerp, Belgium. Individuals with pulsatile tinnitus, Ménière's disease, otosclerosis, chronic headache, and neurological disorders such as brain tumors and individuals being treated for mental disorders were excluded to control for underlying confounding factors within the disease. In addition, patients with multiple perceptions (e.g., both a pure-tone and narrow-band noise tinnitus) or with a broadband perception were not included in the study. According to the Declaration of Helsinki 2000, all subjects were informed about the purpose and the procedure of the study and agreed to give the written form of consent. The demographic features and the clinical features of tinnitus and the average hearing loss level measured by the audiogram are shown in Table 1.
Demographic and Clinical Characteristics of the Subjects (Mean ± SD)
LOUD, subjective loudness level represented by numeric rating scale (NRS); TQ, tinnitus questionnaire; N/A, not applicable.
Audiological and behavioral assessments
Patients were asked to report their perceived location of the tinnitus (unilateral or bilateral) and tinnitus duration, as well the tinnitus tone (pure-tone-like tinnitus or noise-like tinnitus). In addition, all patients were screened for the extent of hearing loss using pure-tone audiometry using the British Society of Audiology procedures at 0.125, 0.25, 0.5, 1, 2, 3, 4, 6, and 8 kHz (Audiology, 2008). The hearing threshold in dB was measured separately in both ears and the hearing loss level for each individual was calculated as the average of the thresholds of two sides and each tested frequency.
Tinnitus patients were tested for the tinnitus frequency and the loudness level by audiometric tinnitus matching analysis. In unilateral tinnitus patients, the tinnitus analysis was performed on the other side of the ear perceiving the tinnitus. For the bilateral tinnitus patients, the matching analysis was performed on the other side of the ear with the worse tinnitus symptoms. Depending on whether the patient perceives a pure-tone or narrow-band noise, a 1 kHz pure-tone or a narrow-band noise centered at 1 kHz ±1/3 octave was presented contralateral to the worse tinnitus ear at the loudness of 10 dB above the patient's hearing threshold in that ear. The pitch was adjusted until the patient notified the audiologist that the sound most likely resembles his/her tinnitus tone. The loudness of this tone was also matched to the patient's in the same method. The tinnitus loudness (dB SL) was computed by subtracting the absolute tinnitus loudness (dB HL) with the auditory threshold at that frequency (Meeus et al., 2010, 2011).
A numeric rating scale (NRS) for the subjective loudness level of tinnitus tone (“How loud is your tinnitus?” 0 = no tinnitus and 10 = as loud as imaginable) was assessed with the verified Dutch translation of the tinnitus questionnaire (TQ) validated by Meeus and associates (2007), which measures the distress level associated with the tinnitus. This well-established measure for the assessment of a broad spectrum of tinnitus-related psychological complaints consists of 52 items, testing for the emotional and cognitive distress, intrusiveness, auditory perceptual difficulties, sleep disturbances, and somatic complaints (Hiller and Goebel, 1992; McCombe et al., 2001). A 3-point scale is given for all items, ranging from true (2 points) to partly true (1 point) and not true (0 points). The total score (from 0 to 84) was computed according to standard criteria published in previous studies (Hiller and Goebel, 1992; Hiller et al., 1994; Meeus et al., 2007).
Image acquisition (diffusion tensor image protocol)
All diffusion tensor image (DTI) data sets were acquired at 3 T (Magneton Trio Tim, Siemens AG; Siemens Medical Solutions, Erlangen, Germany). A 32-channel head coil was used to obtain 40 axial slices using a single-shot echo planar imaging sequence. The resulting images had an isotropic resolution of 2.2 mm and a field of view (FOV) of 220 × 220 mm2. Repetition time and echo time of the DTI acquisition were 7700 and 139 msec, respectively. Different diffusion sensitizing gradients were applied along noncollinear directions: 25 volumes with b = 700 sec/mm2 and 40 volumes with b = 1000 sec/mm2. In addition, 10 nondiffusion-weighted images (b = 0 sec/mm2) were acquired. The sequence took 14.5 min in total to acquire. We corrected the data sets for subject motion and eddy current-induced geometric distortions (Leemans and Jones, 2009) and a robust nonlinear diffusion tensor estimation approach (RESTORE method) was applied (Chang et al., 2005).
Image preprocessing
Raw diffusion images were masked using the Brain Extraction Tool from the Brain Analysis Toolbox in the FMRIB Software Library (FSL; FMRIB, University of Oxford, Oxford, United Kingdom). By using the masked and corrected diffusion image volumes as inputs, the scalar map of fractional anisotropy (FA) was extracted by applying the FMRIB DTIFIT tool. Images were preprocessed and nonlinearly registered onto FMRIB58_FA with the all-subjects-to-all-subjects option. The mean images were created according to MNI152 (Montreal Neurological Institute, McGill University, Quebec, Canada) standard space (1 × 1 × 1 mm3). Each image was examined for possible artifacts caused during data acquisition before proceeding with further processing.
The qualities of the magnetic resonance (MR) images and cortical surface were inspected manually. Images that did not meet the suitable qualities of T1-weighted MR images and cortical surfaces were excluded from the analyses. The main reasons for excluding patients were (1) inadequate size of the FOV, (2) signs of white matter lesions visible on B0-weighted diffusion images, (3) corrupted FA map of individual spaces, and (4) the presence of any motion artifacts.
Voxel-based analysis
All the postprocessing analyses were performed by using Tract-Based Spatial Statistics of FSL (Jenkinson et al., 2012; Smith et al., 2004; Woolrich et al., 2009). Correlation analysis of diffusion images was performed on voxel-by-voxel basis using skeletonized images of the mean FA. Linear regression models for age, duration of the disease, chronic stress level by tinnitus (TQ), subjective loudness level of tinnitus tone NRS, and the average level of hearing loss were created. A family-wise error rate in multiple comparisons was corrected on the space signal, which is enhanced without clustering or thresholding with threshold-free cluster enhancement (TFCE) (Smith and Nichols, 2009). The threshold probability value for the significance of group differences was set as familywise error (FWE)-corrected p < 0.05. The options used for TFCE were the height of the converted signal = 2, extent = 0.5, and neighbor connectivity = 26. Voxel-wise statistics for scores were calculated by using the FSL nonparametric permutation test method with 5000 permutations (Randomize) (Winkler et al., 2014).
Region of interest-based analyses
Statistical analyses on the main effect of tinnitus-related factors on the white matter integrity were performed using the predefined clusters of regions of interest (ROIs) using Johns Hopkins University white matter atlas (JHU-ICBM;
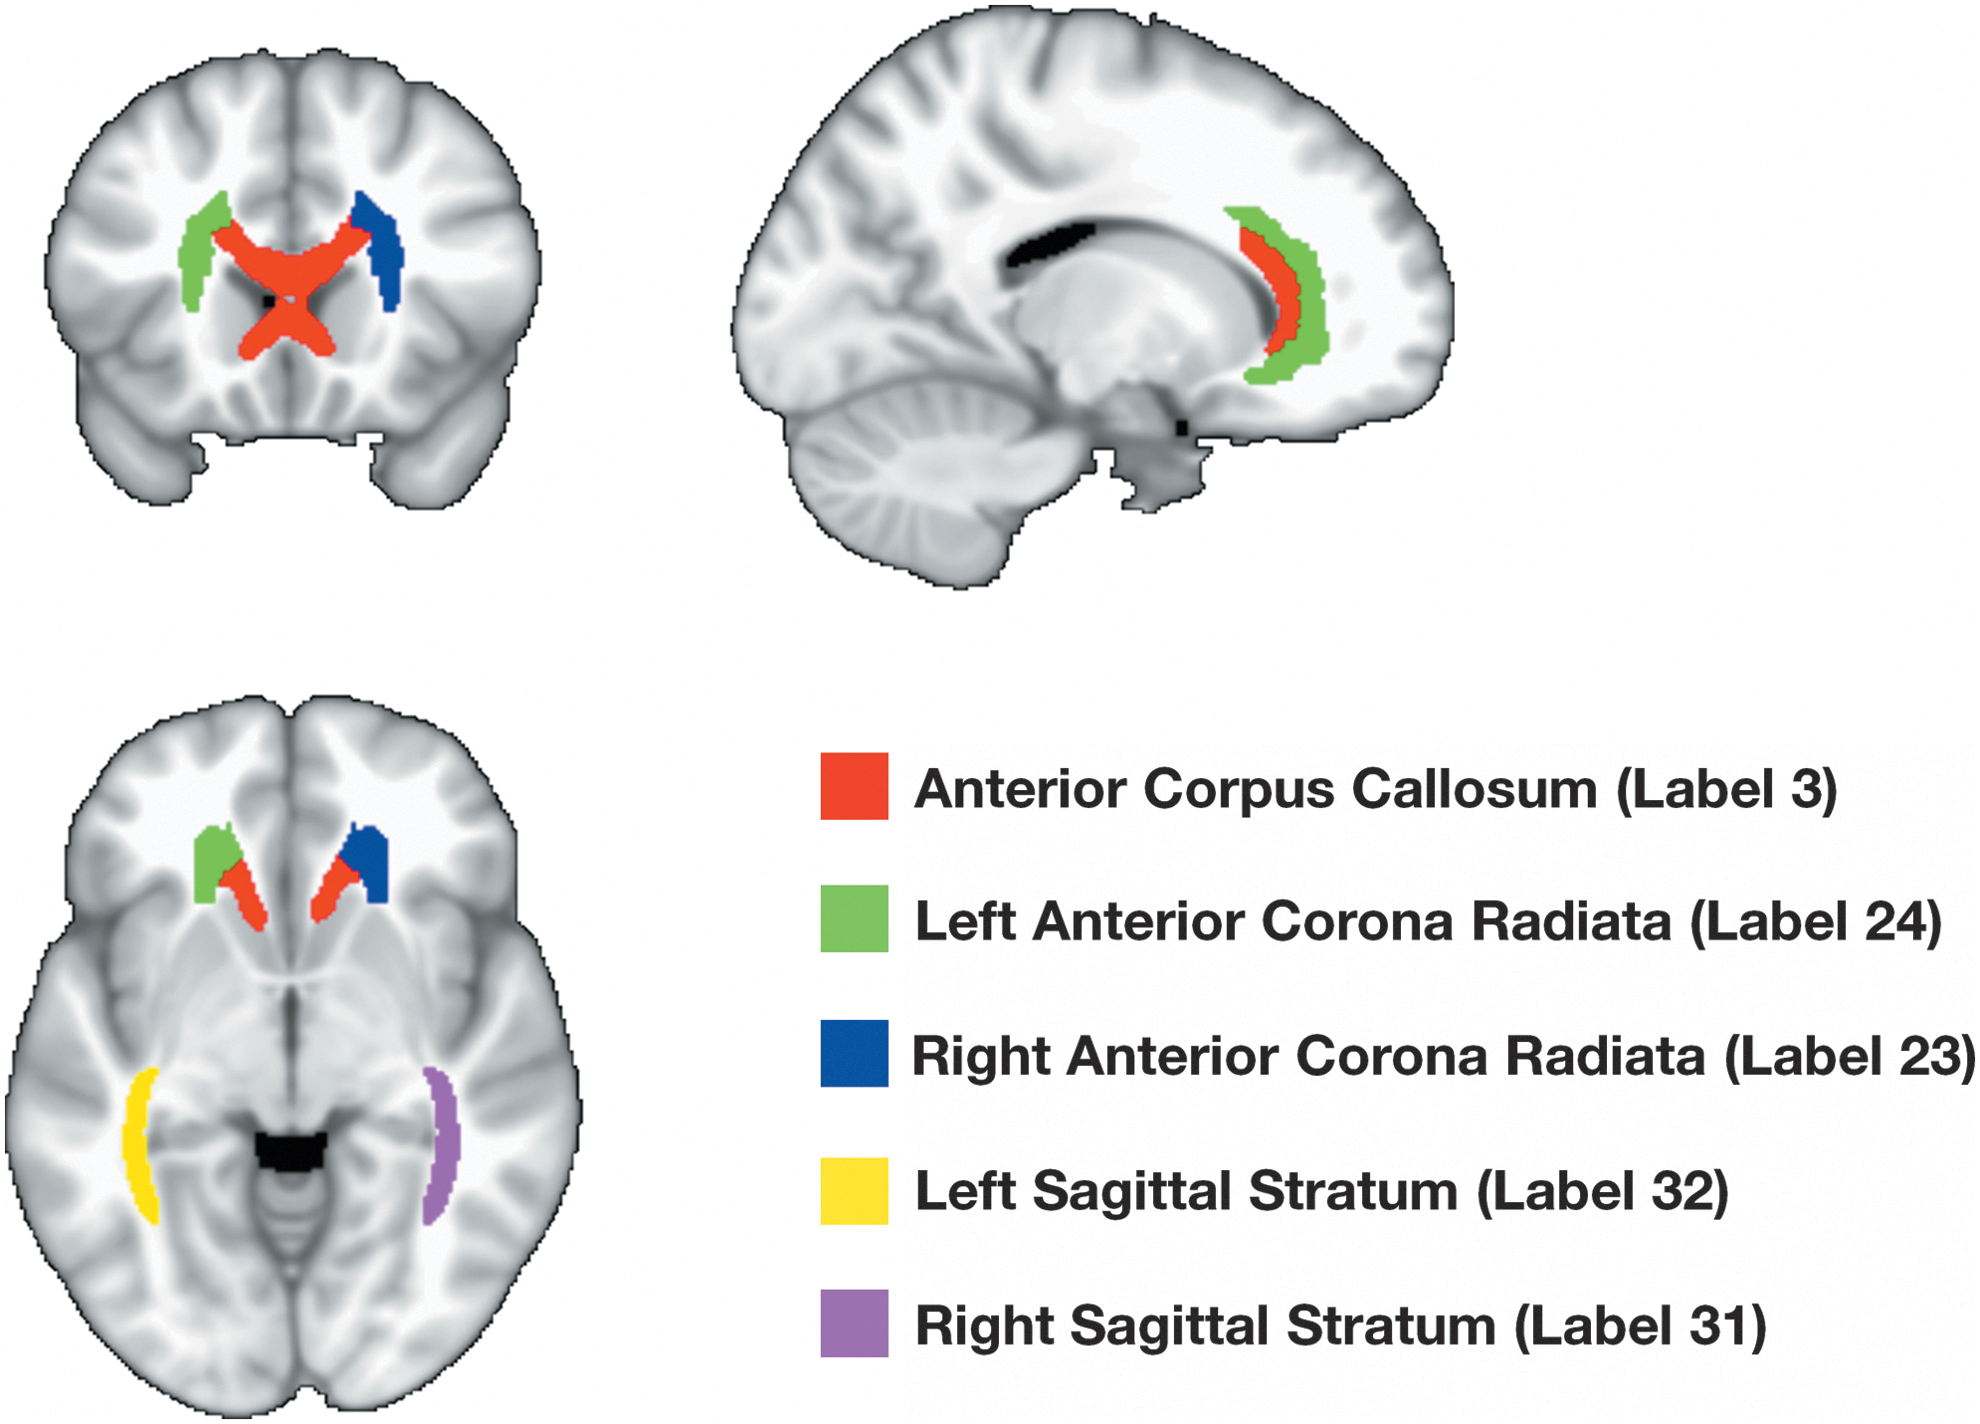
Johns Hopkins University (JHU) labels contributing the most variances (eigenvalues >0.80) in principal components analysis. Color images available online at
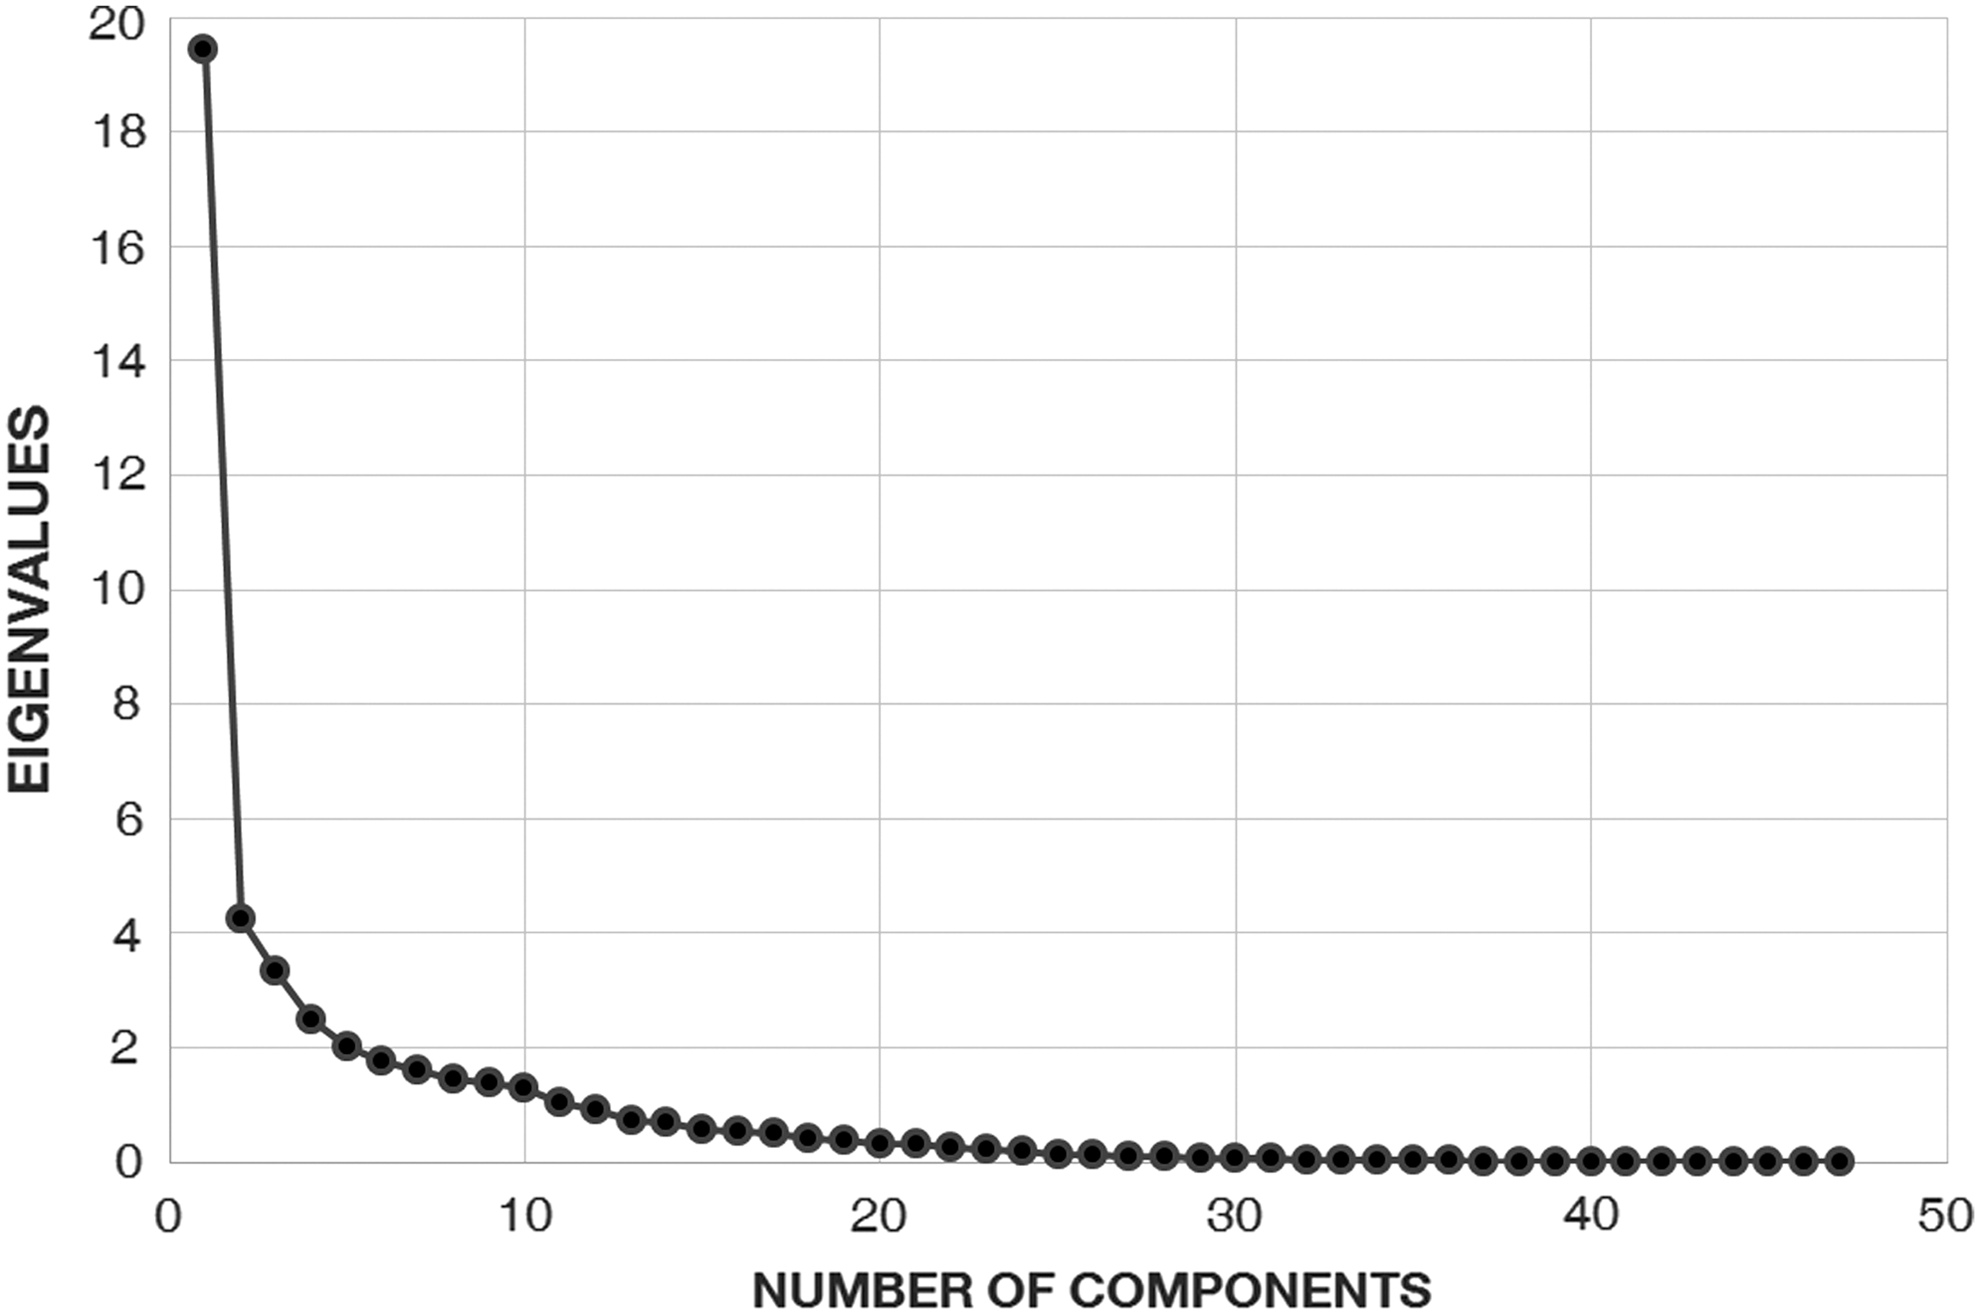
The scree test plot showing the distribution of eigenvalues of fractional anisotropy (FA) principal components.
Rotations of Each Label of White Matter (Fractional Anisotropy) and the Pattern Matrix
Eigenvalues larger than 0.80 for each component.
Extraction method: principal component analysis.
Rotation method: Varimax with Kaiser normalization.
Rotation converged in six iterations.
FA, fractional anisotropy.
Pearson's Bivariate Correlations of Major Tinnitus-Related Factors and Principal Components (Correlation Coefficients)
p < 0.01, * p < 0.05.
COMP, component; DUR, duration of tinnitus; HL, averaged hearing loss (dB SPL).
To understand how subgroups of tinnitus patients are categorized by the principal components representing different regional white matter integrity, a k-means clustering method, which minimizes the within-cluster sum of squares, was applied on the individuals using the most representative labels of the extracted principal components. Internal consistency or the reliability of each clustering variable in the different components was validated using Cronbach's alpha (higher than 0.80). A multivariate analysis of variance on the tinnitus-related measures (Table 4) using the k-means cluster as the between-subjects variable was further applied to analyze how the different dependent variables are distributed between the clusters of chronic tinnitus patients. Among the white matter labels, the 48th label was not counted since its averaged regional FA values were 10−2 times smaller than the values from other labels (average FA = 1.12 × 10⁻³).
Multivariate Analysis of Tinnitus-Related Measures with k-Means Clusters
Mean ± SD values are shown for each cluster of tinnitus patients.
Label 3, anterior corpus callosum; label 23, right anterior corona radiata; label 24, left anterior corona radiata; label 31, right sagittal stratum; label 32, left sagittal stratum.
Deterministic tractography
All of the diffusion-weighted images were linearly corrected for distortions by the eddy current with FSL (FMRIB) and the processing of diffusion images was performed using DSI Studio (
To enhance the angular resolution of ODF and better resolve the directions of crossing fibers, we applied the diffusion decomposition method (Yeh et al., 2013). The deterministic tractography, using the streamline Euler approach (Yeh et al., 2013), was applied and the tracts were mapped from the whole-brain seeds to pass through the selected regions of interest. We have used ROIs linearly transformed from standard MNI space to individual diffusion image spaces using FSL FLIRT (Jenkinson et al., 2002). The selected ROIs were bilateral primary auditory cortices, dorsolateral prefrontal cortices, (para)hippocampus, and anterior cingulate cortices (ACCs) (Maldjian et al., 2003) (Fig. 3).

Regions of interest in deterministic tractography. Color images available online at
In the implementation of deterministic tracking, the threshold QA values of each tract were defined as 0.60 * Otsu's threshold that automatically classifies regions within and out of the tract (Otsu, 1975); and the direction of the tract was determined after nearest-neighbor interpolation to the nearby voxels was applied. The propagation step was 62 mm long, and the tracking was continued until it reached the angular threshold of 60°, within the range of length of maximum 300 mm, minimum 10 mm, and total 5000 seeds were placed (Fig. 4).

Examples of fiber tracts mapped from bilateral primary auditory cortex (Brodmann area [BA] 41). Color images available online at
Results
Voxel-based analysis of correlation on whole-brain FA maps
The correlation analysis on the age, chronic stress level represented as TQ score, subjective loudness level as NRS, and the average level of hearing loss revealed that there is a significant negative correlation of age and hearing loss to the FA values in widespread nonspecific regions (multiple corrected p < 0.05), while the others were not statistically significant (Fig. 5). Some of the regions highlighted by the correlation to age were anterior corpus callosum, fornix, bilateral internal capsulae, and projections from bilateral temporal lobes; significantly correlated regions to hearing loss were similar to those found in correlation analysis to age. To find the most important regions that drive the structural changes by age and hearing loss within the patients, ROI-based analysis was performed and the regionally averaged values from labels of JHU-ICBM atlases were found.
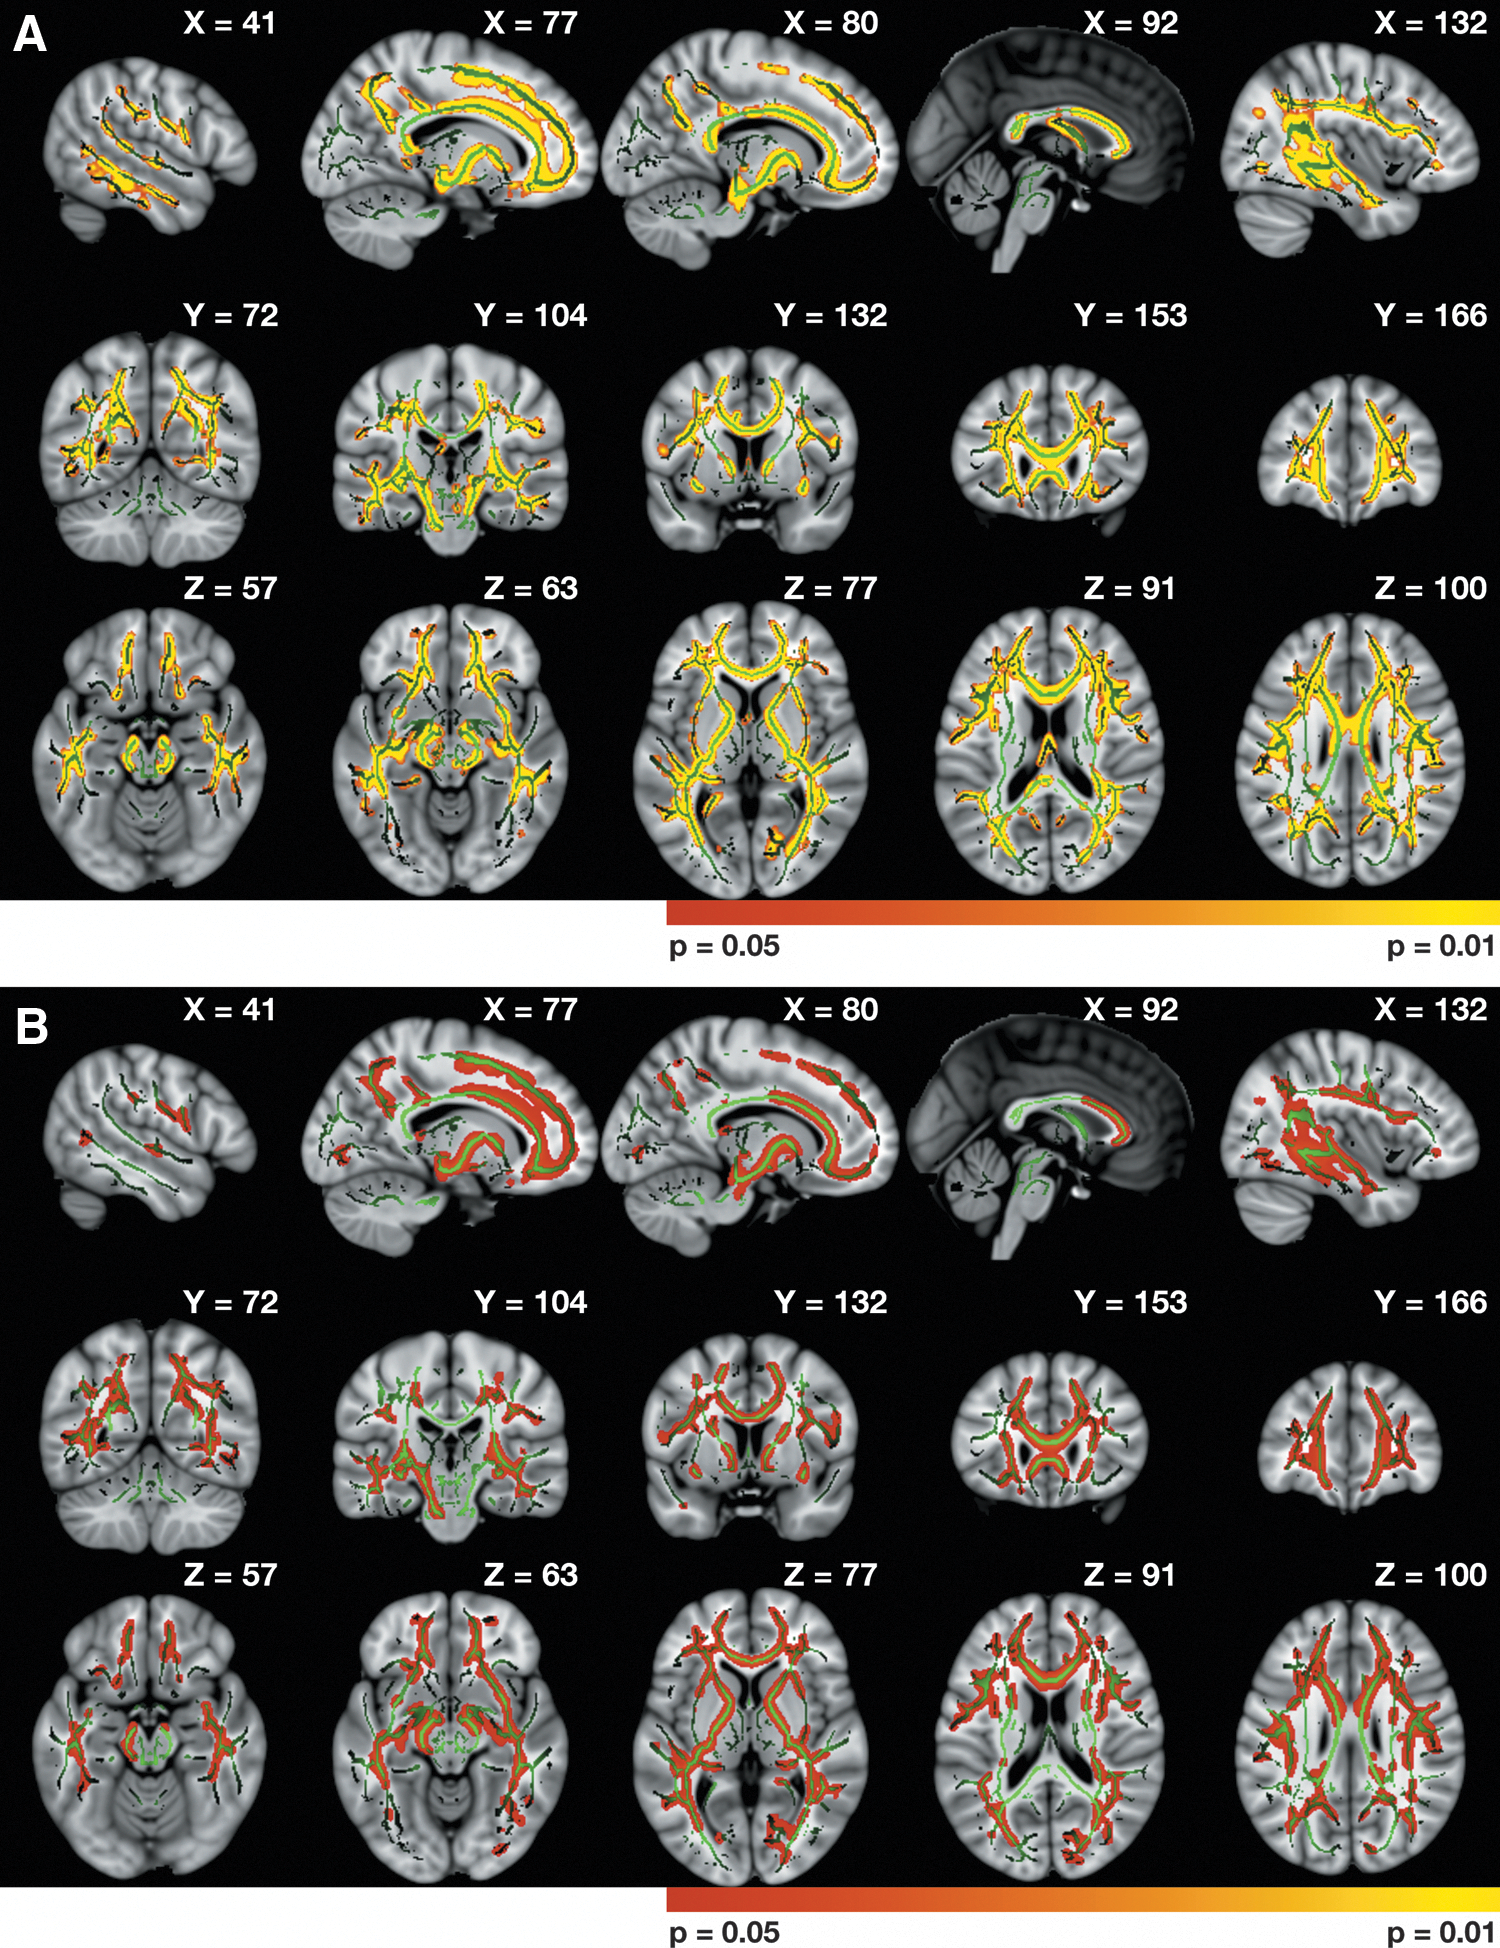
Whole-brain analysis results on the FA values of each voxel correlated with tinnitus-related measures (multiple corrected p < 0.05).
Analysis of mediation effect on predefined ROIs
Bivariate correlation analysis revealed that age is as positively correlated with the duration of the disease and the level of hearing loss, as duration also is to hearing loss, and TQ score is positively correlated with the subjective loudness level (NRS; Table 3).
Using the principal component analysis with Varimax rotation, three major components consisting of regionally averaged FA values were extracted on the scree plot (Fig. 2). Three components of FA ROIs explained 57.48% of total variance. Among the three components, the first component was significantly correlated with age and hearing loss, as found in the voxel-based analysis (Table 3). The most contributing labels (eigenvalues >0.8) in JHU-ICBM atlas included bilateral anterior corona radiata, anterior corpus callosum, and bilateral sagittal striata in the FA components (Fig. 3).
Among the components, only those linearly correlated with either age or the average hearing loss were used in the mediation analysis. The hypothesis test of the mediation model shown in Fig. 6 was tested using FA COMP1 with Sobel's test. The linear regression of the putative mediator average hearing loss using age as the independent variable showed that there is a significant indirect effect of age on average hearing loss (R 2 [90% CI] = 0.32 [0.13, 0.52], p < 0.01, B [95% CI] = 0.04 [0.02, 0.06], SE = 0.57). As the bivariate correlation analysis indicated the significant linear relationship of the duration with age and hearing loss, the mediation analysis performed on the model using duration as the mediator of age and white matter changes found a significant result (two-sided, p = 0.07). Results of significance included a significant mediation effect of hearing loss (indirect effect; B [95% CI] = −0.03 [−0.05, −0.02], SE = 0.01, p < 0.01) between age (direct effect; B [95% CI] = −0.04 [−0.06, −0.02], SE = 0.01, p < 0.01) and white matter changes of FA in the labels listed above (two-sided Sobel's test, p < 0.01). The direct and indirect effects of age and hearing loss on FA were significantly negative.
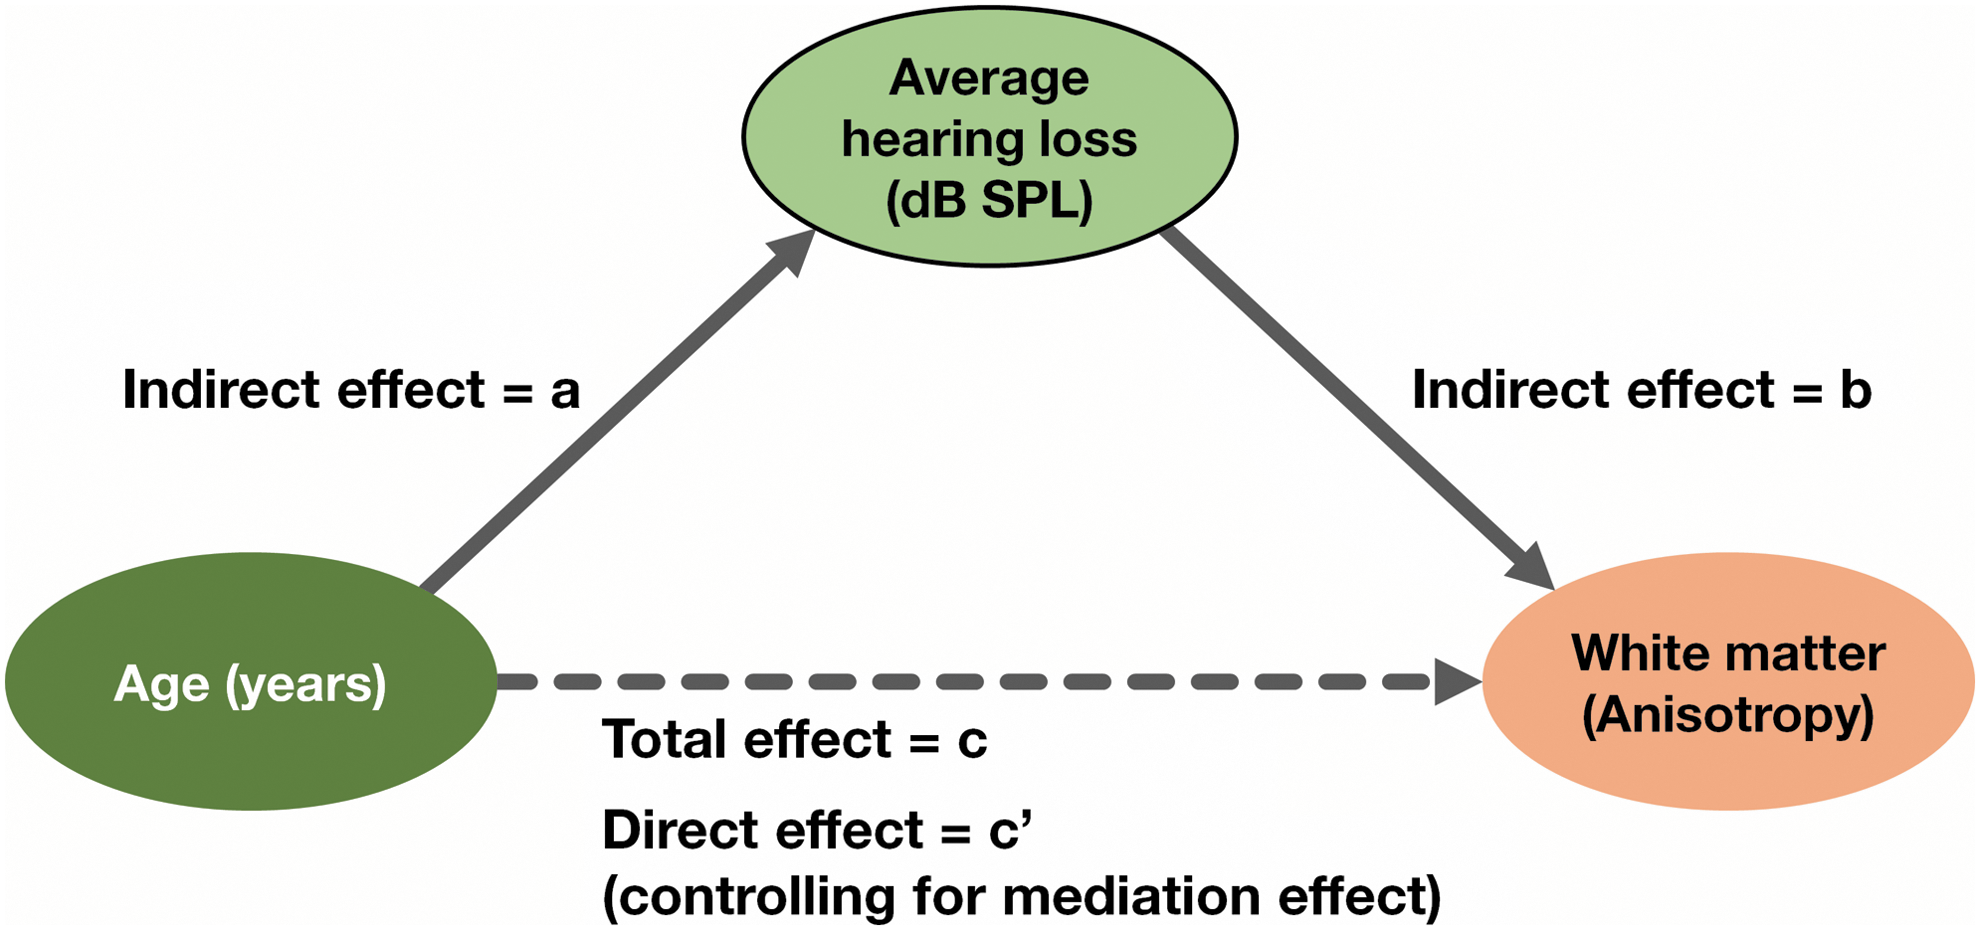
The mediation model representing the direct and indirect effects of age and hearing loss on white matter changes. Color images available online at
k-Means clustering
The cluster analysis using the labels of white matter atlas that contributed the most to the first principal component as dependent variables has classified two clusters in two iterations (Table 4). Multivariate linear analysis of variance shows that clusters classified by FA COMP1 statistically significantly accounted for the variance of the five chosen measures (p < 0.05). The measures of age, duration, and hearing loss level were found to be significantly different between two clusters divided by FA COMP1; however, tinnitus-related symptoms were not (Table 5). The first cluster included younger patients with a lower level of hearing loss than the second level. The larger effect size of hearing loss is consistent with the mediation results showing that the effect of age is mediated by the hearing loss. Therefore, the k-means clusters using the principal components of white matter integrity successfully distinguish the two subtypes of chronic tinnitus patients with the older age and the higher level of hearing loss, which show lower integrity of white matter fibers.
Multivariate Analysis of Tinnitus-Related Measures with k-Means Clusters
Mean ± SD values are shown for each cluster of tinnitus patients. Unbiased ω 2 is the population estimate of the dependent variance accounted for the independent variance.
p < 0.01, * p < 0.05.
Tractography
During the process of tracking, one of the images showed abnormal registration and was discarded (n = 40 total). The average GFA, QA, and ISO values were extracted for each population of fiber tracts to be bivariately correlated with the tinnitus-related measures. The results showed that the age was significantly negatively correlated with the QA values of regional tracts in each region of interest; and the age, duration of the disorder, and hearing loss were negatively correlated with the GFA values of tracts passing through bilateral primary auditory cortex (AI), dorsolateral prefrontal cortex (DLPFC), and ACC (Table 6). This tendency was the opposite in the direction for the ISO values. Assuming equal variance (Levene's test, p > 0.05), it was also found that QA values of bilateral DLPFC tracts were significantly different between two clusters (two-sided independent t-test).
Bivariate Correlations of Major Tinnitus-Related Factors and Tractography Measures (n = 40)
p < 0.01, * p < 0.05.
ACC, anterior cingulate cortex; AI, primary auditory cortex (Brodmann area [BA] 41); DLPFC, dorsolateral prefrontal cortex (BA 46); GFA, generalized fractional anisotropy; ISO, isotropic component of orientation distribution function; QA, quantitative anisotropy.
The tinnitus-related measures were bivariately correlated with each tract population measure within the separate clusters divided by principal components of regional FA values (Table 7). Results have shown that while GFA values of bilateral DLPFC and ACC were significantly negatively correlated with age within cluster 1, such tendency was not found in the second cluster. The ISO values were positively correlated with patients' age in right AI and DLPFC within cluster 1 and negatively correlated with TQ score in bilateral ACC within cluster 2. However, there were no differences in QA values found when the correlations were analyzed within either of the clusters.
Bivariate Correlations of Tinnitus-Related Measures and Tractography Measures Within Each Cluster
p < 0.01, * p < 0.05.
Discussion
The principal component analysis of the clinical data demonstrates that age is strongly correlated with hearing loss and tinnitus duration and that tinnitus duration is related to hearing loss. The subjectively perceived tinnitus loudness correlates with tinnitus distress, but not with age and hearing loss. The correlation between subjectively perceived tinnitus loudness and distress has been shown before (Song et al., 2015; Wallhäußer-Franke et al., 2012), as has age and hearing loss, which is of course characteristic of age-related hearing loss, also known as presbycusis.
The white matter integrity of chronic tinnitus patients was measured using three methods: (1) a voxel-based correlation analysis of the patients with tinnitus-related factors, (2) a calculation of regional averaged FA values based on the JHU atlas, and (3) a deterministic tractography analysis and the comparison of the values extracted from each fiber tract.
The voxel-based analysis has shown a widespread negative correlation of FA values to age and average hearing loss (Fig. 5), especially in anterior corpus callosum, projections from bilateral prefrontal regions, and temporal lobe regions.
In the factor analysis using the regionally averaged FA values, there was a significant negative mediation effect of hearing loss that is not included in the direct effect of the age on the changes in the first principal component of FA values within the chronic tinnitus patients. In the first component extracted by the factor analysis, most of this mediation effect resided in the variances of the FA values of anterior corpus callosum (label 3), bilateral anterior corona radiata (labels 23, 24), and sagittal strata (labels 31, 32). Thus, aging seems to result in hearing loss, which then results in white matter changes.
The voxel-based analysis of correlation on whole-brain FA maps demonstrates that age and hearing loss are related to widespread white matter changes, which largely overlap, suggesting that the clinical correlation between age and hearing loss is reflected in the overlapping structural white matter changes.
However, using the JHU atlas, two distinct clusters of tinnitus patients can be distinguished based on age, tinnitus duration, and hearing loss (Table 5). There is a group of younger tinnitus patients with short-term tinnitus without obvious hearing loss (<20 dB), which is clearly different from a group of older patients with long-standing tinnitus associated with hearing loss.
These separable tinnitus groups can be further analyzed by looking at tractography and different measures (QA, GFA, ISO) of the fiber populations of the studied tracts. The QA values represent the anisotropy or the directionality of each fiber accounting for each population of tracts and are more robust against the partial volume effects due to multiple crossing fibers (Yeh et al., 2013). There were no group differences of anisotropy level in the fiber population (QA) passing through bilateral primary AI, ACC, parahippocampus, and DLPFC (Table 6), suggesting that the level of structural degeneration related to the sensory processing and modulation does not statistically differ between two tinnitus groups. On the other hand, the correlation analysis does reveal that white matter integrity decreases with age (QA values) in bilateral AI, DLPFC, and ACC. In addition, the subjective loudness level of tinnitus was negatively correlated with the integrity of the right parahippocampal region (Brodmann area [BA] 28). Interestingly, the same region had no correlations to the age (Table 6), analogous to what is found in the clinical data. When looking at correlations between QA values and tinnitus-related clinical factors within each of the two groups, the right parahippocampal integrity correlated with the subjectively perceived tinnitus loudness only in the younger group without noticeable hearing loss.
The voxel-wise GFA values not only confirm the QA changes related to age but also demonstrated tinnitus duration and hearing loss-related changes in white matter integrity, and the white matter changes were significantly different between the two tinnitus groups for the AI, DLPFC, and ACC bilaterally, but not for the parahippocampal area. The subjectively perceived tinnitus loudness does correlate with white matter integrity in the primary auditory area, but only for the older group with long-standing tinnitus and hearing loss. For the younger group, white matter integrity in bilateral ACC and DLPFC correlates with age.
The ISO measure also confirms the age-related white matter changes, noted in the QA and GFA analysis, demonstrating the robustness of this finding. It furthermore confirms that some white matter changes are related to the tinnitus duration, which in itself is clinically correlated with age. Within the young tinnitus group without hearing loss, distress seems to be related to white matter changes in the right primary auditory area and DLPFC, but not so in the older group with hearing loss.
As the different tractography measures reveal some robust findings and some different measures, it is most prudent to make claims about the convergent data. This suggests that tinnitus is not directly related to any white matter changes, but most likely reflects a functional change rather than a structural change. The structural changes seem to be hearing loss related and this in turn is determined by age, which also influences the tinnitus duration.
Conclusion
This DTI study shows that tinnitus is likely not related to any robust white matter changes, with the possible exception of right parahippocampal integrity decrease in a group of young patients without hearing loss. The white matter changes seen in tinnitus patients can be explained by the hearing loss, which is largely determined by age.
Footnotes
Author Disclosure Statement
No competing financial interests exist.