
Abstract
Structural connectivity in the brain is the basis of functional connectivity. Quantitatively linking the two, however, remains a challenge. For a pair of regions of interest (ROIs), anatomical connections derived from diffusion-weighted imaging are often quantified by fractional anisotropy (FA) or edge weight, whereas functional connections, derived from resting-state functional magnetic resonance imaging, can be characterized by non-time-series measures such as zero-lag cross correlation and partial correlation, as well as by time-series measures such as coherence and Granger causality. In this study, we addressed the question of linking structural connectivity and functional connectivity quantitatively by considering two pairs of ROIs, one from the default mode network (DMN) and the other from the central executive network (CEN), using two different data sets. Selecting (1) posterior cingulate cortex and medial prefrontal cortex of the DMN as the first pair of ROIs and (2) left dorsal lateral prefrontal cortex and left inferior parietal lobule of the CEN as the second pair of ROIs, we show that (1) zero-lag cross correlation, partial correlation, and pairwise Granger causality were not significantly correlated with either mean FA or edge weight and (2) conditional Granger causality (CGC) was significantly correlated with edge weight but not with mean FA. These results suggest that (1) edge weight may be a more appropriate measure to quantify the strength of the anatomical connection between ROIs and (2) CGC, which statistically removes common input and the indirect influences between a given ROI pair, may be a more appropriate measure to quantify the strength of the functional interaction enabled by the fibers linking the two ROIs.
Introduction
Anatomical connections between brain areas provide the structural basis for functional interactions between these areas. Functional connectivity derived from resting-state functional magnetic resonance imaging (fMRI) is thus expected to be related to structural connectivity derived from diffusion imaging in some way. To date, this problem has been mainly studied qualitatively in humans, which relies on establishing white matter pathways between the nodes of a resting-state network using fiber-tracking techniques (De Luca et al., 2006; Greicius et al., 2009; Toosy et al., 2004; Werring et al., 1998, 1999). Quantitative links between functional connectivity and structural connectivity have received less attention. Van den Heuvel et al., applying partial correlation as a measure of functional connectivity strength and mean fractional anisotropy (FA) as a measure of structural connectivity strength, observed a positive correlation between the mean FA value of the cingulum tract and the partial correlation between posterior cingulate cortex (PCC) and medial prefrontal cortex (mPFC) connected by the cingulum tract (Van den Heuvel et al., 2008). Hagmann et al. (2008) used normalized fiber counting to define a new quantity called edge weight to measure structure connectivity strength and found a positive correlation between edge weight and resting-state fMRI-based cross correlation.
Both cross correlation and partial correlation are non-time-series measures. They exploit the contemporaneous (zero lag) covariance structure of the blood oxygen level dependent (BOLD) signal and ignore the temporal correlation that extends beyond the zero lag. Resting-state BOLD signals are time series. A hallmark of time series is that activity at the present time can impact activity at a future time. To illustrate the potential inadequacy of applying non-time-series measures to time series, consider randomly shuffling the volume index of a resting-state recording. Despite a qualitatively different appearance compared to the original data, the shuffled data have the same cross correlation and partial correlation as the original data (Wen et al., 2012a). Time-series-based measures such as coherence (Curtis et al., 2005), total interdependence (Wen et al., 2012a), and Granger causality (Granger, 1969; Wen et al., 2012b) take into account the temporal dependence beyond the zero lag and are increasingly applied to characterize the functional interactions of neural data. The use of time-series-based measures of functional connectivity is hypothesized to have a positive impact on establishing the quantitative links between functional connectivity and structural connectivity.
Diffusion imaging-based tractography (Le Bihan et al., 2001) enables noninvasive construction of the white matter fiber pathways (Mori and van Zijl, 2002). The direct fiber connections between two brain regions can be quantified in a number of ways, including mean FA (Beaulieu, 2002), mean diffusivity, fiber count (Damoiseaux and Greicius, 2009), and edge weight (Hagmann et al., 2008). Although mean FA has been used widely to characterize structural connectivity, it is not a proper measure of the strength of anatomical connectivity between the two brain areas, mainly because mean FA ignores the number of fibers between the regions of interest (ROIs) and the length of the fibers. Both fiber length and fiber counts are important structural characteristics that can impact synaptic transmission (Honey et al., 2009; Lim et al., 2013; Lo et al., 2010; Van den Heuvel and Sporns, 2011) and thereby functional interactions (Hermundstad et al., 2013). Edge weight, in contrast, by taking into account seed ROIs size, the number of fibers, and the length of fibers, overcomes the drawbacks of mean FA and is potentially a more appropriate measure of structural connectivity strength between the two brain areas.
In this study, we address the issue of quantitatively linking structural connectivity and functional connectivity by analyzing two data sets of diffusion and resting-state functional imaging. Selecting mPFC–PCC from default mode network (DMN) and left dorsal lateral prefrontal cortex (DLPFC)–left inferior parietal lobule (IPL) from central executive network (CEN) as the two pairs of ROIs, cingulum fibers connecting mPFC–PCC and superior longitudinal fasciculus (SLF) fibers connecting left DLPFC–left IPL were constructed and quantified by mean FA and edge weight. Functional connectivity measures including cross correlation, partial correlation, pairwise Granger causality, and conditional Granger causality (CGC) were computed and correlated with mean FA and edge weight. We hypothesize that, among the many possible pairings of functional connectivity and structural connectivity measures, CGC and edge weight offer the best combination to quantitatively link functional connectivity and structural connectivity.
Materials and Methods
Data acquisition
Two data sets were analyzed to test the relationship between functional connectivity and structural connectivity. The first data set was recorded at the University of Florida (UF) by the authors and will be henceforth referred to as the UF data set. The second data set, downloaded from the Functional Connectome 1000 website, was recorded at the Beijing Normal University (BNU) and will henceforth be referred to as the BNU data set. We describe each data set in detail as follows.
UF data set
The experimental protocol was approved by the University of Florida Institutional Review Board. Twelve healthy subjects (five females, seven males, age: 25.4 ± 2.5 years) with no history of neurological diseases or head injury gave written informed consent and participated in the experiment. All subjects were screened for possible risks or contraindications for MRI scanning.
MRI data were acquired on a Philips Achieva 3T MRI scanner. Participants were instructed to keep still during the entire experiment to minimize motion artifacts. During resting-state recording, participants were asked to have their eyes closed but not to fall asleep or focus on any specific thoughts. Resting-state fMRI was recorded for 10 min using a single-shot echo planar imaging (EPI) sequence with the following parameters: field of view = 224 × 224 mm, matrix size = 64 × 64, TR = 2 sec, TE = 30 ms, flip angle = 90°, slice thickness = 3.8 mm; 300 scans, each volume consisted of 36 axial slices. In the same scanning session, diffusion tensor imaging (DTI) images, consisting of 32 weighted (b = 1000 sec/mm2) diffusion scans and 1 unweighted (b = 0 sec/mm2) scan, were recorded using a single-shot spin echo EPI sequence with the following parameters: field of view = 224 × 224 mm, matrix size = 112 × 112, slice thickness = 2 mm; each volume consisted of 66 axial slices. T1-weighted images were recorded in the sagittal direction with the following parameters: field of view = 240 × 240 mm, matrix size = 240 × 240, and slice thickness = 1 mm.
BNU data set
MRI data were acquired from 28 healthy young subjects (14 females, 14 males, age: 24.5 ± 7.52 years) on a SIEMENS MAGNETOM Trio Tim 3T scanner. Resting-state fMRI was recorded for 8 min using a single-shot EPI sequence with the following parameters: field of view = 200 × 200 mm, matrix size = 64 × 64, TR = 2 sec, TE = 30 ms, flip angle = 90°, slice thickness = 3.5 mm; 240 scans, each volume consisted of 33 axial slices. DTI images, consisting of 64 weighted diffusion scans (b = 1000 sec/mm2) and one unweighted diffusion scan (b = 0 sec/mm), were recorded with the following parameters: field of view = 230 × 230 mm, matrix size = 128 × 128, slice thickness = 2.5 mm; each volume consisted of 49 axial slices. T1 MPRAGE images were recorded in the sagittal direction with the following parameters: field of view = 256 × 256 mm, matrix size = 256 × 256, and slice thickness = 1.33 mm. Five subjects were rejected from this data set. Four of them did not have DTI scans and the remaining subject did not have fMRI scans.
FMRI data preprocessing
The same preprocessing and analysis protocol was applied to both UF and BNU data sets and it consisted of the following steps. The first five functional scans were discarded to eliminate transients. The remaining fMRI images were preprocessed using statistical parametric mapping 5 (SPM5) (
Regions of interest selection
Group ICA implemented in the GIFT Toolbox (
Measures of functional connectivity
Resting-state fMRI time series before spatial smoothing were extracted from all the voxels in each spherical ROI and divided by the global mean of each fMRI scan to remove the global effect. The time series were band-pass filtered between 0.01 and 0.1 Hz with a finite impulse response filter. The filtered signals of each spherical ROI were averaged across voxels to yield one signal for each ROI. For mPFC–PCC and left DLPFC–left IPL, the ROIs pairs in this study, the measures used to quantify the strength of functional connectivity include cross correlation, partial correlation, pairwise Granger causality, and CGC.
Let the signals from a pair of ROIs be denoted as
As the covariation between BOLD signals from two ROIs could be due to the common influence from a third ROI, to account for this possibility, we computed partial correlation. To compute the partial correlation between the pair of ROIs, data from all the ROIs within the same network (DMN or CEN) were taken into account. Let
where
Both cross correlation and partial correlation exploit the zero-lag covariance structure of the data. Resting-state BOLD signals, however, are time series, the temporal correlations of which at nonzero lags are not zero. Recent work has pointed out the advantage of applying time-series-based measures to resting-state BOLD data (Wen et al., 2012a). Here, two time-series-based measures were considered: Granger causality (Granger, 1969) and CGC (Chen et al., 2009).
Let
where
where
which is the proportion of causal contribution from yt
to xt
at frequency f. Granger causality in the opposite direction
Similar to the rationale of using partial correlation, one needs to consider CGC to eliminate common influence and activity transmitted along pathways not directly connecting the two ROIs. The mathematical formulation for CGC is rather involved. We refer the reader to our previous publications for more thorough coverage (Chen et al., 2009; Ding et al., 2006). The quantity of interest is again the summation of CGC along opposite directions
Measures of structural connectivity
Preprocessing of diffusion images followed the standard FSL DTI processing pipeline, including three steps of artifact controlling: (1) manual removal of images affected by large artifacts, (2) eddy current correction, and (3) brain extraction to exclude nonbrain areas.
Anatomically, PCC and mPFC are connected through the cingulum bundle, whereas ipsilateral DLPFC and IPL are connected by the SLF. In this study, the cingulum bundle fibers linking mPFC–PCC and SLF fibers linking left DLPFC–left IPL were established using the DTI data by the streamline fiber-tracking method implemented in the software package Diffusion Tensor Visualizer (dTV II) and VOLUME-ONE (
where F(u,v) is the set of fibers connecting ROIs u and v, Su and Sv are the sizes of the two ROIs, f is each individual fiber within F(u,v), and l(f) is the length of fiber f.
It is worth noting that fiber tracking between ROIs is not always successful (Greicius et al., 2009; Van den Heuvel et al., 2009). For the UF data set, fibers linking mPFC and PCC were found in 12 out of 12 subjects, whereas fibers linking left DLPFC and left IPL were found in 11 out of 12 subjects. For right DLPFC and right IPL, however, only 4 out of 12 subjects exhibited fibers linking the two ROIs. For the BNU data set, fiber connections between mPFC and PCC were found in 15 out of 23 subjects and fibers linking left DLPFC–left IPL were found in 11 out of 23 subjects. Similar to the UF data set, fiber tracking between right DLPFC and right IPL was only possible for 9 out of 23 subjects. For this reason, right DLPFC and right IPL were not chosen as an ROI pair for further analysis.
There are multiple reasons for the inability to detect fiber connections for some subjects. First, individual ROIs used for fiber tracking were based on group level ROIs. This approach, although maintaining methodological consistency across subjects, has the shortcoming of not accounting for individual differences in anatomy. Although the use of individually defined ROIs is an alternative, such an approach will necessarily involve subjective interventions and consequently increases the likelihood of methodological inconsistencies across subjects. In addition, little is known about individual differences in the ROIs within resting-state networks. Our approach was adopted based on these considerations and in line with other studies (Van den Heuvel et al., 2009). Second, the fiber tracts connecting two ROIs are not uniformly distributed within each ROI, further highlighting the effects that the individual differences in ROI definitions can have on the successful outcomes of fiber tracking (Van den Heuvel et al., 2009). Third, the deterministic fiber-tracking algorithm is known to have difficulty in reconstructing stable fiber tracts at the point of crossing fibers (Van den Heuvel et al., 2009; Wakana et al., 2004). This may lead to failures in finding fiber tracts in some subjects. Fourth, we used more stringent stopping criteria in our fiber-tracking algorithm, in which fiber tracking was stopped when the fiber touched a voxel with an FA value <0.15 or when it had an angle change between the neighboring eigenvectors of >30°. Stopping criteria adopted in other similar studies are FA <0.1 and angle >45° (Van den Heuvel et al., 2008, 2009). Finally, for the BNU data set, the mPFC is located further away from PCC according to the group level analysis, mainly containing the ventral portion of mPFC, which makes it more difficult to track between PCC and mPFC (Greicius et al., 2009; Supekar et al., 2010; Van den Heuvel et al., 2008, 2009).
Linking functional connectivity and structural connectivity
Each of the four functional connectivity measures, cross correlation, partial correlation, pairwise Granger causality, and CGC, was computed for each subject and plotted against the mean FA and edge weight for the same subject to investigate the correlation between the functional connectivity and structural connectivity measures of mPFC–PCC and of left DLPFC–left IPL. In each data set, DMN and CEN were analyzed separately.
Meta-analysis of the two data sets
In addition to the separate analysis of the UF data set and the BNU data set, a meta-analysis combining the two data sets was also carried out by applying the Liptak–Stouffer Z-score method (Liptak, 1958). The same method has been applied to MRI studies in which MRI data recorded at multisites were combined (Cheng et al., 2015). In this method, correlation p values of structural–functional correlation from each data set were first converted to Z-scores: Zi
= Φ–1 (1 – pi
), where Φ is the standard normal cumulative distribution function. The Liptak–Stouffer Z-score for each functional connectivity and structural connectivity pair was computed according to the following (Liptak, 1958):
where Z is the combined Z-score of individual Z-scores (Zi
) from k different data sets (k = 2 for this work), Zi
is ith data set's Z-score, the weight of ith data set
Results
UF data set
Default mode network
As shown in Figure 1A, key nodes of the DMN, including mPFC, PCC, bilateral AG, and bilateral MTL, were contained in a single ICA component (false discovery rate [FDR] p < 0.001).
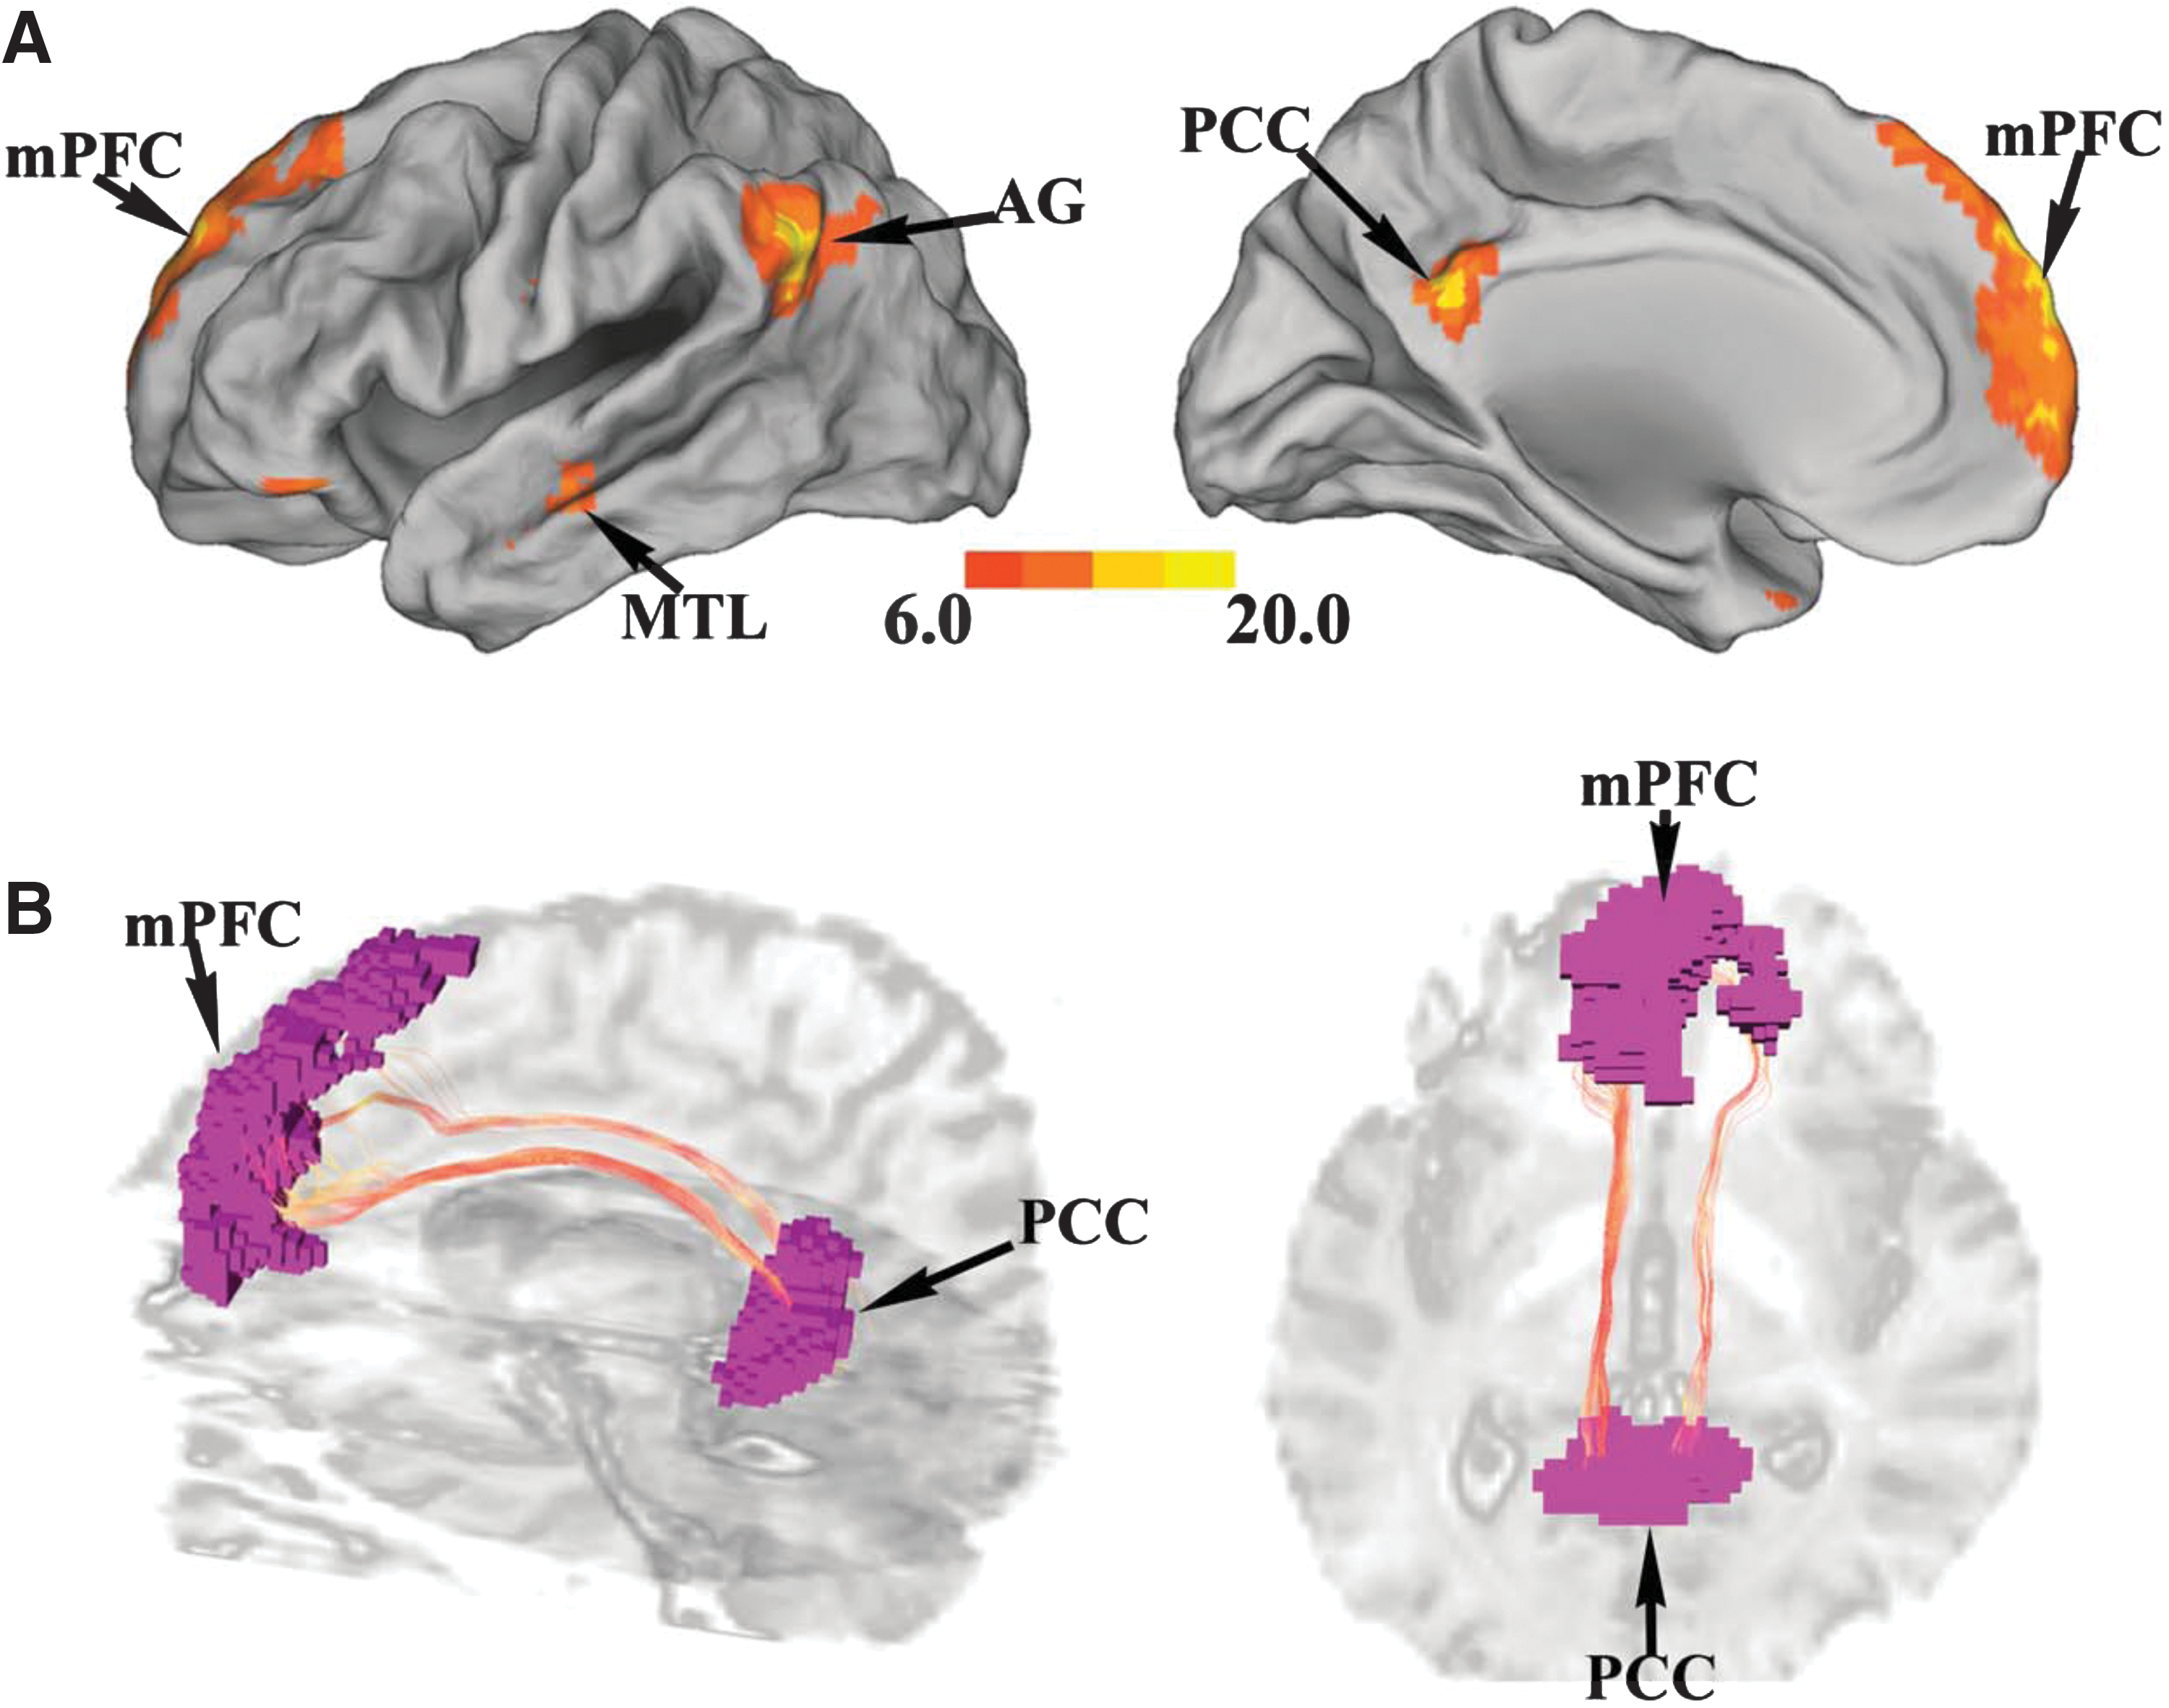
Region of interest (ROI) identification and fiber tracking in default mode network (DMN) (UF data set).
For structural connectivity analysis, the ROIs were coregistered to each subject's first volume of DTI image (b = 0 sec/mm2) by SPM5. Fibers linking mPFC and PCC were then tracked by the streamline fiber-tracking method using VOLUME-ONE and shown for a typical subject in Figure 1B. From these tracked fibers, structural connectivity strength was quantified by mean FA and edge weight for each subject.
To link functional connectivity with structural connectivity, cross correlation, partial correlation, Granger causality, and CGC between mPFC and PCC were evaluated for each subject and plotted against mean FA and edge weight. No significant correlation was observed between all four functional connectivity measures and mean FA. Although no significant correlation was found between cross correlation, partial correlation, Granger causality, and edge weight, there is a significant positive correlation between CGC and edge weight, as seen in Figure 2. Table 1 summarizes these results.
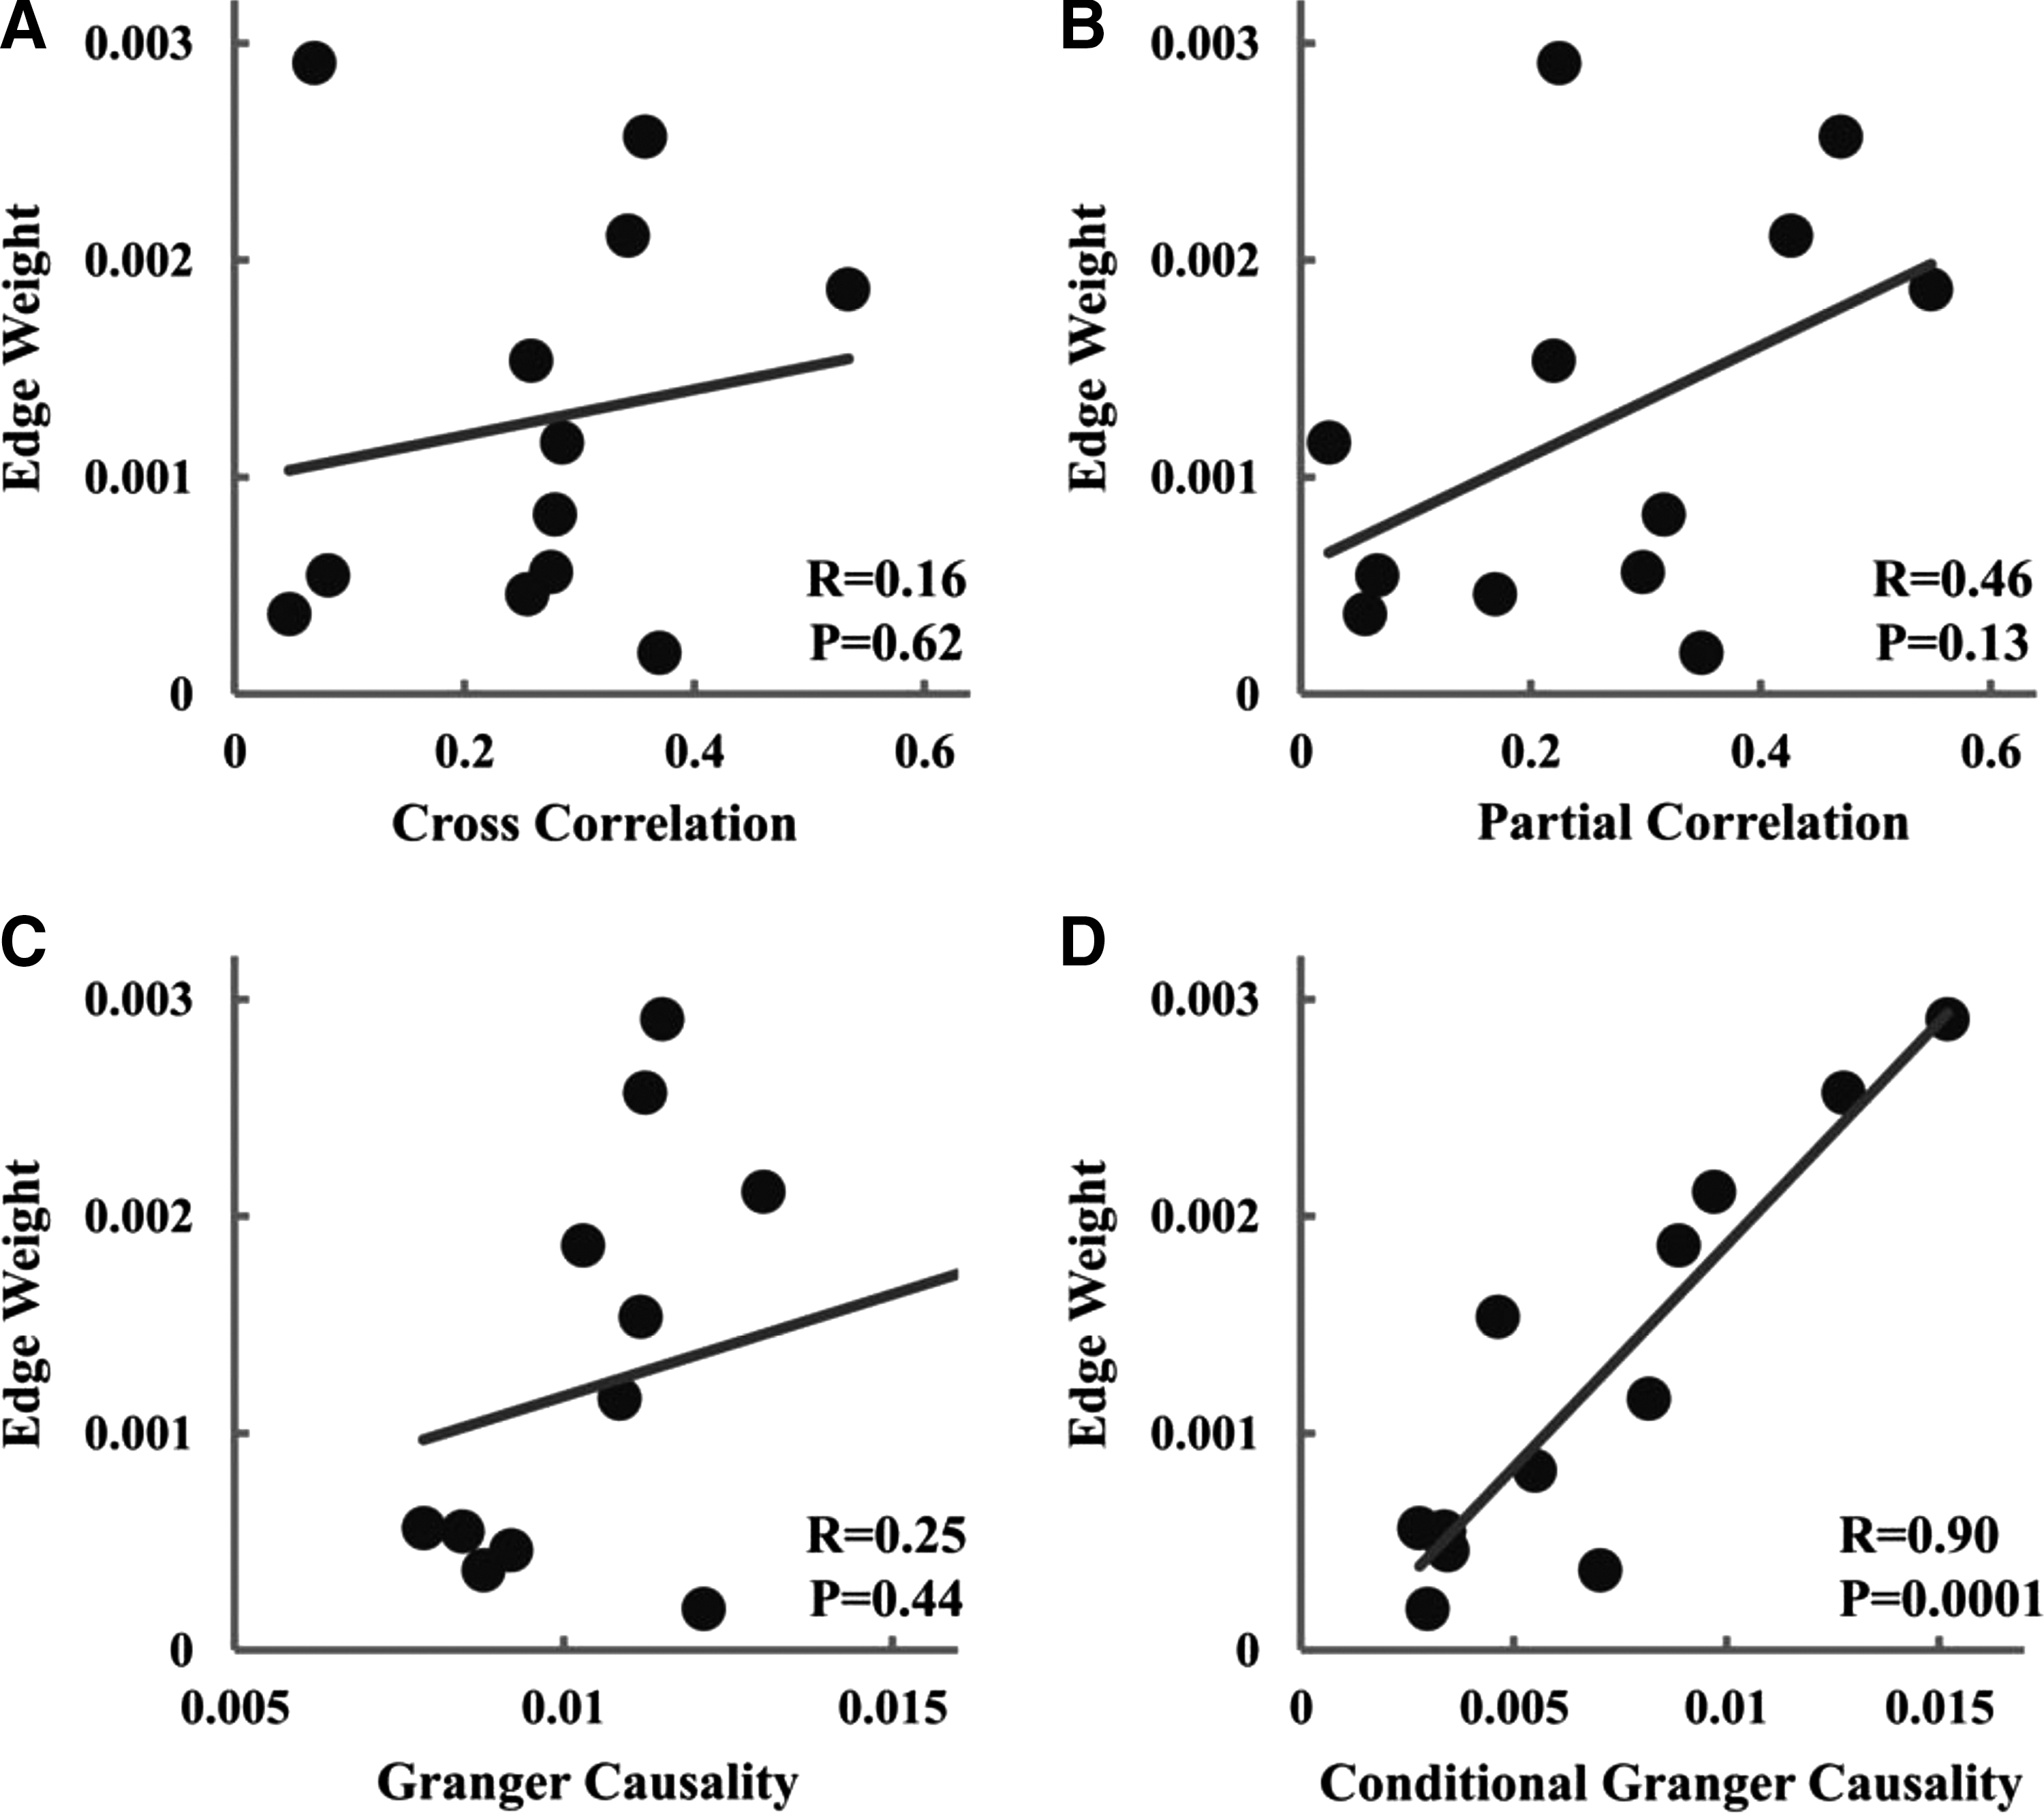
Relationship between measures of structural connectivity and measures of functional connectivity for mPFC–PCC (UF data set).
Correlation Between Functional Connectivity and Structural Connectivity Measures (UF Data Set)
Significant correlation was indicated by bold typeface.
CC, cross correlation; CGC, conditional Granger causality; DLPFC, dorsal lateral prefrontal cortex; FA, fractional anisotropy; GC, Granger causality; IPL, inferior parietal lobule; mPFC, medial prefrontal cortex; PartCC, partial correlation; PCC, posterior cingulate cortex.
Central executive network
In Figure 3A, key nodes of CEN were identified by two ICA components, one containing left DLPFC and left IPL and the other containing right DLPFC and right IPL (FDR p < 0.001). Fibers linking left DLPFC and left IPL were then tracked by the streamline fiber-tracking method using VOLUME-ONE and shown for a typical subject in Figure 3B. As shown in Figure 4 and summarized in Table 1, between left DLPFC and left IPL, only CGC and edge weight displayed significant positive correlation, similar to what was found for mPFC–PCC.
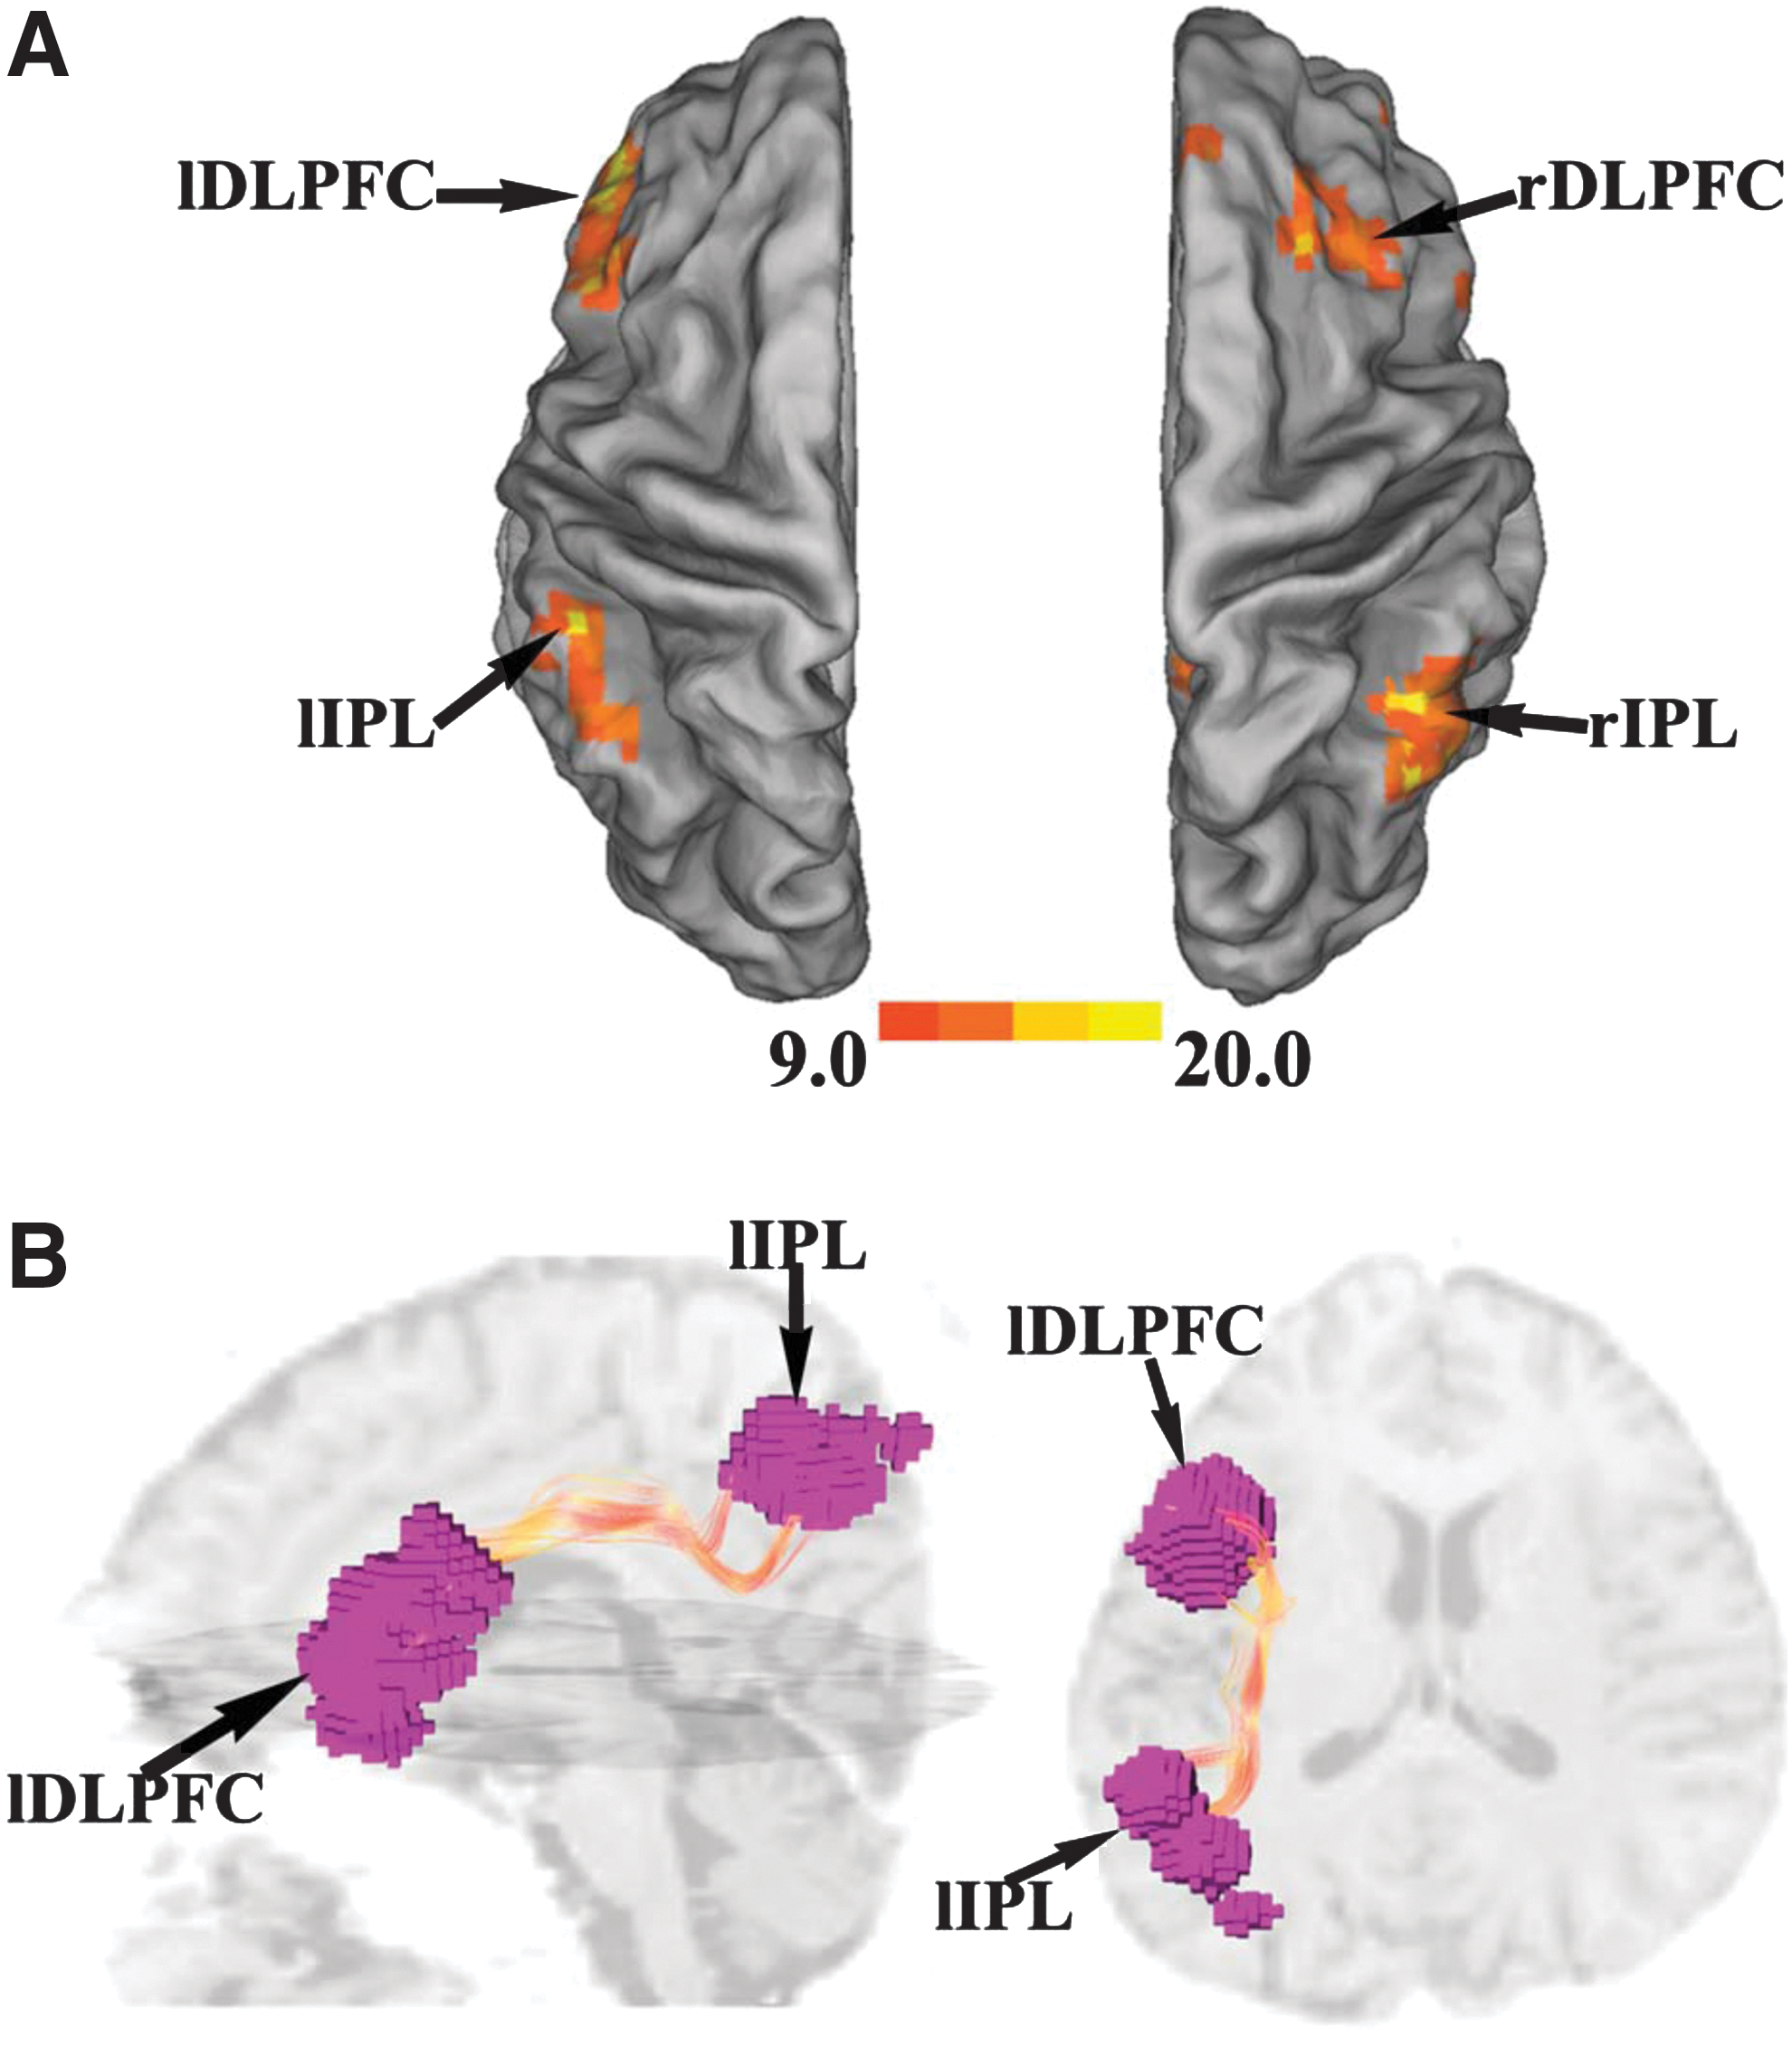
ROI identification and fiber tracking in central executive network (CEN) (UF data set).
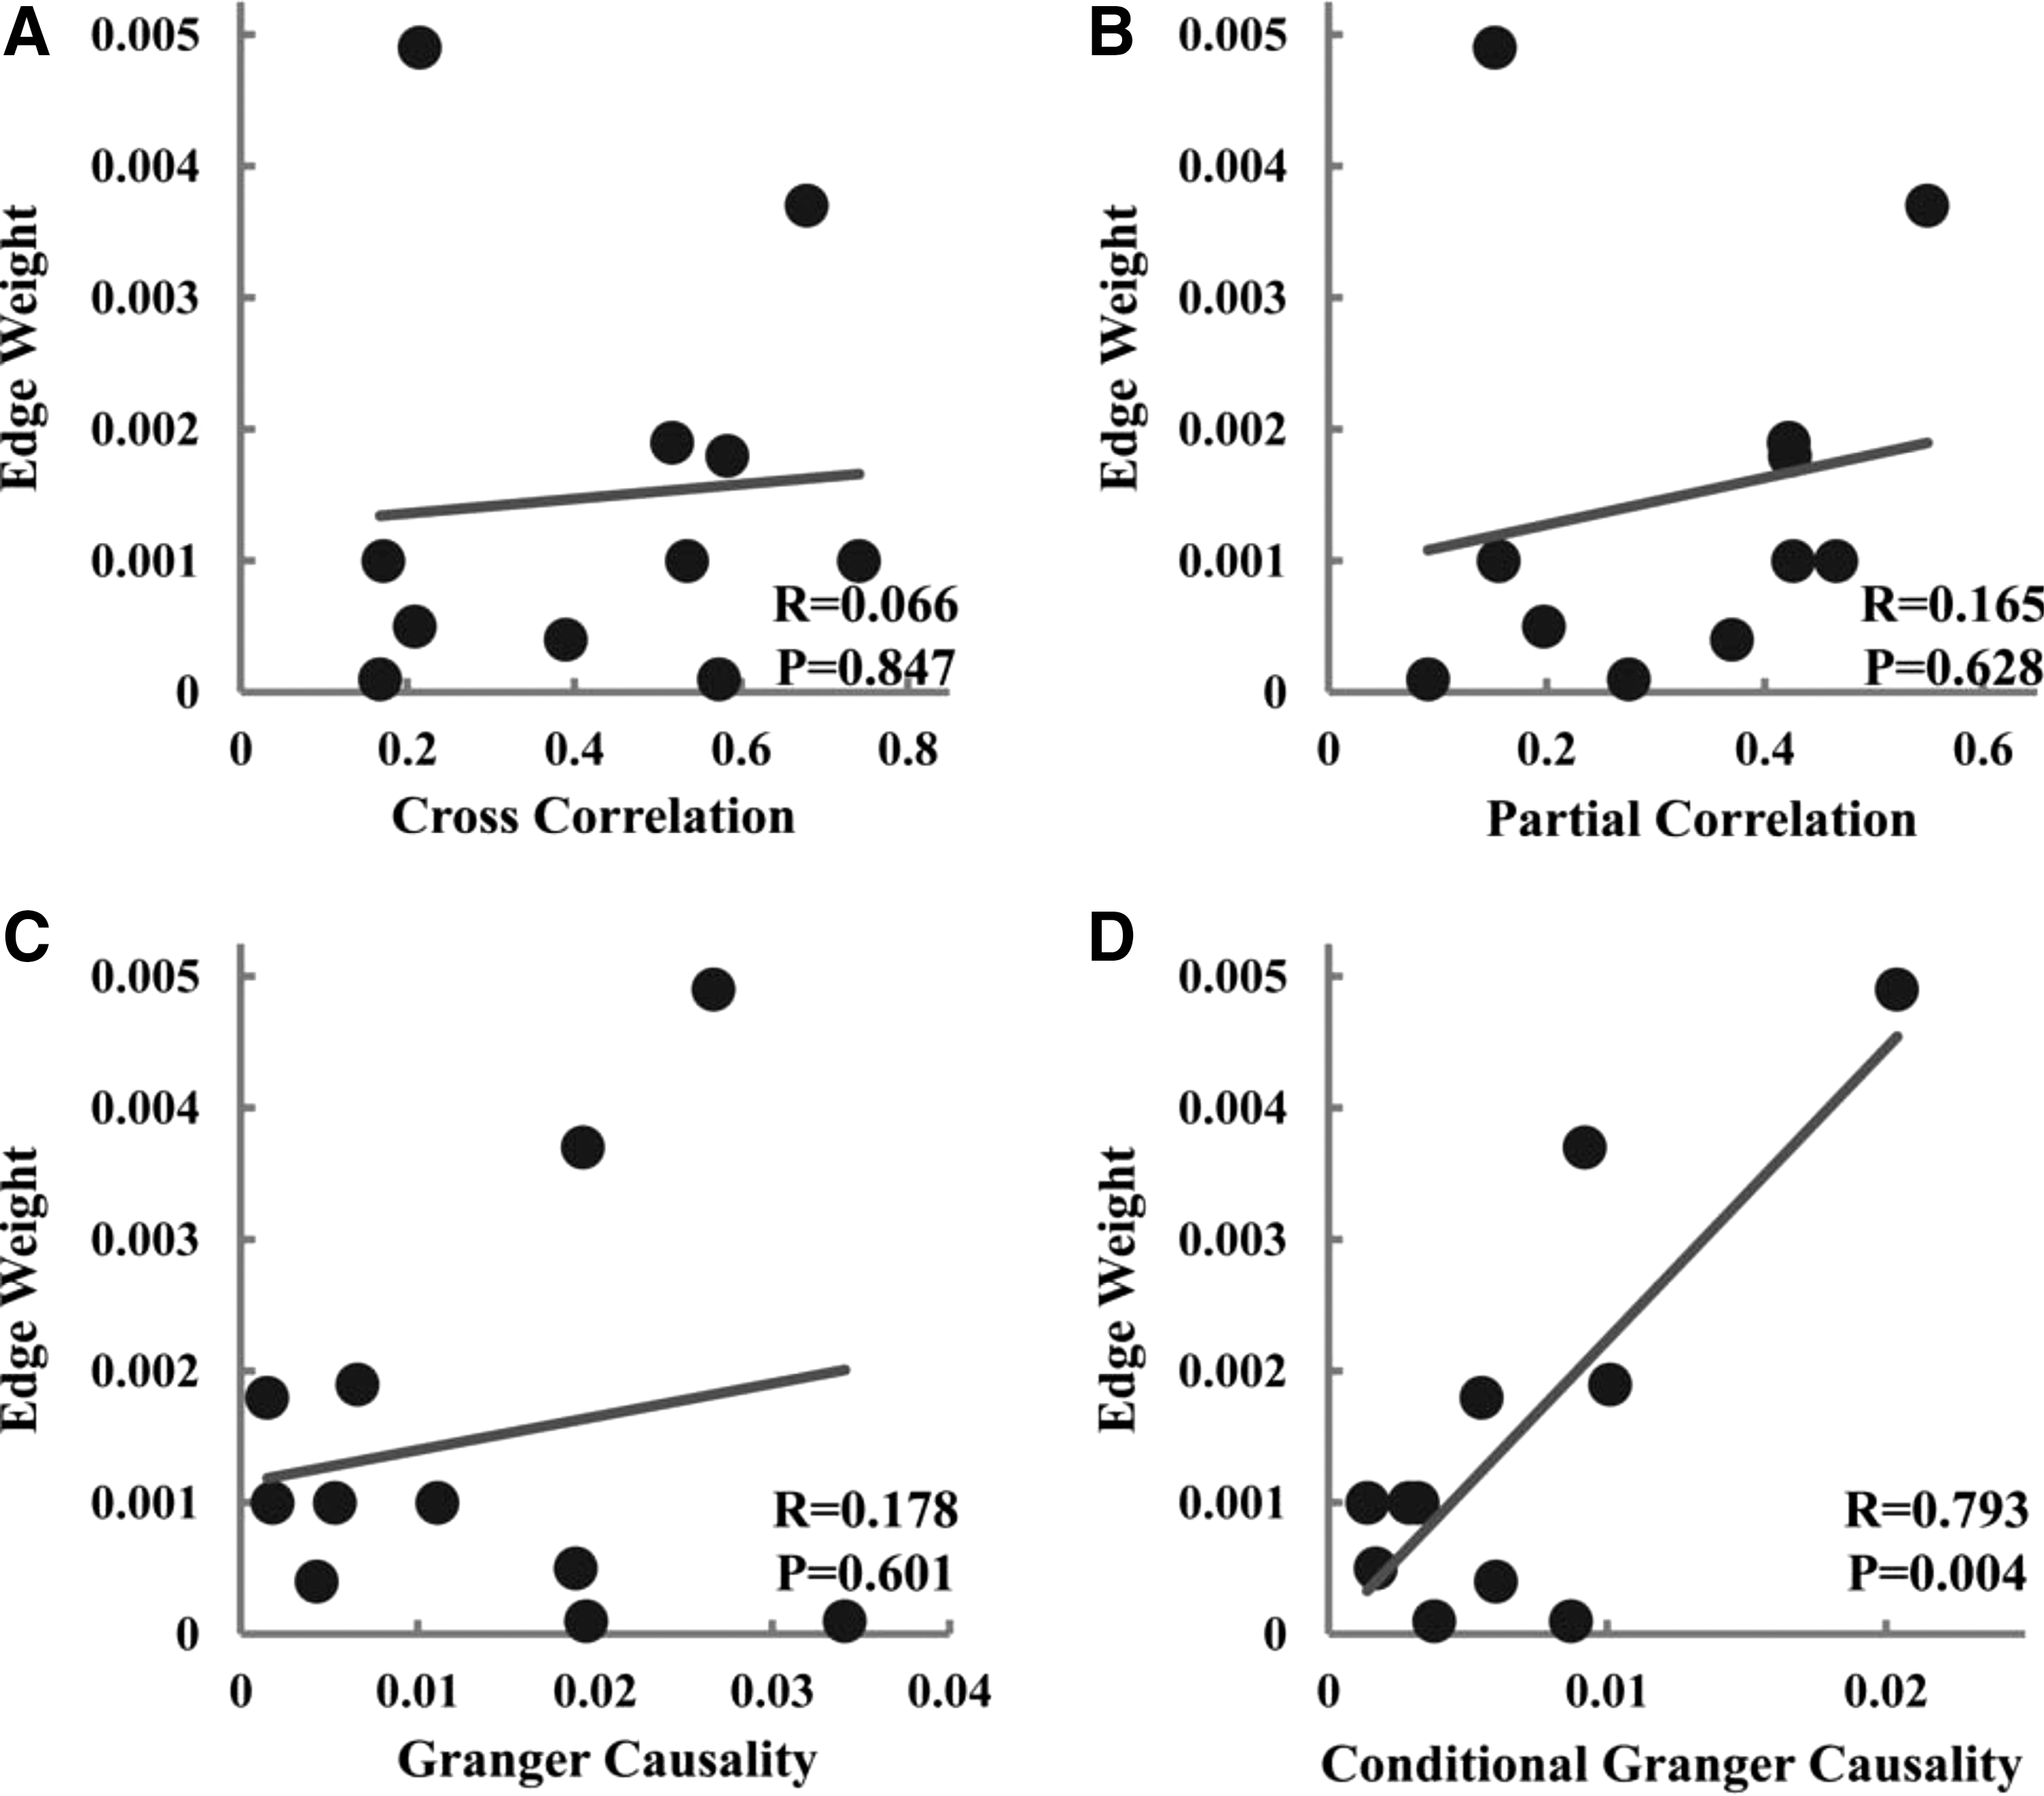
Relationship between measures of structural connectivity and measures of functional connectivity for left DLPFC–left IPL (UF data set).
BNU data set
To cross validate the results mentioned, we applied the same analysis to the BNU data set and the results are summarized in Table 2. As can be seen, no significant correlation was found between all four functional connectivity measures and mean FA for both mPFC–PCC and left DLPFC–left IPL. For mPFC–PCC, CGC was again the only measure among the four applied that was positively correlated with edge weight. For left DLPFC–left IPL connections, however, none of the functional connectivity and structural connectivity measurement pairs was significantly correlated.
Correlation Between Functional Connectivity and Structural Connectivity Measures (BNU Data Set)
Significant correlation was indicated by bold typeface.
Meta-analysis of the two data sets
The two data sets were combined through a meta-analysis using the Liptak–Stouffer Z-score method (Liptak, 1958). The results are summarized in Table 3. Again, for both mPFC–PCC and left DLPFC-left IPL, no significant correlation was found between all four functional connectivity measures and mean FA. Importantly, for both mPFC–PCC and left DLPFC–left IPL, CGC was the only measure among the four applied that was significantly correlated with edge weight.
Correlation Between Functional Connectivity and Structural Connectivity Measures (UF and BNU Data Sets Combined Through Meta-Analysis)
Significant correlation was indicated by bold typeface.
Discussion
We selected mPFC–PCC in DMN and left DLPFC–left IPL in CEN, and the cingulum and SLF bundles that connect them, as the objects of interest to examine the quantitative links between functional connectivity and structural connectivity. Deriving functional connectivity between the two ROI pairs from resting-state fMRI data and structural connectivity from diffusion imaging data, we reported two results. First, zero-lag cross correlation, partial correlation, and pairwise Granger causality were not significantly correlated with either mean FA or edge weight across subjects. Second, CGC was significantly correlated across subjects with edge weight but not with mean FA. These results suggest that (1) edge weight may be a more appropriate measure to quantify the strength of the anatomical connection between ROIs and (2) CGC, which statistically removes the common input and the indirect influences between a given ROI pair, may be a more appropriate measure to quantify the strength of the functional interaction enabled by the fibers linking the two ROIs.
Quantifying the strength of functional connectivity
Functional connectivity is based on covariation of BOLD activity at different recording sites. Cross correlation, partial correlation, pairwise Granger causality, and CGC are all measures of covarying BOLD activities. Covariation of BOLD activity can have multiple sources: (1) direct interaction between the two ROIs, (2) common input from other brain areas, and (3) interaction between the two ROIs mediated by other brain areas. Structural connectivity between two ROIs is based on the fibers directly connecting the two ROIs. Therefore, only the direct functional interaction between the ROIs is expected to correlate with the structural connectivity strength.
Cross correlation measures the degree of covariation of two BOLD signals at zero lag and is widely used in fMRI studies for its conceptual simplicity and ease of use. It has two problems in terms of providing a measure of the functional communication between two ROIs enabled by the fibers linking them. First, it includes contributions from common input from other brain areas as well as activities transmitted through other nodes of the same resting-state network (Messé et al., 2014). Second, it only accounts for the zero-lag covariation structure in the data and ignores temporal dependence beyond the zero lag. In other words, it is not a time-series measure. Past work has already recognized the first problem and proposed the use of partial correlation as an alternative (Supekar et al., 2010; Van den Heuvel et al., 2008). Although partial correlation removes statistically the influences from the other nodes in the same resting-state network, it has two issues of its own. First, it cannot take into account the influence of common input. Second, like cross correlation, partial correlation explores covariation structures in contemporaneously recorded data (zero lag). Temporal relations beyond the zero lag were again not considered. As expected, both cross correlation and partial correlation were found to be not significantly correlated with structural connectivity measures.
The hallmark of a time series is that activity occurring now can influence activity occurring in the future. It has long been recognized that resting-state BOLD signals are time series. The commonly used band-pass filter further introduces temporal dependence into the data. Time-series-based measures of functional connectivity that have been applied to study both resting-state and task-state functional networks include coherence, total interdependence, pairwise Granger causality, and CGC. For the purpose of this study, CGC was considered the most appropriate measure that can be quantitatively linked with structural connectivity measures. The reason is that the total temporal relationship between two ROIs A and B can be decomposed into three components: causal influence from A to B (A→B) + causal influence from B to A (B→A) + common input (Ding et al., 2006). By adding pairwise Granger causality in both directions as a measure of functional connectivity, (A→B) + (B→A), we remove the effect of common input. However, pairwise Granger causality still includes influences between A and B that are transmitted through other nodes of the network (e.g., A→C→B). Compared to pairwise Granger causality, CGC has the additional benefit of being able to differentiate direct from indirect causal influences, and has been applied to measure direct functional connectivity in the brain (Chen et al., 2006; Ding et al., 2006; Liao et al., 2010; Zhou et al. 2009). As CGC can statistically remove common input as well as indirect influences routed through the other nodes of the same network, it is thus expected to be a more accurate measure of functional interaction mediated by the fibers linking the two ROIs. Our results are in support of this hypothesis.
Recent computational modeling studies show that the indirect structural connections between the two brain regions, for example, through a third brain region, can contribute significantly to the functional connectivity measures between the two regions (Adachi et al., 2012; Messé et al., 2014). This lends further support to our effort to remove common input and indirect influences when assessing the functional interaction strength between the two ROIs to address the quantitative links between functional connectivity and structural connectivity.
Quantifying the strength of structural connectivity
Diffusion-weighted imaging data provide the foundation for deriving structural connectivity measures. The most commonly used structural connectivity measure is FA. By definition, FA is a good measure of fiber integrity, but as a measure of structural connectivity strength, it has shortcomings. The main reason is that it does not incorporate factors such as the number of fibers, the length of each fiber, and the size of ROIs, which are important for assessing the strength of structural connectivity (Honey et al., 2009; Lim et al., 2013; Lo et al., 2010; Van den Heuvel and Sporn, 2011). Edge weight proposed by Hagmann et al. (2008), reflecting the summation over all the tracked fibers and normalized by the seed ROIs' size and fiber length, takes these factors into account and has been viewed as a more appropriate measure of structural connectivity strength (Cheng et al., 2012; Hagmann et al., 2010; Supekar et al., 2010; Uddin et al., 2010, 2011; Van den Heuvel and Sporns, 2011). As expected, mean FA showed no correlation with any of the four functional connectivity measures used in this study. In contrast, edge weight showed significant correlation with CGC.
Our findings are in line with the literature. Attempts at linking mean FA and functional connectivity have resulted in inconsistent findings. For example, positive correlation between mean FA and functional connectivity was only found when multiple sclerosis patients and normal controls were combined, but not within each group (Lowe et al., 2008). Morgan et al. found no correlation between mean FA and functional connectivity within the human language circuits (Morgan et al., 2009). In addition, no correlation was found between mean FA and functional connectivity in DMN of young children (Supekar et al., 2010).
Structural–functional relationship in animal studies
The relationship between functional connectivity and structural connectivity has been investigated in macaque monkeys. Similarities between macaque brain networks and human brain networks have been suggested (Margulies et al., 2009; Mars et al., 2011; Shen et al., 2015). In macaques, whereas functional connectivity, quantified by cross correlation, was sometimes derived from fMRI data (Adachi et al., 2012; Deco et al., 2014; Margulies et al., 2009; Mars et al., 2011; Shen et al., 2012, 2015), structural connectivity was often based on tract tracing techniques, which are not possible in humans. The tracer molecules injected into the source brain region are absorbed and transported by axons to target brain regions, resulting in a tracer density map. Those areas showing high tracer density are labeled as brain regions with strong structural connections to the source region, whereas areas showing zero or low tracer density are considered having none or weak structural connection to the source region. In the online macaque cortex anatomical connectivity database CoCoMac (
ROI selection
The choice of PCC and mPFC of the DMN and left DLPFC and left IPL of the CEN as the ROIs is based on several considerations. First, DMN and CEN are two of the most studied resting-state networks. They are also the networks where much of the discussion on the relationship between functional connectivity and structural connectivity took place (Greicius et al., 2009; Supekar et al., 2010; Uddin et al., 2011; Van den Heuvel et al., 2008, 2009). Second, mPFC–PCC and DLPFC–IPL are the ROI pairs of choice in a number of previous studies attempting to link structural connectivity and functional connectivity (Greicius et al., 2009; Supekar et al., 2010; Uddin et al., 2011; Van den Heuvel et al., 2008, 2009). By choosing the same ROIs, we can facilitate the comparison with the previous work. Third, PCC and mPFC, the two midline nodes of DMN, and bilateral DLPFC and IPL are the most robustly identified brain regions from resting-state data (Greicius et al., 2003; van den Heuvel and Hulshoff Pol, 2010). Fourth, mPFC–PCC and left DLPFC–left IPL are linked by major fiber systems. It has been shown that cingulum fiber bundles linking PCC–mPFC (Greicius et al., 2009; Khalsa, 2014; Supekar et al., 2010; Van den Heuvel et al., 2008) and left hemisphere SLF linking left DLPFC–left IPL (Uddin et al., 2011; Van den Heuvel et al., 2009) can be more reliably established. Fifth, the nodes within DMN and CEN are strongly connected with one another, and this is important as signals from other nodes within the network are used for computing partial correlation and CGC.
Footnotes
Acknowledgments
This research was supported by NIH grant MH097320 and NSF grant BCS-1439188.
Author Disclosure Statement
No competing financial interests exist.