
Abstract
Autism spectrum disorder (ASD) is characterized by core sociocommunicative impairments. Atypical intrinsic functional connectivity (iFC) has been reported in numerous studies of ASD. A majority of findings has indicated long-distance underconnectivity. However, fMRI studies have thus far exclusively examined static iFC across several minutes of scanning. We examined temporal variability of iFC, using sliding window analyses in selected high-quality (low-motion) consortium datasets from 76 ASD and 76 matched typically developing (TD) participants (Study 1) and in-house data from 32 ASD and 32 TD participants. Mean iFC and standard deviation of the sliding window correlation (SD-iFC) were computed for regions of interest (ROIs) from default mode and salience networks, as well as amygdala and thalamus. In both studies, ROI pairings with significant underconnectivity (ASD<TD) were identified. Mediation analyses showed that decreased mean iFC in the ASD groups was significantly affected by increased SD-iFC. Our study is the first to identify temporal variability across time as a significant contributing factor to the common finding of static underconnectivity in ASD. Since peak connectivity across time was not significantly reduced in ASD, static underconnectivity findings may have to be reinterpreted, suggesting that connections are not actually “broken” in ASD, but subject to greater intra-individual variability across time. Our findings indicate the need for dynamic approaches to iFC in clinical functional connectivity MRI (fcMRI) investigations.
Introduction
A
However, in its application to ASD, fcMRI has generated highly inconsistent findings, ranging from exclusive underconnectivity (Gotts et al., 2012; Just et al., 2004; Kana et al., 2007; Kleinhans et al., 2008) to mixed effects (Abbott et al., 2015; Di Martino et al., 2014; Doyle-Thomas et al., 2015; Fishman et al., 2014, 2015; Lynch et al., 2013; Monk et al., 2009; Washington et al., 2013) and even predominant overconnectivity (Cerliani et al., 2015; Di Martino et al., 2011; Shih et al., 2011; Supekar et al., 2013). Some of these inconsistencies may be due to methodological differences (Müller et al., 2011; Nair et al., 2014) and age-related changes (Uddin et al., 2013b), as well as cohort effects due to heterogeneity within the disorder. However, the question of how differences in cognitive state and its variability across time may affect observed group differences has not been tested empirically. This presents a crucial gap in the current understanding of connectivity anomalies in ASD, given that the focus on static connectivity has been solely due to limitations in conventional analysis techniques, whereas the dynamic nature of brain network processing is broadly recognized, both in the range of milliseconds (Buzsáki and Freeman, 2015) and seconds (Mason et al., 2007).
In conventional fcMRI, BOLD time series correlations are determined across an entire time series of 5 min or longer, yielding a static measure of functional connectivity. However, despite the technique's modest temporal resolution, dynamic analyses are possible, usually by implementing a sliding window correlational approach (Chang and Glover, 2010; Hutchison et al., 2013). This dynamic fcMRI approach has been found to be sensitive to physiological changes during resting-state scans (Chang et al., 2013b; Hutchison et al., 2013), including those associated with caffeine intake (Rack-Gomer and Liu, 2012), and to ongoing changes in mental state (Allen et al., 2014). Changes in fcMRI across time have also been shown to correspond to electrophysiological changes (Chang et al., 2013a; Jann et al., 2012; Laufs et al., 2003; Sadaghiani et al., 2010; Tagliazucchi et al., 2012).
To our knowledge, the present study is the first to examine dynamic changes in intrinsic functional connectivity (iFC) across time in ASD and their relation with conventional static fcMRI effects. We focused on several networks with previous reports of anomalous connectivity in ASD. These included regions of the default mode network (DMN) (Doyle-Thomas et al., 2015; Kennedy and Courchesne, 2008; Monk et al., 2009; Washington et al., 2013), the salience network (Abbott et al., 2015; Ebisch et al., 2011; Uddin et al., 2013a), as well as amygdala (Abrams et al., 2013; Grelotti et al., 2005; Kleinhans et al., 2011; Murphy et al., 2012) and thalamus (Cerliani et al., 2015; Hardan et al., 2008; Nair et al., 2013, 2015). These regions of interest (ROIs) were selected to test the general questions described below, without any assumption of exclusive impairment in ASD (which would be unwarranted, given the breadth of regional findings implicating almost every network and brain region in ASD).
Our analysis was performed in two cohorts. In the first study, we analyzed a high-quality (low-motion) subsample from the Autism Brain Imaging Data Exchange (ABIDE) (Di Martino et al., 2014), including groups of ASD and typically developing (TD) participants that were tightly matched on head motion and relevant demographic variables. In the second study we included in-house low-motion datasets from ASD and matched TD cohorts.
Given some previous findings of increased intra-individual variability (IIV) in ASD in task performance and associated brain responses (Dinstein et al., 2012; Geurts et al., 2008; Haigh et al., 2014), our study aimed to address two empirical questions: (1) Is iFC variability across time atypically increased in ASD? (2) Are group differences in static iFC driven by differences in the variability of iFC across time? At the broader conceptual level, our study represents a first step in answering the question: Does reduced static iFC (underconnectivity) observed in many fcMRI studies of ASD reflect an organizational impairment (such as reduced network integrity) or simply more frequent fluctuations in mental state across time (e.g., drifting in and out of default mode)?
Materials and Methods
Participants
For Study 1, we used datasets from the ABIDE (
Two hundred twenty-one participants (76 ASD, 145 TD), who met all the aforementioned criteria and had at least 4 min of data after censoring, were put through the matching process to form two optimally matched groups using an R package for multivariable group matching (Sekhon, 2011). Final ASD and TD samples (76 ASD, 76 TD) were matched on age, sex, NVIQ, FIQ, PIQ, handedness, amount of motion, and eye status at scan (Table 1). The matched subjects were from six sites, all of which acquired data with a repetition time (TR) of 2 seconds.
San Diego State University.
University of Michigan: Sample 1.
University of Michigan: Sample 2.
University of Utah School of Medicine.
Yale Child Study Center.
NYU Langone Medical Center.
p = 0.6 using Kolmogorov–Smirnov test (ks = 0.1). See Supplementary Figure 3 for the histogram of rmsd of all motion parameters.
p = 0.38 using Kolmogorov–Smirnov test (ks = 0.2).
ABIDE, Autism Brain Imaging Data Exchange; ASD, autism spectrum disorder; TD, typically developing.
For Study 2, we included 82 (41 TD, 41 ASD) participants from our in-house dataset who had passed mock scanning. After exclusion based on quality control criteria (see details in the “Motion censors” section), ASD and TD groups were then matched analogous to Study 1, for final samples of 32 per group (Table 1).
fMRI data processing
AFNI, FSL, and MATLAB were used for MRI data preprocessing (Cox, 1996; Smith et al., 2004). High-resolution anatomical images were bias field corrected and then skull stripped. Tissue segmentation was applied to estimate white matter (WM) and cerebrospinal fluid (CSF) partial volume fractions. WM and CSF masks were derived by thresholding the partial volume fraction maps at 0.99 and then eroded by 1 voxel to minimize the partial volume effect with gray matter (Jo et al., 2010). Functional data were time-shift and motion corrected, coregistered to the anatomical image and resampled to 3 mm3 isotropic voxels.
Nuisance regressors removed from resting data using AFNI 3dDeconvolve included: (1) linear and quadratic trends, (2) six motion parameters and their first derivatives, and (3) mean WM and CSF signals and their first derivatives (Jo et al., 2010). Each functional volume was then spatially smoothed to 6 mm FWHM, and transferred to standard space (MNI). For each subject a censor time series was generated for BOLD signal outliers using AFNI 3dToutcount, which identifies data points that are far from the median. In addition, motion censors were defined using the motion regressors (see “Motion censors” section). Average time series were extracted from ROIs in the DMN, salience network, amygdala, and thalamus. Data were lowpass filtered with a cut-off frequency of 0.1 Hz.
Motion censors
To minimize the effects of motion in the BOLD signal, we censored the affected data points. We used FD to evaluate the amount of motion at each time point (Power et al., 2012, 2014). Motion censors were defined using slightly different thresholds for the two studies, given the different sample sizes. In study 1, we applied a more conservative censoring threshold. Data points with FD larger than 0.25 mm were censored, including one time point immediately preceding and two time points following motion-contaminated points. Any time series segments with less than 10 consecutive surviving time points were also discarded (Power et al., 2014). In study 2, procedures were identical, but a relaxed FD threshold of 0.5 mm was used to preserve statistical power in the overall smaller in-house sample.
In addition to the main analysis described above, we also repeated the analysis in Study 1 using a relaxed censoring criterion of FD >0.5 mm. Using this relaxed criterion minimized the overall censored points to about 2% and consequently more data points remained in the time series. One hundred ninety-seven participants (70 ASD, 127 TD) had at least 6 min of data after these new censoring criteria. Using the same matching criteria we formed two optimally matched groups of 70 ASD and 70 TD (with 94 subjects out of 140 requiring no censoring at all), with 6 min of data for each subject.
Regions of interest
We extracted mean time series from ROIs in the DMN, salience network, amygdala, and thalamus. Coordinates from previous studies were used to identify the seeds for the following regions: posterior cingulate cortex (PCC), medial prefrontal cortex (mPFC), left (L)/right (R) hippocampal formation (Hipp), L/R lateral parietal cortex (LP) (Van Dijk et al., 2010), pregenual anterior cingulate cortex (Prg ACC) (Di Martino et al., 2009), dorsal anterior cingulate cortex (Abbott et al., 2015), and L/R anterior insula (Ins) (Ebisch et al., 2011). All ROI masks, except for the Prg ACC, were defined as 10 mm radius spheres centered on the seed coordinates. To avoid overlap between ROIs, the Prg ACC ROI was defined as 6 mm radius sphere (see Supplementary Table 1 for coordinates; Supplementary Data are available online at
Sliding window correlation analysis
Sliding window correlation was performed between ROI time series with a window length of 30 sec and time shift of 8 sec (Handwerker et al., 2012; Hutchison et al., 2013). Any window with more than 6 sec (20% of the time points) of censored data was excluded. Any subject with fewer than 28 useable windows, that is, with less than 4 min of data (30 + 27 × 8 = 246 sec = 4 min and 6 sec), was excluded. For all remaining subjects, the first 28 windows were selected to form the sliding window correlation time series. For each subject, the standard deviation of the sliding window correlation (SD-iFC) was calculated for further group comparisons (Chang and Glover, 2010; Rack-Gomer and Liu, 2012). Standard deviation served as a summary measure of the variability of BOLD correlations across time.
It is important to note that temporal dependencies are not taken into account when calculating the correlation coefficient (i.e., the correlation coefficient is invariant with respect to the temporal ordering of the data). The calculation of the standard deviation is also invariant with respect to temporal ordering. Given this invariance with respect to temporal ordering, the use of censoring represents a suitable approach to minimizing the inclusion of data that are potentially corrupted by motion. Therefore, censoring would not have a major effect when calculating the correlation coefficients, except that it reduces the number of time points used in the analysis.
For each subject, “iFC” was calculated as the static correlation (r) between the time series. Additionally, we identified the window with highest correlation for each subject and compared the maximum connectivity values between the two groups. However, no gold standard for window length is currently available, and we, therefore, additionally ran the main analyses in Study 1 using slightly longer windows (40, 50, and 60 sec) that have been reported in the fcMRI literature (Handwerker et al., 2012; Hutchison et al., 2013).
Sliding window motion analysis
For each subject, FD time series derived from the motion regressors were used to evaluate the changes in motion over time. A sliding window FD time series was formed by calculating the mean of FD values over the window length of 30 sec with a time shift of 8 sec. The standard deviation of the sliding window FD (Std FD) was used as a covariate in our analysis.
Group comparison
A two-sample t-test was used to compare both iFC and its dynamics (SD-iFC) between the two groups.
Mediation analysis
Mediation analysis evaluates the effect of a third variable (mediator) on the relation between the dependent and independent variables (MacKinnon et al., 2007). A commonly used approach to assess mediation forms three linear models as follows and then performs the mediation statistical analysis:
where Y is the dependent variable, X is the independent variable, M is the mediator, i1
, i2
and i3
are intercepts, c is the coefficient relating the independent variable and the dependent variable, c′ is the coefficient relating the independent variable to the dependent variable adjusted for the mediator, b is the coefficient relating the mediator to the dependent variable adjusted for the independent variable, a is the coefficient relating the independent variable to the mediator, and e1
, e2
, and e3
are residuals (MacKinnon et al., 2007). The causal steps approach fits these three models, checks the following four conditions to be met, and tests whether the product ab is significantly different from zero (MacKinnon et al., 2007): (a) A significant relation exists between the independent variable and the dependent variable in Equation 1 (i.e., c is significantly different from zero). (b) A significant relation exists between the independent variable and the mediating variable in Equation 3 (i.e., a is significantly different from zero). (c) The mediating variable must be significantly related to the dependent variable when both the independent variable and mediating variable are predictors of the dependent variable in Equation 2 (i.e., b is significantly different from zero). (d) The coefficient relating the independent variable to the dependent variable in Equation 1 must be larger (in absolute value) than the coefficient relating the independent variable to the dependent variable in Equation 2. that is, (|c| >| c′|).
The significance of the mediated effect was tested using the Sobel product coefficient statistic test (MacKinnon et al., 2007) to investigate whether underconnectivity in ASD participants was mediated by temporal variations in functional connectivity, that is, higher SD-iFC. Therefore, we used the grouping factor (e.g., ASD or TD) as the independent variable (X), SD-iFC as the mediator (M), and static iFC as the dependent variable (Y). Using this analysis we investigated whether adding the mediator (SD-iFC) in the model (Equation 2) would significantly change the relation between the dependent and independent variable, that is, the difference in static iFC between the two groups.
Results
Study 1
As compared to the TD group, the ASD group showed significantly lower iFC for a number of ROI pairings: PCC–R Hipp, L Lp–mPFC, PCC–mPFC, Prg ACC–PCC, R Amyg–L LP, R Amyg–R Ins, L Amyg–L LP, and L Thal–R Thal. The ASD group also showed significantly higher SD-iFC for PCC–mPFC, L LP–mPFC, and L Thal–R Thal, and significantly lower SD-iFC for L LP–R Thal (Table 2 and Fig. 1A). Figure 1B illustrates the relation between iFC t-statistics (from Fig. 1A, lower triangle) and the SD-iFC t-statistics (Fig. 1A, upper triangle), with a significant negative correlation (r = −0.34, p = 0.0007) observed across the 91 ROI pairs.
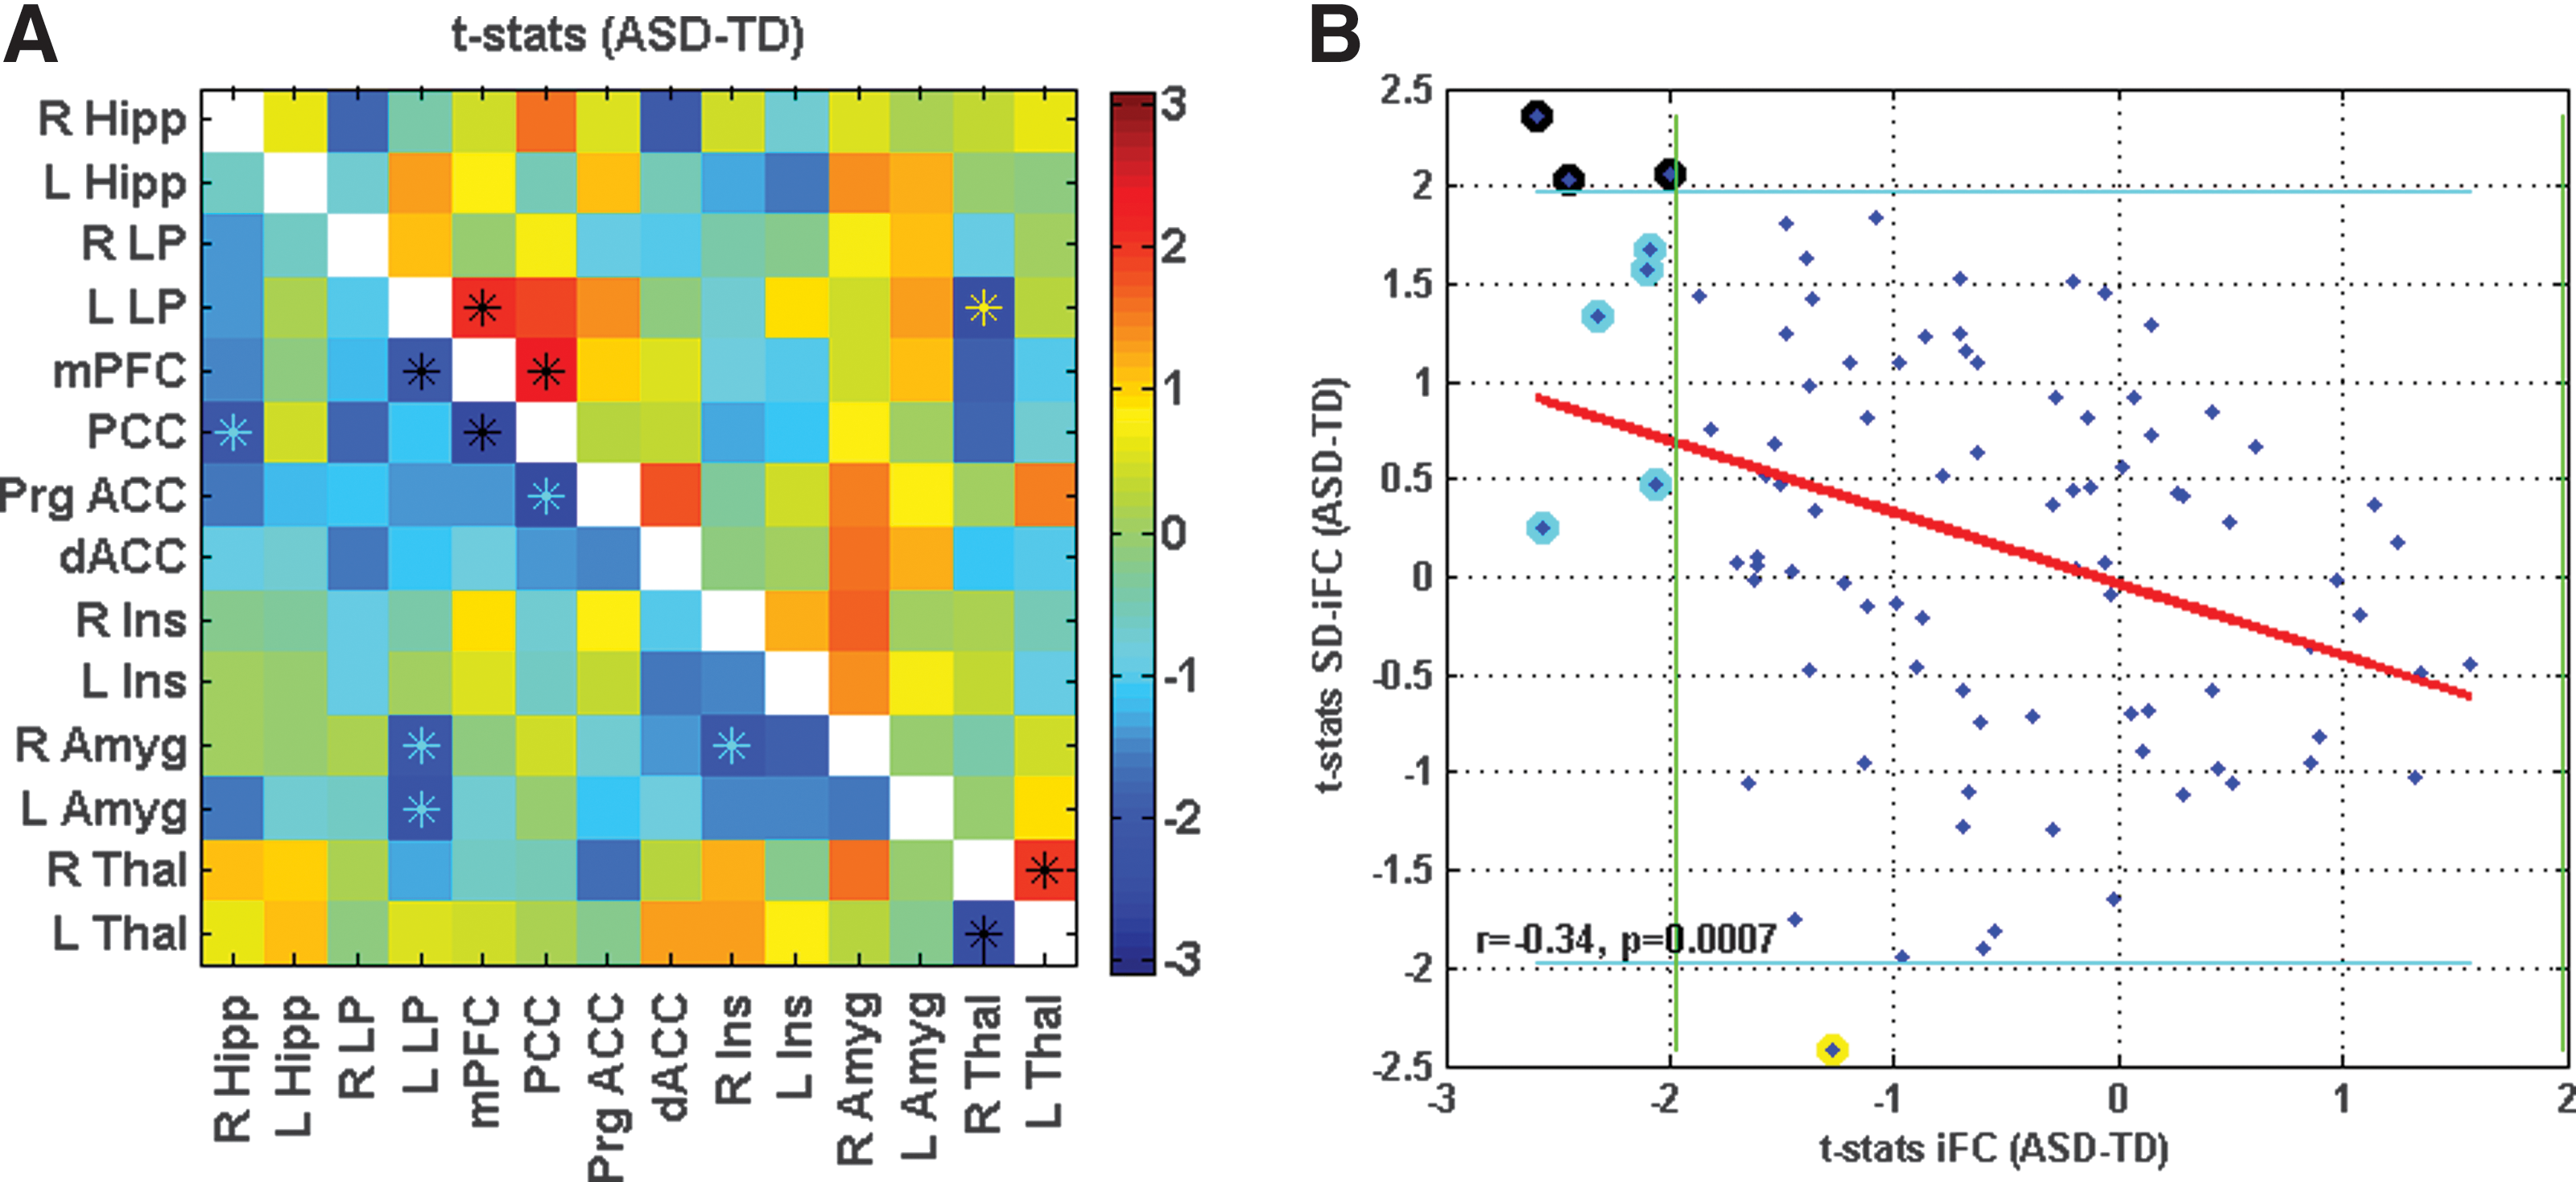
Connectivity matrix for Study 1, showing t-statistics for iFC in lower triangle in
Hipp, hippocampal formation; iFC, intrinsic functional connectivity; LP, lateral parietal cortex; mPFC, medial prefrontal cortex; PCC, posterior cingulate cortex; ROI, regions of interest.
We performed a mediation analysis across subjects on the three ROI pairs that exhibited significant differences in both iFC and SD-iFC, that is, PCC–mPFC, L Thal–R Thal, and mPFC–L LP and, thus, met the first two requirements for the mediation analysis. Further analysis confirmed that the additional two requirements were also met for these ROI pairs. The other pairs were excluded from further analysis because they did not meet the first two requirements for the mediation analysis. Figure 2A shows the relation between iFC and SD-iFC for PCC–mPFC across subjects. We found a negative correlation between iFC and SD-iFC for both ASD (r = −0.43, p = 9.7 × 10⁻⁵) and TD (r = −0.60, p = 5 × 10⁻⁹) groups. The red and blue horizontal lines show the iFC group means for ASD and TD, respectively. The distance between them, that is, the mean differences, equals the total effect (denoted as c in Equation 1) of the grouping factor on iFC. The red and blue vertical lines indicate the SD-iFC group means for ASD and TD, respectively. The distance between these lines is equal to the effect of the grouping factor on the mediator SD-iFC (denoted as a in Equation 3). The slanted lines represent the relation between iFC and SD-iFC in each group.
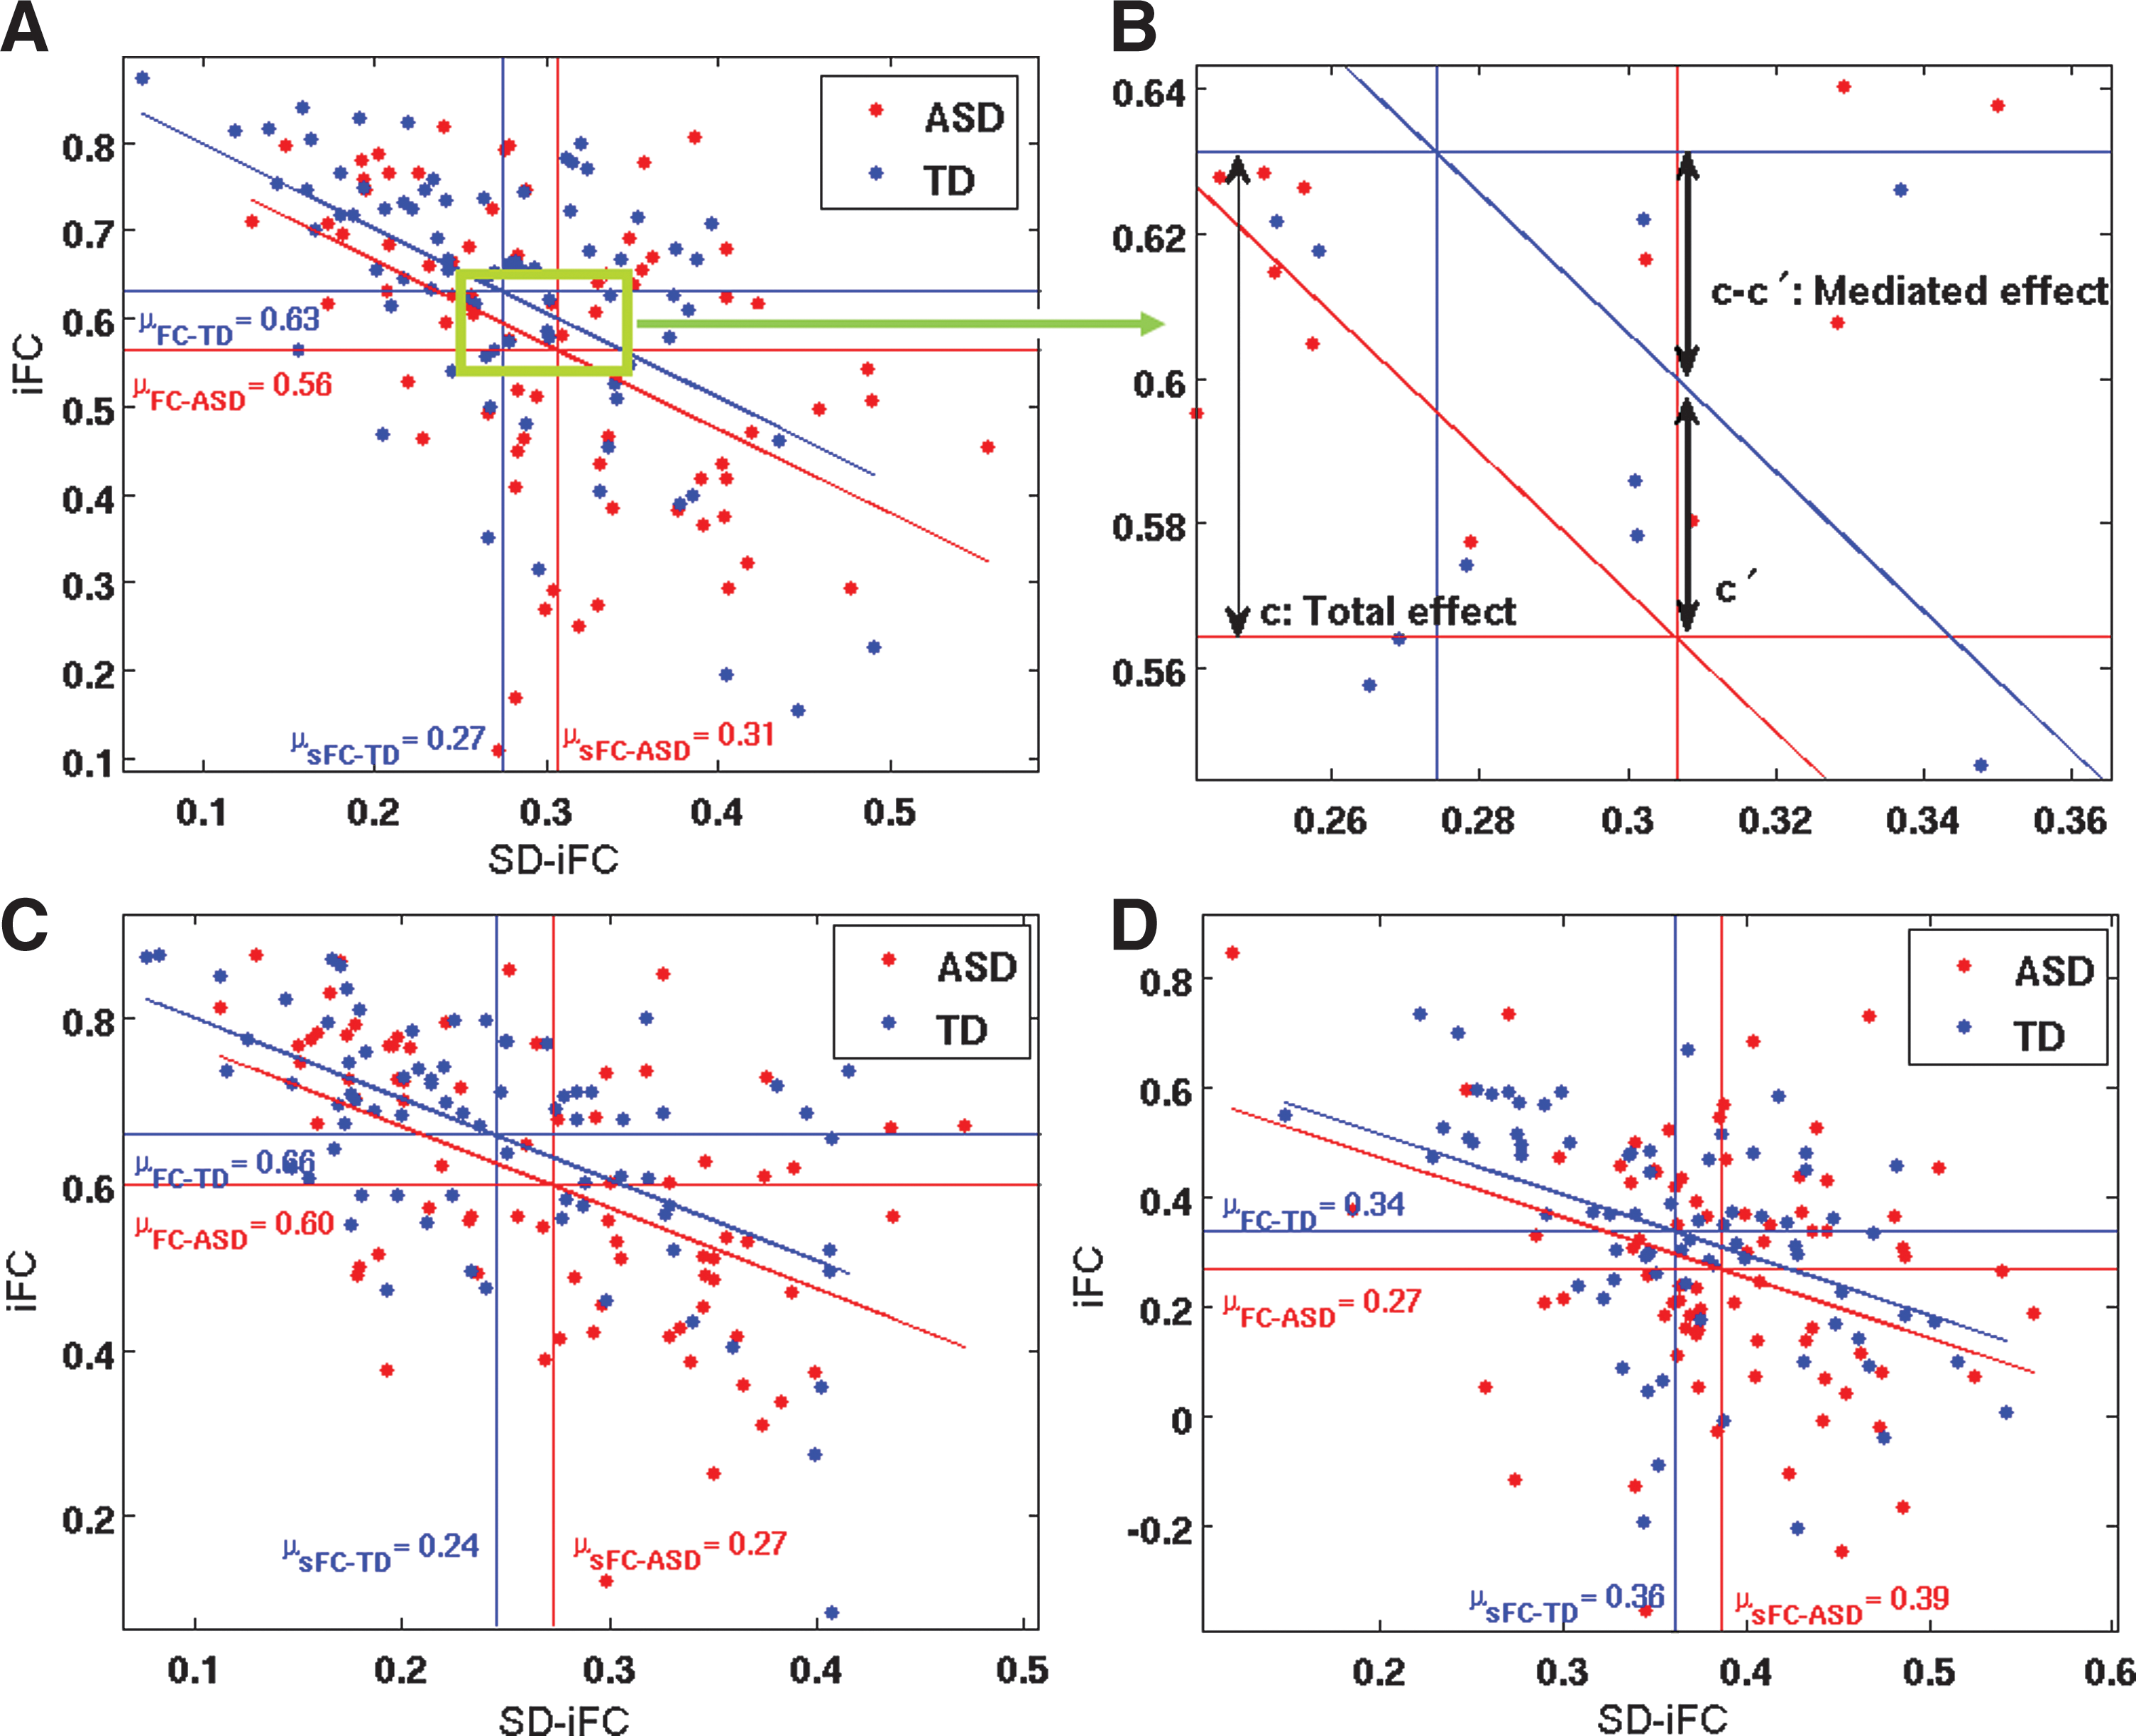
The mediation analysis showed a significant mediated effect using the Sobel test (nab = −2.24; p = 0.02), meaning that a significant portion of the difference in the iFC between the two groups (the total effect) could be accounted for by differences in SD-iFC (Fig. 2B). In a single mediator model, the mediated effect ab is equivalent to (c–c′) (MacKinnon et al., 2007), which is shown in Figure 2B. To account for the effect of motion, age, gender, and multiple sites in the mediation analysis, we added those as covariates in the model. Performing the mediation analysis on these data we again found a significant mediated effect (nab = −2.11; p = 0.03). Figure 2C shows a similar result for the left/right Thal pair. A negative relation between iFC and SD-iFC was found for both ASD (r = −0.51, p = 1.8 × 10⁻⁶) and TD (r = −0.57, p = 6.2 × 10⁻⁸) groups. Mediation analysis revealed a significant mediated effect (nab = −1.96; p = 0.045) between these pairs as well. After adding the aforementioned covariates, that is, motion (Std FD), age, gender, and site in the model, the significance of the mediated effect became marginal (nab = −1.74; p = 0.055). Figure 2D illustrates the results for the mPFC-L LP pair. We found negative correlations between iFC and SD-iFC for both ASD (r = −0.25, p = 0.02) and TD (r = −0.54, p = 4 × 10⁻⁷) groups. Mediation analysis on this pair showed a marginal mediated effect (nab = −1.91; p = 0.055), which was, however, significant after adding the covariates in the model (nab = −2.1; p = 0.03).
Finally, we compared correlation maxima for the two DMN hubs (PCC–mPFC) across the entire time series in each participant. There was no significant difference (t = −1.04, p = 0.2) in peak connectivity between the TD group (M = 0.92) and the ASD group (M = 0.91).
To investigate the effect of window length on the results, we ran some additional analyses using some longer windows, that is, 40, 50, and 60 sec. While window size had minor effects, the overall pattern of results remained the same (Supplementary Figure S1). Performing mediation analysis also showed a significant mediated effect between all ROI pairs that showed significant difference in both iFC and SD-iFC. The ROI pairs that met the first two requirements for the mediation analysis are indicated by black asterisks in Supplementary Figure S1.
Effects of minimal censoring and data length on the main results were also investigated in an additional analysis, including only longer time series (6 min per subject), with a relaxed FD threshold. As shown in Supplementary Figure S2, results were consistent with those from the initial analysis. Mediation analysis was also performed on the two ROI pairs (PCC-mPFC and L Thal-R Thal) that showed significant difference in both iFC and SD-iFC. We found a significant mediated effect for both PCC-mPFC (nab = −2.48, p = 0.01), and L Thal-R Thal (nab = −2.4, p = 0.017), which remained significant after adding the covariates to the model (Supplementary Fig. S2).
Study 2
Sixty-four subjects from the in-house dataset, who passed all the aforementioned criteria, were optimally matched in two groups (32 ASD and 32 TD), and used for further analysis. As compared to TD participants, ASD participants exhibited both underconnectivity and overconnectivity for different pairs (See Table 2 and Figure 3A for details). Figure 3B shows the t-statistics for iFC differences (shown in Fig. 3A, lower triangle) versus the t-statistics in SD-iFC differences (shown in Fig. 3A, upper triangle). As in study 1, we found a significant negative correlation (r = −0.21, p = 0.04) between the iFC and SD-iFC t-statistics across different ROI pairs. Mediation analysis was performed on PCC-mPFC, which was the only pair that showed significant differences in both iFC and SD-iFC. Figure 4 shows the relation between iFC and SD-iFC for PCC-mPFC across subjects. We found a significant negative correlation between iFC and SD-iFC for both ASD (r = −0.63, p = 1.0 × 10⁻⁴) and TD (r = −0.63, p = 8.1 × 10⁻⁵) groups. Mediation analysis also showed a significant mediated effect (nab = −2.6; p = 0.008). Adding covariates to the model did not change the significance of the mediated effect (nab = −2.4; p = 0.011).
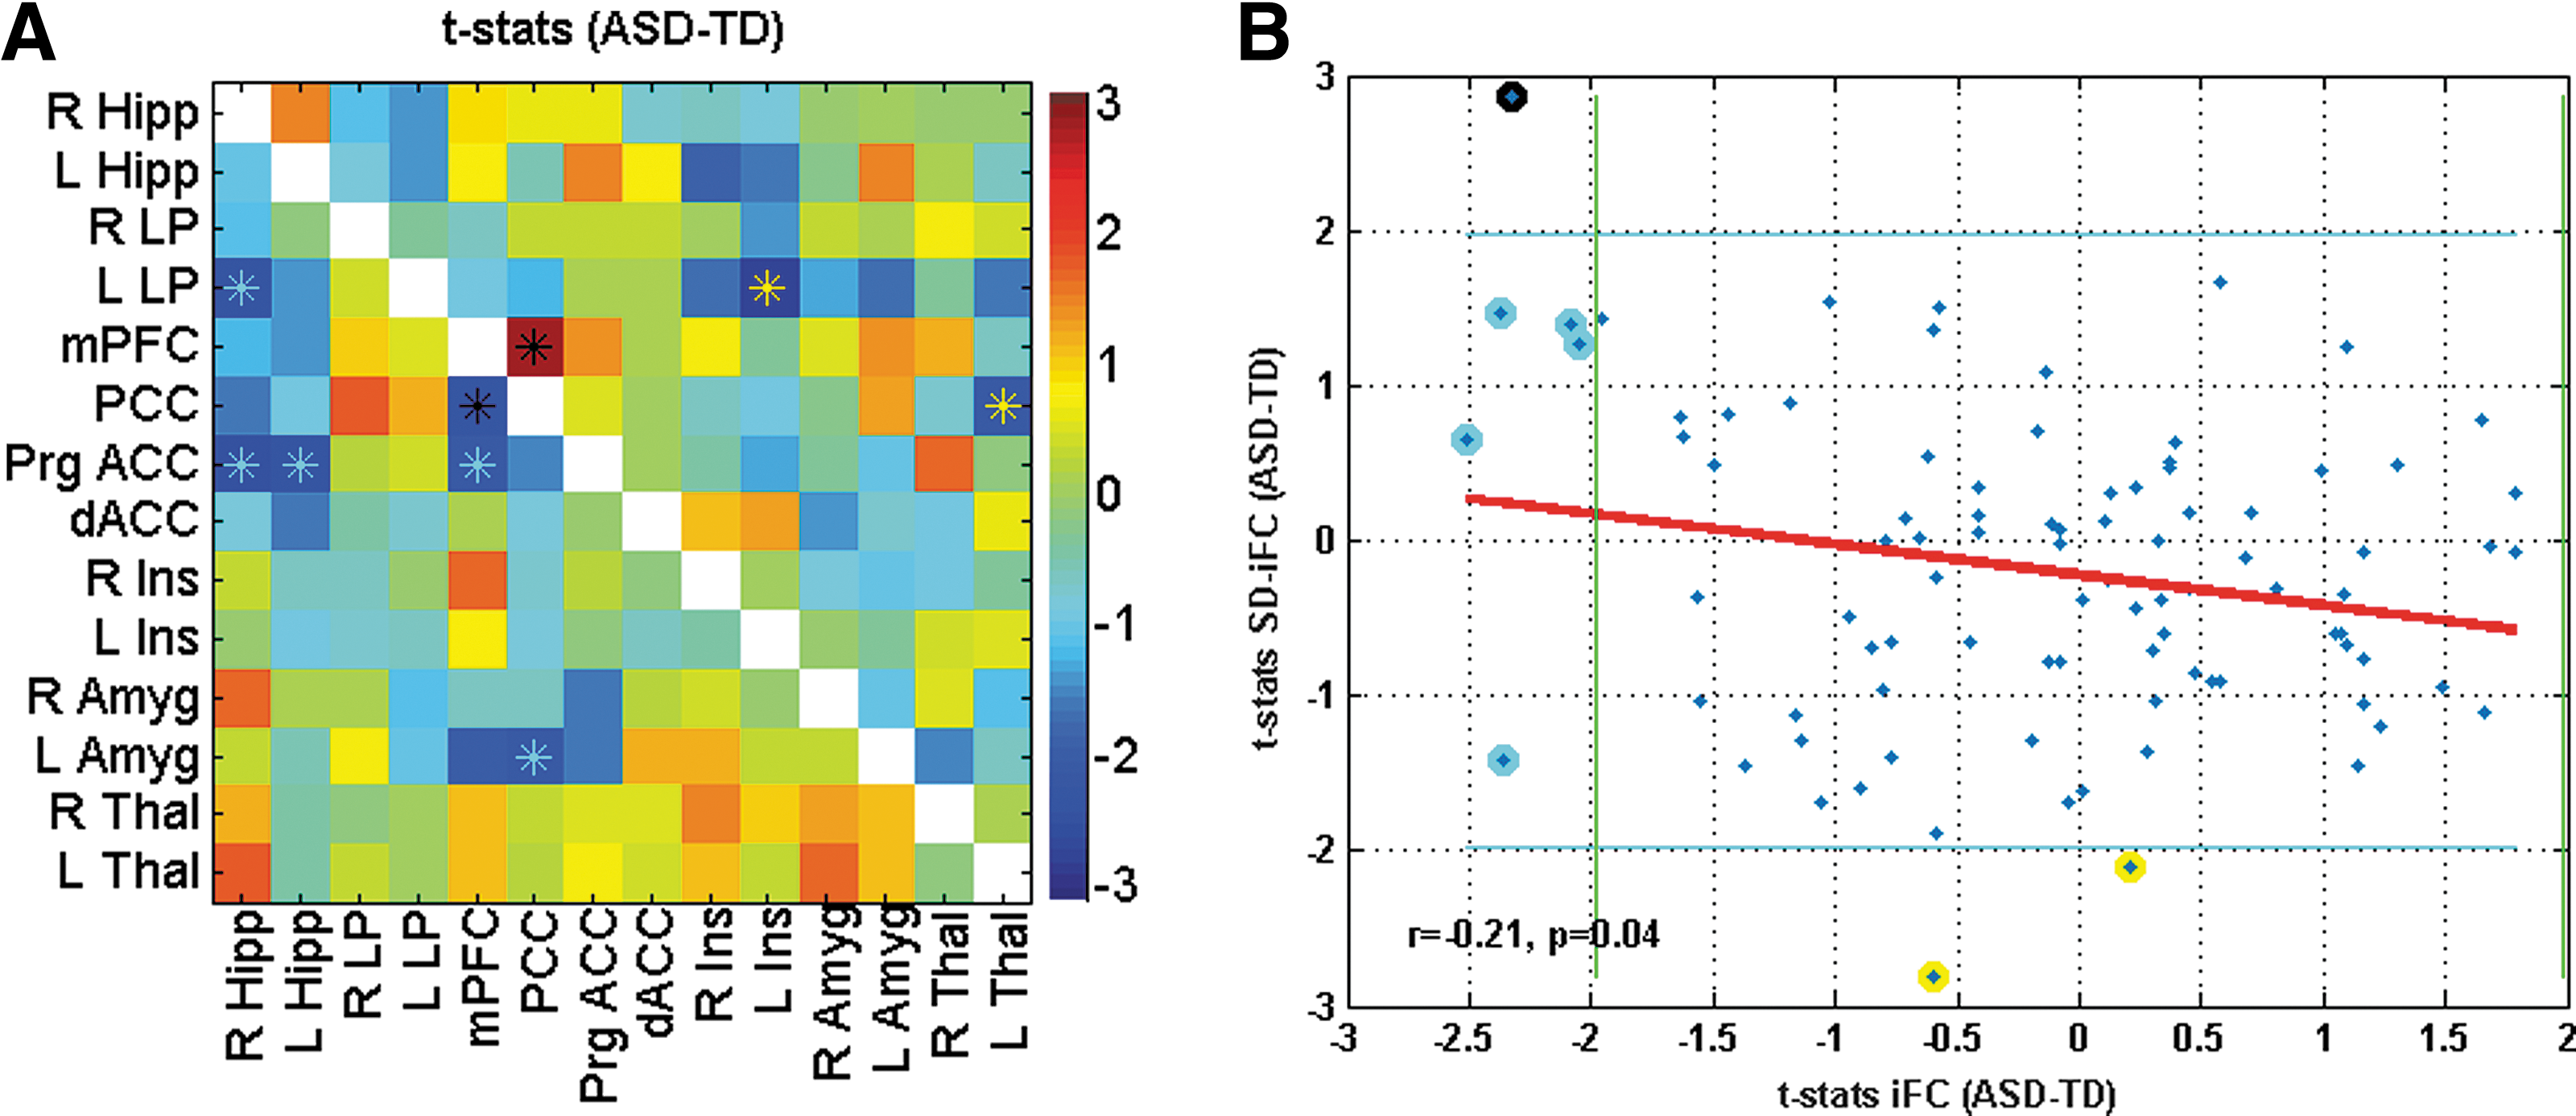
Connectivity matrix showing t-statistics for iFC in lower triangle in
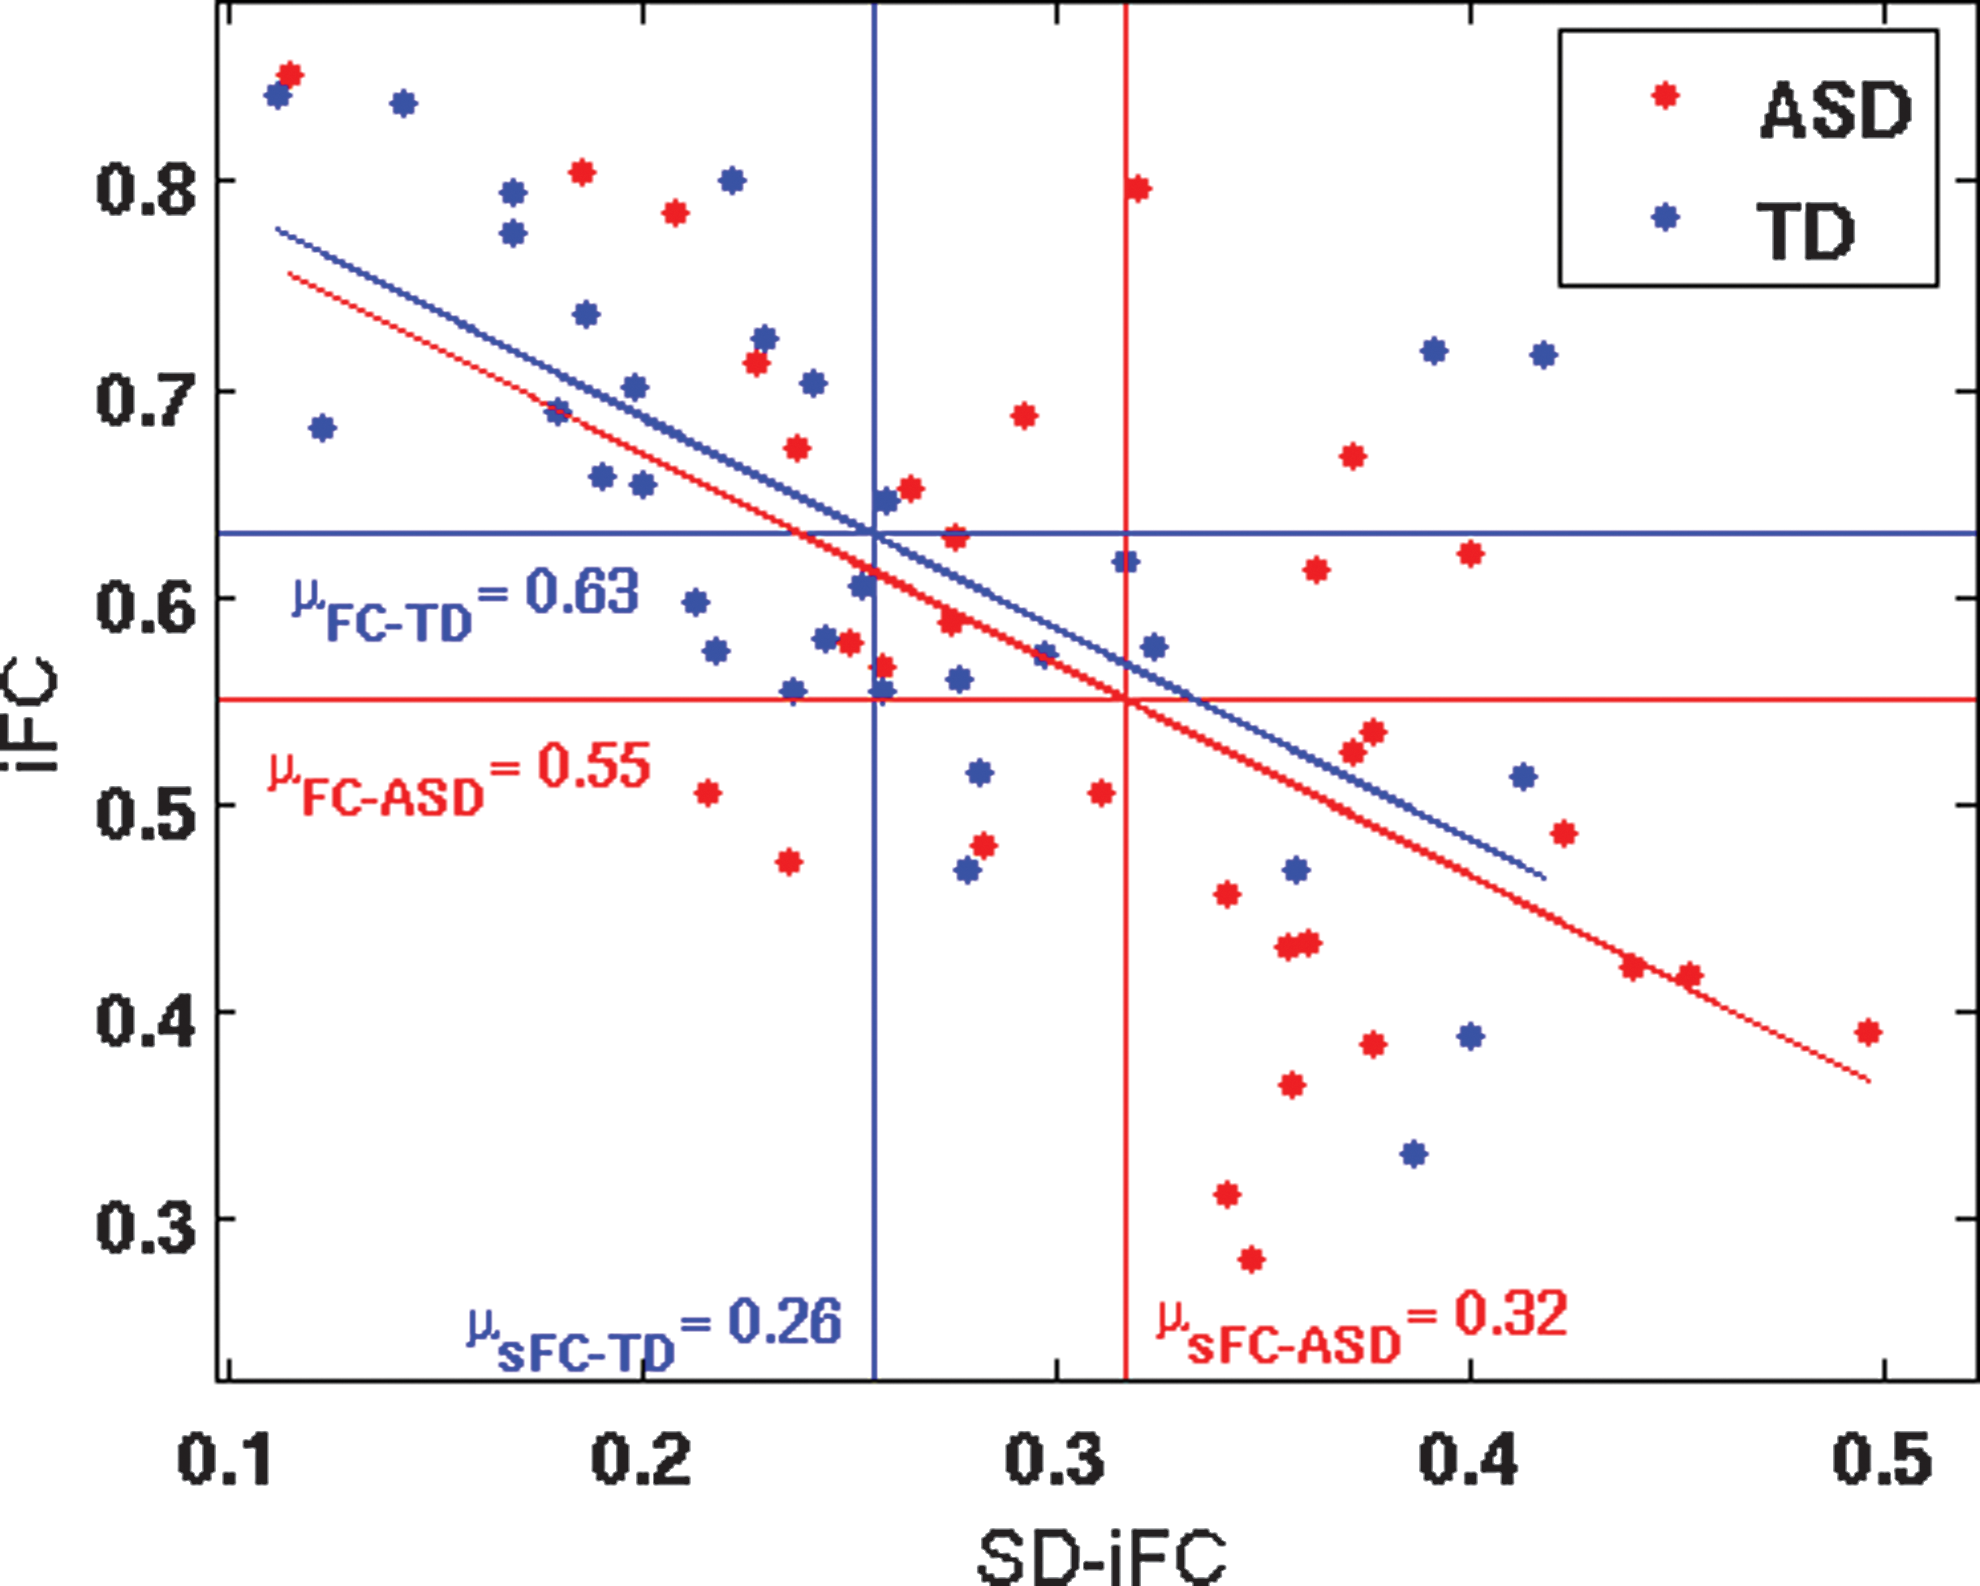
Relation between static iFC and SD-iFC of PCC and mPFC across subjects. The red and blue horizontal lines show the iFC group means for ASD and TD, respectively, and the vertical lines indicate the SD-iFC group means. Participants were from the in-house database (32 ASD, 32 TD). Color images available online at
Testing again for differences in peak connectivity (correlation maxima across time series), we did not find a significant difference (t = −0.49, p = 0.6) between the ASD group (M = 0.92) and the TD group (M = 0.93).
Discussion
Our study is the first to investigate the temporal dynamics of functional connectivity in ASD using fcMRI and to relate the common finding of underconnectivity from static fcMRI studies to increased IIV across time. In two independent analyses, using first a selective high-quality (low-motion) subset from ABIDE and then an in-house dataset, we found that mean (static) iFC was negatively correlated with the variability (standard deviation) across time series in both ASD and TD groups, indicating that participants with high iFC levels showed the lowest levels of variability across time. More specifically, convergent evidence from both datasets showed that reduced static iFC in ASD (“underconnectivity”) was related to increased temporal variability. Selecting an ROI pair (PCC-mPFC), for which underconnectivity findings have converged in the literature (Abbott et al., 2015; Assaf et al., 2010; Doyle-Thomas et al., 2015; Monk et al., 2009; von dem Hagen et al., 2012; Washington et al., 2013), mediation analysis showed that reduced static iFC was significantly impacted by increased temporal variability. The research questions motivating the current study were thus mostly affirmed by our findings: (1) iFC variability across time was atypically increased in ASD for several ROI pairings, that is, for PCC–mPFC, L LP–mPFC, and L Thal–R Thal pairs in Study 1 and for PCC–mPFC pair in Study 2; and (2) group differences in static iFC were significantly impacted by differences in the variability of iFC across time. Our results thus indicate that reduced static iFC (underconnectivity) in ASD may, in part, reflect frequent fluctuations in mental state across time.
The findings suggest that the common observation of functional underconnectivity from fMRI studies in ASD (reviewed in Hughes, 2007; Just et al., 2012) may have to be re-examined. If underconnectivity is partially accounted for by variability across time (as shown here) and if underconnectivity is generally related to temporal variability (as shown for a large number of ROI pairs in two independent datasets; Figs. 1B and 3B), this implies that the most common finding in fcMRI studies of ASD may, in part, reflect dynamic aspects of neuronal activity that have been neglected in the large autism fcMRI literature thus far. More specifically with regard to the commonly used resting-state fcMRI approach and the specific findings for DMN hubs in PCC and mPFC, our results imply that—rather than being broken or consistently reduced—connectivity simply varies more substantially between periods of high iFC levels (close to those found in TD brains) and those of unusually low iFC levels. This interpretation was also supported by our analyses of iFC peaks, across entire time series, which suggested that people with ASD reach normal or near-normal levels of iFC at some point(s) during c. 6 minutes of scanning, whereas comparably high levels are maintained more consistently in neurotypical people (see also examples in Fig. 5). In our interpretation, this implies that in ASD the neural architecture supporting the connections in question, rather than being grossly deficient, may not function at high levels as consistently as in the TD brain.
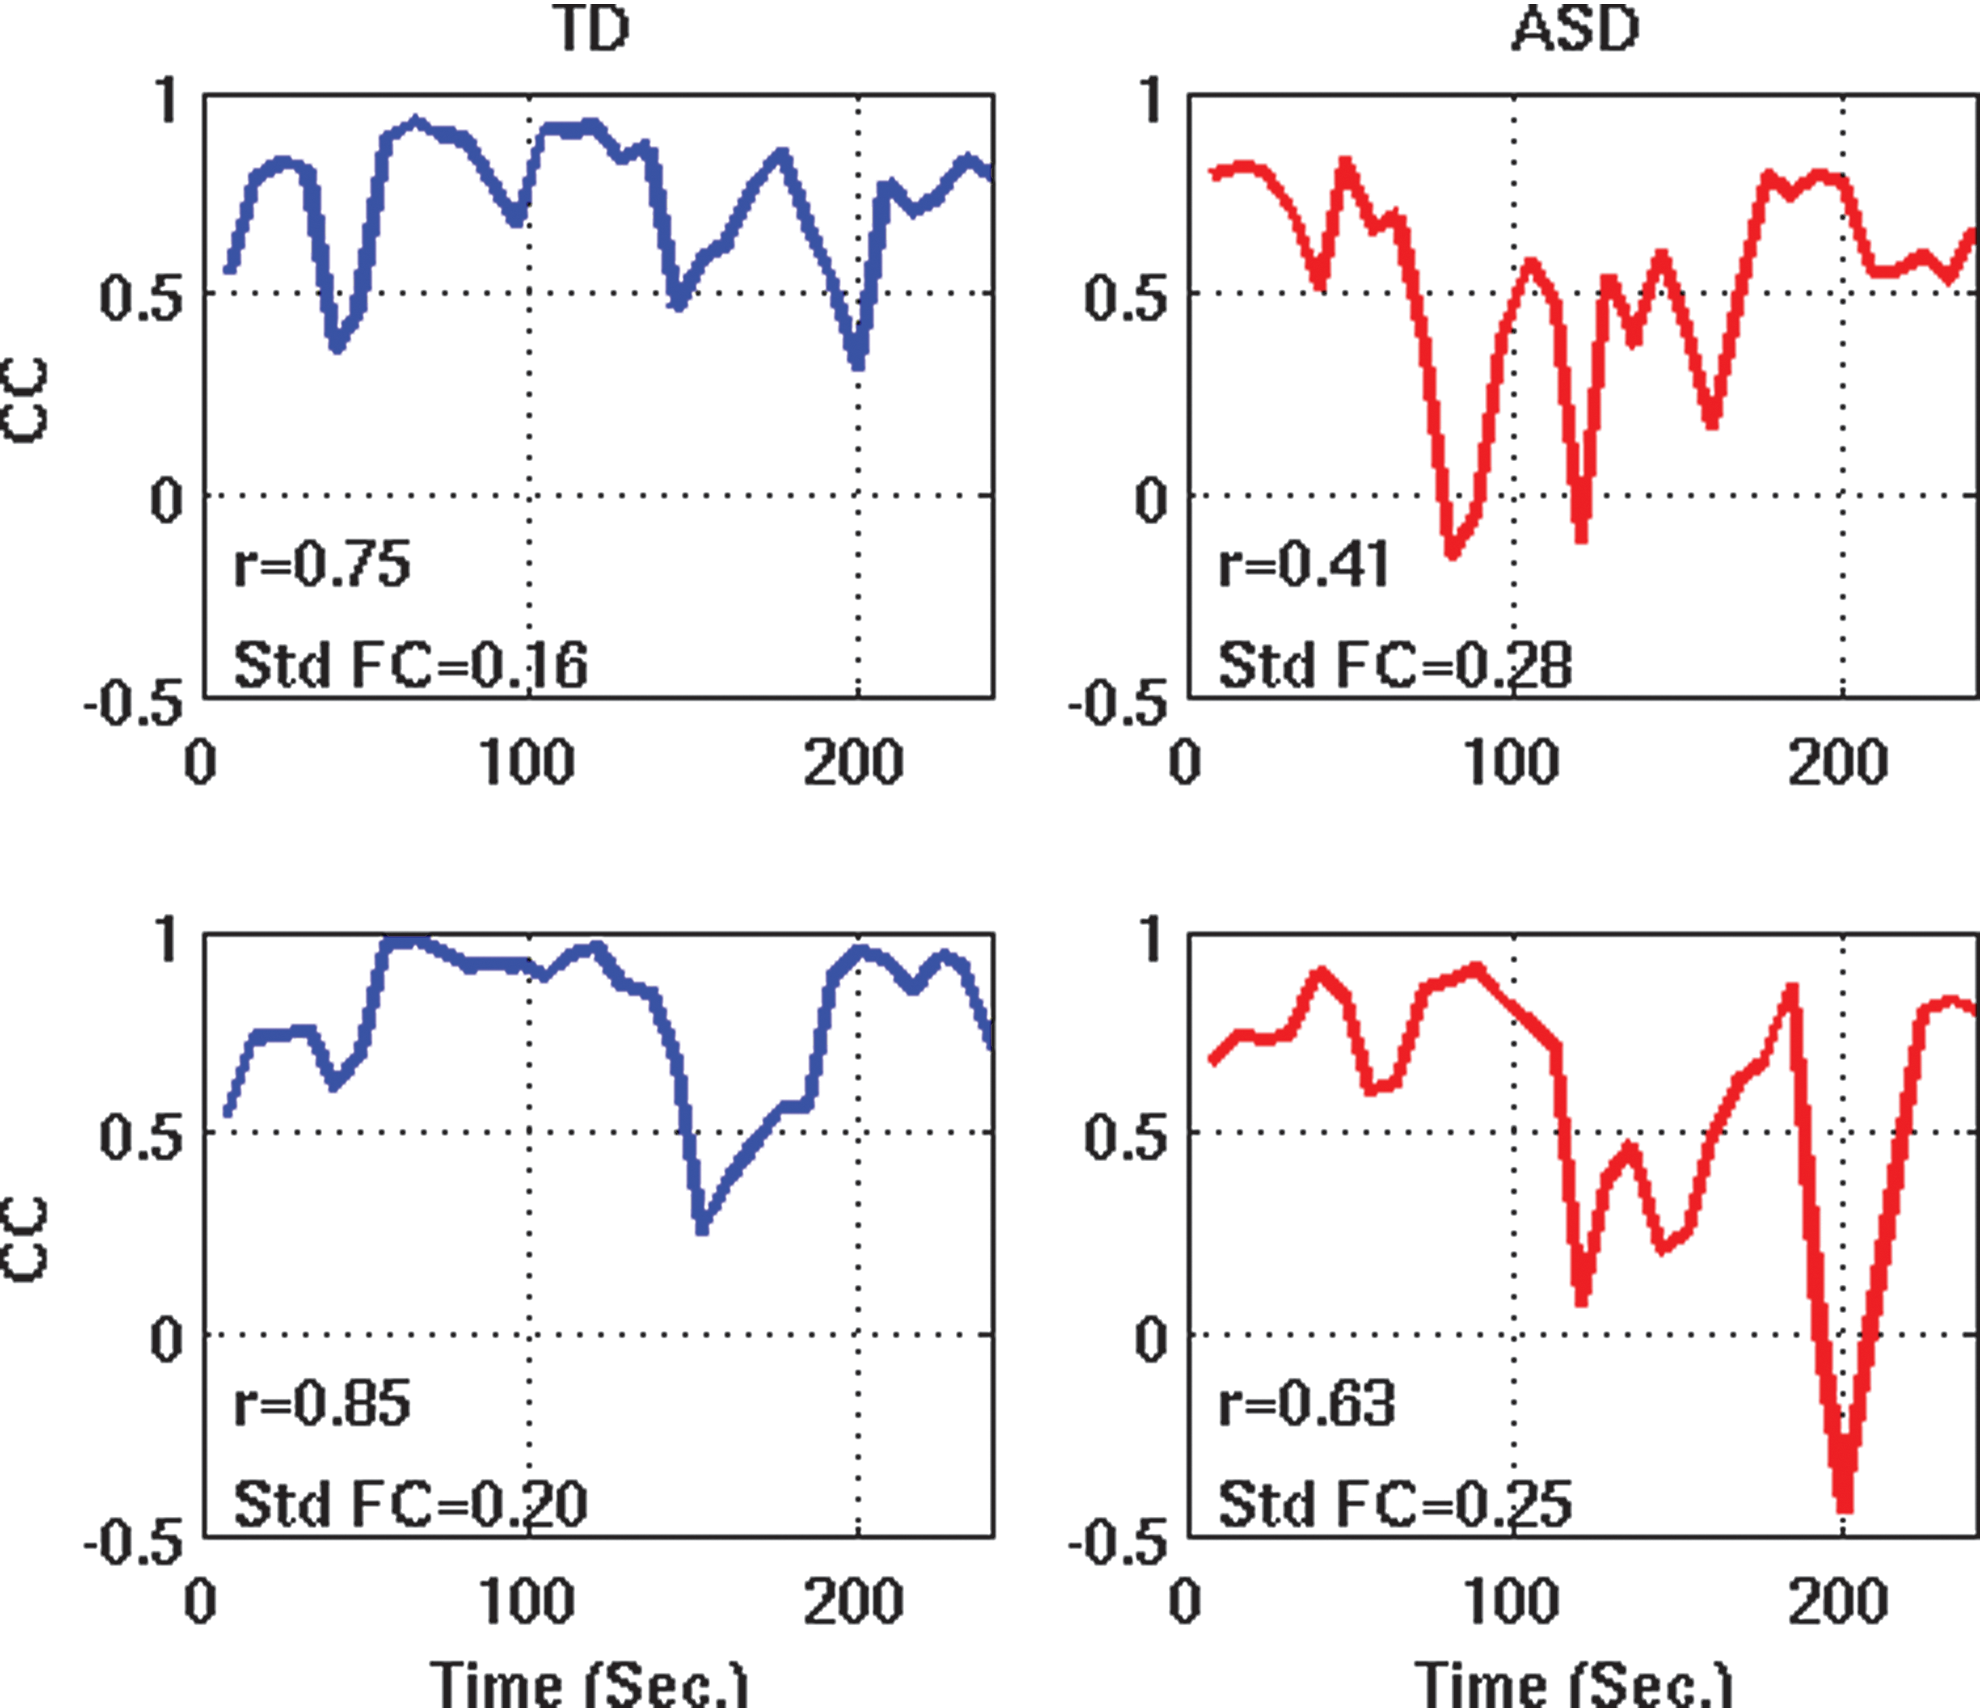
Sliding window correlation time series between PCC and mPFC for two representative participants from each group. Color images available online at
However, for full corroboration, data with higher temporal resolution (shorter TR) may be needed. In the present study, sliding windows were rather wide (30 sec) to ensure adequate power (15 time point measurements per window). Expected (but unresolved) variability within these wide windows would have lowered the detected peak iFC in ASD participants, resulting in lower groupwise mean of these peaks, compared to the TD group. Indeed, the limited temporal resolution of our sliding window analyses leaves open the possibility that the impact of temporal variability on static underconnectivity findings may have been substantially underestimated. Temporal variability may, in fact, fully account for static underconnectivity in ASD, but this hypothesis can only be tested with fMRI data acquired at much shorter TR or with electrophysiological techniques, such as magnetoencephalography.
Our findings are consistent with some previous reports of increased IIV in ASD, which has been shown for behavioral measures (Geurts et al., 2008), as well as for fMRI BOLD responses (Dinstein et al., 2012; Haigh et al., 2014) and evoked EEG responses (Milne, 2011) to sensory stimuli. However, they are also different and novel in important ways. First, whereas previous work has focused on trial-by-trial variability of stimulus-driven responses, our findings suggest comparable IIV in ASD for spontaneous (nonstimulus-driven) BOLD fluctuations. Second, our findings show that IIV does not only affect regional activity, but also interregional cooperativity. This indicates that underlying neural mechanisms may be shared between trial-by-trial IIV and IIV of iFC. It has been shown that DMN deactivation (Anticevic et al., 2010; Hinds et al., 2013) and strength of anticorrelation between DMN and task-positive networks (Kelly et al., 2008) are positively correlated with task performance. More general evidence suggests that intrinsic neuronal fluctuations captured in iFC are functionally relevant, impacting trial-by-trial variability of both BOLD and behavioral responses (Fox et al., 2006, 2007; Mennes et al., 2011). These findings imply that greater variability of iFC states in ASD, as detected in the present study, may have serious functional implications, affecting the brain's readiness for cognitive and sensorimotor processing. Indeed, IIV of behavioral and neural responses has been observed in different types of disorders and may be indicative of subtle anomalies in gray matter, WM connectivity, or modulatory (e.g., dopaminergic) control systems (MacDonald et al., 2006).
It should be noted, however, that BOLD changes measured in a resting state probably reflect a mixture of intrinsic fluctuations and online cognitive processing or mind-wandering. It has been acknowledged (Buckner et al., 2013) that resting-state fMRI actually involves tasks (not thinking of anything in particular, not moving, not falling asleep, etc.), and performance on any of these may differ between TD and ASD cohorts. Head motion can be measured, but other aspects such as mind-wandering are hard or impossible to monitor. While implementation of resting states in fcMRI has been empirically productive, with strong evidence of validity and reliability (Buckner et al., 2013; Honey et al., 2009; Shehzad et al., 2009; Van Dijk et al., 2010), the fact remains that its use violates fundamental principles of experimental psychology (e.g., tight control over strictly defined task conditions). With the exponential growth of the fcMRI literature in ASD, it has often been overlooked that crucial methodological basics are not fully established (Nair et al., 2014). The field has made great advances, but it is easy to overlook that some of the very first steps have never been taken. In other words, the field of ASD connectivity research has embraced resting-state fcMRI in the absence of a complete understanding of what happens in the brains of people with ASD when they are in a task-free and ill-defined, but constrained and uncomfortable situation, how this may differ from what happens in neurotypical control participants, and how such differences might affect iFC measurements. The present study makes one step toward this goal, by showing that IIV across time contributes significantly to abnormalities detected in static iFC studies.
Our study had a number of limitations. Aside from issues related to low temporal resolution of dynamic iFC analyses, as discussed above, the need for participants who hold very still during several minutes of scanning restricts inclusion mostly to people at the higher-functioning end of the autism spectrum. Abnormalities in lower-functioning people with ASD may not be simply more severe, but may differ qualitatively. Recent development of fMRI protocols with greater protection from motion artifacts (Olafsson et al., 2015) may permit inclusion of lower-functioning participants in the future. In addition, limitations of data available from ABIDE created trade-offs between data quality, time series length, and sample size. In particular, 4-min time series used in the primary analysis were shorter than in previously published dynamic fcMRI studies. Although this may be problematic, our main findings were replicated in supplementary analyses using only longer 6-min time series. It is further notable that group differences in functional connectivity, as shown in Figures 1A and 3A, were not robust enough to survive correction for large numbers of comparisons within the entire ROI matrix. This may be attributed to several factors combined: First, iFC abnormalities in ASD may be generally not very pronounced when strictly quality-controlled and motion-matched datasets are used (Tyszka et al., 2014). Second, the use of ROIs from established parcellation schemes is pragmatically advantageous, but locally specific group differences in iFC may be watered down when time series across numerous voxels are averaged within each ROI. Specifically with respect to ABIDE, the use of multisite data may have further weakened effects due to added factors of variability (related to different scanners, protocols, cohort demographics, etc.).
A growing number of iFC studies have reported static overconnectivity in ASD (e.g., Abbott et al., 2015; Di Martino et al., 2011; Fishman et al., 2014; Khan et al., 2015; Supekar et al., 2013). ROI pairs tested in the present study did not show robust overconnectivity and the dynamic aspects of such effects could thus not be investigated here. The question whether overconnectivity also reflects differences in temporal variability in ASD therefore remains open.
Conclusion
In this fcMRI study investigating dynamic functional connectivity changes across time, we found that commonly reported underconnectivity in ASD is, at least in part, driven by greater variability across time. Connections that appear reduced may thus not be broken in ASD, but simply subject to more frequent changes across several minutes of fMRI scanning.
Footnotes
Acknowledgments
This work was supported by Grants from the National Institutes of Health: R21 MH102578, R01 MH081023, and K01 MH097972 (PI: I. Fishman). The authors thank the participants and parents.
Author Disclosure Statement
No competing financial interests exist.
References
Supplementary Material
Please find the following supplemental material available below.
For Open Access articles published under a Creative Commons License, all supplemental material carries the same license as the article it is associated with.
For non-Open Access articles published, all supplemental material carries a non-exclusive license, and permission requests for re-use of supplemental material or any part of supplemental material shall be sent directly to the copyright owner as specified in the copyright notice associated with the article.