
Abstract
The dorsal anterior cingulate cortex (dACC) and the anterior insulae (AIs) are coactivated in various perceptual decision-making (PDM) tasks and form the salience network (SN): a key network in sensory perception and the coordination of behavioral responses. However, what the functional role of SN is, how these key SN nodes interact with each other to form a network in a perceptual decision, and how the network depends on the perceptual difficulty remain largely unknown. In the present study, we measured blood oxygen level-dependent (BOLD) signals using functional magnetic resonance imaging (fMRI). During four PDM tasks (1) face–house discrimination, (2) happy–angry face discrimination, (3) audiovisual asynchrony and synchrony perception, and a (4) random dot motion direction task, we varied the task difficulty and examined the interactions between these SN nodes. In all the experiments, behavioral accuracy decreased and response time increased with task difficulty. The BOLD signal increased in SN nodes with the ambiguity in the sensory information. We also found that there were significant directed functional connections between AIs and dACC in all four tasks and that the interactions between these nodes increased with task difficulty. The observed difficulty-dependent functional architecture of SN suggests that the dACC and AIs are part of a large-scale cognitive system that facilitates sensory integration in PDM.
Introduction
T
The dACC has long been implicated as a motor region due to its activation during movement (Paus, 2001; Picard and Strick, 1996). The dACC is also known to be associated with goal-directed action selection (Dosenbach et al., 2007; Medford and Critchley, 2010; Zysset et al., 2006). For example, dACC is found activated in reward-based action selection (Holroyd and Yeung, 2012; Rushworth et al., 2007). Lesions of dACC can hinder initiation of complex voluntary movements and actions (Rushworth et al., 2004; Williams et al., 2004) and cause increased and more variable response times (RT) in humans (Stuss et al., 2005), and cingulotomy patients usually recover most of these functions (Dougherty et al., 2002). In nonhuman primates, lesions result in impaired attention to task demands and disrupted task switching (Rushworth et al., 2003). Moreover, a recent study found that lesions of the white matter bundles projecting to and from dACC resulted in poor task performance (Metzler-Baddeley et al., 2012). Effects are due to the dACC role in top–down modulation of primary motor cortex (Taylor et al., 2007).
The AIs have been shown to be involved in cross-modal perceptual integration (Bushara et al., 2001; Chang et al., 2013; Ho et al., 2009; Lewis et al., 2000; Sterzer and Kleinschmidt, 2010). In addition, the blood oxygen level-dependent (BOLD) activity in AIs has been found correlated with difficulty of sensory cues in a PDM task (Lamichhane and Dhamala, 2015b). When the ambiguity in sensory information increased, this would increase the task difficulty level and people would be uncertain for selecting and deciding the appropriate action (Ho et al., 2009; Shenhav et al., 2013; Woolgar et al., 2011). For optimal performance, such uncertainty must be resolved (Botvinick et al., 2001), such as through AI integration of choice and guide dACC to choose appropriate behavior (Ho et al., 2009; Krebs et al., 2012; Rushworth et al., 2004; Srinivasan et al., 2013; Venkatraman et al., 2009; Wiech et al., 2010; Woolgar et al., 2011).
In this study, participants underwent functional magnetic resonance imaging (fMRI) while completing four PDM tasks: (1) face–house discrimination, (2) happy–angry face discrimination, (3) audiovisual asynchrony and synchrony perception task, and a (4) random dot motion (RDM) direction task. Here, task 3 involves both audio and visual stimuli, which provides us the opportunity to examine and explore the PDM in multi (bi-) sensory domain, whereas other three tasks involve only visual stimuli. These altogether allows us to investigate general brain mechanisms for decision-making across a wide range of tasks with different stimulus types and features. These four tasks were commonly used in the past decade to investigate PDM processes in the brain and all of the tasks involve decisions about two alternative choices and stimulus-noise-dependent behavioral performance variations. Across all of these tasks, we aimed to uncover the existence of a common network pattern for PDM and the network activity changes as a function of task difficulty. The rationale of difficulty manipulation is to examine how the noise level in stimuli influences nodal activity and network interactions among the nodes of SN. A recent work (Lamichhane and Dhamala, 2015b) showed that the activity of SN nodes is positively correlated with task difficulty. An increased engagement of SN in difficult task was proposed as neural signature of higher effort in sensory integration salience to task at hand (see Ham et al. (2013)) for a different opinion]. This finding prompted a question: is the SN functional architecture dependent on task difficulty? If so, how are nodes of the SN engaged to form perceptual decisions? We predicted a higher node and network-level activity within SN as required for stimulus salience integration in choosing appropriate motor command caused by ambiguity in sensory information (Ho et al., 2009; Krebs et al., 2012; Rushworth et al., 2004; Shenhav et al., 2013; Srinivasan et al., 2013; Venkatraman et al., 2009; Wiech et al., 2010; Woolgar et al., 2011). In addition to the findings of previous studies on the insula, a key structure in PDM (Binder et al., 2004; Grinband et al., 2006; Ho et al., 2009; Ploran et al., 2007; Tregellas et al., 2006) and a cortical “out flow hub” to influence dACC activity (Ham et al., 2013; Menon and Uddin, 2010; Sridharan et al., 2008), we aimed to provide additional evidence on its role in sensory integration and sensory motor mapping in coupling to dACC, a region known to have a major role in motor selection. Moreover, we explored how network interactions are modulated by decision difficulty across a variety of perceptual tasks in moment-to-moment integration of sensory information in PDM.
Materials and Methods
Participants
There were 32 human participants (16 males, 16 females; mean age ± standard deviation = 27.6 ± 4.7 years) who completed all four experimental tasks: (1) face–house discrimination, (2) happy–angry face discrimination, (3) audiovisual asynchrony/synchrony perception, and (4) an RDM direction discrimination task. One more male participant took part in face–house discrimination and in audiovisual asynchrony and synchrony perception tasks. Each participant visited for two MR scanning sessions on 2 different days within a 7-day period. Participants completed tasks 1 and 3 in the first visit, and tasks 2 and 4 in the second visit. Both behavioral data (performance accuracy) and fMRI data associated with the corresponding tasks were all collected. Behavioral data (performance accuracy and RTs) were collected outside the scanner first, and then, the behavioral data (performance accuracy) and brain data were collected inside the scanner. All participants had normal or corrected to normal vision and reported normal neurological history. No participant reported difficulties recognizing red and green dots during practice session hence no red/green color blindness was reported. Participants provided written signed informed consent forms and were compensated for their participation in the experiments. Institutional Review Board for Joint Georgia State University and Georgia Institute of Technology Center for Advanced Brain Imaging, Atlanta, Georgia, approved these studies.
Stimuli
Experiment 1: face–house discrimination task
In the face–house discrimination task, a total of 14 images of faces and 14 images of houses were downloaded from F.A.C.E. Training—an interactive training by Paul Ekman (
The visual stimuli (faces and houses) subtended 4.34° by 6.08° visual angles (see, Lamichhane et al., 2016).
Experiment 2: happy–angry face discrimination task
In the happy–angry face discrimination task, two sets of human face images, a happy set and an angry set, were used as stimuli. Each set consisted of eight images (four males and four females), which were degraded and subject to additional noise to make two stimulus categories: clear image category (0% noise) and a noisy image category (40% noise), which formed the variables of interest. The two noise levels were decided to make the task difficult at or above 70% behavioral accuracy, with similar piloting procedures mentioned earlier in the face–house experiment. Thus, fMRI analysis was carried out based on noise level, rather than the happy or angry face categories investigated in a previous study (Bajaj et al., 2013).
Experiment 3: audio-visual asynchrony and synchrony perception task
In the audio-visual discrimination task, we used pairing of a single auditory stimulus, a 440-Hz–30-ms tone, and a visual stimulus, a 30-ms yellow-red disc flash (0.7 cm radius). Here, the flash of light (visual stimuli) was presented at the central position on the computer screen and the beep sound (auditory stimuli) was delivered through a pair of earphones, one on each ear. The actual behavioral run outside the scanner was conducted after we identified the point of subjective simultaneity, that is, how far apart in time the asynchronously presented audio and visual pair could be perceived as synchronous (for detail, see (Lamichhane et al., 2015b)). For this purpose, we presented audio and visual stimuli with a systematically varying asynchrony lag of 66.6, 83.3, 100, 116.6, 133.3, 150, and 166.6 ms, 20 trials for each lag totaling 140 trials. The choice of these lags was based on the previous studies at which humans can detect audiovisual asynchrony (Pons et al., 2014; van Eijk et al., 2008; van Wassenhove et al., 2007; Zampini et al., 2005; Zampini et al., 2003). The inter-trial interval (the pause, τ, based on the previous studies) was chosen randomly between 1000−1160 ms. We looked at the fraction of the trials from this run and chose the time lag (ΔT), as a threshold value, in which performance accuracy was 50:50 or close to it for the trials that were perceived as synchronous or asynchronous. For the recordings outside and inside the scanner, the time lags (ΔT) were varied beyond the individual's threshold value for audio-visual simultaneity with an increment between −16.6 ms and +16.6 ms and, for an fMRI session, τ was 1666–1926 ms.
Experiment 4: RDM direction discrimination task
In the RDM direction discrimination task, randomly moving noisy field of dots were used as stimuli and were presented within a circular aperture at the center of screen. In RDM, the coherence level was determined by the percentage of dots moving in the left or right direction while the remaining dots were moving in the random direction. The dot motion was induced by redrawing dots at a neighboring spatial location after 50 ms within black background circular aperture of 7.5 cm diameter for 34 ms in which dot appeared to move between 3° and 7°/s and at a density of 16.7 dots per deg2/s.
We manipulated task difficulty level by mixing red and green dots in our RDM. First, we varied the proportion of the dots that are either moving to the left or right independent of color. Second, out of two colors, we assigned the green color for the dots that are moving in particular direction (either to the left or right direction only) and red to the dots that were moving in a random direction. With this manipulation we introduced three coherence levels in RDM (12%, 20% and 100%) in both color coherence (C) and color incoherence (IC) conditions. For example, in 20% C, the 20% of dots were green and all moved in one direction (left or right) while the 80% of dots were red and moved in random directions. Similarly, in 20% IC, RDM still consisted of 20% of green and 80% red dots. However only 20% of dots independent of color were moving in a particular direction while the remaining 80% were moving in random directions. However, in 100% C and IC (50% red dots and 50% green dots), all moved in one direction, so we refer to this stimulus condition simply as 100% (for greater details, see (Lamichhane et al., 2016).
The stimuli features are displayed in (i) of A, B, and D in Figure 1 and details about trial sequence are shown in (ii) of A, B, D, and in C (Fig. 1) for these tasks.
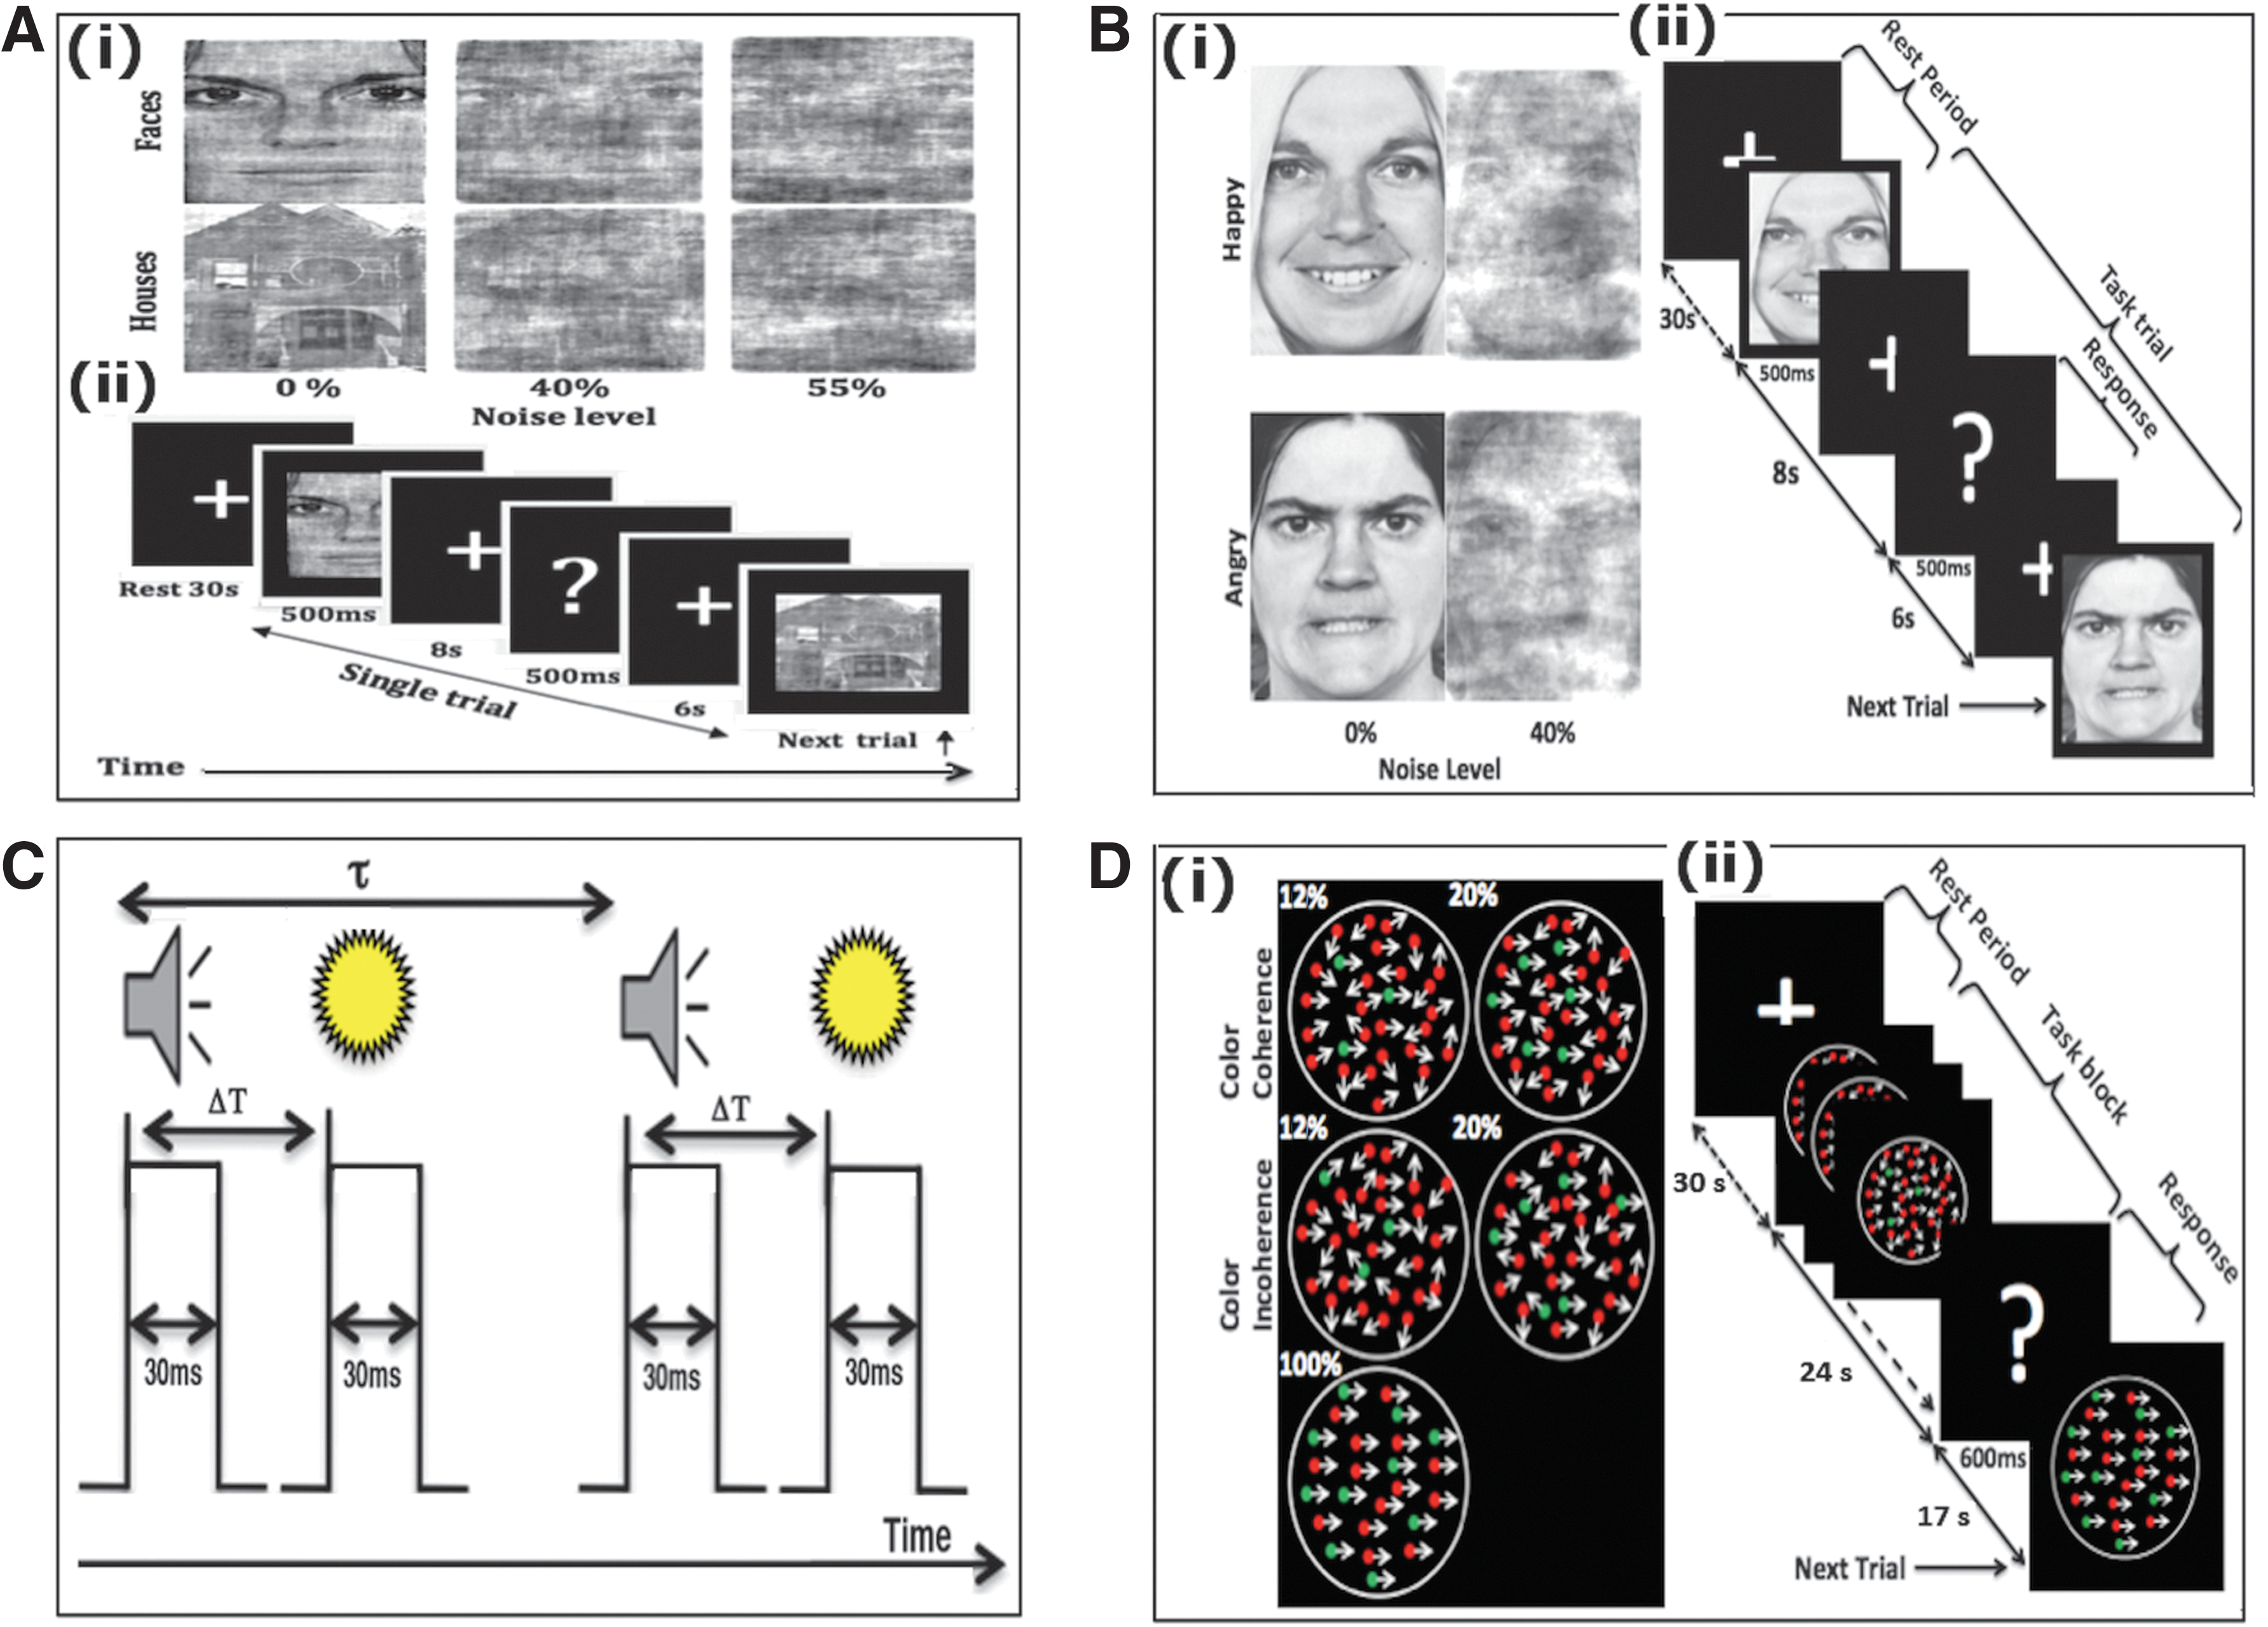
Experimental paradigms.
Data acquisition and analysis
In all of our experiments, data were collected in two separate sessions: the first session involved acquiring behavioral data (behavioral performance and RT) outside the MRI scanner and the second session was inside the scanner where we acquired both fMRI data and behavioral performance. Subjects indicated their decisions by keyboard presses outside the scanner and button presses on a response box inside the MRI scanner. Outside the MRI scanner, participants were seated about 70 cm away from the computer screen used to present the stimuli and indicated their decisions as quickly and as accurately as possible by left/right mouse clicks and pressed the space bar in the computer keyboard to proceed to the next trial. Inside the MRI scanner, they were required to focus on the central crossbar, perceived the presented stimuli, waited for the display of a question mark on the screen, and then indicated their choice by pressing the left/right key on a button box with either their right index or middle finger. This was to avoid recruiting brain motor response along with the PDM-related brain areas. Thus, we recorded RT only outside the scanner. The stimulus software presentation (
In the face
Outside the fMRI scanner
In face–house discrimination task, the behavioral study consisted of a single run. There were three noise-level conditions and each condition was repeated 60 times (30 times each for faces and houses) in a random order, generating 180 trials in total. In happy–angry face discrimination task, we have one functional run where each condition (clear and noisy condition) was presented 60 times (30 times each for happy faces and for angry faces) in a random order, totaling 120 trials. In audiovisual asynchrony and synchrony perception task, the pair of stimuli was presented 60 times, 20 at each ΔT. In RDM direction discrimination task, RDM stimuli with identical parameters (12% and 20% C, 12% and 20% IC, 100%) were presented for 1 sec as a single event and consisted of a single run. Each condition was presented 30 times, totaling 180 trials. Both behavioral performance and RT were recorded outside the scanner.
Inside the fMRI scanner
Inside the fMRI scanner, fMRI data were acquired and behavioral responses were recorded. Each functional session started with 30 sec of initial rest and ended with 35 sec of final rest. Participants performed face–house categorization tasks in three functional runs, each 614 sec long, the number of trials for each noise-level condition was 36 (18 faces and 18 houses), and there were a total of 108 for all three conditions in each run. Stimuli were presented in a random order as in an event-related design within each run. In happy–angry face discrimination task, subjects performed two functional runs; each of 674 sec long and the total number of trials was 80, that is, 40 trials for each condition (clear and noisy).
In audiovisual asynchrony and synchrony perception task, data were recorded in a single functional run, there were 24 multisensory (both a flash of light and a beep sound) task blocks and 8 unisensory (either a flash of light or a beep sound) task blocks, and within a block, given stimuli were presented eight times. Similarly, in RDM direction discrimination tasks, there were 12 trials for each condition (RDM with identical parameters either 12%, 20% C or 12%, 20% IC and 100% presented for 15 consecutive times, for the total of 24 sec, in a block), all together 72 trials inside the scanner in two sessions. In this task, we did not find any statistical significant difference on behavioral response and RT between 12% and 20% C and IC stimulus conditions. We then combined the data and used three stimulus conditions: 12% and 20% C, 12% and 20% IC, and 100% for further analysis. The experimental details of these four tasks are provided in Table 1.
n, number of participants; m, mean age; F, female; M, male; SOA, stimulus onset asynchrony; ±values, standard deviations.
Participants' behavioral performance, both outside and inside the scanner, was analyzed by using MATLAB. Trial by trial RTs of each participant from outside scanner button presses were separated and averaged across noise level in each task condition. No RT calculation was done for the recorded behavioral data inside the scanner. Paired t-tests were used to assess the significance levels of performance accuracy and RT across noise levels.
fMRI data
The whole-brain MRI was done on a 3-Tesla Siemens scanner available at the Georgia State University and Georgia Institute of Technology Center for Advanced Brain Imaging, Atlanta, Georgia. High-resolution anatomical images were acquired for anatomical references using a magnetization-prepared rapid gradient-echo sequence (with repetition time [TR] = 2250 msec, echo time [TE] = 4.18 msec, flip angle = 9°, inversion time = 900 msec, voxel size = 1 × 1 × 1 mm3). The functional scans were acquired with T2*-weighted gradient echo-planar imaging protocol with the following parameters: TE = 30 msec, TR = 2000 msec, flip angle = 90°, voxel size = 3 × 3 × 3 mm3, field of view = 204 × 204 mm, matrix size = 68 × 68 and 37 axial slices each of 3 mm thickness. MRI data were analyzed using Statistical Parametric Mapping (SPM8; Wellcome Trust Center, London,
At the first level, a separate general linear model (GLM) was specified according to the task sequences and behavioral responses for each participant. Only correct trials for each condition (noise levels: 0%, 40%, 55% in face–house discrimination task; 0%, 40% in happy–angry face discrimination task; asynchrony and synchrony conditions in audiovisual asynchrony and synchrony perception task; 12% and 20% C and IC, and the 100% condition in RDM direction discrimination task), rest and six motion parameters were included in GLM analysis. We restricted our analysis to correct trials because there were very few incorrect trials, especially in easy task conditions, which were not enough for reliable estimates of differences across conditions. The six motion parameters were entered as nuisance covariates and were regressed out of the data. Individual contrast images of all participants resulting from the first-level analysis were then entered into a second-level analysis for a separate one-sample t-test. The resulting summary statistical maps were then thresholded and overlaid on high-resolution structural images in MNI orientation. The activation clusters were identified under the statistical significance p < 0.05, familywise error (FWE) correction, for multiple comparisons correction, and cluster extent k ≥ 10; except in moving dot task where statistical significance was p < 0.01, FWE correction.
Connectivity analysis
The regions of interest (ROIs) were based on activation t-maps. We defined three ROIs, by generating a sphere of 6 mm radius in MarsBar (Brett et al., 2002), for the SN nodes. The center coordinates were (−6, 11, 52) for the dACC, (−30, 20, 4) for the left insula (lAI), and (33, 20, 4) for the right insula (rAI) in all tasks. These coordinates matched exactly or were very close to local maxima from the second-level group analysis of fMRI data (Table 2). The time courses from all the voxels within each ROI and all subjects were extracted for each experimental task for the aforementioned conditions. We performed Granger causality (GC) analysis to characterize the directional influences between ROIs.
The table above lists brain activations for various contrasts. It includes the information about the anatomical locations, cluster sizes, t-value (z-score), and MNI coordinates for the activations under statistical significance p < 0.05 familywise error correction, for multiple comparisons correction, and cluster extent k ≥ 10.
C, color coherence; IC, color incoherence; L, left; R, right; dACC, dorsal anterior cingulate cortex; dlPFC, dorsolateral prefrontal cortex; IFG, inferior frontal gyrus; IPL, inferior parietal lobule; MFG, middle frontal gyrus; MNI, Montreal Neurological Institute; MOG, middle occipital gyrus; MT, middle temporal cortex; SEF, supplementary eye fields; VC, visual cortex (occipital lobe).
Since fMRI-BOLD signals are believed to originate from smoothing of neuronal activity by the hemodynamic response function (Aguirre et al., 1998; Handwerker et al., 2004), we constructed hidden neural signals by hemodynamic deconvolution for each ROI data, as suggested in previous studies (David et al., 2008; Handwerker et al., 2004; Roebroeck et al., 2011; Valdes-Sosa et al., 2011; Wu et al., 2013). We used these deconvolved fMRI-BOLD time series for functional directed connectivity calculation. The ensemble mean removed segmented deconvolved time series from separate voxels and subjects were treated as trials for reliable estimates of the network measures. We calculated the frequency-dependent parametric GC spectra (Dhamala et al., 2008) for pairs of ROIs. GC spectra can be estimated by parametric and nonparametric methods (Dhamala et al., 2008). GC spectra from the parametric and nonparametric match very well when many data samples are collected (long time series and many trials) and appropriately modeled in the parametric approach. Theoretically, time series need to be modeled by infinite series of autoregressive processes. In practice, we have finite data points, but we still need to find an appropriate model order for a given data. As it is often difficult to find an appropriate model order for brain data with the traditional Akaike information criterion and Bayesian information criterion (Antzoulatos and Miller, 2014; Dhamala et al., 2008), when appropriately modeled, the parametric method yields GC values that have less bias for short time series data (please see the appendix of Dhamala et al., NeuroImage, 2008). To take advantage of both approaches, in this study, we determined the optimal model order for the parametric method using a method developed recently (Adhikari et al., 2014) by comparing the power spectra from nonparametric and parametric approaches at different model orders, and choosing the model order yielding the lowest power difference. From the parametric spectral GC, the time domain values were obtained by integrating the causality spectra over the entire frequency range. The significant GC spectra, and hence the significant network connections, were defined by setting a GC threshold above the random noise baseline. To compute the threshold value of GC, we constructed a set of surrogates by randomly permuting trial data from each subject and used a random permutation technique (Blair and Karniski, 1993; Brovelli et al., 2004). The threshold was thus based on the null hypothesis that there was no statistical interdependence between nodes when trials were randomized. We computed GC spectra from all possible pairs of ROIs with a minimum of 1000 random permutations and picked maximum GC on each permutation. By fitting the distribution with a gamma distribution function (Dhamala et al., 2008), we obtained the threshold for GC spectra at significance p < 10−3 from the ROIs from each experiment separately. This threshold GC was used to identify significantly active directed network activity among three ROIs calculated in pairwise GC analysis. We have also performed the conditional GC analysis and ruled out the interactions that were found mediated by another node, if any. We computed the time domain GC values for significantly active network directions and performed paired t-tests on these values to find the significant network modulation in our tasks by different noise levels in the task stimuli.
Results
Behavioral response
In the face–house discrimination task, the mean performance accuracy rate decreased with noise outside of the scanner 99.3% ± 1.3% (0% noise), 89.5% ± 7.3% (40% noise), and further to 68.5% ± 7.9% (55% noise). Values ± represent the standard deviations throughout the article. Similar decreases occurred inside the scanner (97.9% ± 3.4%, 87.0% ± 7.9%, and 65.1% ± 9.8%). Accuracy decreased significantly with noise level (p < 0.001; Fig. 2A). RTs significantly increased with noise level (p < 0.001). The mean RTs were 0.79 ± 0.17 sec (0% noise), 0.94 ± 0.22 sec (40% noise), and 1.13 ± 0.28 sec (55% noise; Fig. 2A).

Behavioral results.
In the happy–angry face discrimination task, participants correctly responded with an average rate of 98.9% ± 2.2% for clear images, with 86.4% ± 8.3% for noisy images outside the scanner, and 97.7% ± 3.2% and 76.3% ± 11.9%, respectively, inside the scanner (Fig. 2B). More time was taken to respond to noisy images (1.07 ± 0.21 sec) compared to clear images (0.88 ± 0.17 sec). Behavioral accuracy decreased significantly with noise both inside and outside the scanner (p < 0.001). The addition of noise on images significantly increased RT (p < 0.001; Fig. 2B) in addition to significantly decreasing the performance accuracy.
In the audiovisual asynchrony and synchrony perception task, we categorized the behavioral responses based on participants' perception of asynchrony and synchrony. The mean performance rate outside the scanner was about 34% and 66% (±19.7%) for asynchrony and synchrony perception, respectively. Similarly, the mean performance rate inside the scanner was 41% and 61% (±17.6%). Discrimination among these percepts differs statistically both outside and inside the scanner (ps < 0.001). More time was taken to respond with the asynchrony perception (0.96 ± 0.30 sec) compared to synchrony perception (0.79 ± 0.20 sec; p < 0.01). These results are shown in Figure 2C.
In RDM direction discrimination task, participants' performance accuracy rates for correctly deciding the direction of randomly moving dots were 99.6% ± 1.4% for 100%, 81.8% ± 10.3% for combined 12%, 20% C, and 68.3% ± 9.7% for combined 12%, 20% IC outside the scanner. Inside the scanner, accuracies were 99.4% ± 2.4%, 97.7% ± 6.3%, and 92.7% ± 9.4%, respectively. Compared to 100%, combined 12%, 20% C and combined 12%, 20% IC conditions had significantly lower accuracies (p < 0.001) in the recordings outside the scanner, while inside the scanner, performance accuracy was significantly reduced (p < 0.001) in case of combined 12%, 20% IC in comparison with 100%. Furthermore, RT for the participants' to report their decision increased from 1.07 ± 0.33 sec (100% condition) to 1.23 ± 0.33 sec (C) and 1.25 ± 0.31 sec (IC). Behavioral accuracy was significantly greater (p < 0.001) and RT significantly lower (p < 0.001) for IC, C compared to 100% condition outside the scanner as shown in Figure 2D.
Brain response
In the face–house discrimination task, brain activations were computed by contrasting the difficult pictures (40% and 55% noise level combined and independent of faces and houses) versus clear pictures (0% noise level). We found significant brain activations in prefrontal cortices, left and right AI, dACC, listed in Table 2.
In happy–angry face discrimination task, bilateral AIs and dACC were found activated more by 40% noisy pictures compared to clear (0% noise) pictures, as shown in Table 2.
In audiovisual asynchrony and synchrony perception task, we contrasted asynchrony perception+synchrony perception to auditory (only beep)+visual (only flash). The significant brain activations were found in the dACC, AIs, bilateral middle occipital gyrus, inferior frontal gyrus, thalamus, and inferior parietal lobule, as shown in Table 2. In this study, we used GC techniques to study directed functional connectivity patterns within main SN nodes at the two-perception level (asynchrony and synchrony perception). One set of data was analyzed in a previous study (Lamichhane and Dhamala, 2015b) that used a different effective approach: dynamic causal modeling (DCM) to explore the effective connectivity in audiovisual perceptual task regardless of difficulty levels. In this work, we regarded detecting asynchrony and synchrony as two-task difficulty levels. This is based on previous studies (Adhikari et al., 2013; Dhamala et al., 2007; Lamichhane and Dhamala, 2015b; Stevenson and Wallace, 2013; Vatakis and Spence, 2006) that people find it more difficult to detect asynchrony compared to synchrony in audiovisual events.
In the RDM direction discrimination task, we have contrasted brain activity for 12% and 20% stimulus conditions (both C and IC) with that of the 100% condition. We found significant activation for bilateral visual cortex, middle temporal, insulae (AIs), frontal (dorsolateral prefrontal cortex, supplementary eye fields) and parietal (inferior parietal lobule) cortices and dACC, as shown in Table 2. All the activations shown in Table 2 were statistically significant for FWE correction, p < 0.05 and cluster-level threshold, k > 10; except in moving dot task where statistical significance was p < 0.01 (FWE). The coronal slice in Figure 4 shows activation in bilateral AIs and dACC.
BOLD response (contrast values)
We carried out the analysis to answer how node activity within the SN gets modulated with task difficulty (or with noise level for different stimulus conditions). We calculated region-specific beta values (β) from each participant for each stimulus condition for all the noise levels considered, in these tasks, and were averaged to produce average β from dACC, left insula (lAI) and right insula (rAI). The node activity, indicated by contrast values, was significantly modulated (p < 0.05) due to task difficulty, as shown in Figure 3A for the face–house discrimination task for three noise levels: 0%, 40%, and 55%; Figure 3B for happy–angry face discrimination task for 0% and 40% noise levels; Figure 3C for asynchrony perception and synchrony perception for audiovisual asynchrony and synchrony perception task, and Figure 3D for the RDM direction discrimination task for 100%, combined 12%, 20% coherently and combined 12%, 20% incoherently moving dots.
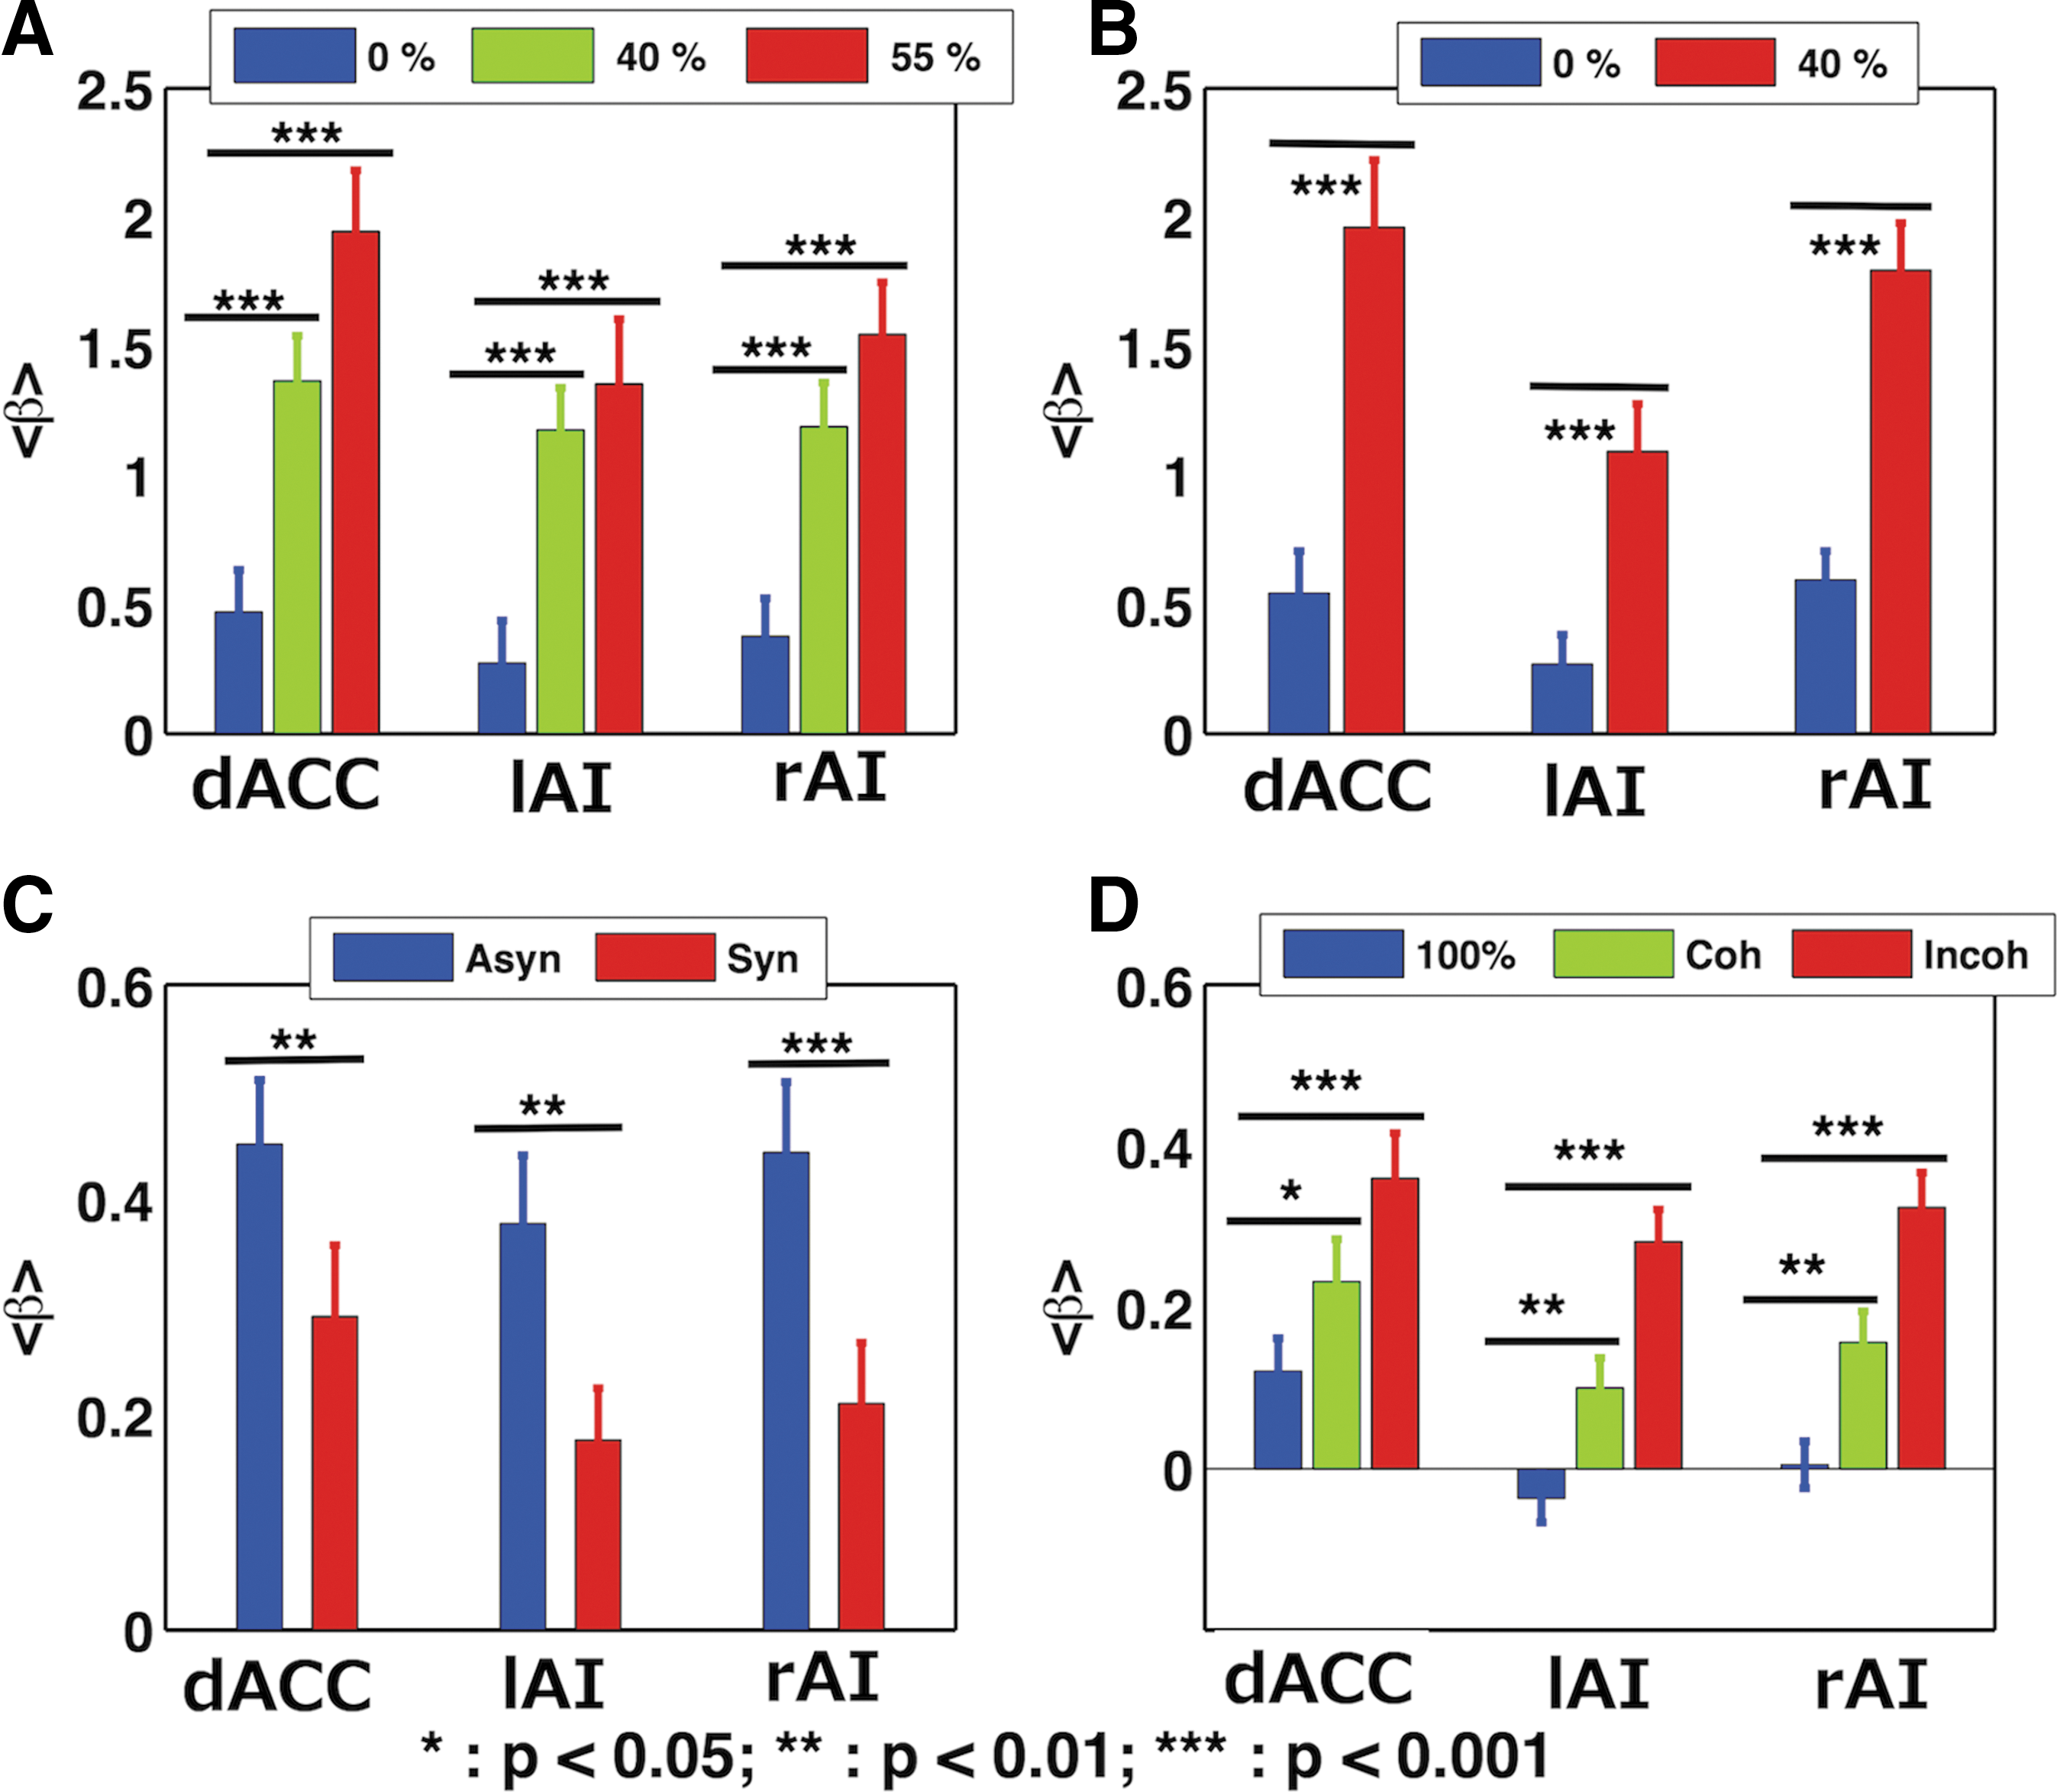
Mean contrast values: Contrast values (β) were calculated, for noise levels: 0%, 40%, and 55% face and house stimuli
SN activity
We computed GC spectra to assess oscillatory network interactions among the three nodes: dACC, lAI, and rAI that form the SN. GC (pairwise GC) spectra were calculated separately for different noise levels for each condition in all four tasks. At first, we used the permutation threshold criteria to find the significant causal interaction directions and then, the conditional GC to rule out the mediated interactions (details in Materials and Methods section). The significant causal connections among these three nodes are shown in Figure 4 by either a solid line or a dotted line (red or blue) with an arrowhead. The green dotted lines represent the directions of mediated interactions and are ruled out. For example, in Figure 4B, all the interaction directions are significant for clear (0% noise) and noisy (40% noise) happy–angry face images. Regarding solid lines, they represent the significant change in causal interactions when compared between conditions (noisy (40% noise) case when compared with clear (0% noise) case), as shown in Figure 4B. Green dotted line with an arrowhead (e.g., in Fig. 4C) represents the direction ruled out in asynchrony and synchrony perception conditions in audiovisual task. The node pointed to by the arrowhead receives the causal influence from the node the line starts from.
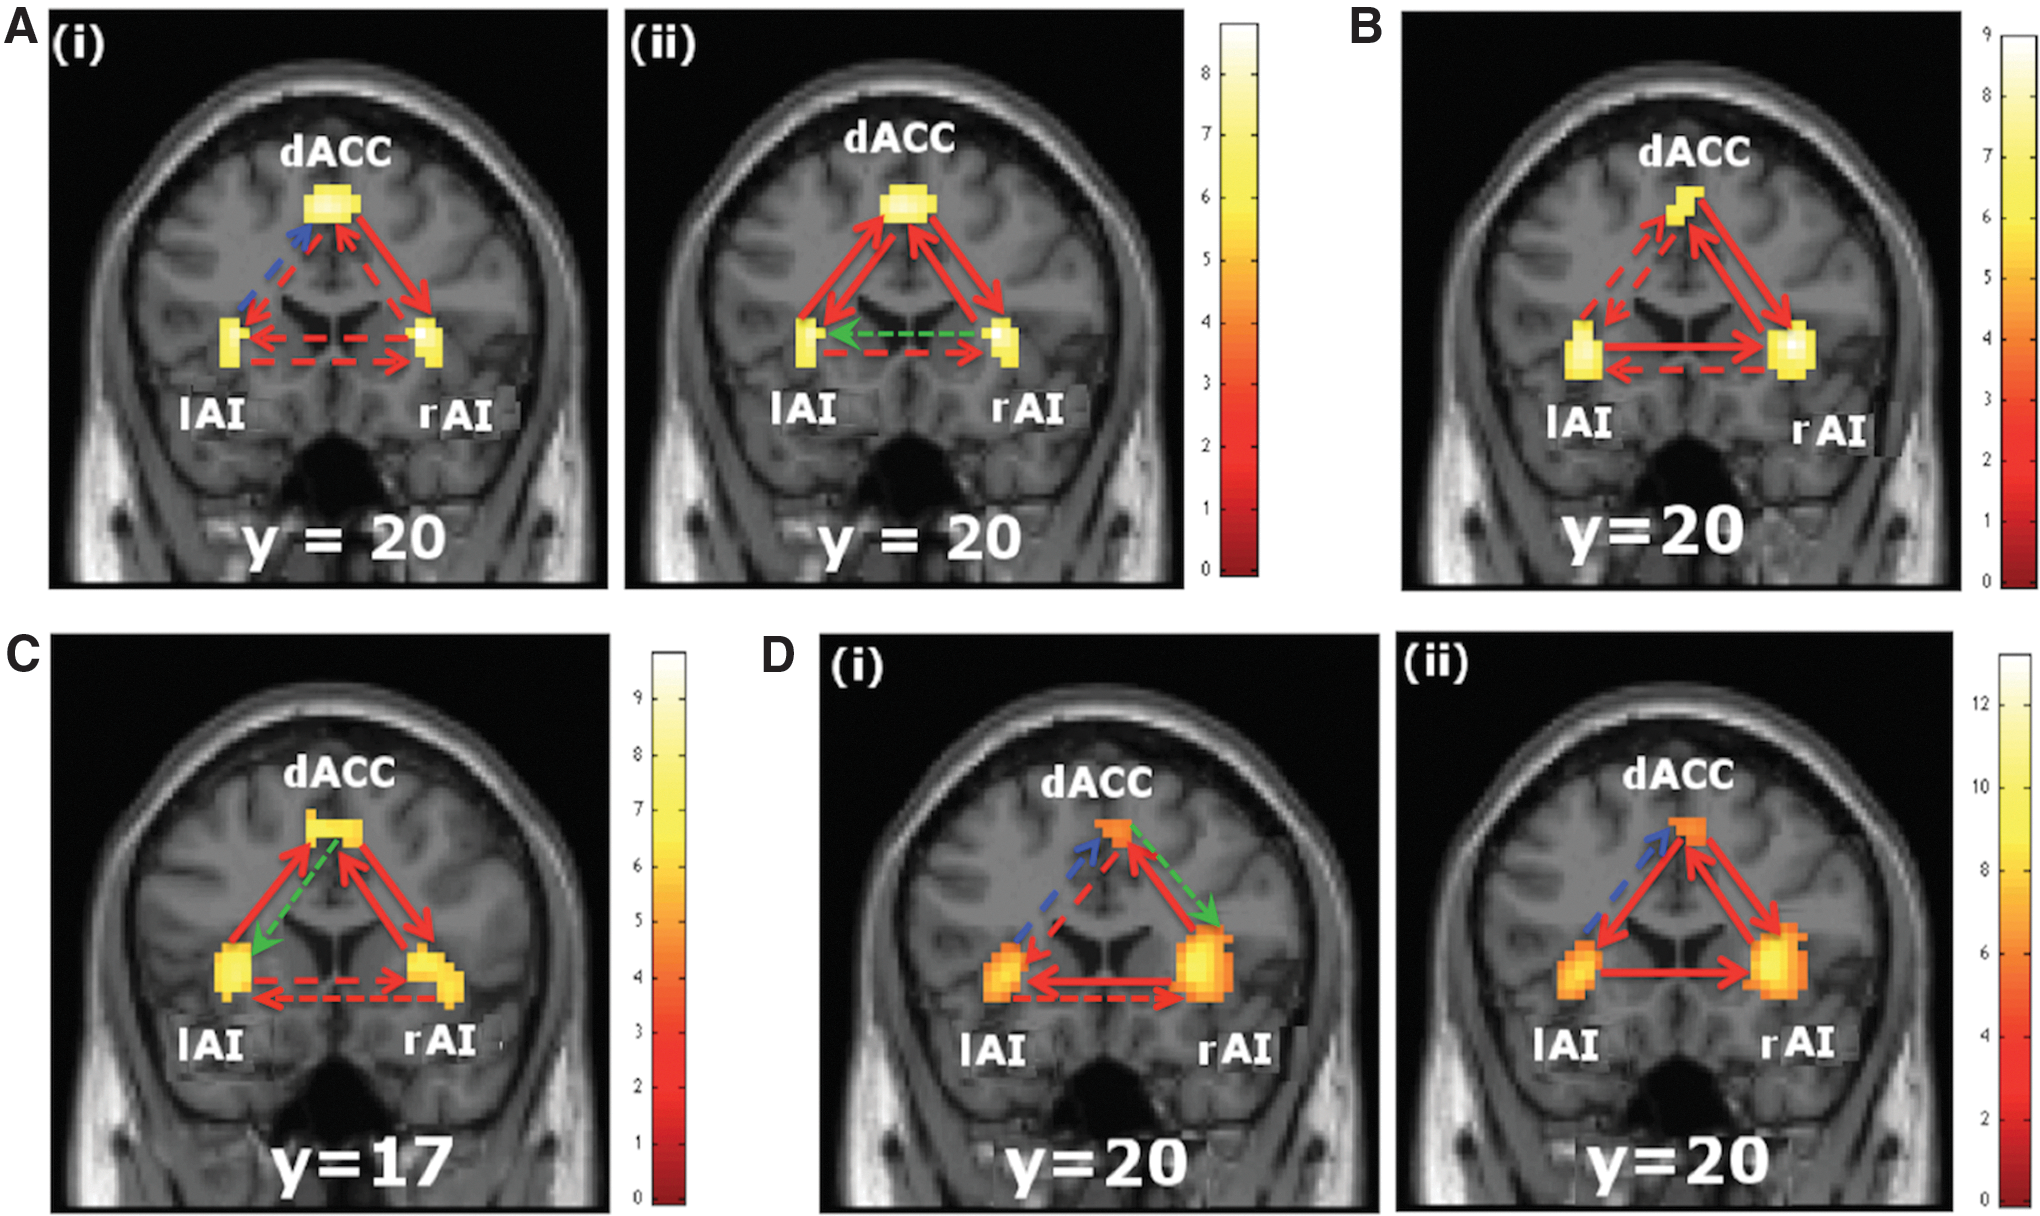
Salience network interactions: Significant causal interaction directions among three nodes, dACC, left insula (lAI), and right insula (rAI), during four perceptual tasks are shown. The significant causal connections as determined by using permutation threshold criteria and by ruling out the mediated interactions (as shown by green dotted line with an arrowhead) using conditional Granger causality analysis are shown either by a solid line with an arrowhead or dotted line with an arrowhead. Red solid line with an arrowhead represents an increase in causal interactions (p < 0.05), whereas the dotted line (red or blue) with an arrowhead represents insignificant change in interactions when the causal strengths between conditions were compared. Here, red/blue dotted lines represent the increased/decreased causal interactions.
Our interest was to find out how the causal interactions changed due to increased noise level in stimuli, which increased the task difficulty level. The time domain GC values calculated from the entire frequency range from all the subjects were compared across conditions for statistical significance using paired t-tests. Red solid lines with an arrowhead represent a significant (p < 0.05) increase in directed interactions. However, the dotted lines with an arrowhead are used to indicate that the results are insignificant, red dotted lines are for increase, and blue dotted lines are for decrease in GC, as shown in Figure 4. How GC values changed when the comparison was made between 40% noise-level and 0% noise-level face–house stimuli are shown in Figure 4A (i). The significant increase in causal influence was found to occur for the dACC to rAI. The bidirectional interactions between lAI and rAI, and lAI and dACC did not change significantly. The bidirectional causal interactions between dACC and lAI, and dACC and rAI increased significantly [Fig. 4A (ii)] when we compared the causal interactions for 55% noise level with 0% noise level in face–house stimuli. The causal influences that rAI received from lAI and dACC significantly increased when the causal interactions for 40% noisy happy–angry faces were compared with that of 0% noisy happy–angry faces, as shown in Figure 4B. Also, there was significant increase in causal interaction from rAI to dACC for 40% noisy versus 0% noisy happy–angry face stimuli, but interactions of lAI from and to dACC did not increase significantly (Fig. 4B). In the audiovisual asynchrony and synchrony perception task, when we compared asynchrony perception with synchrony perception, we found the causal influences from lAI and rAI to dACC, and from dACC to rAI increased significantly, but not from lAI to rAI and vice-versa (Fig. 4C). When we compared the causal influences between combined 12% and 20% C with 100%, in case of RDM direction discrimination task, significant increases in causal interactions were found from rAI to both dACC and lAI, whereas the interactions between lAI and dACC did not change significantly [Fig. 4D (i)]. When the comparison was done for combined 12% and 20% IC with 100%, we found significantly increased causal influences from lAI to rAI, rAI to dACC, dACC to lAI, and dACC to rAI, as shown in Figure 4D (ii). The causal influence decreased, but not significantly, from lAI to dACC in both of these comparisons [Fig. 4D (i), (ii)].
Across all these tasks, there was a bidirectional network activity between rAI and dACC. This network activity increased with task difficulty, as shown in Figure 4A (ii), B, C, D (ii). For difficult tasks, the causal interactions between dACC and lAI were bidirectional except for audiovisual discrimination task. The network activity between dACC and lAI was bidirectional for the face–house discrimination tasks [Fig. 4A (ii)], but unidirectional from lAI to dACC in audiovisual asynchrony and synchrony perception (Fig. 4C) and from dACC to lAI in RDM discrimination task for IC (12% and 20%), as in Figure 4D (ii) compared to easy tasks (clear, less ambiguous stimulus types). The increase in network activity from lAI to rAI was significant for noisy compared to clear happy–angry facial stimuli and IC (12% and 20%) compared to 100% [Fig. 4D (ii)], but the opposite relationship was found for C (12% and 20%) compared to 100% [Fig. 4D (i)].
In summary, when difficult decisions were compared with easy decisions, we found (1) significantly increased bidirectional causal influences between rAI and dACC in all tasks, (2) rAI received significantly higher causal influences from lAI in happy–angry face discrimination and RDM discrimination tasks, (3) dACC exerted significantly stronger causal influences to lAI in all tasks except audiovisual asynchrony and synchrony perception task, and (4) lAI exerted significantly greater causal influences to dACC in face–house discrimination task and audiovisual asynchrony and synchrony perception task.
Discussion
The functional role of the SN underlying PDM processes has not been sufficiently examined. We used four sensory discrimination tasks in visual and audiovisual domain with varying degree of degraded sensory input, measured fMRI-BOLD signal, and used spectral GC techniques to explore the role of SN in PDM. We found that the SN involved in all of the task conditions. The activity level as indicated by BOLD signal in SN nodes was found to increase with the increase in noise level or task difficulty. Our GC analysis showed that the key nodes in SN were functionally connected to each other and the directed functional connectivity strengths also increase with noise level. These task difficulty-dependent node and network activities within SN provide a strong support of the role of SN in PDM. Furthermore, these findings are consistent with the previously reported finding that the AIs and dACC serve as part of the decision-making network that integrates information and chooses one response over another (Lamichhane and Dhamala, 2015b) and supported by many other studies in the field (Ho et al., 2009; Krebs et al., 2012; Rushworth et al., 2004; Srinivasan et al., 2013; Venkatraman et al., 2009; Wiech et al., 2010; Woolgar et al., 2011).
Based on the results consistent with previous studies, we proposed that AIs, key nodes of SN, are involved in integrating information and processing (Gu et al., 2013; Lamichhane and Dhamala, 2015b; Sterzer and Kleinschmidt, 2010). Although AIs were typically associated with social and affective tasks involving pain, empathy, disgust, and introspective processes (Craig, 2009; Singer et al., 2009), their role in information processing is also supported by their widespread efferent and afferent projections to and from the frontal, parietal, and temporal lobes (Mesulam and Mufson, 1982a, 1982b; Saper, 2002; van den Heuvel et al., 2009) and functional connection with a large-scale network of sensorimotor, affective, and cognitive control regions (Cauda et al., 2011; Chang et al., 2013; Deen et al., 2011; Touroutoglou et al., 2012). The significantly higher brain activity in AIs during the difficult task (stimuli with higher noise level or more ambiguity on stimulus features) conditions might reflect relatively greater task difficulty and indicate the need of more effort for the integration of information (Calvert, 2001; Tregellas et al., 2006) and PDM (Kosillo and Smith, 2010).
Neuroimaging studies provided the evidence that AIs and dACC have a close functional relationship in a wide range of tasks (Binder et al., 2004; Bushara et al., 2001; Dosenbach et al., 2007; Ham et al., 2013; Ho et al., 2009; Krebs et al., 2012; Lewis et al., 2000; Ploran et al., 2007; Tregellas et al., 2006; Venkatraman et al., 2009; Woolgar et al., 2011). Recent studies using DCM analysis have been shown that the input to insula (specially rAI) was higher compared to dACC (Ham et al., 2013; Lamichhane and Dhamala, 2015b). Our previous work (Lamichhane and Dhamala, 2015b) focused on correct trials only, but Ham and his colleagues work focused on error trials (Ham et al., 2013). Similar to the finding of Ham and colleagues, Cai and colleagues reported a greater rAI activity in “unsuccessful stop” trials than in “successful stop” trials and such rAI activity was found sensitive to the outcome of stopping but they found no support for AI role in error processing. The higher SN activity in error trials was interpreted as an effortful, but unsuccessful, force of the SN (Cai et al., 2014; Ghahremani et al., 2015). Hence it is possible that AI involved in processing information salience or relevance to a current task or goal and activated whenever the sensory input poses a challenge by sensory uncertainty or ambiguity, the disambiguation of which requires enhanced effort (Sterzer and Kleinschmidt, 2010). In our study, AI was possibly involved in integrating the sensory information salient to driving task-relevant behavior.
Our interpretation of this finding is in accordance to previously proposed role of AI that it may integrate behaviorally relevant stimuli (Menon, 2015) and that is further used by dACC (Lamichhane and Dhamala, 2015b). With the insular input, the dACC might be coordinating in selection of motor action and overcoming the conflict in decision-making (Botvinick et al., 2001, 2004; Botvinick, 2007; Ide et al., 2013). However, for a PDM task that does not require motor response, a detailed investigation of the coupling between AI and dACC is an interesting topic for future research.
In addition, the observed higher BOLD response in dACC during difficult compared to easier tasks might be due to the increased task demand of assessing information when the information is not straight forward (Nee et al., 2011; Rushworth et al., 2004; Taylor et al., 2007; Thielscher and Pessoa, 2007) and insufficient to support one action over another during goal-directed action selection (Dosenbach et al., 2007; Gluth et al., 2012; Holroyd and Yeung, 2012; Landmann et al., 2007; Medford and Critchley, 2010; Rushworth et al., 2007; Zysset et al., 2006). Although the dACC might access such information from widespread efferent and afferent projections to and from the large-scale network of sensory, affective, and cognitive regions (Cauda et al., 2011; Chang et al., 2013; Deen et al., 2011; Mesulam and Mufson, 1982a, 1982b; Saper, 2002; Touroutoglou et al., 2012; van den Heuvel et al., 2009), insular cortex influence might play an important role in the selection of appropriate choice in PDM in difficult task conditions. The observed load-dependent directed functional connections between dACC and AIs during tasks further support this notion as does a recent study where authors showed that intact white matter bundle projecting to/from dACC is important for performing tasks (Metzler-Baddeley et al., 2012). Lesions in this part of the brain can lead to difficulties in initiating complex voluntary movements and actions (Rushworth et al., 2004; Srinivasan et al., 2013; Williams et al., 2004). This conclusion is also supported by studies which state that the dACC is involved in guided action selection (Kennerley et al., 2006; Quilodran et al., 2008; Walton et al., 2004). Based on our evidence, we propose that dACC is responsible for high-level behavioral plans to achieve the goal of our moment-to-moment actions (Holroyd and Yeung, 2012).
The SN plays an important role in saliency detection, reactivity, facilitating access to attention and working memory resources once a salient event has been detected. Emerging evidence suggests that the SN plays a crucial role in switching between large-scale brain networks involved in externally oriented attention and internally oriented mental processes (Sridharan et al., 2008). During the performance of many cognitively demanding tasks, the SN shows increase in activation together with the lateral frontoparietal central executive network (CEN) whereas the default-mode network (DMN) shows decrease in activation below the resting baseline (Greicius et al., 2003; Raichle et al., 2001). Moreover, brain responses within these regions increase and decrease proportionately in relation to specific cognitive demands and task difficulty. Once a salient event is detected, the AI facilitates sustained processing by initiating appropriate transient control signals that engage cognitive and task control systems while suppressing the default-mode network (Sridharan et al., 2008). In this study, we have not examined into how important the SN is for the efficient regulation of activity in the default-mode network, efficient cognitive control, and better performance of cognitive control tasks. Furthermore, network activity exploring the information flow among these three networks, SN, CEN, and DMN, with task difficulty is left for future work, which will enhance our understanding about the brain mechanisms in PDM. A potential limitation of our study is that all tasks, although perceptual in nature, are different from each other in terms of stimulus modality and level of difficulties. The overall brain mechanisms (brain areas, including salience nodes and their network activities) might differ across these tasks. However, even though the tasks are different, the SN activity patterns and the network modulations uncovered here are quite similar for PDM difficulty.
In summary, the activity level based on BOLD signal changes in the SN nodes was found to increase with the task difficulty across four tasks. The network activity analysis showed that these nodes functionally interact with each other and the network activity increases with task difficulty. These results provide a strong support for a functional role of the SN in PDM. These findings altogether provide new insights into the brain mechanisms and the general nature of high-level information processing, action selection, and perception to action mapping in goal-directed tasks.
Footnotes
Acknowledgments
We thank Crystal Smith and Eli Goshorn for writing computer programs for manipulating and controlling stimuli used in this study. This work was supported by an NFS CAREER award (BCS 0955037) to M. Dhamala.
Author Disclosure Statement
No competing financial interests exist.