
Abstract
The structural networks in the human brain are consistent across subjects, and this is reflected also in that functional networks across subjects are relatively consistent. These findings are not only present during performance of a goal oriented task but there are also consistent functional networks during resting state. It suggests that goal oriented activation patterns may be a function of component networks identified using resting state. The current study examines the relationship between resting state networks measured and patterns of neural activation elicited during a Stroop task. The association between the Stroop-activated networks and the resting state networks was quantified using spatial linear regression. In addition, we investigated if the degree of spatial association of resting state networks with the Stroop task may predict performance on the Stroop task. The results of this investigation demonstrated that the Stroop activated network can be decomposed into a number of resting state networks, which were primarily associated with attention, executive function, visual perception, and the default mode network. The close spatial correspondence between the functional organization of the resting brain and task-evoked patterns supports the relevance of resting state networks in cognitive function.
Introduction
F
One of the most studied ICNs is the default mode network (DMN). This network commonly becomes active during “rest” and is deactivated during goal-oriented tasks (Buckner et al., 2005; Raichle et al., 2001). Much of the research that followed suggested that the DMN is typically involved in self-referential cognitive processes, such as autobiographical memory and self-judgements, and this network deactivates when tasks that are focused not on the self but on external stimuli are required to be performed. The reverse is also true; overt cognitive tasks focused on external stimuli lead to the activation of task-positive networks and the simultaneous deactivation of the DMN (Fox et al., 2005). This relationship of cohesive activation and deactivation of neural networks depending on cognitive demand indicates an intrinsic organization of neural resources.
As well as the DMN, other RSNs have since been identified, which overlap task-induced activation patterns related to visual, motor, auditory, memory, and other cognitive processes (Damoiseaux et al., 2006). The close spatial correspondence between the activation or deactivation patterns elicited by task demands and functional connectivity patterns depicted during the resting state suggests that ICNs may be recruited or suppressed depending on task demands. These observations endorse the idea that ICNs subserve a range of distinct cognitive processes. Some networks are easily identifiable as serving sensory functions, such as an auditory network and a somatosensory network (Beckmann et al., 2005), while other networks serve higher order cognitive functions, such as the set maintenance network and the frontoparietal executive control network (Dosenbach et al., 2007).
Cognitive tasks that are more complex in nature and require a number of modes of simultaneous information processing may call upon a number of ICNs, each of which provides a specific cognitive process (Gordon et al., 2012). Tasks that involve executive functioning require a number of simultaneous cognitive processes to be successfully carried out, for example, the Stroop task tests a person's reaction time to a particular stimulus. The stimuli are color words (i.e., font color red, yellow, green, and blue) printed in a color that is incongruent with the word itself (e.g., the word “red” printed in blue ink). Subjects typically respond slower to these incongruent stimuli in comparison to congruent stimuli where the color word is printed in the corresponding color ink. This is because reading is an automated process; therefore, the semantic meaning of a word is automatically processed, but conscientiously checking and identifying the color of the ink must override this automaticity in order for the task to be correctly executed. Therefore, completing the Stroop task requires a number of cognitive functions to occur in tandem, including selective attention, dual processing, processing speed, and cognitive flexibility. We would expect that a number of task-positive networks would be involved in the successful execution of the Stroop task, including networks involved in visual activation, frontoparietal activation, frontal attention networks, and perhaps also some sensorimotor activation, given the task demands of the current study. We would also expect that areas involved in the DMN would be deactivation during the Stroop task. The cognitive processes involved in the Stroop task are likely subserved by multiple ICNs, which incorporate a number of brain regions. However, to our knowledge, the ICNs engaged during the Stroop task have not been previously investigated.
Differences in connectivity within DMN regions can account for difference in performance on certain cognitive tasks (Esposito et al., 2009). This has been examined in some depth by Mennes et al. (2010) and Kelly et al. (2008) through the use of the Eriksen flanker task, where the properties of resting state networks predicted interindividual differences in task-induced blood oxygen level-dependent (BOLD) activity. The competitive relationship between resting state networks and task-induced BOLD activity appears to have behavioral relevance (Kelly et al., 2008), a finding which has sparked an interest in the behavioral significance of spontaneous or nongoal-directed brain activity.
A recent study by Gordon et al. (2012) demonstrated the use of spatial multiple regression in identifying functional connectivity networks involved in working memory performance with a young healthy cohort. In the present study we adapted the methods devised by Gordon and colleagues and investigated if the activation patterns observed during the Stroop task, an executive function task, can be decomposed into ICNs of the resting state. The current study investigates the hypothesis that the task-evoked pattern of activation would spatially correspond to subject level ICNs. We also investigated if the degree of engagement of ICNs involved in the Stroop task may predict performance on the task.
Materials and Methods
Twenty-one healthy older participants (12 female) aged 55–75 years (mean = 64.19, SD = 5.84) were included in the current study. Two of the participants were left handed. All participants underwent neuropsychological screening using the CERAD (Consortium to Establish a Registry for Alzheimer's disease) battery (Morris et al., 1989). Participants were screened for any history of neurological or psychiatric injury or illness (self-report), including depression as measured by the Geriatric Depression Scale (Yesavage et al., 1982) as well as potential mild cognitive impairment as defined by Petersen's criteria (Petersen, 2004). Participants were free of any contraindications for magnetic resonance imaging (MRI), such as metal implants in the body or claustrophobia. The study was approved by the Research Ethics Committee of the Faculty of Health Sciences (Trinity College Dublin), and every participant gave written informed consent before joining the study.
MRI scanning protocol
Imaging data were acquired using a Philips Intera Achieva 3.0 T MR system. The imaging protocol was a high resolution three-dimensional (3D) structural scan, followed by the resting state scan, and then followed by functional imaging during which the Stroop task was administered for each subject.
For the resting state scans, subjects were scanned for 7 min while lying awake and fixating on a red cross. Participants were told to relax during the scanning session and not to focus their thoughts on anything in particular. Two hundred ten whole-brain images were acquired using a T2*-weighted gradient echo pulse sequence with voxel dimensions of 3.5 × 3.5 × 3.55 mm, slice gap of 0/35 mm, resolution time (TR) = 2000 ms, and echo time (TE) = 30 ms. Thirty-nine slices were acquired in ascending order from the inferior to superior direction.
Participants were then scanned while completing a modified version of the Conventional Stroop task (Langenecker et al., 2004). Incongruent stimuli were pseudorandomly presented at infrequent intervals, 10 to 17 stimuli apart (between 15 and 25.5 sec), so that the preceding congruent stimulus did not match the incongruent stimulus in either word or color. This was done so as to prevent priming effects. There were between 13 and 15 incongruent stimuli in each run of 192 stimuli (6.7% −7.8% incongruent stimuli per run). Each stimulus was presented for 1200 ms with an interval of 300 ms between each stimulus. During the interstimulus intervals, a white fixation cross was presented on screen. Each run lasted just under 6.5 min and most participants completed four runs of the task, with just one participant completing three runs due to a timing error. All participants completed a trial run of the task outside of the scanner before the scanning session so that they would be familiar with the task procedure.
The Stroop task required participants to respond not to the word, but to the color the word was presented in. A magnet-compatible, two-button response box was held in each hand and used to record the responses to each stimulus. Two resting blocks occurred in each run after 107 and 235 sec, each lasting 21.5 sec. These breaks were included to try and prevent participant fatigue, since the task takes a relatively long time to complete. Scan parameters: 190 whole-brain images were acquired using a T2*-weighted echo planar imaging sequence, with TR = 2000 ms, TE = 30 mm, and voxel dimensions of 3.5 × 3.5 × 3.55 mm.
Data were processed with AFNI (
Any participant who scored lower than 25% correct on the incongruent trials in a run had that particular run removed from subsequent analyses. This was done to ensure that all participants performed better than chance in all runs. Thus, 4 of the 21 participants had three runs included in the analyses; 1 because a timing error allowed only three runs to be administered and 3 because of poor performance on one of the four runs. To identify the regions activated during the Stroop task, a general linear model (GLM) analysis was done. At the subject level, a fixed effects analysis was performed that included a regressor modeling the difference between incongruent and congruent trials and a second regressor modeling the variance due to the rest period. The transient hemodynamic changes evoked by the incongruent color words were evaluated relative to the responses corresponding to the congruent color words (Leung et al., 2000). The group activation map for the Stroop task was calculated using the mixed effects model, with statistical significance defined set at p < 0.05 controlled for multiple comparisons (familywise error).
We use spatial cross-correlation between spatial maps that have been derived from three different analyses. Task-based activity maps were identified using a GLM approach, while the resting state network maps were obtained through the independent components analysis (ICA) approach at both an individual level and a group level. The GLM approach analyses task-based activation independent of any larger-scale network organization that may exist. These activation patterns can subsequently be decomposed into recognizable functional networks based on existing knowledge of functional neural organization.
Defining ICN using the independent group
To identify ICNs present in the healthy subjects, an ICN template was created using an independent data set. This independent group was composed of 22 healthy older subjects, 17 of whom were female, age 57–85 years (mean = 62.5, SD = 6.63). These participants had undergone a resting state scan identical to the scan used in the present study with the same imaging parameters. Using the MELODIC toolbox in FMRIB Software Library (Centre for Functional Magnetic Resonance Imaging of the Brain, University of Oxford, London, United Kingdom), ICA was carried out on the data set using the multisession temporal concatenation option. As in Gordon et al. (2012), the ICA algorithm was preset to return 20 independent components, a number which has been shown to segment the brain into recognizable networks (Abou-Elseoud et al., 2010). The ICA depicted 20 components in the form of 20 3D Z-score images, where the Z-score in each voxel represents the extent of covariation with the rest of the network. Components in which areas of maximal covariation were non-neuronal (e.g., cerebrospinal fluid or effects of head motion) were identified and excluded from any further analysis. The remaining components were subsequently inspected for similarities to known brain networks, and 13 separate networks were identified (Fig. 1).
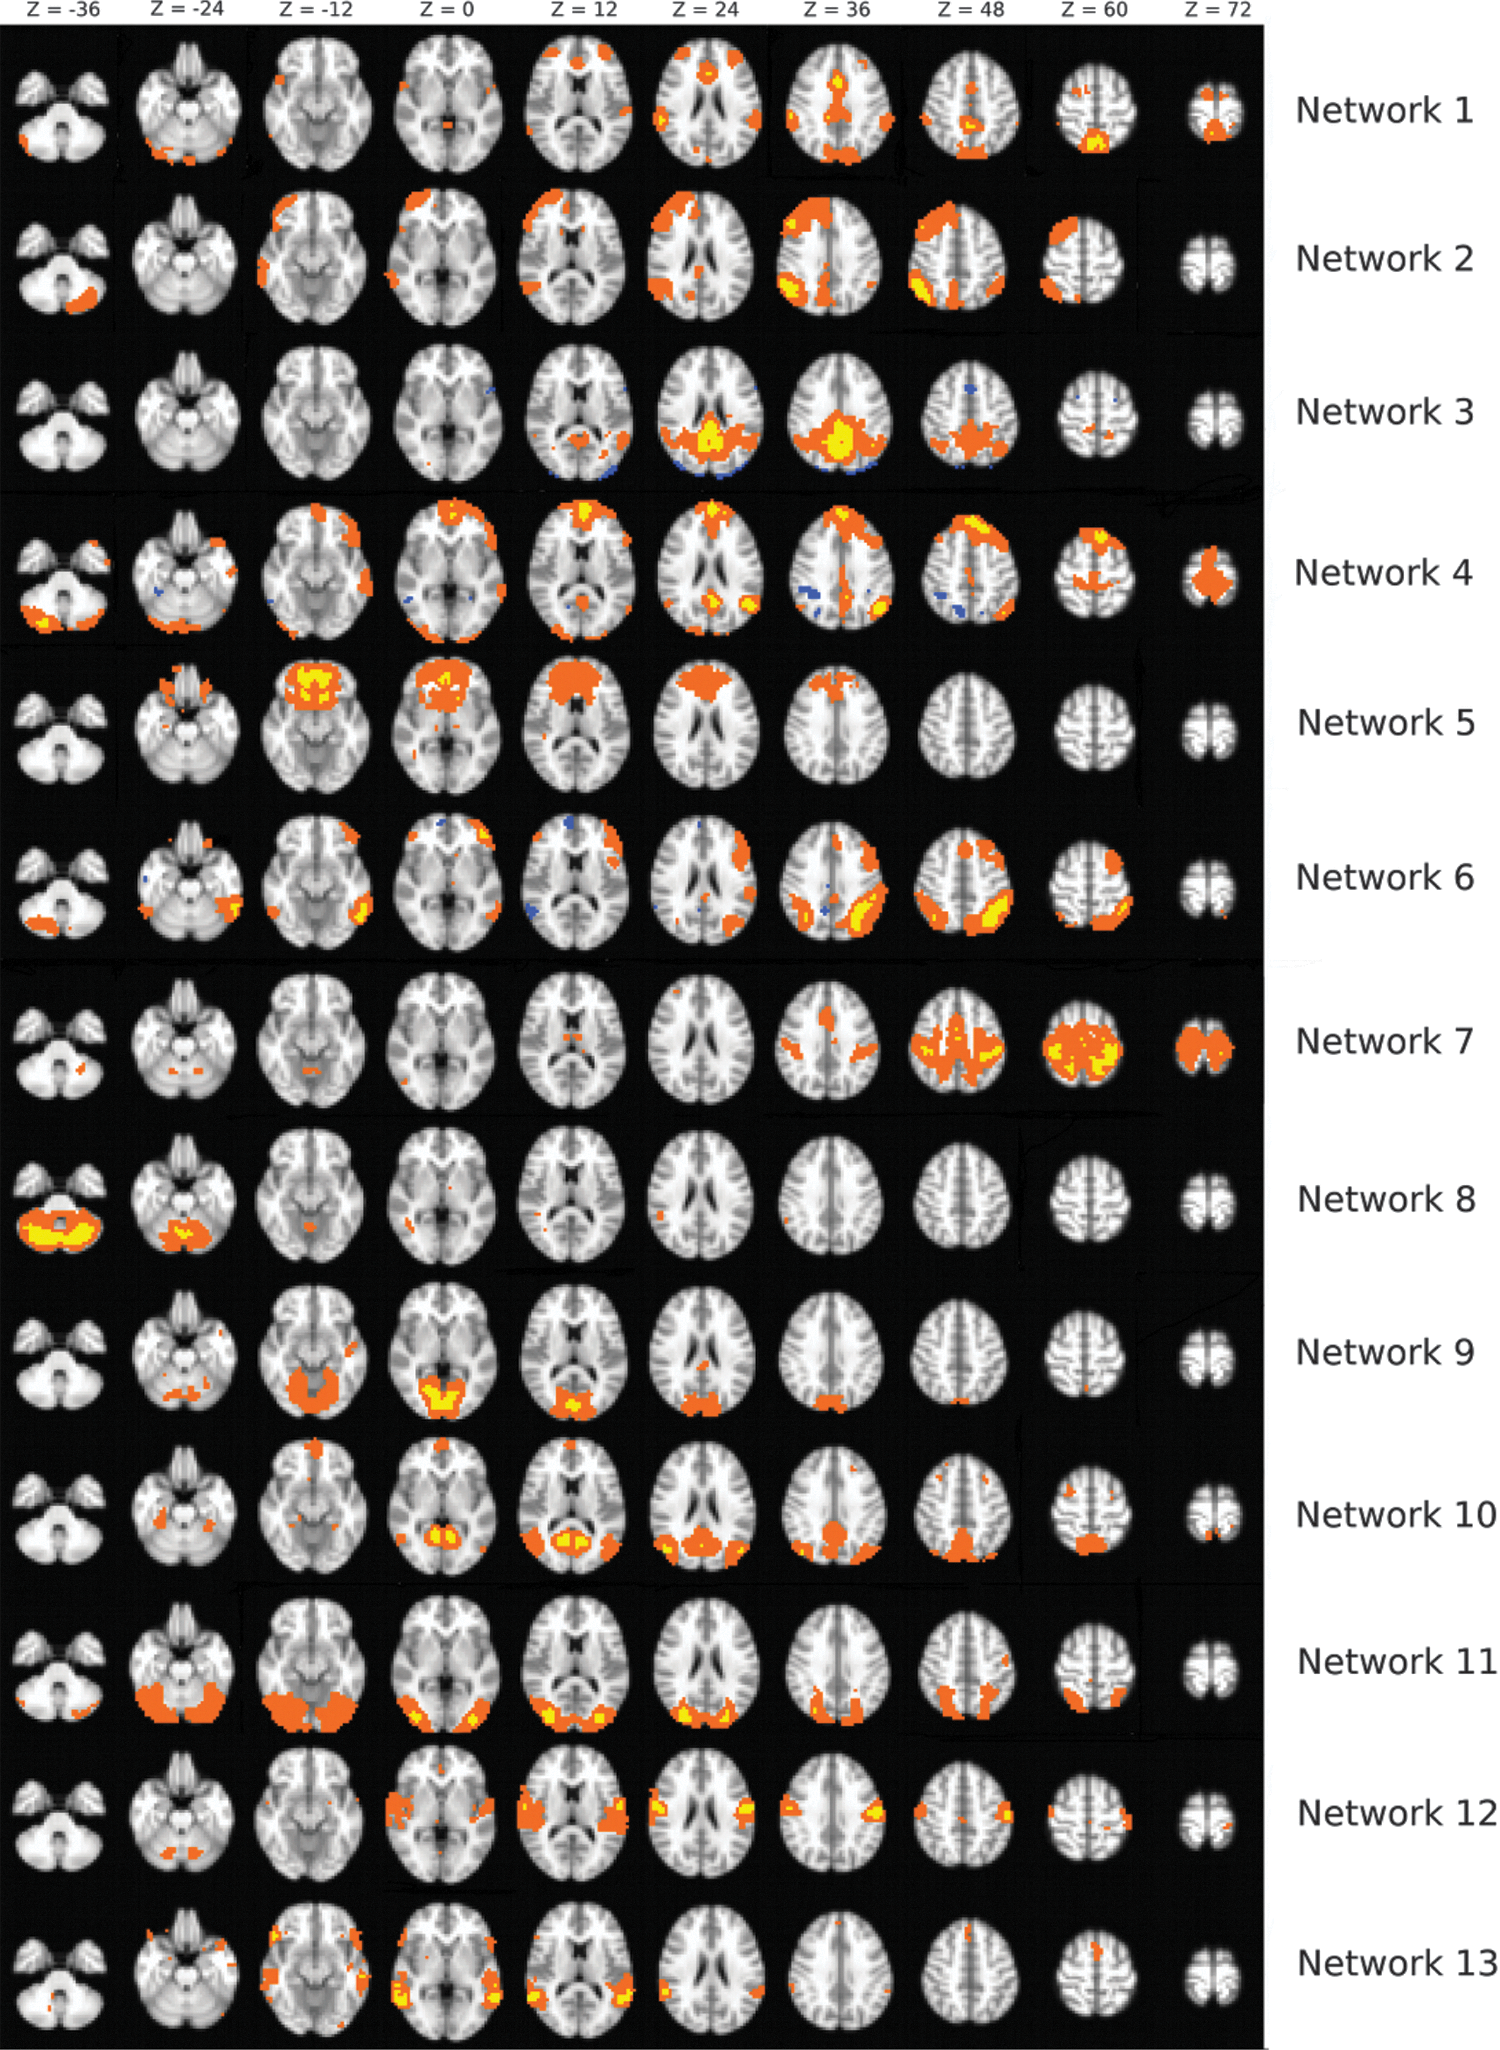
The template containing 13 ICNs identified as being due to neuronal activity from a decomposition of the data set into 20 components. ICNs, intrinsic connectivity networks. Color images available online at
Subject level ICN
With the study's individual subjects (subjects that performed both Stroop task and resting state), ICA was performed on the resting state on an individual basis to identify ICNs within each subject. The algorithm was again set to return 20 independent components. To minimize subjectivity of deciding which of the 20 independent components in a subject were representative of group template ICNs, we calculated the Pearson's correlation coefficient between all 20 independent components to the unthresholded group template ICN. From the 20 independent components, a component was defined as the best match to an ICN when it has highest r value of the 20 independent components. Thus, the best matched component as determined by the r value was considered to be that subject's version of the independent group template ICN (as defined by the independent group). If one of the independent components from a subject did not have a Person's correlation coefficient greater than 0.1 with any of the template ICNs, then that component was considered to not be an ICN (as in Gordon et al., 2012). The threshold of 0.1 was used to minimize the possibility that the correlations between networks may be driven by noise. The independent components with no match in the ICN template were not included in any subsequent analyses.
ICNs engaged during Stroop task
To explain the spatial pattern of each subject's unthresholded Stroop task activation map as a linear combination of that subject's unthresholded ICN maps, spatial multiple regression analysis was performed (Figs. 2 and 3). The Z-scores of each individual subject's incongruent versus congruent activation map were linearly regressed against that subject's ICNs. The regression analysis provided β values for each ICN, which indicated the extent to which the spatial pattern of that particular ICN explained the spatial pattern of task activation—in other words, the degree to which that particular ICN matched the activation pattern during the Stroop task. One-sample t-tests were conducted for the beta values in each network to identify which ICNs were a statistically significant part of the Stroop task activation pattern.
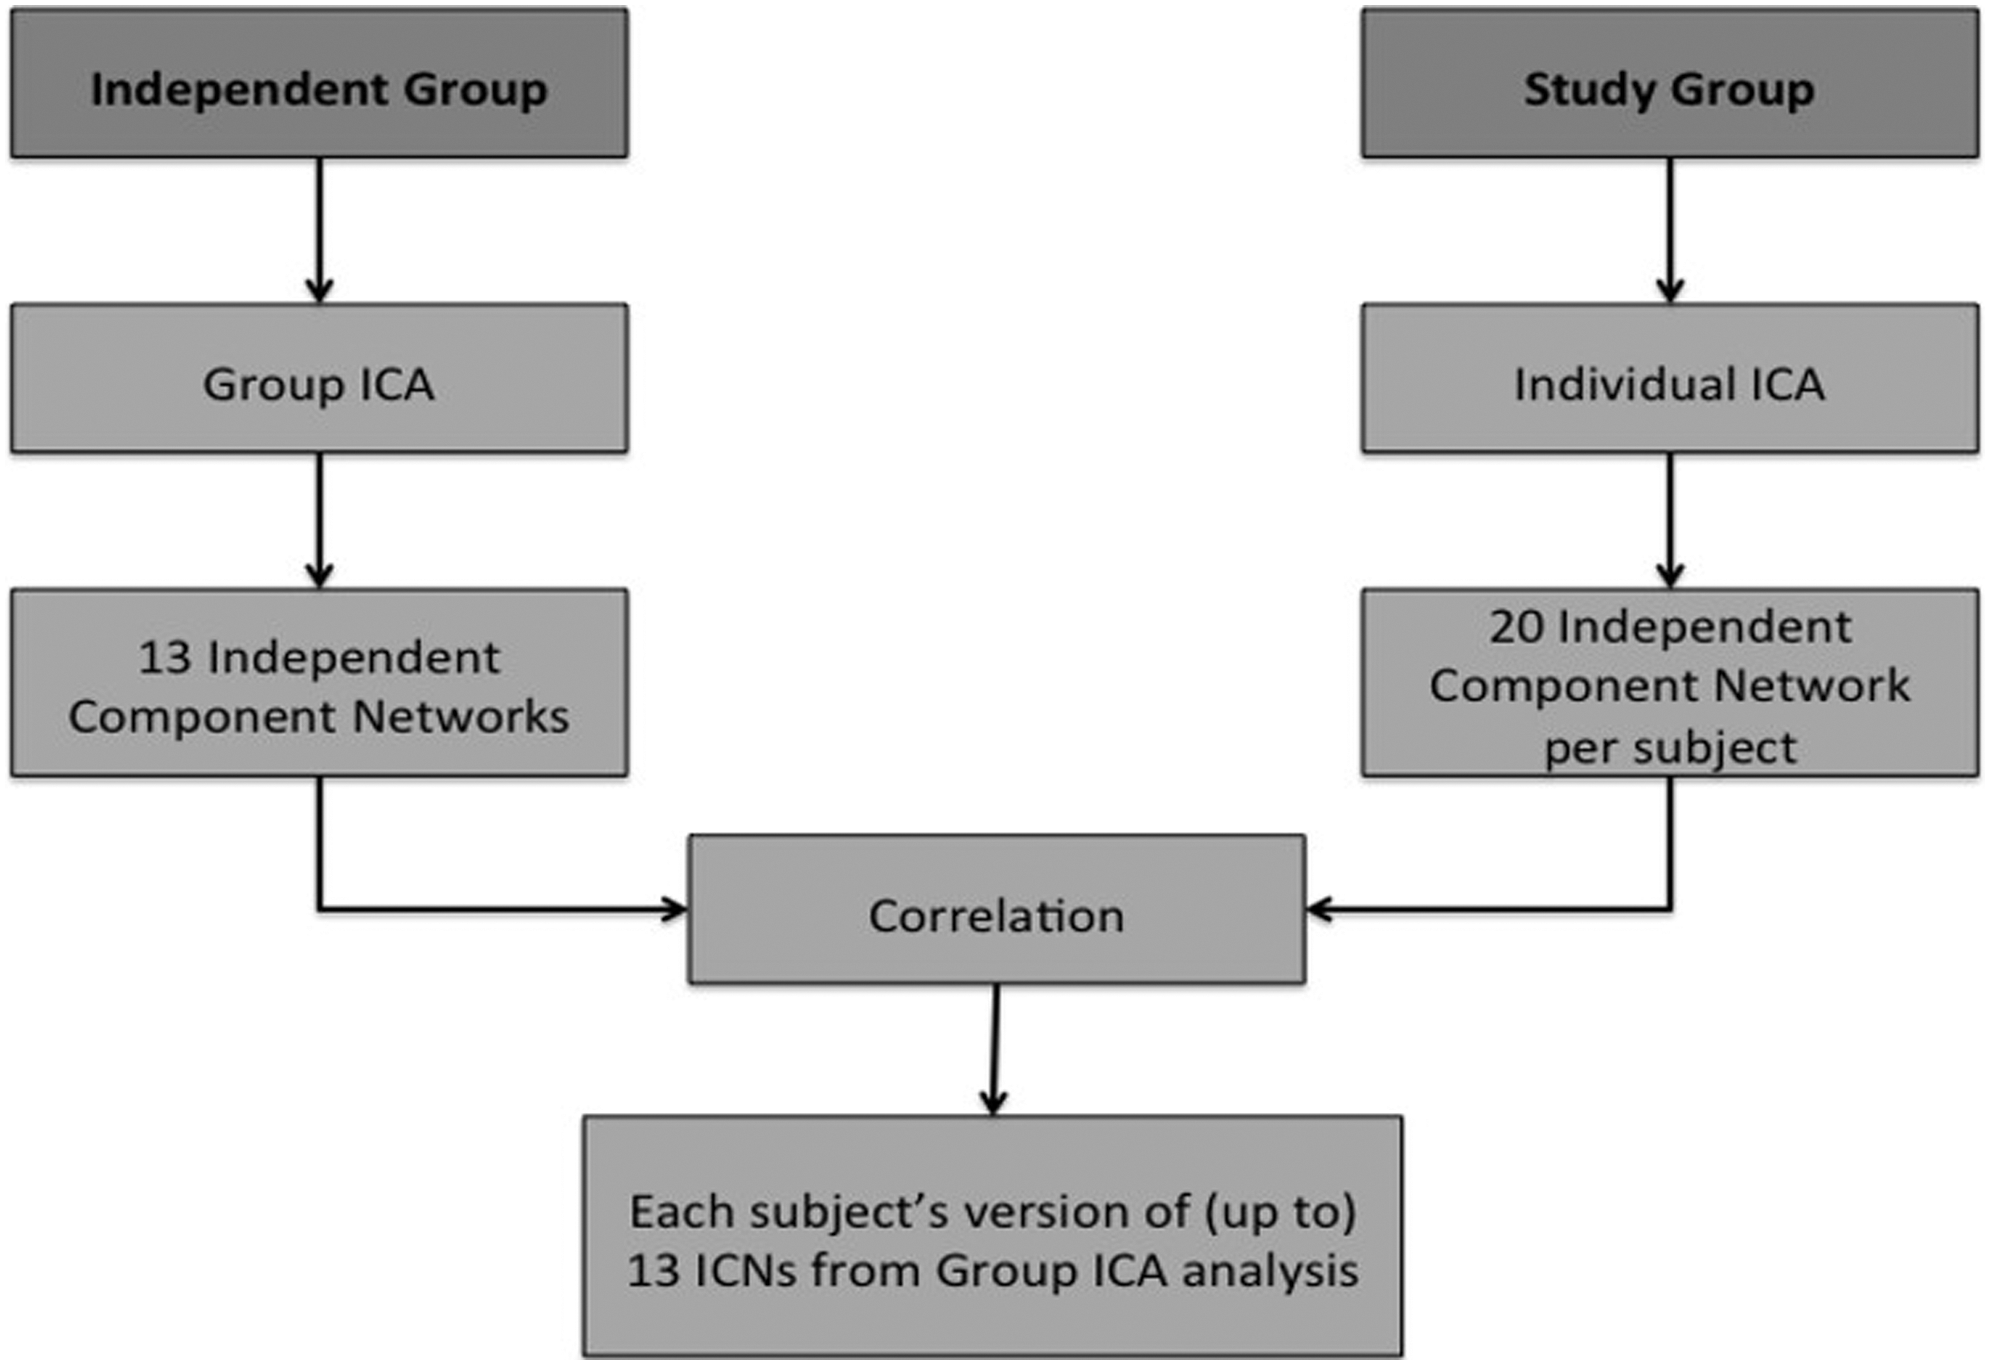
Schematic diagram of the steps involved in determining which group level network best matched each subject's individual level network. ICA, independent components analysis.
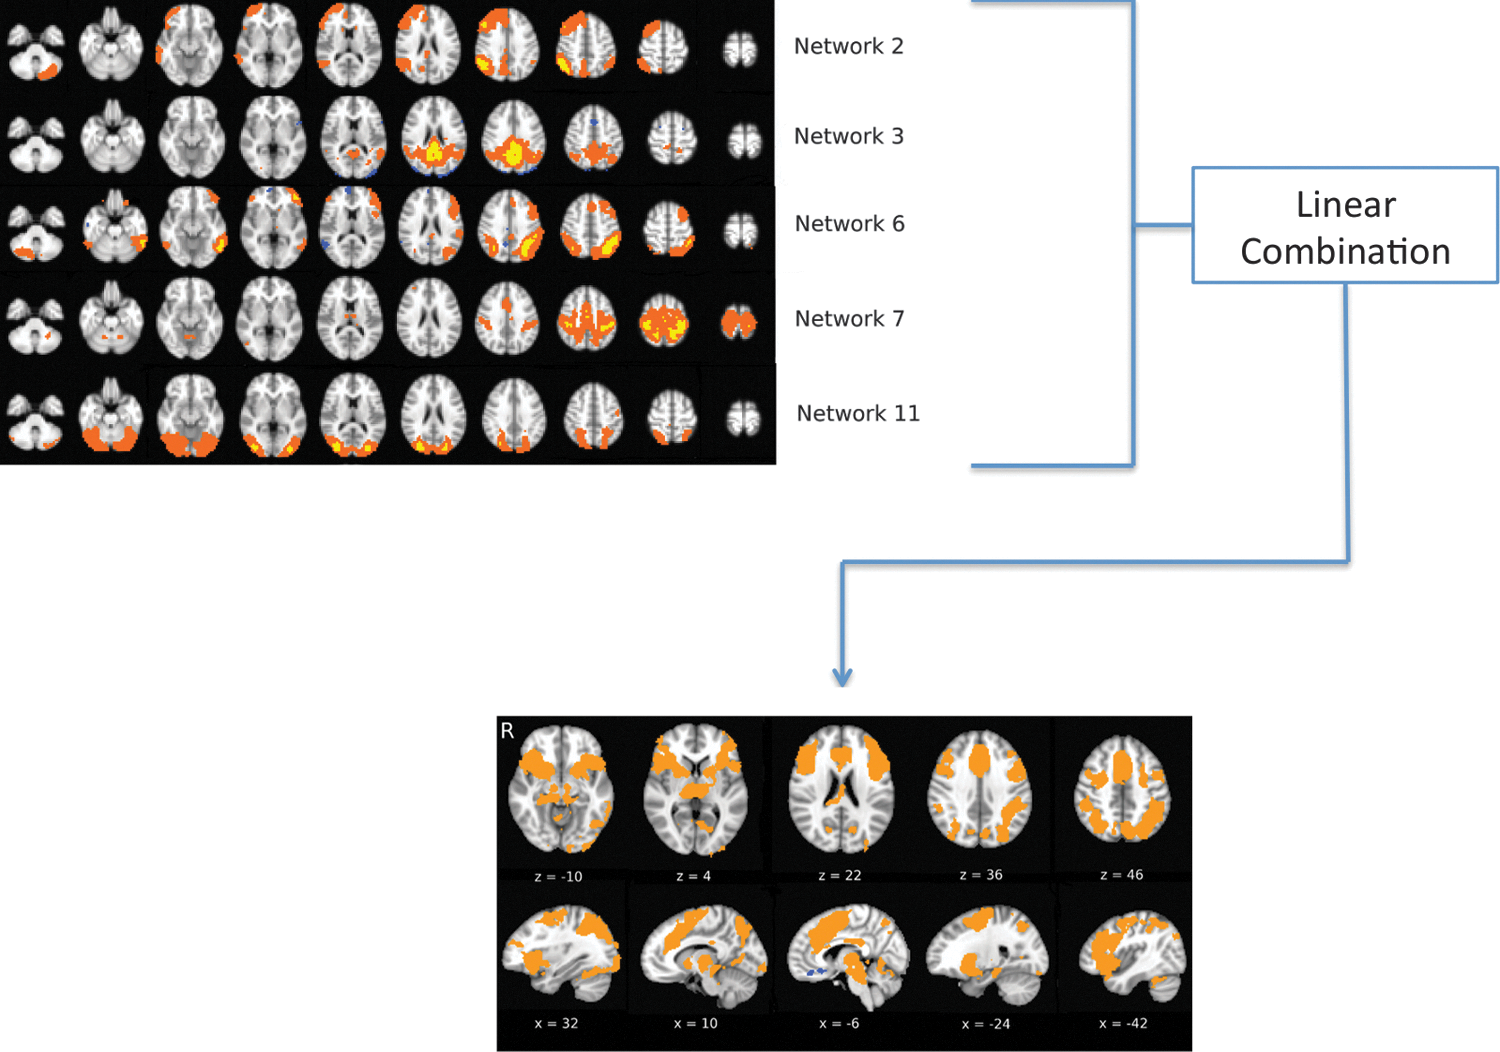
Schematic diagram of spatial multiple regression. The spatial pattern of the Stroop effect activation map is explained as a linear combination of group level ICNs. Color images available online at
Both mean reaction time to incongruent stimuli and the mean difference in reaction time to incongruent and congruent stimuli (i.e., the Stroop Effect) were calculated for all subjects. We correlated the reaction times to the beta values for the ICNs to investigate if the magnitude of the spatial regression of the ICNs was related to task performance.
Results
Stroop behavior
Participants showed both higher levels of accuracy and faster response times to congruent stimuli compared to incongruent stimuli. Mean accuracy in the congruent condition was near ceiling, at 95.97% with an SD of 2.43%. For the incongruent condition, accuracy was reduced to 74.43% with SD = 14.95%. Reaction time for the congruent condition had a mean of 0.744 sec, SD = 0.052 sec, whereas for the incongruent stimuli the mean reaction time was 1.123 sec, SD = 0.096. These results are consistent with previous literature on the Stroop Effect, which consistently shows that participants respond both faster and more accurately to congruent stimuli than to incongruent stimuli (Langenecker et al., 2004; MacLeod, 1991).
Figure 3 shows the group activation map for the incongruent versus congruent activation. This pattern of activation includes the dorsal anterior cingulate cortex, the inferior frontal gyrus, and the dorsolateral prefrontal cortex. This pattern of activation is consistent with previous literature (Langenecker et al., 2004; Zysset et al., 2007).
Template ICNs
There were 13 networks from the independent group, which were visually inspected and labeled according to similarity to previously described networks. These networks included a language network, a right frontoparietal control network, a posterior cingulate network, a DMN that comprised mostly anterior with some posterior activation also, a separate posterior DMN, a set maintenance network, a dorsal attention network (Fox et al., 2006), a sensorimotor network, a cerebellum network (Hampson et al., 2002), two distinct visual networks, an auditory network (Upadhyay et al., 2008), and finally a ventral stream network. Seven networks were discarded as either deriving from non-neuronal sources or depicting no known or identifiable spatial neuronal network.
Subject level ICNs
Spatial correlations were carried out between template ICN and each subject level ICN to identify the subject level ICN, which best matched the template ICN. Subject level ICN matches were determined as valid if they were above the r = 0.1 threshold. Three of the 21 subjects had matches for all of the 13 template ICNs. Seven subjects had 12 valid matches to ICN template networks and the remaining subjects had no fewer than 9 matches to the template ICNs. On average, there were 11.33 out of 13 ICNs. The Dorsal Stream and a Posterior DMN had fewest matches to the template, being present in only 15 of 21 subjects (71%). The language, anterior DMN, decision-making, dorsal attention, and visual (occipital pole) networks were present in all subjects and the remaining 6 networks were all present in at least 16 out of 21 (76%). Table 1 describes how many ICNs on the individual level matched those in the ICN template.
ICA, independent components analysis.
ICNs engaged during Stroop task
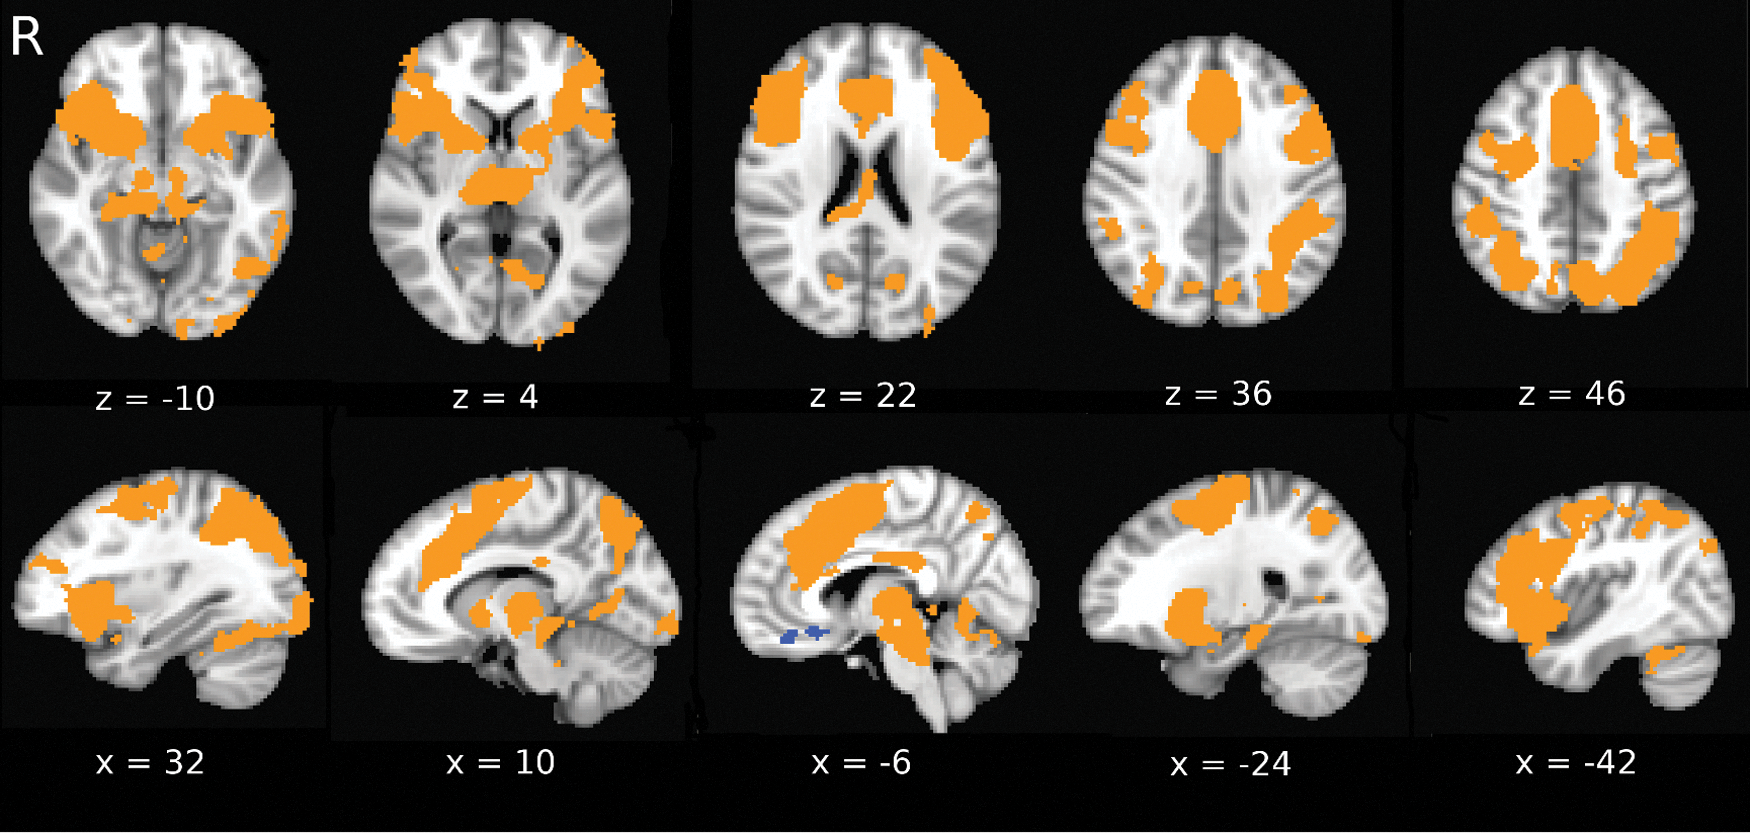
Spatial multiple regressions were carried out to determine the magnitude of the spatial match between the Stroop activation as a linear combination of ICNs. The β values reflected the extent to which the Stroop activation pattern could be decomposed into the subject's ICNs. Five ICNs were found to match the activation pattern observed during the Stroop task: Networks 2, 3, 6, 7, and 11, and the cognitive function these networks are associated with are described in more detail below (Fig. 4).
Activation pattern elicited during presentation of incongruent stimuli compared to congruent stimuli (corrected for multiple comparisons to alpha = 0.05). Color images available online at
Network 2, the right frontoparietal control network, is commonly activated in tasks that require response inhibition. As the Stroop task requires subjects to attend to the color of the text as opposed to the learned response of reading the content of the text, successful task completion requires inhibition of an automatic response (Scolari et al., 2015).
Network 3, a posterior DMN, is the only network to show significant negative beta values. This corresponds with the wide range of literature that observes deactivation in the DMN while engaging in an external task; that is, a task which does not involve introspection or self-referential thought (Uddin et al., 2013).
Network 6, the dorsal attention network, is commonly observed in so-called conflict tasks or tasks that involve top–down processing of information (Vossel et al., 2014).
Network 7, the sensorimotor network, is involved in coordinating motor function and sensory information. The simple action of pressing the correct response button for each visual stimulus would engage this network during the Stroop task (Crone et al., 1998).
Network 11, a visual network involving the occipital poles, has been shown to be involved in attentional control when features of a target stimulus are changed (Becker et al., 2014; Kristjansson et al., 2007).
Comparison of ICN activation with task performance
The β values (Fig. 5) for each of the five networks were correlated against three measures of task performance; percentage of incongruent Stroop stimuli correctly identified, mean RT to incongruent stimuli, and the Stroop Effect, that is, the mean difference in RT between congruent and incongruent stimuli. The β values in none of the five ICNs were linearly correlated to a statistically significant degree to any of the three measures of performance (Table 2).
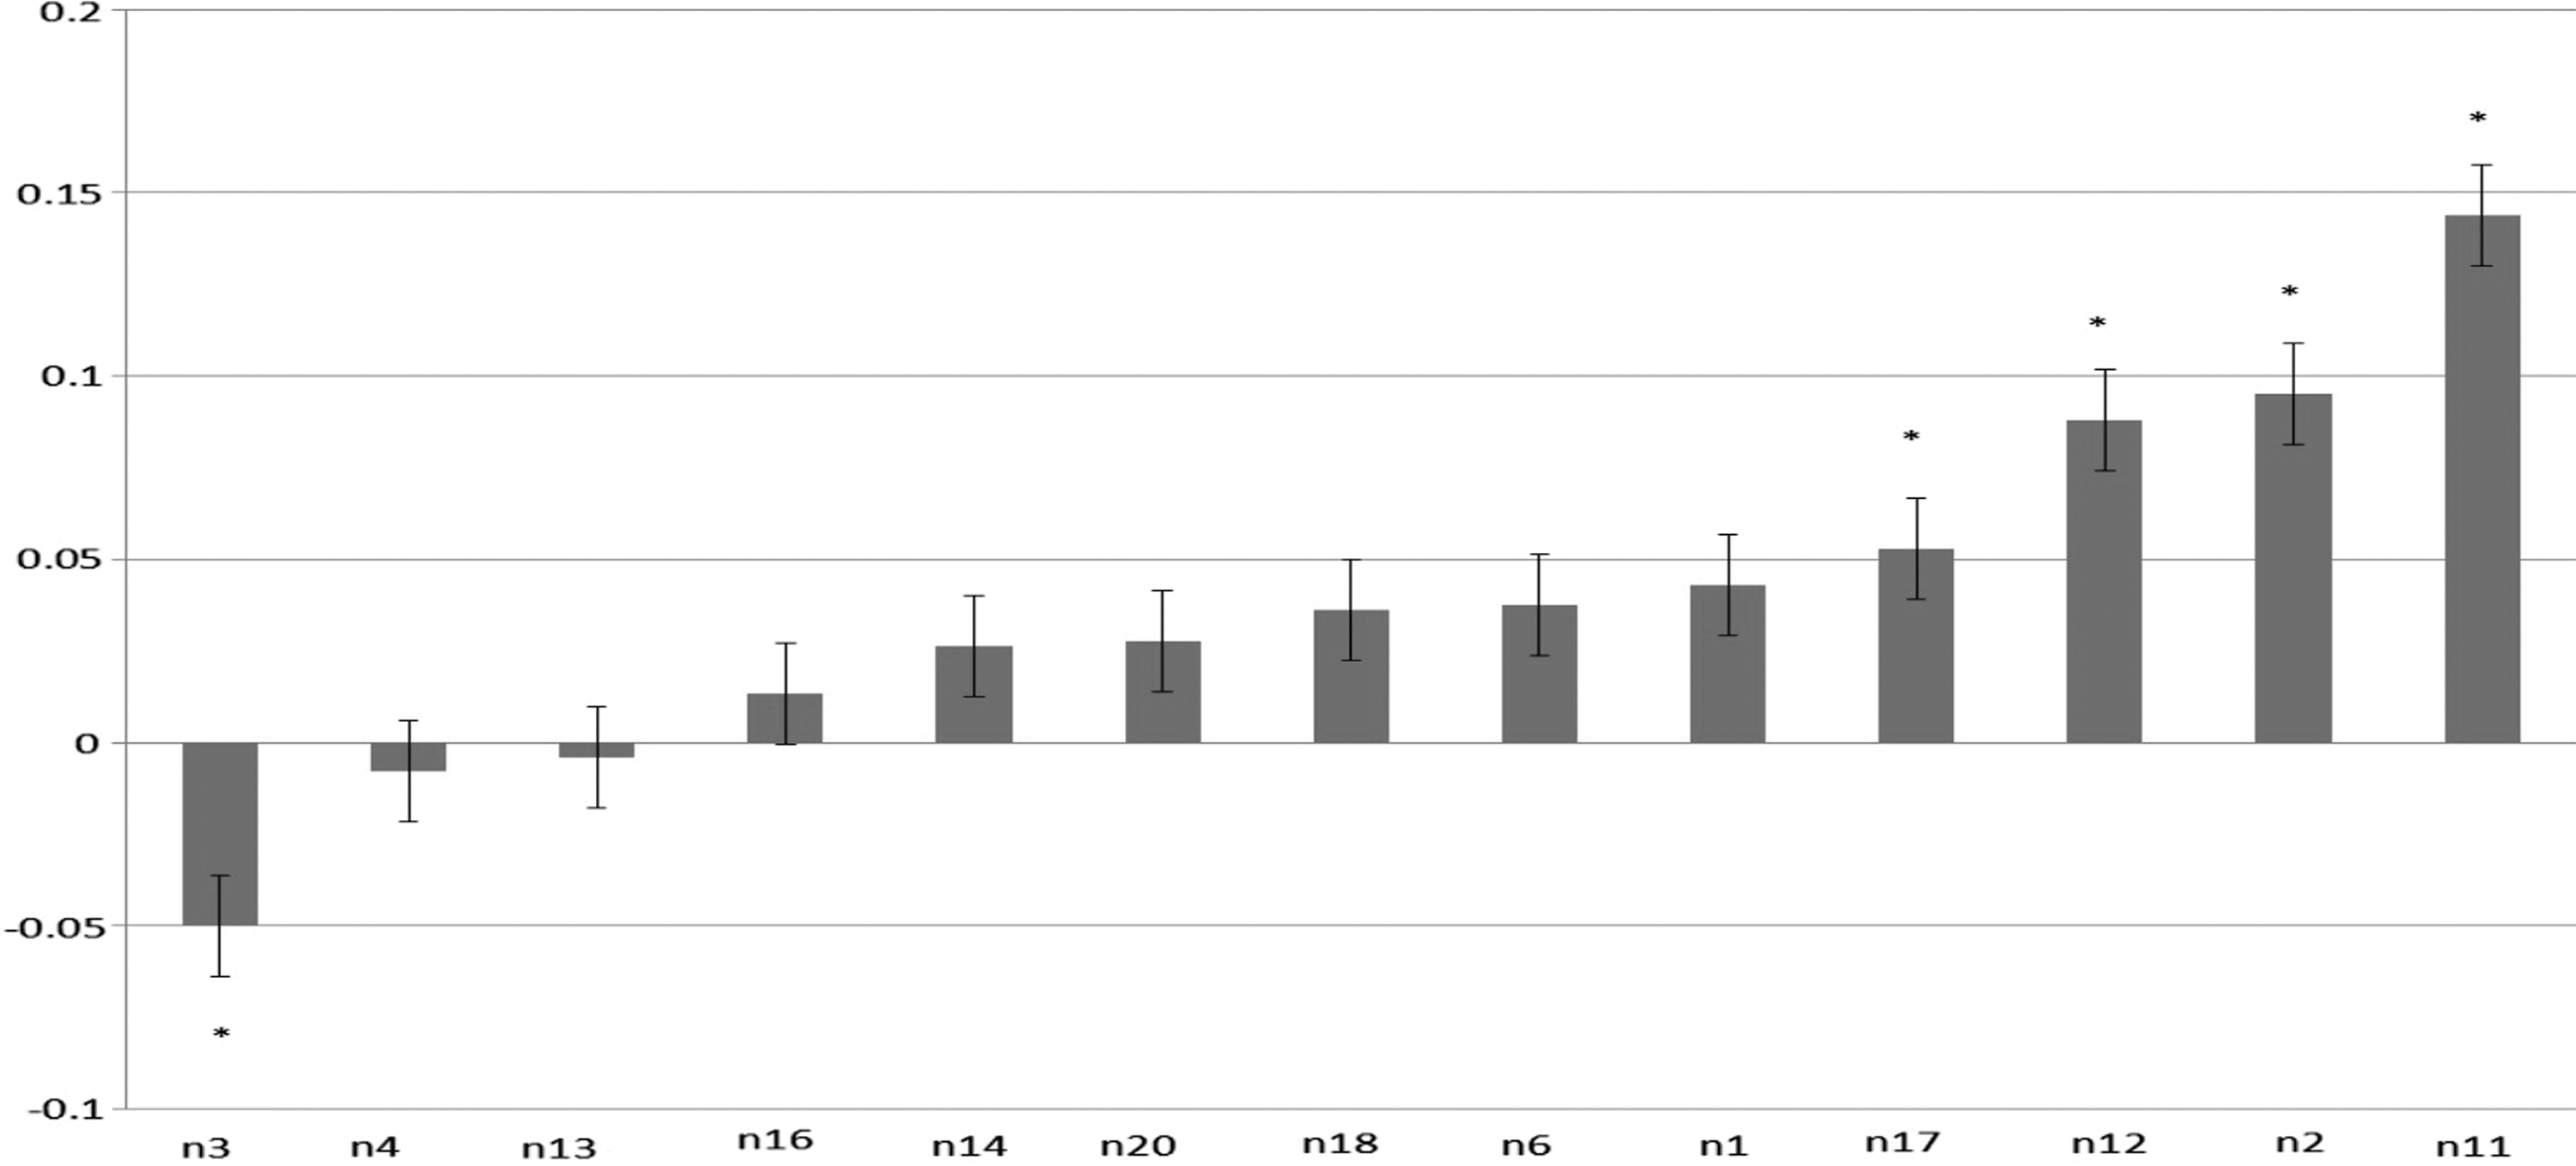
Average β values across subjects for each network, as derived from spatial multiple regression analysis comparing subject level ICNs with subject level activation maps during the Stroop task. *Values were significantly different from zero (p < 0.05).
DMN, default mode network; RT, reaction time.
Discussion
Through the use of spatial multiple regression, the present study found that the activation elicited during a Stroop task could be spatially decomposed into a number of ICNs. The pattern of activation during the Stroop task was best matched to the Dorsal Attention network, the sensorimotor network, a visual network, right frontoparietal control, and a posterior DMN. The present study shows that the activation network in the Stroop task can be decomposed into multiple ICNs that reflect the cognitive processes engaged by the Stroop task. It extends the findings by Smith et al. (2009) and Gordon et al. (2012), where Smith and colleagues examined the spatial overlap at the group level between task-activated network and ICNs while Gordon et al. (2012) examined the spatial overlap at the individual level. We investigated the spatial overlap in an executive function task and defined the ICN template using an independent group of subjects. This complicated executive function task, the Stroop task, requires not only working memory capabilities of updating information and maintaining task rules but also suppression of the automatic response of reading the words presented and instead selectively attending to the color of the ink (Vandierendonck, 2014). Using the Stroop task extends findings by Gordon et al (2012) by showing the link between rsfMRI and an executive function task that requires both working memory capabilities and other cognitive processes mentioned above. By defining the ICN template with an independent group, we have demonstrated that ICNs from an independent matched group can be replicated on an individual subject level. These data show that ICNs can be successfully replicated across groups and go some way toward endorsing the reliability of ICNs.
We have demonstrated that observed patterns of activation elicited by the Stroop task can be decomposed into ICNs. The spatial match of the ICN has the potential to inform which cognitive functions are active during a task. The Stroop task appears to evoke ICNs of the dorsal attention network, the sensorimotor network, a visual network, right frontoparietal control, and a posterior DMN. The dorsal attention network seemed to be more sensitive to performance as measured by the Stroop Effect than the other ICNs, although this sensitivity was not statistically significant for this condition. This network has been shown to be involved in top–down orientating of attention and selection of behavior (Corbetta and Shulman, 2002) that fit with the cognitive demands of the Stroop task. Frontoparietal control networks are known to be associated with attentional control, that is, selecting goal-relevant task information and suppressing information that is distracting and goal irrelevant (Campbell et al., 2012). The engagement of a visual network is not surprising given that the Stroop task requires visual engagement with the stimuli; similarly, the sensorimotor network could be expected to be engaged during the task as responding to the stimuli requires processing of sensory input as well as motor coordination. The posterior DMN was deactivated by the Stroop task, which is consistent with previous literature surrounding the DMN that details how this network generally activates during periods of undirected cognition, and deactivates when there is an explicit cognitive demand present (Buckner et al., 2008; Raichle et al., 2001).
The Stroop task map was broadly in line with what has been reported in previous literature (Langenecker et al., 2004). In the current study, patterns of activation during the incongruent condition show activation in the anterior cingulate, the left and right inferior frontal gyrus, the left and right putamen, the precuneus, and the left and right inferior parietal lobule. The anterior cingulate cortex is known to be involved in monitoring conflict between stimulus dimensions (Fan et al., 2003). The Stroop task is one of the most widely studied examples of a task that has inherent stimulus conflict, and the anterior cingulate cortex has been consistently shown to activate during the Stroop task. Bush et al. (2000) describe the dorsal cognitive division of the ACC as being heavily involved in a variety of functions, including modulation of attention or executive functions by influencing sensory or response selection, or both; monitoring competition, complex motor control, motivation, error detection, and working memory; and anticipation of cognitively demanding tasks. Activation of the anterior cingulate cortex during the Stroop task supports the hypothesis that it is recruited to mediate response selection or allocate attentional resources when confronted with competing information processing streams (Bush et al., 1998).
Other areas activated during Stroop task include inferior frontal regions and dorsolateral prefrontal regions. Activation of the inferior frontal gyrus during Stoop performance is often more pronounced in older subjects, indicative of recruitment to aid with performance of the task (Langenecker et al., 2004). These regions have been linked to inhibition, with the suggestion that successful inhibition in older subjects is associated with more activation in inferior frontal gyri. Lesions studies of the dorsolateral prefrontal regions specifically have shown increased Stroop interference, indicating the importance of this particular frontal region in successful Stroop completion.
Our results help to confirm the close correspondence between functional organization of resting and task-evoked states that has been previously observed across studies (Gordon et al., 2012; Smith et al., 2009). Smith et al. (2009) evaluated spatial matches at the group level between activation patterns obtained from a number of task-evoked studies and single ICNs obtained from a separate group of 36 subjects. Gordon et al. (2012) were able to extend Smith's findings by demonstrating that spatial matches between working memory activation patterns and ICNs exist within a group of young healthy subjects. While the correspondence between resting state networks and neural activation during the Stroop task was not sensitive enough to correspond with performance on the Stroop task, it is possible that the number of participants in the current study may have been too small. Further investigations with larger numbers of participants may be required to provide a more in-depth understanding of the nature of the relationship between ICNs and task-evoked neural activation.
It is possible that some of our results could be affected by age. The age range of the template group was 56–85 years, while the range of the task group was 55–75 years. Although there is a 10-year difference in the upper limit of the age ranges, the second-to-oldest member of the template group was 71 years of age. The independent group that was used to create the group template had a similar mean age and standard deviation to the task group (template group: mean = 62.3 years, SD = 6.93 years; task group: 63.2 years, SD = 5.6 years), and there is no statistically significant difference between the ages in both groups (t = −0.477, p = 0.636). To compare with previous similar studies, the cohort in the Smith et al. (2009) study comprised adults from the BrainMap database, and a resting fMRI task; no age range is given in the article, but presumably most BrainMap subjects were young. Supporting information on this study clarifies that the fMRI cohort was aged between 20 and 35 years. The study by Gordon et al (2012) examined university undergraduates, aged between 18 and 22 years. Our subjects are older than those in Gordon and colleagues' article, and we may assume that our subjects are also older than the overall cohort in Smith and colleagues' article. A recent article by Huang et al. (2015) found that five resting state networks showed an age-related decline in functional connectivity in a study of 430 older adults, while a study by Betzel et al. (2014) demonstrated age-related changes in functional connectivity both between and within resting state networks. The impact of age on resting state functional connectivity should therefore be noted while interpreting our results in conjunction with other studies.
While constructing our group template, we discarded 7 of the 20 ICNs returned because they were not visually recognizable as neural-related networks. We ran the ICA multiple times, setting the algorithm to return a different number of components each time (between 5 and 40). We also ran the analysis once without specifying how many components should be returned, and on that occasion 34 components were defined. When fewer than 20 components were returned, it was difficult to differentiate specific networks, as several networks might be included in one component. When greater than 20 components were returned, neural networks were decomposed into smaller elements and thus were also difficult to identify. Based on our observations and the results of previous literature that incorporated this method, we conclude that setting the ICA algorithm to return 20 networks is likely to be the most accurate method and the seven unidentifiable networks in our data set were the result of noise.
Several of our individual subjects did not have representations of the 13 template networks. In fact, only 3 of our 21 subjects had representations of all 13 networks, with two subjects having as few as 9 representations of the template networks. Visual inspection of the individual subjects' 20 components shows that some subjects appeared to have more components reflecting motion or noise artifacts; other subjects have single components that appear to represent a number of neural networks, while still others have components which may represent subsections of whole networks that have been decomposed by the analysis. It is possible that some of our subjects simply do not have strong representations of some of these neural networks, or that the algorithm has not succeeded in pulling out each subject's version of certain networks.
An important issue raised by the myriad of studies into resting state activation is the implications these findings may have on how task-based fMRI results are interpreted. Typically, fMRI is used to investigate neural activation in the presence of a specific task. The changes in the BOLD response evoked during a task are contrasted with a baseline condition. It has been found that the DMN is easily detectable during a baseline condition (Fox et al., 2005) and it is entirely possible that other ICNs are equally detectable. It may be difficult to interpret the source of the BOLD activation if the fluctuations are correlated to the fMRI task design, as the fluctuations may be as a result of either the task or the resting state network in the baseline condition. Alternatively, the signal may be uncorrelated to the task and treated simply as noise, which will consequently reduce the statistical power of the experiment (Damoiseaux et al., 2006). Accordingly, coherent spontaneous fluctuations have been shown to account for a significant portion of the variability in event-related fMRI responses (Fox et al., 2006). A thorough understanding of the origins and characteristics of fluctuations at rest is of huge importance in the design and interpretation of a wide range of fMRI studies, both task evoked and resting fMRI.
Conclusion
The current study investigates the relationship between patterns of spontaneous activity and patterns of neural activation evoked by an executive function task, which to the best of our knowledge has not before been explored in the literature. We have drawn on the previous work of Gordon et al. (2012) and expanded upon their novel method of spatial multiple regression by applying these methods to an older population completing a task of executive function. We have also explored a path of further validating this method by incorporating an independent group with which we developed a template of independent component networks in the resting state of healthy older adults. We have shown that spatial matches between resting and task-evoked activation patterns can be demonstrated using the Stroop task, a sensitive marker for sustained attention, interference, and inhibition (Langenecker et al., 2004). The findings of the current study also help to support and extend current knowledge surrounding similarities between functional organization during the resting state and task-evoked states.
Footnotes
Author Disclosure Statement
No competing financial interests exist.