
Abstract
Individuals with nonspecific low back pain (NSLBP) show an impaired sensorimotor control. They need significantly more time to perform five consecutive sit-to-stand-to-sit (STSTS) movements compared with healthy controls. Optimal sensorimotor control depends on the coactivation of many brain regions, which have to operate as a coordinated network to achieve correct motor output. Therefore, the examination of brain connectivity from a network perspective is crucial for understanding the factors that drive sensorimotor control. In the current study, potential alterations in structural brain networks of individuals with NSLBP and the correlation with the performance of the STSTS task were investigated. Seventeen individuals with NSLBP and 17 healthy controls were instructed to perform five consecutive STSTS movements as fast as possible. In addition, data of diffusion magnetic resonance imaging were acquired and analyzed using a graph theoretical approach. Results showed that individuals with NSLBP needed significantly more time to perform the STSTS task compared with healthy controls (p < 0.05). Both groups exhibited small-world properties in their structural networks. However, local efficiency was significantly decreased in the patients with NSLBP compared with controls (p < 0.05, false discovery rate [FDR] corrected). Moreover, global efficiency was significantly correlated with the sensorimotor task performance within the NSLBP group (r = −0.73, p = 0.002). Our data show disrupted network organization of white matter networks in patients with NSLBP, which may contribute to their persistent pain and sensorimotor disabilities.
Introduction
Nonspecific low back pain (NSLBP) is an important socioeconomic health problem (Hoy et al., 2014). The lifetime prevalence of NSLBP is up to 84% (Airaksinen et al., 2006), and despite many efforts in the development of treatment strategies, up to 70% of individuals with NSLBP experience at least one recurrence (Pengel et al., 2003). Previous studies have shown that individuals with NSLBP exhibit an impaired sensorimotor control (Brumagne et al., 2008; Laird et al., 2014; Ruhe et al., 2011; Wand et al., 2011). For example, they need significantly more time to perform five consecutive sit-to-stand-to-sit (STSTS) movements compared with healthy controls (Claeys et al., 2012). The STSTS task necessitates optimal postural, pelvic, and lumbosacral coordination, which in turn requires efficient sensorimotor control (Hall et al., 2010).
Optimal sensorimotor control depends on the collaboration and coactivation of many brain regions, which need to operate as a coordinated network to achieve optimal motor output (Goodworth and Peterka, 2009). Therefore, the examination of brain connectivity from a network perspective is crucial in understanding the factors that drive sensorimotor control. Recent evidence suggests that NSLBP is associated with disrupted activity in the default mode network (Baliki et al., 2008; Tagliazucchi et al., 2010), with reduced gray matter density in sensorimotor-related areas (Apkarian et al., 2004; Ivo et al., 2013) and with decreased integrity of the left superior cerebellar peduncle (Pijnenburg et al., 2014). However, there is only limited knowledge on the topological organization of structural brain networks in individuals with NSLBP and the association with sensorimotor control.
Graph theoretical analysis is a multivariate mathematical framework for characterizing topological properties of brain networks (Bassett and Bullmore, 2006; Bullmore and Bassett, 2011; Bullmore and Sporns, 2009; Rubinov and Sporns, 2010; Sporns, 2011). This type of analysis moves away from the traditional neuroimaging approach of examining individual components of the brain, such as regions of interest, and instead concentrates on characterizing the regional and global structure of brain networks. In this way, graph theoretical analysis provides an interesting opportunity to demonstrate the efficiency of information transfer between brain regions and subtle neurobiological changes (McIntosh, 2000; Petrella, 2011; Sporns et al., 2004).
Changes in measures of local specialization and global integration have been associated with a wide range of neurological disorders (for an excellent review, see Griffa et al., 2013) such as schizophrenia (van den Heuvel et al., 2010), Alzheimer's disease (He et al., 2008), and multiple sclerosis (He et al., 2009). Furthermore, there is rapidly growing literature relating individual differences in cognitive performance, such as intelligence and memory, with graph theoretical network measures (Li et al., 2009; van den Heuvel et al., 2009). However, there is little evidence regarding brain network organization in individuals with disorders without typical neurological origin, such as NSLBP.
Only, a few studies investigated the association between motor performance and structural network measures (Caeyenberghs et al., 2012; Wang et al., 2013). Caeyenberghs et al. (2012) showed that poorer balance performance in children with traumatic brain injury is associated with decreased connectivity degree (i.e., number of connections) in the structural network. Wang et al. (2013) reported that global and local efficiency of the structural brain networks is significantly higher in world-class gymnasts compared with controls. However, to the authors' best knowledge, no research has been performed on the association between sensorimotor control and graph theoretical network measures in individuals with NSLBP.
In the present study, we aimed to investigate the organization of structural brain networks in individuals with NSLBP. Based on previous studies showing localized alterations in the NSLBP brain (Apkarian et al., 2004; Schmidt-Wilcke et al., 2006), including our previous diffusion magnetic resonance imaging (MRI) study (Pijnenburg et al., 2014), we expected subtle reductions in the graph theoretical network measures, that is, degree and efficiency, at regional level in the NSLBP group compared with healthy controls.
Furthermore, we expected that decreased connectivity degree/efficiency would be associated with poorer sensorimotor performance. We focused on the STSTS task because (1) it has good test–retest reliability (Simmonds et al., 1998; Smeets et al., 2006), (2) it can be easily used in clinical practice to evaluate functionality of individuals with NSLBP over time (Andersson et al., 2010; Smeets et al., 2006), and (3) it is a prototype of a complex sensorimotor task, requiring integration of sensory and motor information in the brain (Hall et al., 2010). We hypothesized that the network measures would be mainly associated with the STSTS performance on unstable support surface because this support surface enforces a reweighting of sensory signals due to the decreased reliability of sensory signals of the ankle region (Kiers et al., 2011).
Materials and Methods
Participants
A total of 34 individuals, aged between 20 and 50 years, were included in this study (Table 1). The participants were categorized into two groups; 17 individuals with NSLBP (11 women and 6 men) and 17 age-matched (±2 years) healthy individuals (12 women and 5 men). The individuals in the NSLBP group experienced at least 6 months of disabling NSLBP [Oswestry Disability Index, version 2 (adapted Dutch version) (ODI-2) >12% (Fairbank and Pynsent, 2000)]. The healthy individuals had no history of NSLBP and reported a score of 0% on the ODI-2. The exclusion criteria for both groups included a history of specific vestibular problems, cardiovascular and/or neurological disorders, neck problems [Neck Disability Index >6% (Vernon and Mior, 1991)], and previous major trauma and/or surgery of the spine or lower limbs. In addition, each individual had to meet the criteria for MRI-related research. Data from the same cohort regarding local analysis of MRI and proprioceptive reweighting capacity were previously reported (Pijnenburg et al., 2014).
Characteristics of the Participants
Data are presented as mean ± standard deviation.
BMI, body–mass index; NRSback usual, back pain score on the numerical rating scale (0–10) during the last month; NRSback current, back pain score on the numerical rating scale (0–10) at the moment of testing; significance level (p < 0.05); NSLBP, nonspecific low back pain; ODI-2, Oswestry Disability Index, version 2 (adapted Dutch version); N/A, not applicable.
All procedures followed were in accordance with the ethical standards of the local Ethics Committee of Biomedical Sciences, KU Leuven, Belgium (s53802), and with the principles of the Declaration of Helsinki (1964) and its later amendments. In addition, the study was registered at
MRI acquisition
MRI scanning was performed on a Philips 3 Tesla Achieva scanner (Philips) equipped with a 32-channel standard head coil. High-resolution, whole-brain, T1-weighted anatomical scans were obtained with a 3D-TFE sequence (voxel size of 0.98 × 0.98 × 1.2 mm3, repetition time of 9.59 msec, echo time of 4.6 msec, a flip angle of 8°, 182 coronal slices, field of view of 250 × 250 × 218 mm3, and a matrix of 256 × 256 mm2). All T1-weighted anatomical scans were checked by a radiologist to ensure that no brain lesions were present in the total study group. Diffusion-weighted single-shot spin-echo echo planar imaging (DTI SE-EPI) of the entire brain and brainstem was acquired using the following parameters: data acquisition matrix of 96 × 96 mm2, a field of view of 200 × 240 mm2, a repetition time of 7600 msec, and an echo time of 65 msec. Diffusion gradients were applied along 60 noncollinear directions at a b-value of 1300 s/mm2. In total, 58 contiguous sagittal slices (slice thickness = 2.5 mm, voxel size = 2.5 × 2.5 × 2.5 mm3) were acquired. In addition, an average of five volumes without diffusion weighting (b = 0 s/mm2) was obtained.
Diffusion MRI preprocessing
ExploreDTI 4.8.3 was used to process the diffusion MRI data (Jones and Leemans, 2011; Leemans et al., 2009; Pijnenburg et al., 2014). The following multistep procedure was used: (1) the quality of the diffusion MRI data was examined (e.g., looping through the diffusion MRI images at different views (the coronal, sagittal, and axial image plane), (2) corrections for subject motion and eddy current-induced geometrical distortions were performed, and (3) diffusion MRI data were coregistered to the Montreal Neurological Institute (MNI) space.
White matter tractography and network construction
Constrained spherical deconvolution (CSD) can offer a reliable reconstruction of fiber orientation within regions of complex fiber architecture (Jeurissen et al., 2011; Tournier et al., 2007, 2008). This method has been proposed as an approach aiming at solving the well-known critical issue of crossing fibers in studies using the tractography method based on diffusion tensor imaging (DTI). CSD-based tractography (Jeurissen et al., 2011) was performed with a uniform seed point resolution of 2 mm3 and an angle threshold of 30°. Data from the CSD tractography were parcellated using the Automated Anatomical Labeling atlas (AAL) (Tzourio-Mazoyer et al., 2002), resulting in 116 brain regions. Each brain region of the AAL template represented a node of the network. Inter-regional connectivity was then examined by determining the number of streamlines between any two nodes. This value became the edge weight in the 116 by 116 connectivity matrix. Furthermore, each individual association matrix was transformed into an unweighted binary adjacency matrix by changing the entry into one when the number of tracts was greater than or equal to three (these entries were called edges) and, respectively, into zero if the number of tracts was less than three fibers to avoid false-positive connections. Thresholding the connectivity matrices at an absolute threshold results in networks with different number of nodes and degrees (connections) that influence network measures and reduce interpretation of between-group results (van Wijk et al., 2010). Therefore, the constructed adjacency matrices were thresholded at a range of network densities for which the networks were not fragmented (each node had at least one connection with another node in the graph) and displayed small-world properties (nonrandom graphs). The network densities ranging from 0.01 to 0.09 fulfilled these criteria. We compared the networks in this density range in steps of 0.01. Comparing network measures at different network densities results in multiple comparisons. Therefore, we quantified a summary metric using area under the curve (AUC) analysis for each network measure (Bernhardt et al., 2011; Hosseini et al., 2012b). By performing AUC analysis, the comparison between network measures is less sensitive to the thresholding process.
Network measures
The Brain Connectivity Toolbox (Rubinov and Sporns, 2010;
Global network measures
Small-worldness is a property that facilitates an energy-efficient balance between network segregation and network integration. The normalized clustering coefficient and the characteristic path length are the two key measures of small-worldness (Bassett and Bullmore, 2006; Bullmore and Bassett, 2011; Bullmore and Sporns, 2009; Rubinov and Sporns, 2010; Sporns, 2011). The clustering coefficient of a node is a measure of the number of edges that exist between that node and its nearest neighbor nodes. The normalized clustering coefficient of the global network is equal to the average of clustering coefficients across nodes and is a measure of network segregation, which reflects the ability of a network to process information locally. The characteristic path length is the most commonly used measure of network integration and is defined by the average shortest path length between all pairs of nodes in the network. It characterizes the ability of a network in processing information on the global level. In a small-world network, the normalized clustering coefficient is significantly higher than that of random networks (C/Crandom ratio greater than one), while the characteristic path length is comparable with random networks (L/Lrandom ratio close to one) (Maslov and Sneppen, 2002; Milo et al., 2002), resulting in a small-world index greater than one. In summary, a small-world network reflects architecture with optimal balance between local and global information processing.
Regional network measures
Nodal degree is the degree calculated for each of the selected anatomical AAL labels and is considered as a measure of how interactive the node is within the network. Nodes with a high degree are interacting with many other nodes in the network (Hosseini et al., 2012b, 2013).
Local efficiency of a node characterizes the ability of that node for specialized processing of information at the local level. It measures how well the neighbors of a node communicate if that node is removed (Latora and Marchiori, 2001).
Network hubs
Betweenness centrality of a node is defined as the fraction of all shortest paths in the network that pass through a given node (Rubinov and Sporns, 2010). This measures the importance of nodes to overall network integrity. The nodes with the largest betweenness centrality are considered to be the most important regions in the brain network and are called hubs. Hubs are essential for coordinating brain functions through their connectivity with various brain regions (Cole et al., 2010) and facilitate efficient communication across the network. Specifically, a node is considered to be a hub if its nodal betweenness centrality is two standard deviations higher than the mean network betweenness centrality (Bassett et al., 2008; Hosseini et al., 2012b).
STSTS task
The equipment, paradigm parameters, and dependent variables of the STSTS task were identical to a previous study (Claeys et al., 2012). The participants were instructed to sit barefoot on a stool that was placed on a six-channel force plate (Bertec Corporation) with their arms relaxed along their body and their vision occluded by means of nontransparent goggles. The stool height was adjusted for each participant to assure an angle of 90° in both hips and knees. After 15 sec of usual sitting (no instructions on posture were given), participants were asked to perform five consecutive STSTS movements, with a full range of motion and as fast as possible. An investigator stood near the participant to prevent actual falls. The force plate registered anterior–posterior center of pressure displacements. The center of pressure displacements were sampled at 500 Hz using a Micro1401 data acquisition system and Spike2 software (Cambridge Electronic Design). This protocol was performed both with the feet placed on a stable (force plate itself) and on an unstable support surface (50 cm length × 41 cm width × 6 cm thickness, Airex balance pad elite) placed on the force plate. The total duration of the five consecutive STSTS movements was calculated based on the anterior–posterior center of pressure displacement. The starting and end-points of the task were defined by the mean value of the center of pressure during usual sitting before and after the task.
Statistical analyses
Unpaired t-tests were used to calculate group differences in characteristics of the participants.
Significance of between-group differences in small-world, global, and regional network measures was tested employing the AUC statistics within the Graph Analysis Toolbox (Hosseini et al., 2012a, 2012b). AUC accounts for multiple comparisons because the networks are not compared at different densities (Zhang et al., 2011). The curves extracted from thresholding across a range of densities were used. Each of these curves depicted the changes in a specific network measure (for each group) as a function of network density. To test the significance of the between-group differences in AUC of each network measure, the actual between-group difference in AUC for each network measure was placed in the corresponding permutation distribution and the p-value was calculated based on its percentile position. By performing AUC analysis, the comparison between network measures is less sensitive to the thresholding process. The p-values reported for regional differences between groups are corrected for multiple comparisons using the false discovery rate, with a statistical threshold of p < 0.05.
Differences in STSTS performance were analyzed with a 2 × 2 repeated measures analysis of variance (ANOVA) with group as between-subject factor (NSLBP group and healthy control group) and surface as within-subject factor (stable support surface and unstable support surface). The significance level for group differences in STSTS performance was set at p < 0.05.
Furthermore, the behavioral parameters, that is, the duration of the STSTS task on the stable and unstable support surfaces, were used to assess relationships between sensorimotor control and global network measures (including normalized path length, normalized clustering coefficient, small-worldness, global efficiency, clustering, and local efficiency) using partial correlations (while correcting for age) within each of the groups. The outliers labeling rule (with a g-factor of 2.2) (Hoaglin and Inglewicz, 1987) was applied to detect outliers from both the STSTS performance and the network measures. These values were excluded pairwise from the correlation analysis.
Finally, we conducted region-specific partial correlation analyses (with the effect of age removed) between the regional network metrics (i.e., local efficiency and degree) and STSTS performance within each group. Bonferroni corrections for multiple comparisons were made, hence p < 0.008 was considered significant following correction for the correlation analyses regarding the six global network metrics and p < 0.0004 for the node-specific correlation analyses regarding the 116 ROIs. The statistical analysis was performed with SPSS 19.
Results
Characteristics of the participants
No significant differences in demographic characteristics were found between groups (p > 0.05, as shown in Table 1), except for weight (p = 0.036). The weight of the participants was not significantly correlated with the total time needed to perform the STSTS task on stable and unstable support surfaces and with the global network measures (p > 0.05). Therefore, weight was not included in the subsequent analysis.
Small-world network measures
There were no significant group differences in the key measures of small-worldness between individuals with NSLBP and healthy controls over the range of densities (normalized clustering coefficient: p AUC = 0.26, normalized path length: p AUC = 0.90, small-world index: p AUC = 0.23). In both groups, normalized clustering coefficients were greater than one (random clustering) and normalized characteristic path lengths were close to one (near random path length). In other words, patients with NSLBP displayed small-world values close to the values of the brain networks of healthy controls, suggesting an intact overall organization of the structural brain network in patients with NSLBP (Fig. 1).

Group differences in graph metrics. Patients with NSLBP are indicated in blue, healthy controls are represented in red. NSLBP, nonspecific low back pain. Color images available online at
Global network measures
Compared with healthy controls, the structural network of individuals with NSLBP showed significantly smaller values of local efficiency in the NSLBP network (p AUC = 0.04). A marginal significant effect of group was also seen for the clustering coefficient (p AUC = 0.057). These results indicate that local segregation is affected in NSLBP. We did not find any significant group difference for the measure of global integration (global efficiency, p AUC = 0.71). The absence of this group effect suggests that global connectivity is relatively intact in individuals with NSLBP (Fig. 1).
Regional network measures
Nodal degree and local efficiency of the (sub)cortical regions in the white matter networks were examined between the two groups. We found a significant group difference in degree in the left precentral gyrus after correction for multiple comparisons (false discovery rate, p < 0.05). Compared with controls, patients with NSLBP showed significantly higher connectivity degree in the left precentral gyrus (p corr = 0.023) (Fig. 1).
Network hubs
To identify the hub regions, we calculated the betweenness centrality for each node of each group. This analysis revealed that both groups exhibited hubs in the left medial part of the superior frontal gyrus, left and right lingual gyrus, the left and right precuneus, and the right putamen. Of note, the right superior frontal gyrus and the left and right Crus I of the cerebellum were only identified as hub nodes in the individuals with NSLBP, and the left and right thalamus were only identified as a hub in the healthy control group. This result is indicative of a difference in hub distribution between both groups (Fig. 2).
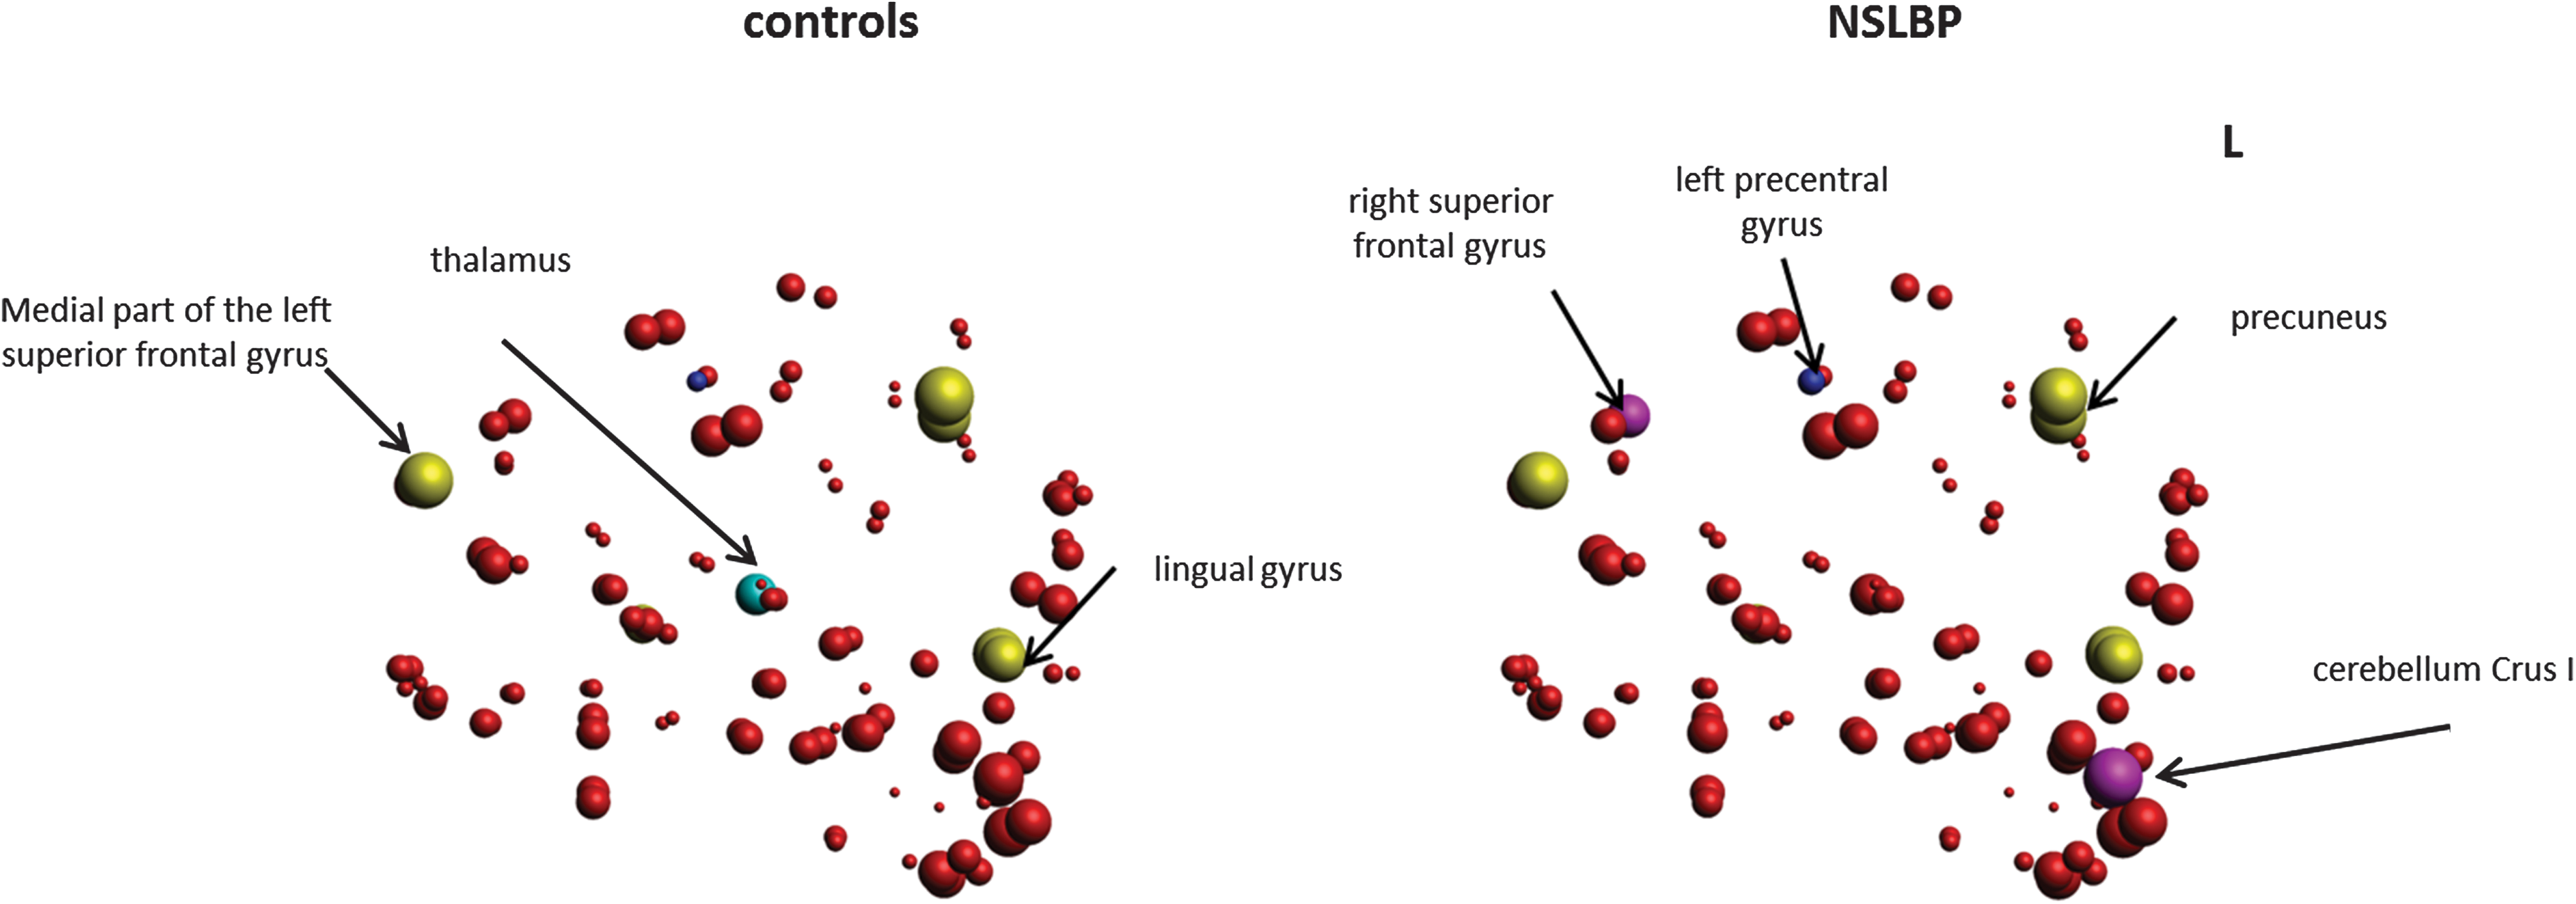
Group differences in connectivity degree (left panel). Healthy controls and (right panel) patients with NSLBP. Size of the regions of interest (spheres) represents connectivity degree. Blue sphere indicating higher connectivity degree in left precentral gyrus (FDR corrected) in patients with NSLBP. Moreover, the hubs regions are shown. For the NSLBP group, the identified hubs included right superior frontal gyrus and Cerebellum Crus I regions (indicated in magenta). The unique hub for the control group included the thalamus (indicated in cyan). The common hubs for both groups are indicated in yellow. FDR, false discovery rate. Color images available online at
STSTS task
Repeated measures ANOVA on the duration of the STSTS task revealed a significant main effect of the factors group (F = 11.348, p = 0.002) and surface (F = 6.29, p = 0.017). No interaction effect was present (p > 0.05). The main effect of group showed that individuals with NSLBP needed significantly more time to perform five consecutive STSTS movements on stable and unstable support surfaces (stable: 18.1 ±6.9 sec, unstable: 16.8 ± 5.9 sec) compared with healthy controls (stable: 12.9 ± 2.5 sec, unstable: 11.5 ± 2.0 sec) (p = 0.002). Unexpectedly, the main effect of surface showed a significant decrease in duration of the STSTS task on unstable support surface (NSLBP: 16.8 ± 5.9 sec, healthy controls: 11.5 ± 2.0 sec) compared with the stable condition (NSLBP: 18.1 ± 6.9 sec, healthy: 12.9 ± 2.5 sec), irrespective of group (p = 0.017).
Association between network measures and the STSTS task in individuals with NSLBP and healthy controls
To determine the relationships between sensorimotor control and graph metrics, partial correlation analysis with age as confounding covariate was separately performed for the NSLBP and control groups. In the control group, none of the STSTS task measures showed significant correlations with the network metrics. The following descriptions focus on the results in the NSLBP group. Global efficiency was significantly associated with the duration of five consecutive STSTS movements on unstable support surface (r = −0.73, p = 0.002, Fig. 3) in individuals with NSLBP, indicating that decreased efficiency was associated with a worse performance of the STSTS task on unstable support surface. No significant results were obtained with the other global network metrics. The relationships between regional network metrics and STSTS performance did not survive correction for multiple comparisons.

Plot indicating the relationship (while correcting for age) between global efficiency (AUC) and the duration of five consecutive STSTS movements on unstable support surface. AUC, area under the curve; STSTS, sit-to-stand-to-sit. Color images available online at
Discussion
To the authors' best knowledge, this is the first study investigating alterations in white matter networks of individuals with NSLBP using graph theoretical analysis and the correlation with the performance of a complex sensorimotor task. Individuals with NSLBP needed significantly more time to perform five consecutive STSTS movements on stable and unstable support surfaces compared with healthy controls. Both groups exhibited small-world properties in their structural networks. However, local efficiency was significantly decreased in the patients with NSLBP compared with controls. Moreover, global efficiency was significantly correlated with the sensorimotor task performance within the NSLBP group. Our data show disrupted network organization of white matter networks in patients with NSLBP, which may contribute to their persistent pain and sensorimotor disabilities.
Group differences in structural white matter networks
The structural brain networks of both individuals with NSLBP and healthy controls exhibited a higher normalized cluster coefficient, but a similar characteristic path length compared with random networks. This result is indicative of a comparable small-world architecture of structural brain networks in individuals with NSLBP and healthy individuals. These results suggest an effective information transfer within the brain, with a relatively low wiring cost in both groups (He et al., 2009). This is in accordance with previous studies showing a small-world architecture not only in the brain networks of healthy individuals (Achard et al., 2006; Hagmann et al., 2007; He et al., 2007; Salvador et al., 2005) but also in other chronic pain conditions, such as patients with migraine (Liu et al., 2012) and female patients with irritable bowel syndrome (Labus et al., 2014). Furthermore, the absence of group effects on global efficiency marks the fact that NSLBP does not alter/affect the global organization of the brain networks.
In contrast, statistically significant group differences were found for network indices of local efficiency of information transfer between regions. Structural networks of individuals with NSLBP exhibited decreases in local efficiency and marginal decreases in clustering coefficient, indicating that the effects on local efficiency (and clustering coefficient) are likely to be related to a reduced local connectivity rather than global organizational effects.
With regard to regional network properties, we found an increased connectivity degree in the left precentral gyrus in the NSLBP group compared with healthy controls. Although the primary motor cortex (M1) is not part of the pain matrix (Lee and Tracey, 2013), M1 is considered to play a key role in modulation of pain in different chronic pain conditions (for reviews, see Castillo et al., 2014; Parker et al., 2016). Changes in M1 have also been found in animal models of pain (Lucas et al., 2011). Thus, the present study complements clinical and experimental studies of chronic pain and emphasizes the maladaptive plasticity of the primary motor cortex. The observed increased connectivity degree of the primary motor cortex in individuals with NSLBP may indicate a possible compensatory mechanism for decreased local connectivity (i.e., decreased local efficiency).
Importance of specific brain regions for patients with NSLBP
A difference between individuals with NSLBP and healthy controls was observed in the distribution of hub regions with high betweenness centrality. Compared with healthy controls, the right superior frontal gyrus and bilateral cerebellum Crus I were found to be more critical for controlling information in the individuals with NSLBP. The superior frontal gyrus is attributed to a variety of functions in both cognitive and motor control (Chouinard and Paus, 2006; Li et al., 2013). Contemporary clinical studies suggest that the posterior cerebellum contributes to complex cognitive operations (e.g., Schmahmann et al., 2007). Conversely, in the healthy control group, an additional hub was identified in the left and right thalamus. The thalamus is generally considered as a major relay area in the brain for the transmission of a variety of signals such as sensory, motor, and cognitive signals (Herrero et al., 2002). This difference in hub distribution between the groups indicates a subtle reorganization of the most important regions in the structural network of individuals with NSLBP compared with healthy controls.
Group differences in sensorimotor control
In accordance with a previous study (Claeys et al., 2012), the current group of individuals with NSLBP needed significantly more time to perform five consecutive STSTS movements on both stable and unstable support surfaces compared with the healthy controls. A decreased ability to weight proprioceptive signals adaptively, as part of sensorimotor control, was observed to be responsible for this impaired STSTS performance (Brumagne et al., 2008; Claeys et al., 2012). This impaired proprioceptive weighting capacity is particularly prominent on the unstable support surface because this condition enforces an additional reweighting of proprioceptive signals due to the decreased reliability of proprioceptive signals from the ankle region (Kiers et al., 2011). Our hypothesis is supported by a recent study that demonstrated an association between the proprioceptive reweighting capacity and microstructural integrity of the superior cerebellar peduncle in individuals with NSLBP and healthy controls (Pijnenburg et al., 2014). However, this is the first study that investigated the association between the sensorimotor STSTS task and the topological properties of structural brain networks in individuals with NSLBP. The behavioral relevance of these topological properties is discussed in the next paragraph.
Behavioral relevance of network alterations in individuals with NSLBP
Previously unreported, we have now shown associations between sensorimotor deficits and structural brain organization in patients with NSLBP from a network perspective. To our knowledge, only two studies have examined the relationship between topological parameters and motor functioning (Caeyenberghs et al., 2012; Wang et al., 2013). In the present study, an increased duration of the sensorimotor task (worse performance) on the unstable support surface was associated with decreased global efficiency in individuals with NSLBP. This is consistent with the notion that successful STSTS performance requires integration of sensory and motor information between remote regions in the brain (Hall et al., 2010).
Limitations and conclusions
Limitations of our study include a relatively small sample size. However, our results survived corrections for multiple comparisons and thus can be considered robust. In addition, the DWI acquisition was suboptimal for CSD-based tractography (Tournier et al., 2008) as the diffusion weighting was relatively low (1300 s/mm2). Nevertheless, fiber crossings, present in 60–90% of the white matter voxels (Jeurissen et al., 2013), can reliably be identified with CSD (Jeurissen et al., 2011; Tournier et al., 2007, 2008), and thus, using CSD is highly beneficial in comparison with DTI, where fiber crossings cannot be identified. Finally, the correlation between our observed network alterations based on diffusion MRI and morphological (based on gray matter changes) and functional network (such as resting state) alterations based on other MRI modalities remain to be further investigated.
Taking into account these limitations, the present study is the first report illustrating associations between network metrics and sensorimotor control in individuals with NSLBP. Although small-world properties were present for both NSLBP and control networks, local segregation was significantly altered in individuals with NSLBP. Specifically, individuals with NSLBP showed lower values of local efficiency. At the nodal level, we observed increased connectivity degree of the primary motor cortex in individuals with NSLBP, representing an adaptive mechanism for decreased local connectivity. Furthermore, decreased global efficiency was correlated with a longer duration to perform five consecutive STSTS movements in the NSLBP group. Thus, our results suggest an altered local connectivity in the large-scale brain systems in patients with NSLBP and provide structural insights into the chronic pain connectome.
Footnotes
Acknowledgments
This work was supported by the Agency for Innovation by Science and Technology–Flanders (IWT) (PhD fellowships M.P. and N.G., grant number 141037) (
Author Disclosure Statement
No competing financial interests exist.