
Abstract
In the global war on terror, the increased use of improvised explosive devices has resulted in increased incidence of blast-related mild traumatic brain injury (mTBI). Diagnosing mTBI is both challenging and controversial due to heterogeneity of injury location, trauma intensity, transient symptoms, and absence of focal biomarkers on standard clinical imaging modalities. The goal of this study is to identify a brain biomarker that is sensitive to mTBI injury. Research suggests the thalamus may be sensitive to changes induced by mTBI. A significant number of connections to and from various brain regions converge at the thalamus. In addition, the thalamus is involved in information processing, integration, and regulation of specific behaviors and mood. In this study, changes in task-free thalamic networks as quantified by graph theory measures in mTBI blast (N = 186), mTBI nonblast (N = 80), and controls (N = 21) were compared. Results show that the blast mTBI group had significant hyper-connectivity compared with the controls and nonblast mTBI group. However, after controlling for post-traumatic stress symptoms (PTSS), the blast mTBI group was not different from the controls, but the nonblast mTBI group showed significant hypo-connectivity. The results suggest that there are differences in the mechanisms of injury related to mTBI as reflected in the architecture of the thalamic networks. However, the effect of PTSS and its relationship to mTBI is difficult to distinguish and warrants more research.
Introduction
T
Most mTBI symptoms are transient and generally resolve within a few months postinjury; however, ∼10–20% of individuals develop persistent postconcussive symptoms (Ruff, 2005) that contribute to chronic dysfunction, limiting activities of daily living and inhibiting quality of life. The exact effects of blast-specific injury on the brain and related cognitive and functional sequelae are not clearly understood at present (Belanger et al., 2009; Chen et al., 2012; Lange et al., 2012; Tompkins et al., 2013) and there is no current definitive model for the effects of blast on the human brain. The goal of this study is to identify a central biomarker in the brain that is sensitive to injury pertaining to blast-related mTBI.
Computer simulations suggest that blast induces TBI through a rapid increase and decrease in pressure that causes the brain to compress and expand rapidly. Such rapid changes could cause shearing of brain tissue, rupturing of blood vessels, and potential contusions and hemorrhaging (Chafi et al., 2010). Alternatively, the blast wave could cause the head to experience sudden and rapid acceleration and/or deceleration, which induces alternating anterior–posterior impacts inside the skull (Chafi et al., 2010). It is also proposed that blast pressure wave exposure to the chest can induce mild to moderate TBI via a thoracic mechanism (Courtney and Courtney, 2009).
Some of these simulations and models have been tested in animals and significant brain changes such as increased intracranial pressure, oxidative stress, widespread microglia activation, intracranial hematomas, edema, brain swelling, diffuse and focal neurodegeneration, diffuse axonal injury, breakdown of the blood–brain barrier, small brain infarctions and increased number of T2 hyperintensities (Cernak et al., 2001; Chen et al., 2012; Cho et al., 2013; Kimura et al., 1996; Long et al., 2014; Lu et al., 2012; Readnower et al., 2010; Risling et al., 2011; Svetlov et al., 2010; Tompkins et al., 2013; Wang et al., 2011). In addition, deficits in sensory, motor, cognitive, and emotional function are observed in animal models (Chen et al., 2012; Cho et al., 2013; Milman et al., 2005; Wang et al., 2011), even after exposure to low-level blasts (Säljö et al., 2009).
However, in human subjects with mTBI, focal central nervous system indicators are often absent in standard clinical imaging modalities such as CT and MRI (Ruff, 2005). Diffusion tensor imaging (DTI) studies have shown the presence of axonal injury in blast exposed military subjects (Mac Donald et al., 2011). However, these findings were inconclusive due to similar findings in nonblast TBI civilians (Inglese et al., 2005; Xu et al., 2007). Neurocognitive studies have reported increased depression, stress, emotional distress, and cognitive deficits after blast-related TBI (Belanger et al., 2011; Lange et al., 2012). Nonetheless, the results did not reveal significant differences between blast and nonblast groups and were overall inconclusive.
Every TBI is different and unique with regards to the source, forces, direction, and intensity of the trauma; however, there are similar symptoms, and effects (cognitive and emotional) between subjects. This argues that a possible common network or system in the brain is affected by TBI. We propose that the thalamus may be a suitable candidate as a central biomarker because this region is a focal point where a significant number of brain connections converge (Kandel et al., 2000). Considerable white matter bundles both within and passing through the thalamus (Kandel et al., 2000) make it instrumental to in relaying information throughout the brain (Grossman et al., 2012, 2013; Kandel et al., 2000). Furthermore, the thalamus is critical with processing, integrating, and communicating information across multiple brain regions and multifunctional networks and is integral to basic inhibitory control and coordination, and regulation of behavior (Carrera and Bogousslavsky, 2006; Kandel et al., 2000).
Research suggests that thalamic networks are sparser in mTBI subjects (Nathan et al., 2012) and aberrant connectivity patterns within the thalamus (i.e., lack of symmetry and hyper-connectivity) (Sours et al., 2015; Tang et al., 2011) were also observed. Simulations using a finite element head model (with helmets worn), revealed increased intracranial pressure with impact, but high shear stress was concentrated in the upper brain stem and thalamus regions (Zhang et al., 2004).
In blast mTBI subjects, a correlation was observed between the integrity of white matter tracts connecting the frontal lobe and reduced electroenchephalographic (EEG) phase synchrony between lateral and contralateral frontal brain regions (Sponheim et al., 2011) even though explicit cognitive deficits were absent. Other researchers have reported that whole brain fractional anisotropy (FA) measurements obtained from DTI were not significantly different between controls, civilian TBI, and blast TBI subjects (Benzinger et al., 2009). However, localized white matter integrity was reduced within the thalamus of blast TBI subjects (Benzinger et al., 2009).
The focus of this study is to determine the extent to which thalamic disruption differs in blast compared to nonblast mTBI. Specifically, this study uses graph theoretic techniques to elucidate the role of the thalamus in blast-related mTBI as reflected by changes in thalamic not network architecture. Common graph theory measures used to describe network topology are mean cluster coefficient, efficiency, characteristic path length, diameter, density, and degrees. The mean cluster coefficient is indicative of the fraction of a specific node's neighbors that are also neighbors with one another, therefore forming a triangle (Boccaletti et al., 2006; Rubinov and Sporns, 2010). This quantifies level of local structure that is present within a densely interconnected group of nodes and represents the level of segregation for functional processing (Boccaletti et al., 2006; Rubinov and Sporns, 2010). The mean cluster coefficient determines resistance to failure and is indicative of the robustness of a specific network (Boccaletti et al., 2006; Rubinov and Sporns, 2010). The measure of efficiency pertains to traffic capacity of a network, and dictates how reliably information is able to flow within a particular network (Boccaletti et al., 2006; Rubinov and Sporns, 2010). The characteristic path length measures the average shortest distance between all pairs of nodes in the network, and conversely, the diameter measures the longest distance (Boccaletti et al., 2006; Rubinov and Sporns, 2010). Density is a measure of the total number of connections within a specific network (Boccaletti et al., 2006; Rubinov and Sporns, 2010) and the measure of degrees reflects the total number of links connected to a specific node (Boccaletti et al., 2006; Rubinov and Sporns, 2010).
The first hypothesis is the quantification of changes within intrinsic functional networks of the thalamus during a task-free functional magnetic resonance imaging (fMRI) scan may serve as a central biomarker of mTBI injury. The second hypothesis is that the thalamus is sensitive and differentially affected in blast versus nonblast mTBI.
Materials and Methods
Subjects
A total of 21 non-TBI control subjects (age = 34.3 ± 8.3 years, M/F = 14/7) were recruited for this study. Control subjects were screened to ensure that they did not have a history of TBI, previous diagnosis of severe psychiatric or neurological disorders, and were neither pregnant nor breast-feeding. The TBI subjects were divided into a blast group (N = 186, age = 32.4 ± 7.3 years, M/F = 183/3) and a nonblast group (N = 80, age = 33.9 ± 9.1 years, M/F = 68/12). Classification of injury mechanism was determined by comprehensive review of the individual subject's medical records. Subjects were categorized in the blast group if they sustained an mTBI in which blast was a mechanism. Blast injury involved both blast and secondary, tertiary or quaternary blast-related mechanisms of injury (DePalma et al., 2005). Nonblast subjects were those who sustained an mTBI via nonblast means such as falls, motor vehicle accidents, blunt force trauma, sports, and others.
All mTBI subjects were active duty service members with a clinical diagnosis of mTBI by healthcare professionals at Walter Reed National Military Medical Center (WRNMMC). Diagnoses were based on a comprehensive clinical screening evaluation that followed standard Department of Defense and Department of Veterans Affairs definition of TBI (French and Parkinson, 2008). TBI evaluation consisted of (1) patient interviews with a neurologist, psychiatrist, and clinical neuropsychologist, (2) a medical chart review including in-theater medical records when available, (3) case conferencing, and (4) family interview and gathering of other collateral information (if available). Severity of mTBI was based on Glasgow Coma Scale scores (if available), presence and duration of post-traumatic amnesia (PTA), loss of consciousness (LOC), or alteration of consciousness (AOC), and neuroradiological scan results were used for diagnosis and to determine TBI severity. Information concerning duration of LOC, PTA, and AOC are typically obtained from the medical records of the initial treatment facility in the acute phase of injury and summarized in Table 1. All blast mTBI subjects (mean = 1192 ± 978 days) and nonblast mTBI subjects (mean = 1026 ± 1008 days) recruited for this study were at least 3 months post injury. Exclusion criteria for mTBI subjects included the inability to consent themselves, active enrollment in other randomized controlled treatment trials, history of prior severe neurologic or psychiatric condition, pregnancy, or breast feeding. Mild TBI subjects were screened for prescribed medications on the day of the scan (Table 2). Licensed clinical neuroradiologists examined the MRI anatomical data for structural anomalies. The Institutional Review Board at WRNMMC approved this study and all subjects provided written informed consent.
mTBI, mild traumatic brain injury.
CNS, central nervous system.
Self-report assessments
Self-report behavioral measures were administered to the participants by the study coordinator. These reports consisted of the Neurobehavioral Symptom Inventory (NSI), Post-traumatic Stress Disorder Check List-Civilian Version (PCL-C), Combat Exposure Scale (CES), and the 36-Item Short Form Health Survey (SF36). For the NSI, PCL-C, and CES, higher scores reflect greater symptoms severity whereas, for the SF-36, lower scores indicate the presence of more disabling symptoms.
MRI data acquisition
Images were acquired on a 3T MRI scanner (GE Healthcare, Waukesha, WI) with a 32-channel phased array head coil (MR Instruments, Inc., Minnetonka, MI). Data used in this work were T1-weighted structural scans of the entire brain (3D BRAVO sequence: TR/TE = 6.7/2.5 ms, FA = 12°, Resolution = 1.0 × 1.0 × 1.2 mm) and the fMRI resting state task (EPI pulse sequence, sagittal plane, TE/TR = 25/2000 ms, FA = 60°, in plane resolution = 3.75 × 3.75 × 4 mm, matrix size 64 × 64 and FOV 240 × 240). A B-field map was also acquired. The task-free scan was 6 min long and subjects had their eyes closed for consistency, to reduce distractions and potential eyestrain from fixating on a point for the entire duration of the 6-min scan. The task-free scan was the first in the series of functional MRI paradigms and all subjects experienced the identical acquisition protocol in the same order.
Data analysis
The ANTS (Avants et al., 2011) software package was used to transform T1-weighted images to the Montreal Neurological Institute (MNI) 152 template (Mazziotta et al., 1995). The first three volumes were removed, followed with slice-time and rigid body motion correction using AFNI (Cox, 1996) and the removal of cardiac and respiratory signal effects using FSL (Smith et al., 2004). B-field map correction was performed and subsequently the EPI data sets were aligned to the anatomical data sets followed by warping of the EPI data to the MNI-152 template. A 6 mm Full Width at Half Maximum Gaussian kernel was applied to smooth the data, and the individual voxel values were normalized to percent signal change with respect to the mean. The results for each participant were inspected for excessive motion, inaccurate physiological signal peak detection, poor spatial alignment, and improper B-field map correction. Motion parameters, their derivatives, and whole brain white matter and cerebral spinal fluid signals were regressed out from the EPI data set, and a bandpass filter (0.01–0.1 Hz) was applied using the 3dDeconvolve package (Ward, 2000) in AFNI (Cox, 1996). The left and right thalamic masks were obtained from the Harvard Subcortical atlas (Fischl et al., 2004) and 169 voxels (3.75 × 3.75 × 4 mm) within each of these regions were extracted. The MATLAB (Mathworks, Inc., Natick, MA) software package was used to compute correlation matrices for each node (voxel) with other nodes within the left, right, and combined left and right thalamic networks; for each individual subject using the inbuilt MATLAB cross correlation function. Subsequently, each individual subject's correlation matrix was thresholded using a Pearson's correlation coefficient value of R 2 ≥ 0.90, p < 0.01. The correlation matrix was binarized to create an unweighted and undirected network (Rubinov and Sporns, 2010). Next, graph theoretic measures of mean cluster coefficient, efficiency, density, characteristic path length, degrees, and diameter were calculated for intrinsic networks of the left and right thalamus separately and for both networks combined for each individual subject, using the Brain Connectivity Tool Box (Rubinov and Sporns, 2010) in MATLAB.
The SPSS software package (IBM, Inc., Armonk, NY) was used for statistical analysis. The measure of age was centered and subsequently regressed out from each of the graph theory measures. The homogeneity of the variances was tested using Levene's test to determine the suitability of analysis of variance (ANOVA). The one-way Welch ANOVA was used for measures that violated the homogeneity of variance test. The Games-Howell test was used for post hoc multiple comparisons for measures that were in violation of the homogeneity of variance. Conversely, Bonferroni post hoc tests were used for measures that were not in violation of the homogeneity of variance. The one-way ANOVA analysis and post hoc comparisons were used to analyze the self report data sets.
The distribution of the degree coefficient was calculated from each subject, within each group, and the log of the measurements plotted to determine if a power law distribution was present. The occurrence of a power law distribution reflects the self-organization in which a system maintains homeostasis across multiple time scales (Bak and Paczuski, 1995). This is characteristic of a resilient system even under severe perturbations, in this case the thalamic networks that are resilient to changes such as those potentially caused by mTBI. The exponential decay parameter provides a description of the power law distribution, if present, and this provides insight regarding network topology, such as being scale-free or random (Boccaletti et al., 2006; Eguiluz et al., 2005; Onnela et al., 2007), of each of the thalamic networks with respect to the subject groups. Calculating an exact value of the exponential decay parameter, λ is arguably difficult (Eguiluz et al., 2005), however, we approximate the exponential decay parameter using the range of data from the 10th to the 90th percentile of the total data distribution.
Results
The results from Levene's test showed significant differences (p < 0.05) between groups for all graph theory measures, except for the measure of characteristic path length and diameter in the left and right thalamus and for the diameter measure in the combined thalamic network. The one-way ANOVA results (Table 3) suggest an overall significant difference between groups for each graph theory measure for the left thalamus, right thalamus, and combined thalamic network.
W—denotes significant difference from Welch ANOVA; R—denotes significant difference from one-way ANOVA.
ANOVA, analysis of variance.
Results of post hoc multiple comparisons analysis (Table 4) show significant differences between the control group and the blast mTBI group for graph theory measures in the left thalamus, right thalamus, and combined thalamic network. However, the control group was not significantly different from the nonblast mTBI group. The graph theoretic measures were significantly different between blast and nonblast mTBI for all of the graph theory measures.
GH—denotes significant difference at p < 0.05, Games-Howell post hoc test. B—denotes significant difference at p < 0.05, Bonferroni post hoc test.
Results suggest for measures describing local structure and information traffic capacity (mean cluster coefficient, efficiency, density, and degrees), in both the right and left thalamus, the blast mTBI group had significantly higher values compared with the control and nonblast mTBI group. Conversely, measures describing inter-connectivity of nodes (the characteristic path length and diameter) were lower in the blast mTBI group in contrast to nonblast mTBI and control groups. A general trend was observed wherein the nonblast mTBI group had lower measures of local structure in both thalamus and the combined thalamic network. Figure 1 shows each of the graph theory measures for each group for the left, right and combined thalamic networks.
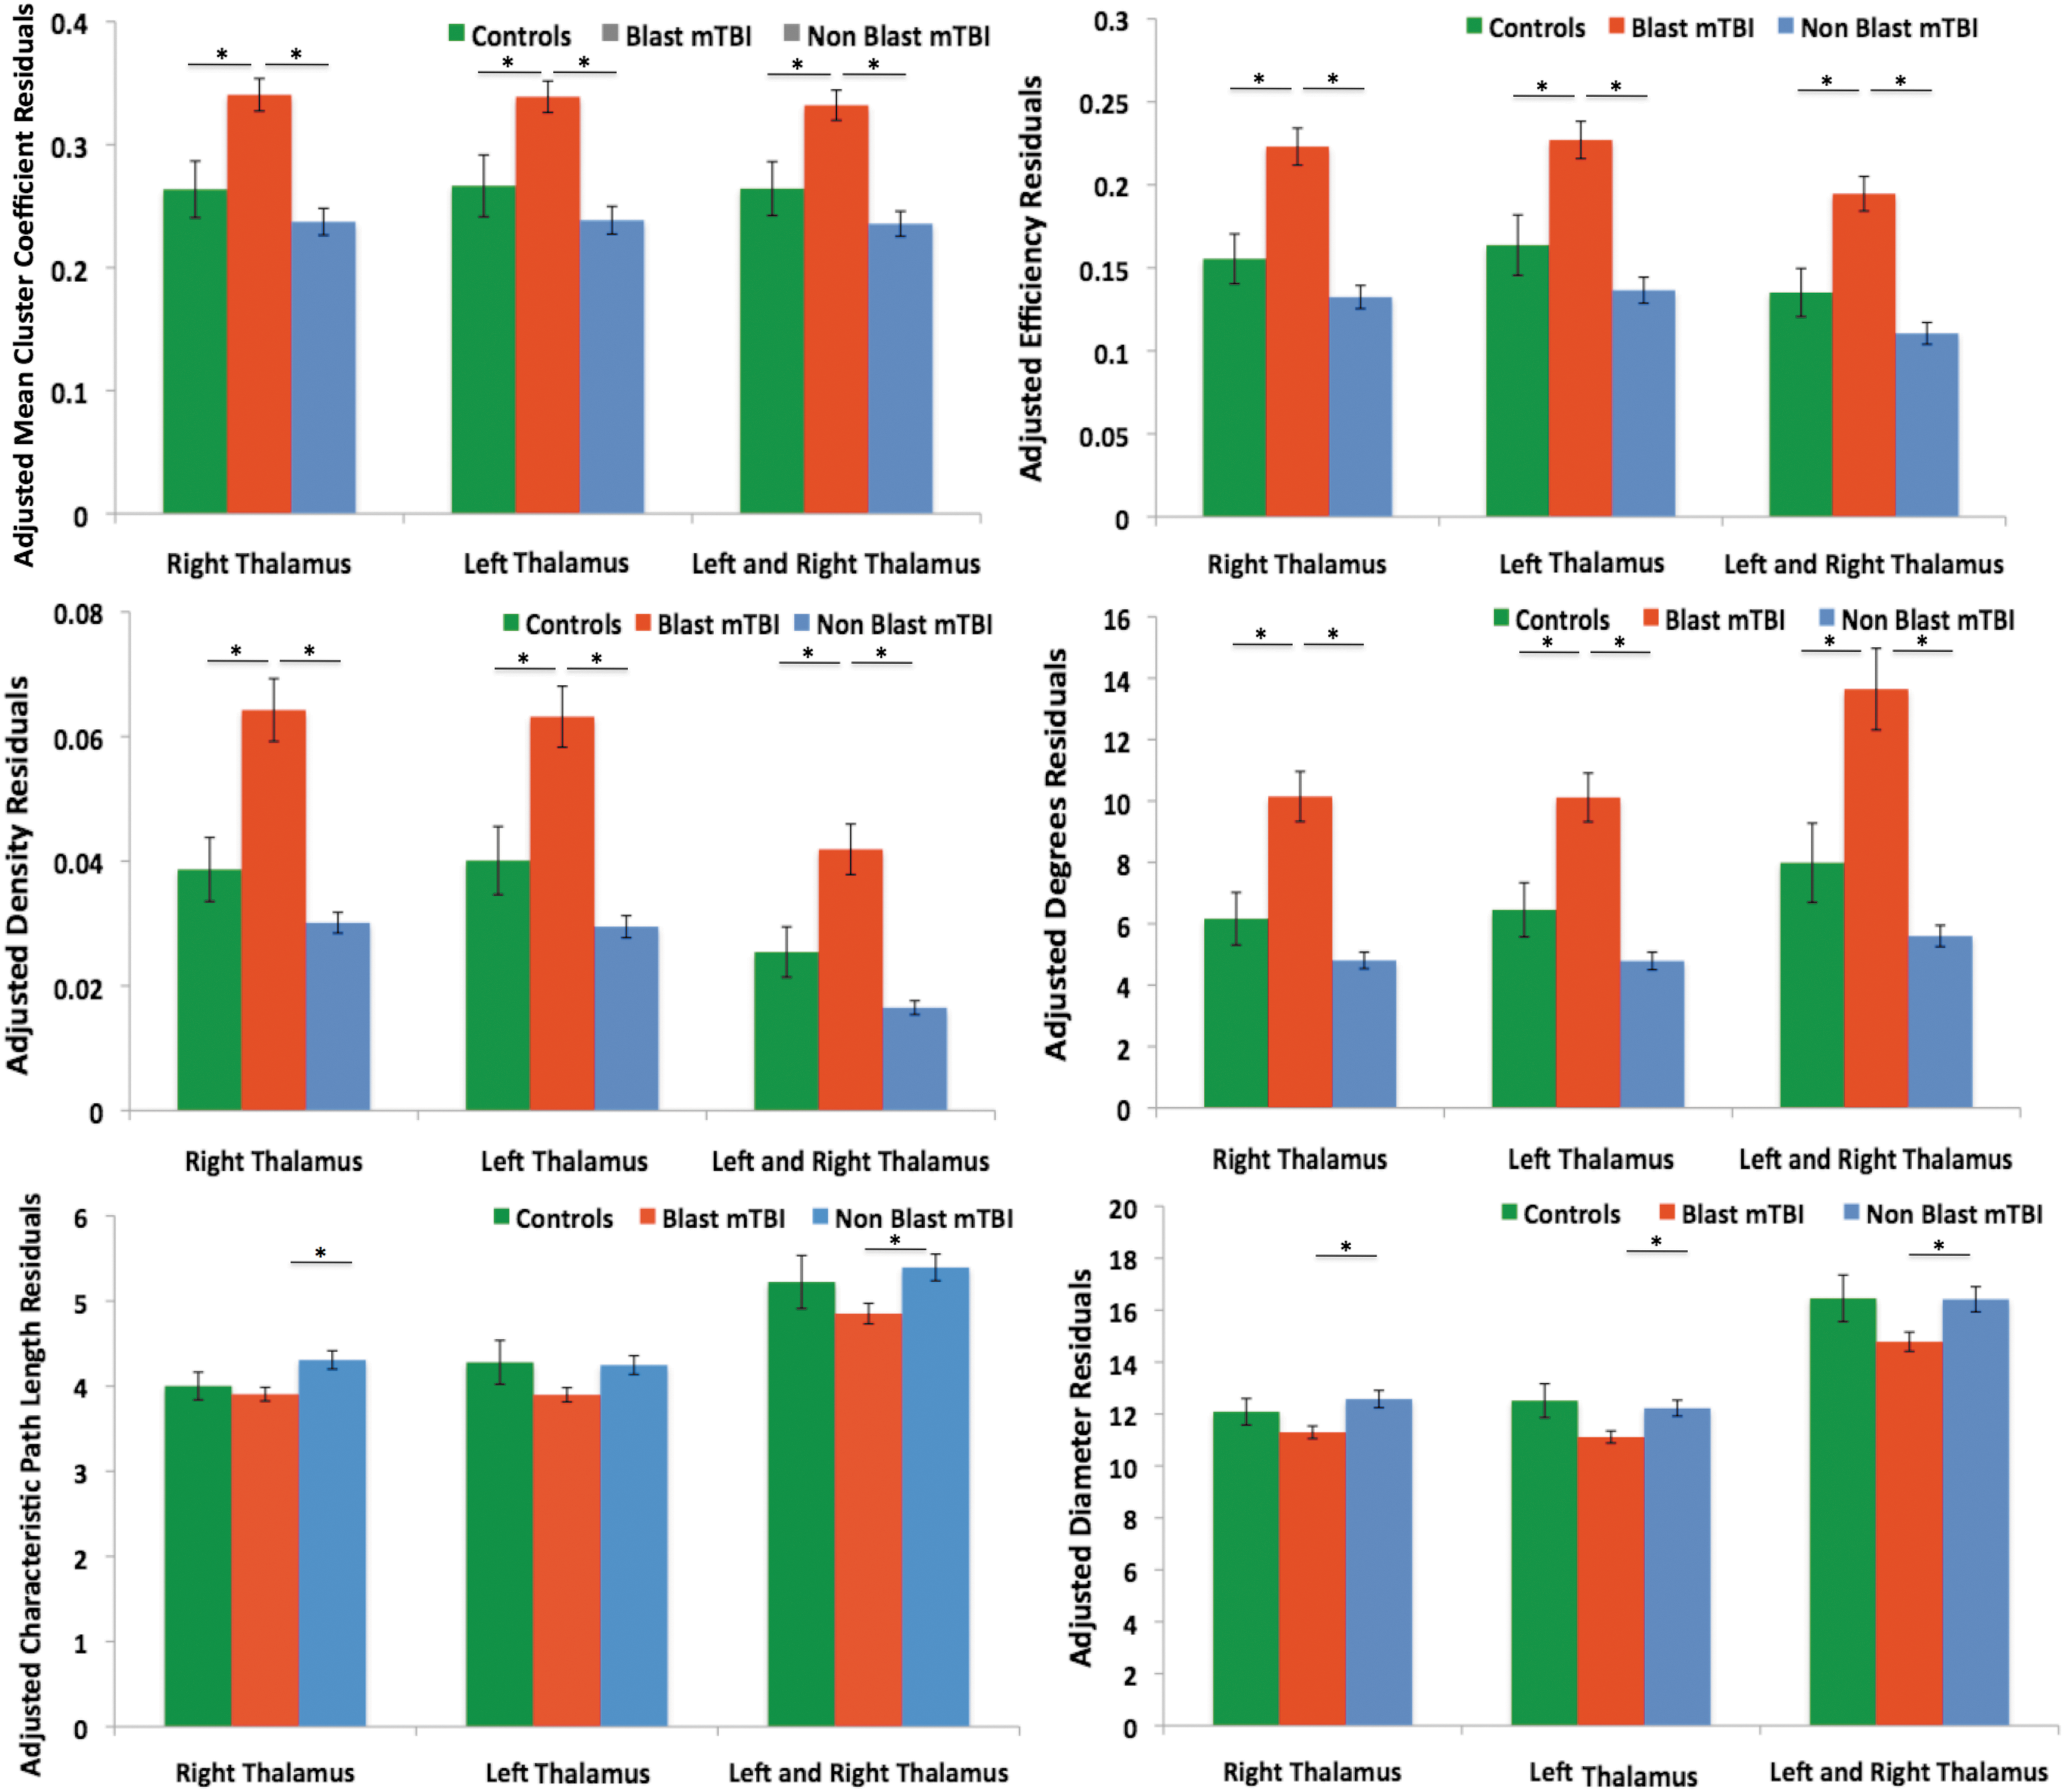
Average graph theory measure of left and right intrinsic thalamic networks, corrected for age with ±1 SEM. *Statistical significance at p < 0.05 as determined by post hoc pairwise comparisons. Color images available online at
The exponential decay term, λ for the distribution of the degrees for each group within the left and right thalamic region was estimated. The approximate exponential decay terms for the left and right thalamic networks (Table 5) show a high power law scaling characteristic for the control and blast mTBI groups (Figure 2). The presence of power law scaling indicates that the functional networks are scale-free, therefore implying that the networks are resilient in which a finite number of nodes have broad connectivity to most other nodes within the intrinsic network (Eguiluz et al., 2005). The exponential decay term (Table 5) for the nonblast group is larger than three, indicating a more dispersed network topology with fewer connected nodes, therefore many properties of scale-free network topology does not hold, consequently making the networks less tolerant of disruptions (Boccaletti et al., 2006; Eguiluz, et al., 2005; Onnela, et al., 2007).
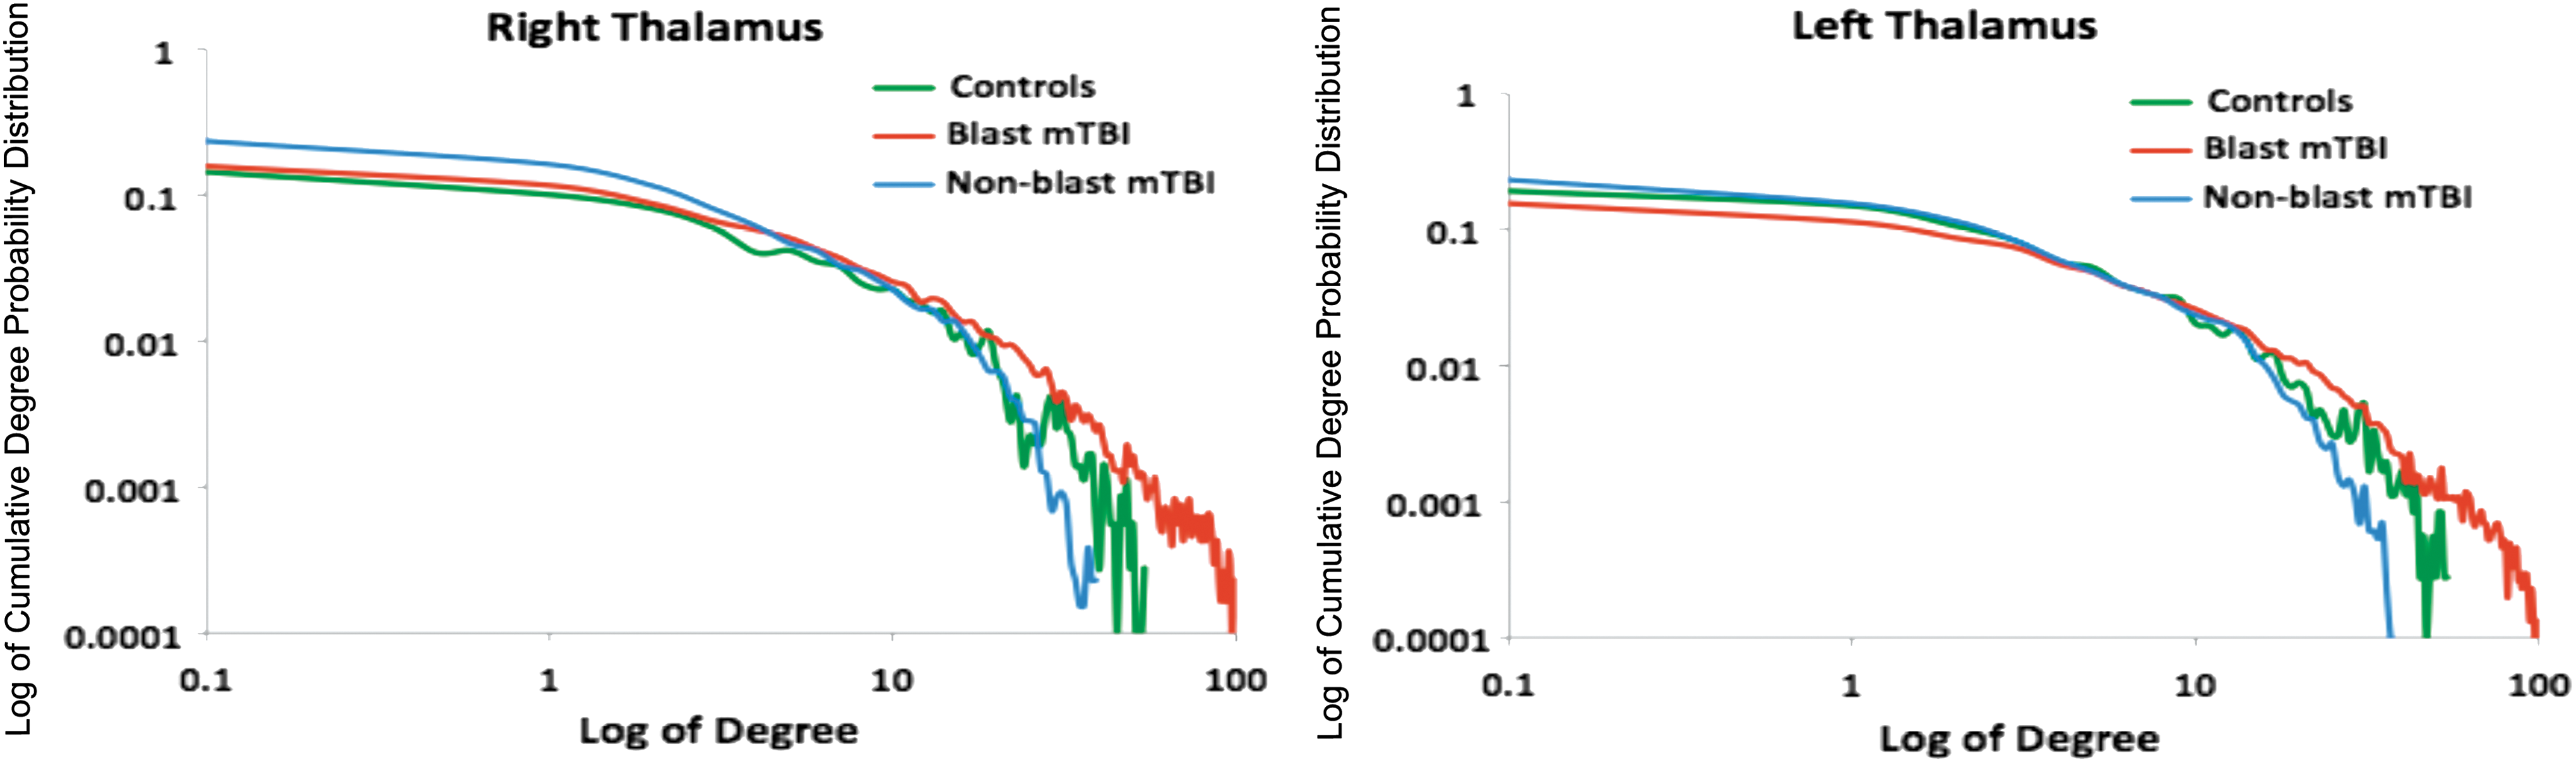
Degree distribution of the right thalamus and left thalamus. Color images available online at
Figure 3 presents an example of the thalamic networks for a single age (30 years) and gender (male)-matched control, blast mTBI and nonblast mTBI subject respectively. Each connectivity network is threshold at R 2 ≥0.90 with a corresponding p < 0.01. Each node in the figure is a voxel in the left and right thalamus, respectively. The blast subject had significantly more connectivity in the thalamic networks compared with the controls. Conversely, the nonblast subject has significantly fewer connected nodes in the thalamic networks.
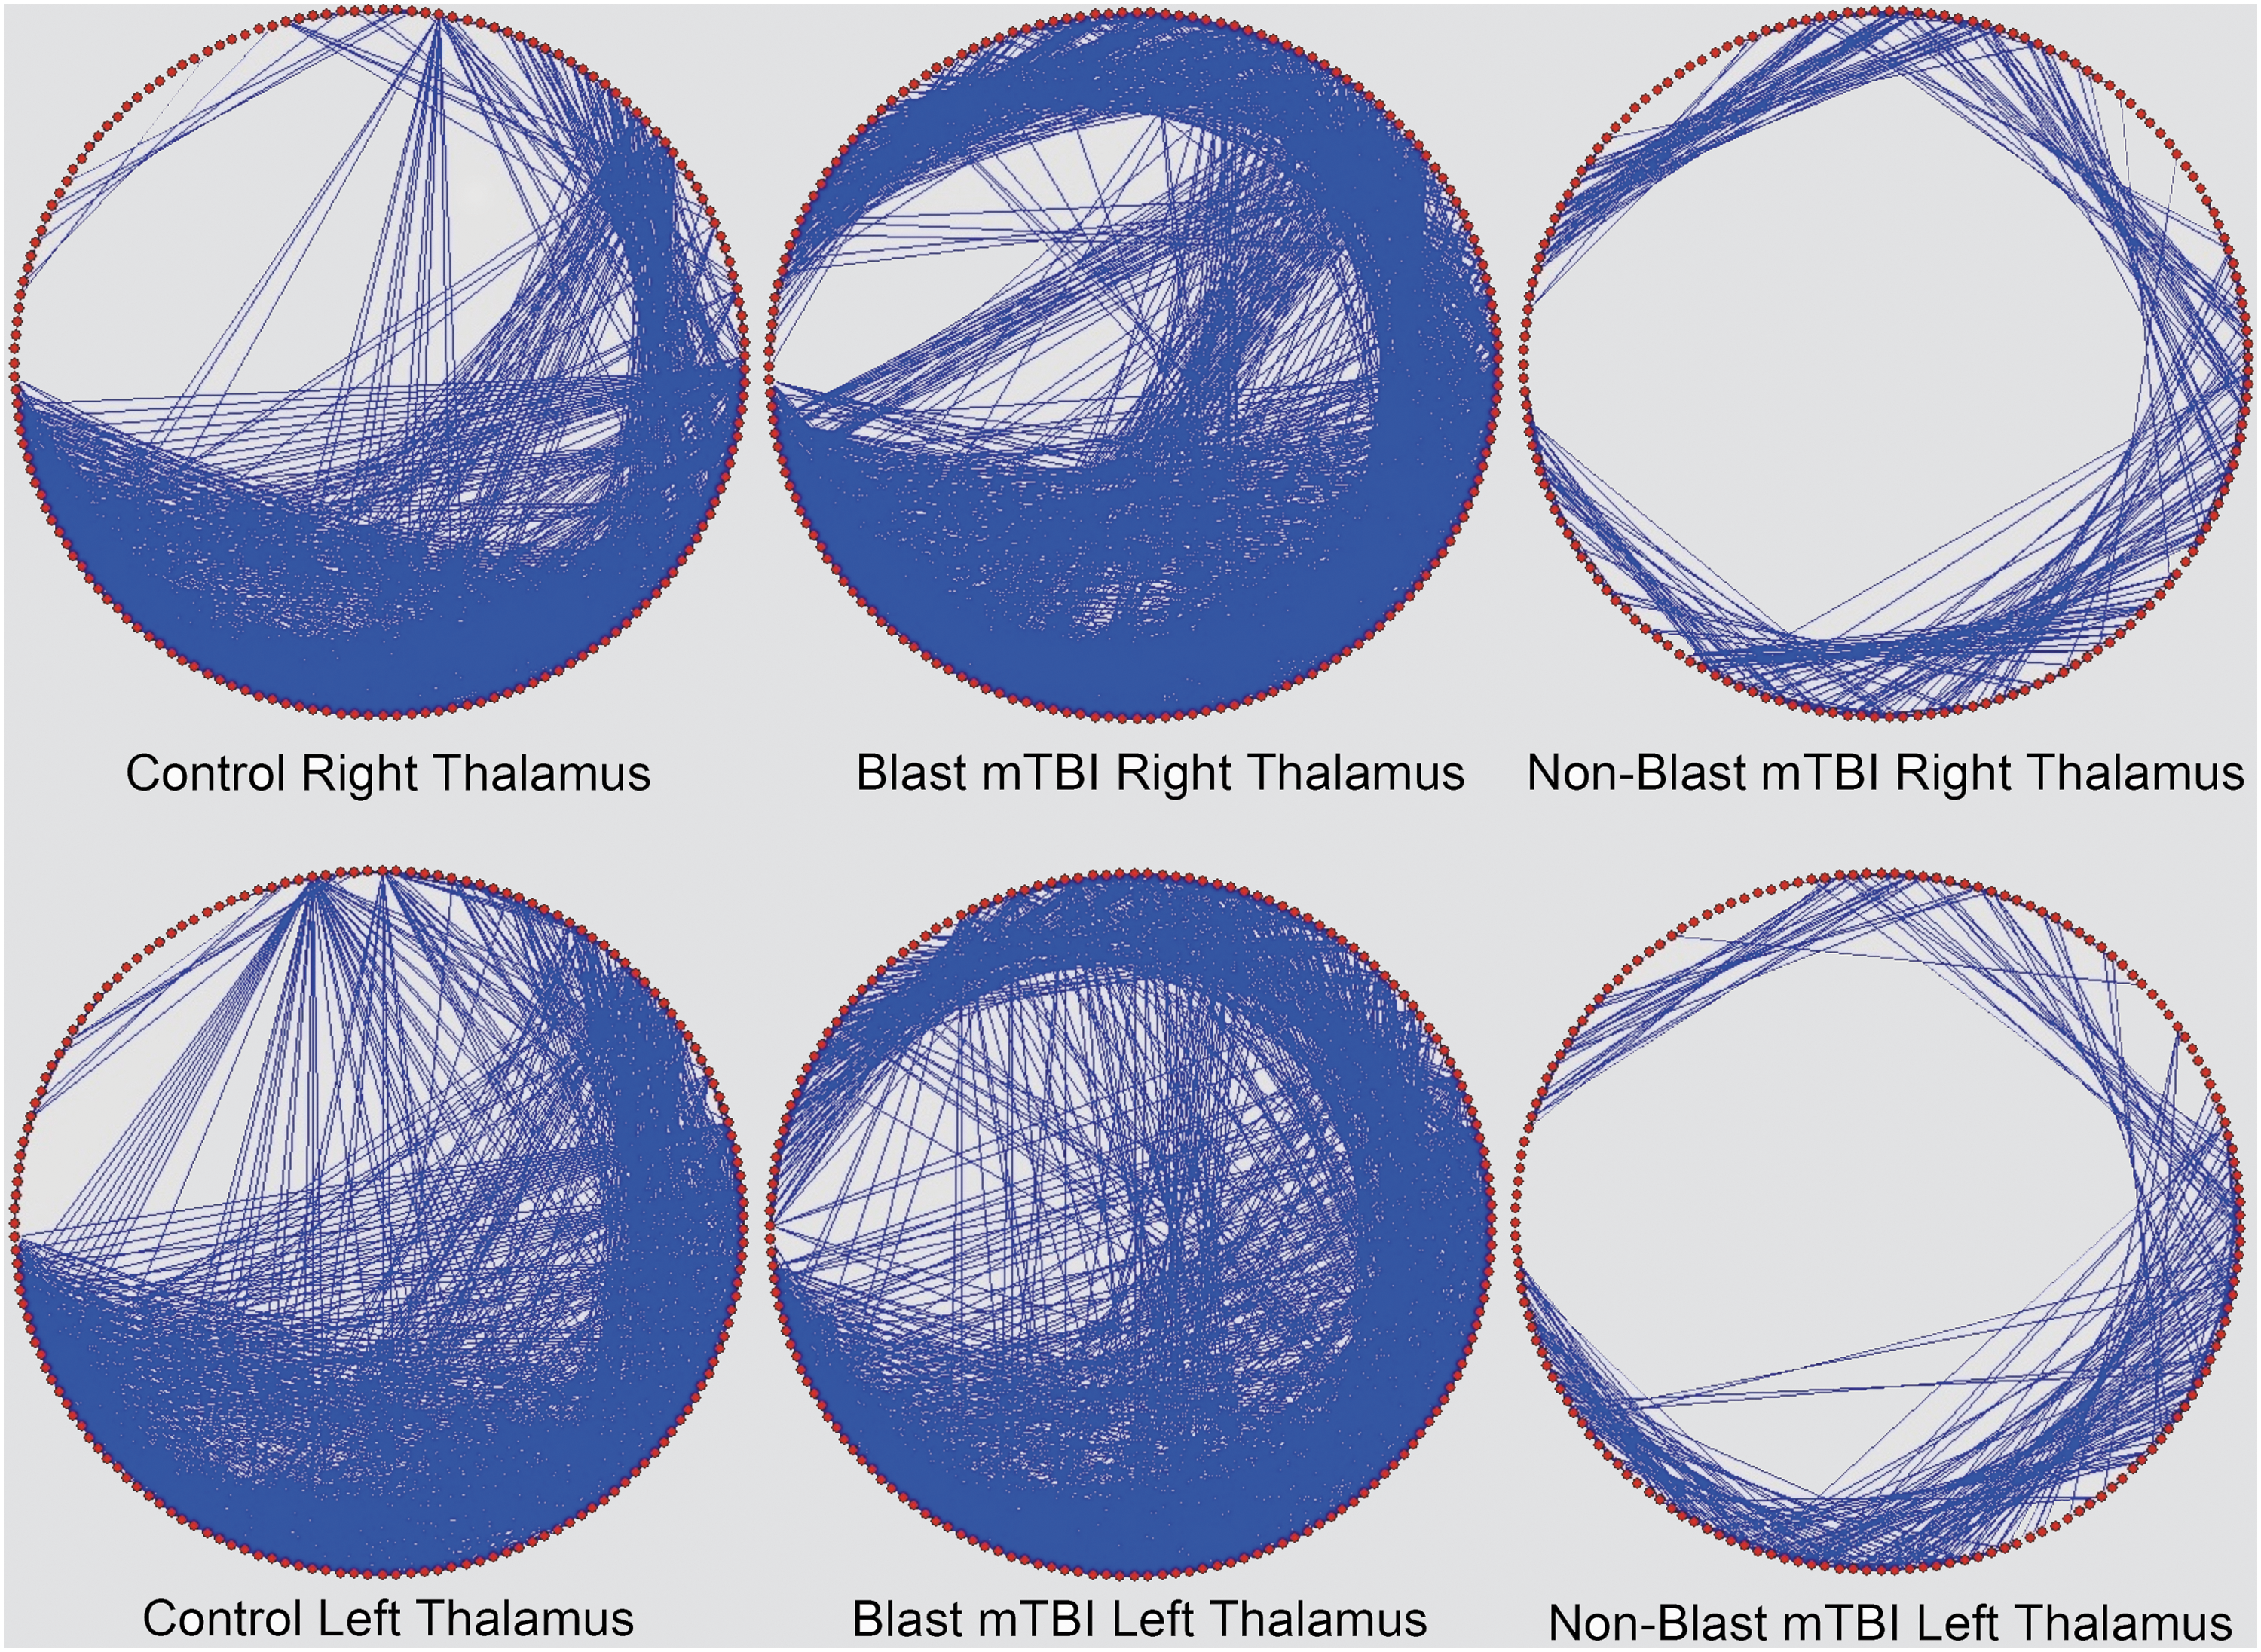
Example thalamic network maps for a single subject from the control, blast mTBI, and nonblast mTBI groups. mTBI, mild traumatic brain injury. Color images available online at
Self report data
Statistical analysis was performed to compare differences between groups for each of the self-reported measures and results summarized in Tables 6 and 7.
GH—denotes statistical significance from Games-Howell pairwise comparison; B—denotes statistical significance from Bonferroni pairwise comparison.
PTSD, post-traumatic stress disorder.
Subjects with invalid or incomplete self report data were excluded. The PCL-C scores indicate both mTBI groups had significantly greater post-traumatic stress symptoms than the control group, but the blast and nonblast mTBI groups were not significantly different from each other. The CES scores showed a significantly higher level of combat exposure in the blast mTBI group compared with the control and nonblast mTBI group. In addition, the nonblast mTBI group had significantly higher levels of combat exposure compared with the control group. The NSI scores suggest that both the blast and nonblast groups had significantly greater postconcussive symptoms compared with the controls. The NSI scores for the nonblast group were lower than those for the blast mTBI group; however, they were not significantly different from one another. The SF-36 scores indicate that controls were significantly different from both blast and nonblast mTBI subjects, and had overall lower symptoms, or were closer to the optimal reported scores for healthy functioning individuals. Blast and nonblast mTBI groups were not significantly different for any of the SF-36 clusters, but a trend was observed for the blast group indicating more symptoms that limit functioning compared to the nonblast group.
The thalamus is involved with mood and behavior regulation, and it is susceptible to cognitive and emotional stress (Bubser and Deutch, 1999). To assess potential post-traumatic stress effects on thalamic network topology, the sum of age and PCL-C scores were centered and subsequently regressed out from each of the graph theory measures for the left, right, and combined thalamic networks. The variance of the residuals for each of the graph theory measures were determined to be inhomogeneous using Levine's test, except for the measures of diameter, and characteristic path length in the right and left thalamic networks.
The one-way ANOVA analysis (Table 8) suggest that all of the graph theory measures describing the left, right, and combined left and right thalamic networks were significantly different except for the measure of characteristic path length and diameter in the left thalamus and combined thalamic network. Results from the post hoc multiple comparisons analysis (Table 9) showed significant differences between the control and nonblast mTBI group, and between blast and nonblast mTBI groups. However, no significant differences were observed between the control and blast mTBI groups after accounting for the PCL-C scores. The nonblast mTBI group had significantly lower network properties and a significantly higher characteristic path length in the right thalamus.
W—denotes significant difference from Welch ANOVA; R–denotes significant difference from one-way ANOVA.
PCL-C, Post-traumatic Stress Disorder Check List-Civilian Version.
GH—denotes significant difference at p < 0.05, Games-Howell post hoc test. B—denotes Bonferroni post hoc test at p < 0.05.
Results suggest correction for PCL-C scores, measures describing local structure and information traffic capacity in both the right and left thalamus, were trending higher for the blast mTBI group than the controls, but did share some overlap. Conversely, the measures for the blast group and control group were both higher than the nonblast mTBI group. Figure 4 shows each of the graph theory measures for the control, blast mTBI group, and nonblast mTBI group for the left, right, and combined thalamic networks.
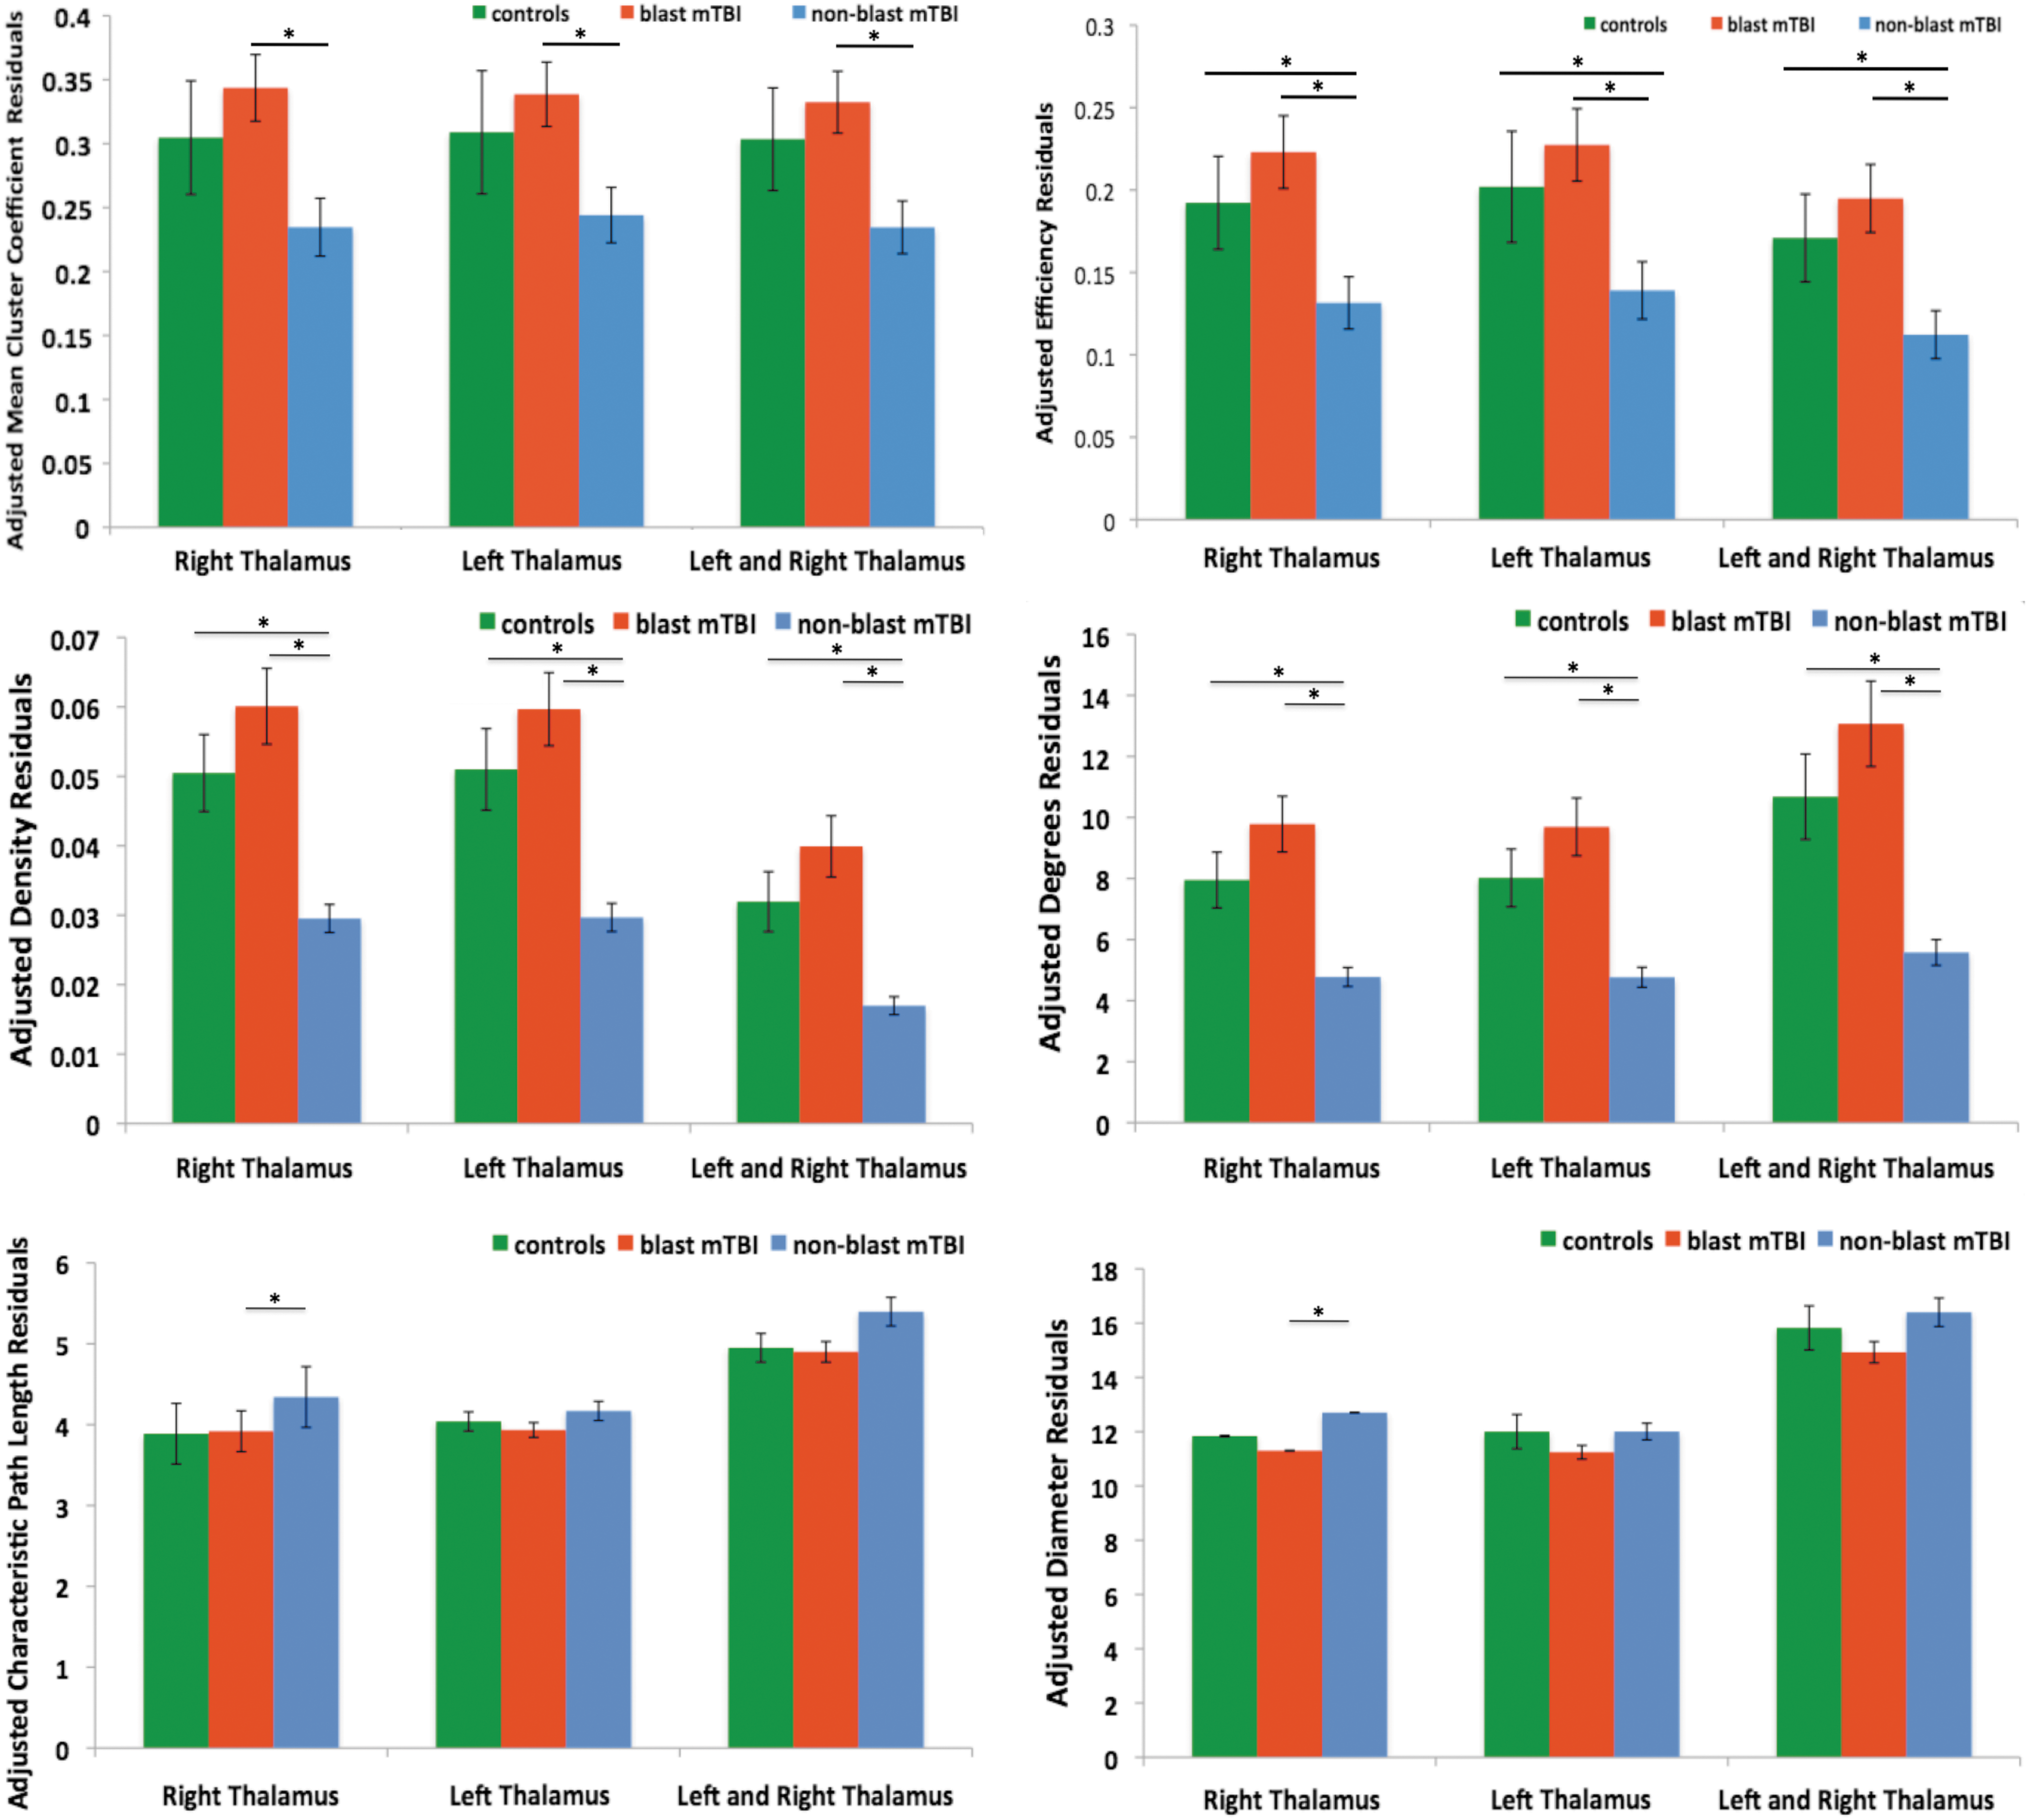
Graph theory measure of left and right intrinsic thalamic networks, corrected for age and PCL-C scores with ±1 SEM. PCL-C, Post-traumatic Stress Disorder Check List-Civilian Version. Color images available online at
Discussion
Overall results from the study suggest that thalamic network architecture, as characterized using graph theory measures from resting state fMRI, may distinguish mechanism of injury in mTBI. Specifically, the blast mTBI group had higher values for all of the graph theory measures except for the characteristic path length and diameter when compared to the controls and the nonblast mTBI group. Conversely, these two measures were higher in the nonblast group. For all other measures the nonblast group was lower than controls and blast mTBI group. The differences in connectivity measures describing the thalamic network architecture suggest that aberrant connectivity features are present within the individual and combined thalamic networks. In particular, the aberrant connectivity patterns observed are mostly hyper-connectivity in the blast mTBI group and hypo-connectivity in the nonblast mTBI group compared with controls.
Several mechanisms regulate thalamic activation, one of which is the thalamo-cortico-thalamic network that increases or suppresses thalamic activation (Jones, 2002). The presence of hyper-connectivity could be from mTBI induced local injury to the thalamic neurons or from alterations in the white matter bundles connecting other brain regions that then disrupt the thalamo-cortico-thalamic network. Injury to the thalamic neurons change the electro-responsiveness of the thalamo-cortical functional networks and creates a chronic state of abnormal excitation as observed in animals (Ding et al., 2011) and human subjects (Cho et al., 2013; Jones, 2002; Tang et al., 2011; Whitfield-Gabrieli et al., 2009; Yin et al., 2011). Lower measures of characteristic path length and diameter also suggest that injury may disrupt certain anatomical connections that are local to the thalamus or connected to it and are involved with information traffic capacity to and from the cortex. Studies using DTI, diffusion kurtosis imaging (DKI), and arterial spin labeling have reported changes induced by mTBI to the underlying tissue, structure, and perfusion of the thalamus (Grossman et al., 2012, 2013). Lower FA, mean kurtosis (MK), cerebral blood flow, and an increase in mean diffusivity (MD) were observed in the thalamus of mTBI subjects (Grossman et al., 2013). Similar findings were observed in these subjects during a follow-up (Grossman et al., 2012, 2013). Furthermore, mTBI subjects with cognitive impairment demonstrated significantly lower MK values, and FA values pertaining to the optic radiations compared with mTBI subjects without cognitive impairments and control subjects (Grossman et al., 2012, 2013). However, more research pertaining to DTI and DKI studies are needed with larger sample sizes to further ascertain how anatomical changes relate to functional changes in the thalamus and how these findings relate hyperactivity with behavior.
Alternatively, hyper-connectivity could be caused by compensatory mechanisms working to maintain sufficient functional connectivity, a feature that is critical for proper regulation of information traffic capacity to occur within the thalamus. Hyper-connectivity may maintain thalamic function and its role in the larger context of information integration and regulation in the brain. Increased effort is needed to achieve preinjury levels of regulating information capacity, and appropriate function. Many TBI patients do anecdotally describe the need for increased attention and effort required to execute tasks that were performed almost automatically in the background prior to the TBI. Neuroplasticity and healing-related changes in the brain can also cause compensatory mechanisms that affect network topology. These compensatory mechanisms have been reported in whole brain connectivity studies involving mTBI subjects who showed similar performance on cognitive tasks, but yet had increased connectivity within the task, and task-free default mode network (Sharp et al., 2011). Other studies using graph theoretic measures to quantify whole brain networks in a mixed group of TBI subjects reported higher strength, efficiency, and degree values that correlated with poor cognitive task performance (Caeyenberghs et al., 2012). Similar network topology was also observed in another group of severe TBI subjects in which whole brain network properties changed over time to approach similar patterns to that of the controls (Nakamura et al., 2009).
Network topology described by density, degrees, and efficiency were lower for the nonblast mTBI group compared with the controls and blast mTBI group. These lower values suggest sparse network connectivity within the nonblast mTBI group, and may imply hypo-connectivity that could reflect disruptions to specific local or broad functional networks that traverse through the thalamus (Nathan et al., 2012). The sparse network topology also suggests the presence of fewer local connections and indicates less robustness to failure. This notion is supported by the power law exponent of the degree distribution for the left and right thalamic networks lacking a scale-free property and also, although not significantly different, higher measures of characteristic path length and diameter for the nonblast mTBI subjects. Hypo-connectivity of the thalamic networks could reflect physical injury to the thalamic networks in which fewer nodes are active or a reduction in input signals to the thalamic network from cortical regions (Zhou et al., 2014). Conversely, the reduction in thalamic networks of nonblast mTBI subjects could be caused by reduced thalamic synchrony that could result in a lower number of nodes showing functional connectivity in the thalamus. Apart from physical injury induced by mTBI, mood alterations such as depression or anxiety have been reported to disrupt the limbic-thalamic network and cause a reduction in connectivity (Hahn et al., 2011).
In the absence of explicit stimuli, the brain maintains states in which several distinct resting networks are formed (Biswal et al., 2010). However, during active tasks or the exertion of conscientious effort these resting networks transition into more robust task active networks. Research into task-free resting state networks has revealed the presence of disrupted networks with the presence of pathology. One such feature of a disrupted network is the presence of hyper-connectivity or conversely, reduced connectivity that form disrupted task-free networks as observed in individuals who have anxiety disorders (Hahn et al., 2011), PTSD (Sripada et al., 2012), schizophrenia (Whitfield-Gabrieli), depression (Sheline, Price, Yan, Mintun, 2010), Alzheimer's disease (Sanz-Arigita et al., 2010), and even TBI (Caeyenberghs et al., 2012; Cho et al., 2013; Grossman et al., 2012, 2013; Nakamura et al., 2009; Nathan, et al., 2012; Yin et al., 2011). It is believed that aberrant connectivity indicates an inability of the brain to switch between being actively engaged with a task to a task-free state that lacks explicit stimuli (Gentili, 2009; Gentili et al., 2009; Sheline et al., 2010; Sripada et al., 2012; Whitfield-Gabriel et al., 2009). In other words, pathology hinders the ability to relax, instead causing rumination in a state of hypervigilance (Gentili et al., 2009). Alternatively, a compensatory mechanism to regulate mood and maintain a certain state of consciousness could be present. Increased connectivity may reflect increased effort and, conversely, lack of connectivity could represent gaps with appropriate management of information traffic capacity which in turn could affect proper information flow. However, the nature of hyper-and hypo-connectivity in the context of functional networks pertaining to aberrant metacognition and emotional dysregulation are not clearly established and warrant more research.
When controlling for effects of stress, the architecture of the thalamic networks indicate that the blast mTBI group was not statistically different from the controls. In addition, most of the increased connectivity originally observed in the blast mTBI group was reduced to almost similar or overlapping levels with the controls. The nonblast mTBI group also experienced a reduction in some of the graph theory measures, namely those describing network architecture (i.e., degrees, mean cluster coefficient, density, and efficiency), which were significantly different from the controls. This finding suggests two important points. First, injury to local regions of the thalamus, or to distant regions of the brain that are connected via white matter bundles, may cause a disruption in the brain and this can be observed via changes to the architecture of the intrinsic networks of the thalamus. The reduced connectivity is suggestive of either less activation or perhaps less synchrony in information flow (fewer nodes are active) and that reorganization occurred within the local intrinsic networks of the thalamus (Nathan et al., 2012). The second important point to consider is that changes to the intrinsic networks of the thalamus indicate an effect of stress as determined by the PCL-C scores. Specifically, information from our data suggests that stress symptoms increase the connectivity of the thalamic networks, and this could perhaps represent a coping mechanism or conversely this could be indicative of hyperarousal or -vigilance. The thalamus plays a role in mood and behavior regulation and mTBI is capable of disrupting this process (Tang, 2011). However, separating mTBI from post-traumatic stress or depression is difficult and controversial. These changes within the intrinsic networks of the thalamus may be an appropriate first step toward developing sensitive and objective tools to detect, diagnose, and ultimately treat mTBI and to distinguish associated symptoms such as post-traumatic stress or depression.
Although blast mTBI group had higher PCL-C scores compared to controls and the nonblast mTBI group, the blast mTBI group was not significantly different from the nonblast mTBI group. However, the blast group was significantly different from the nonblast and control groups with higher levels of combat exposure. Not surprisingly, these findings indicate that increased exposure to combat-related events increases stress, and increased combat exposure is likely to increase the probability of encountering one or more TBI events; hence, the high comorbidity for TBI and post-traumatic stress. This comorbidity heightens the importance of functional brain imaging as an objective measure that can begin to distinguish between these two diagnoses. Specifically, functional brain imaging could offer more sensitive information pertaining to changes in brain networks that could provide insight into the extent of injury, subsequent recovery, and long-term outcomes for individuals who suffer from mTBI.
There are several limitations in this study. First, it is difficult to control for medications and ongoing treatment that each subject is receiving. Both of these factors have confounding effects on brain networks and the BOLD response. More research is needed to fully ascertain the effects that both medication and treatment have on functional network of the brain. Second, quantifiable information relating to the distance and intensity of blast exposure is not available. This is important and could be used to better determine injury to the brain from blast and its corresponding sequelae. Third, reports of LOC and post-traumatic amnesia along with data from self-reported questionnaires are subjective and susceptible to reporting bias. Finally, structured clinical assessment of PTSD for these participants is not available.
Nonetheless, our results indicate that there is a difference between network topology of the thalamus in mTBI subjects and furthermore, mechanism of injury has an influence on these thalamic networks that can be measured. Further research using multimodal imaging data (fMRI, DTI, susceptibility weighted imaging, anatomical MRIs, and EEG) together with neuropsychological clinical assessments may help to provide further details on neural correlates of mTBI.
Conclusion
To date, the majority of task-free functional connectivity analyses have been focused on inter-region connectivity. Such analyses provide information with regard to large-scale networks and how information flow and topology are disrupted. This insight is beneficial for severe and moderate TBI subjects where clear locations of injury are present. However, such large-scale analyses may not be sensitive to detect subtle local regional changes that are present in mTBI. Therefore, analysis of intrinsic functional networks within a specific brain region is unique compared to common inter-region analysis. Understanding local network organization and the effects of mTBI on network architecture is a potential biomarker for individual subject assessment. Graph theory is a model-free analysis method that has very minimal a priori assumptions and provides a relatively unbiased approach of assessing functional connectivity. Such a feature is of particular benefit in assessing mTBI due to the variations of injury location and intensity across individuals. The differences in network architecture suggest the presence of potential hyperactive connections within the intrinsic networks of the thalamus for the blast mTBI group compared with the controls and hypo-connectivity in the nonblast group compared with the controls.
Footnotes
Acknowledgments
The views expressed in this article are those of the authors and do not reflect the policy of the United States Department of Defense, Department of the Army, Navy or Air Force, or United States Government. The authors are very grateful to Dr. Cara Olsen, PhD, research professor and biostatistics consultant at the Uniformed Services University of the Health Sciences, Ms. Victoria Eskay, BA, Dr. Julie Liss, PhD, Dr. Cyrus E. Eierud, PhD, Dr. Jonathan Wolf, MD, Mr. David Joy BS, Dr. Joseph Hennessey, PhD, Dr. Ping Hong Yeh, PhD, CDR John Hughes, MD, Mr. John Morissette, Mrs. Jamie Harper, MPH, Ms. Rachel Wolfowitz, BS, Mr. Alex Kubli, BS, Mr. Justin Senserney, MS, and Dr. John Graner, PhD, the participants and their families, and the clinicians and staff at the National Intrepid Center of Excellence, Walter Reed National Military Medical Center. This research was supported by the Congressional Directed Medical Research Program Research Grant G.R., CDMRP Award Number: DMRP130132, Gerard Riedy, MD, PhD—principal investigator.
Author Disclosure Statement
No competing financial interests exist.