
Abstract
Resting-state functional magnetic resonance imaging has been increasingly used for examining connectivity across brain regions. The spatial scale by which hemodynamic imaging can resolve functional connections at rest remains unknown. To examine this issue, deoxyhemoglobin-weighted intrinsic optical imaging data were acquired from the visual cortex of lightly anesthetized ferrets. The neural activity of orientation domains, which span a distance of 0.7–0.8 mm, has been shown to be correlated during evoked activity and at rest. We performed separate analyses to assess the degree to which the spatial and temporal characteristics of spontaneous hemodynamic signals depend on the known functional organization of orientation columns. As a control, artificial orientation column maps were generated. Spatially, resting hemodynamic patterns showed a higher spatial resemblance to iso-orientation maps than artificially generated maps. Temporally, a correlation analysis was used to establish whether iso-orientation domains are more correlated than orthogonal orientation domains. After accounting for a significant decrease in correlation as a function of distance, a small but significant temporal correlation between iso-orientation domains was found, which decreased with increasing difference in orientation preference. This dependence was abolished when using artificially synthetized orientation maps. Finally, the temporal correlation coefficient as a function of orientation difference at rest showed a correspondence with that calculated during visual stimulation suggesting that the strength of resting connectivity is related to the strength of the visual stimulation response. Our results suggest that temporal coherence of hemodynamic signals measured by optical imaging of intrinsic signals exists at a submillimeter columnar scale in resting state.
Introduction
S
Similar findings have also been reported in smaller spatial scales. High resolution fMRI (200 μm/pixel) was used to identify known interareal connections in the somatosensory cortex, revealing patterns of connectivity present upon forepaw stimulation (Hyde and Li, 2014). Similarly, resting-state high-resolution fMRI in the primary somatosensory cortex of anesthetized squirrel monkeys revealed that functionally related regions are correlated on a millimeter scale and that these patterns of connectivity reflect the local anatomical connections (Wang et al., 2013). Wang et al. suggested that connectivity patterns at a global scale are a manifestation of interactions between local microcircuits that are defined by such neuronal connections. Other studies have examined the correspondence between local neuronal activity and the fMRI signal at rest (Murayama et al., 2010; Shmuel and Leopold, 2008), raising the following question: If coupling of neuronal activity and hemodynamics exists at the level of neuronal populations, how small a scale can hemodynamic imaging resolve functional connections at rest?
This question can be examined by determining whether hemodynamic connectivity patterns exist within known functional networks at a submillimeter scale. The orientation column architecture in the visual cortex is an ideal candidate for this purpose. Its properties have been extensively studied and characterized under visual stimulation and at rest (Blasdel and Salama, 1986; Bonhoeffer and Grinvald, 1991; Frostig et al., 1990; Grinvald et al., 1986, 1994; Kenet et al., 2003; Sharon et al., 2007; Ts'o et al., 1990; Tsodyks et al., 1999). Spacing between iso-orientation columns in primary visual cortex ranges between 1.4 and 1.8 mm in humans (Yacoub et al., 2008), 1.0–1.4 mm in cats (Rao et al., 1997), and 0.7–0.8 mm in ferrets (Chapman et al., 1996; Rao et al., 1997). Correlated neuronal activity in iso-orientation columns is present with evoked stimulation and also at rest, as demonstrated by single-unit recordings (Tsodyks et al., 1999) and voltage-sensitive dye imaging (Kenet et al., 2003). We consider the possibility that resting-state hemodynamic imaging is capable of resolving these established patterns of functional connectivity. Optical imaging of intrinsic signals (OISs) and fMRI have been used to map orientation columns under visual stimulation (Duong et al., 2001; Fukuda et al., 2006; Kim and Fukuda, 2008; Kim et al., 2000; Moon et al., 2007; Yacoub et al., 2008; Zhao et al., 2005).
In this study, we used OIS with similar sensitivity to BOLD fMRI to image the ferret visual cortex, since its resolution is very well suited (10 μm per pixel) to capture hemodynamic changes within and between orientation domains. We experimented with OIS at two different wavelengths of light, 620 and 700 nm, both of which have different levels of sensitivity to deoxyhemoglobin. We also tested for correspondence in our findings between evoked and resting data to determine if the degree of connectivity observed by evoked stimulation is related to that observed at rest.
Materials and Methods
Animal preparation
Four female ferrets (7–24 weeks old) were obtained from Marshall Farms and used to investigate the spatial character of low-frequency hemodynamic fluctuations in primary visual cortex. All experimental procedures were approved by the Institutional Animal Care and Use Committee at the University of Pittsburgh. Each ferret was initially treated with atropine sulfate and quickly anesthetized with ketamine (30 mg/kg) for intubation. Once the animal was intubated, it was ventilated by a pressure-driven ventilator (TOPO; Kent Scientific) using 30% oxygen-enriched air gas and transitioned to isoflurane anesthesia (2%) for surgery. A femoral artery and vein were catheterized to monitor arterial blood pressure and for the infusion of maintenance solutions and drugs, respectively. The animal was paralyzed throughout the experiment by continuous infusion of pancuronium bromide (0.2 mg/kg/h) in a 5% dextrose ringer's solution to avoid unwanted eye movements. The ferret's pupils were dilated by applying atropine (1%) eye drops, and silicon oil was applied every 30 min to keep the eyes moist. Body temperature was maintained at 38°C using a thermal probe and heating pad controlled by a DC feedback unit (40-90-8C; FHC, Inc.). The ferret was then placed in a stereotaxic apparatus (Narishige). The skin and muscle over the left hemisphere were retracted and a 5 mm craniotomy was performed over areas 17 and 18, which encompass the primary visual cortex (V1 and V2). The imaging window was stabilized by filling the exposed craniotomy with 2% agarose and then fastening a small glass window with dental acrylic. A custom head post was cemented to the skull anterior to the craniotomy to securely hold the animal's head. The ferret's head was then rotated, so that the surface of the visual cortex was parallel to the fixed imaging plane. The stereotaxic frame was then removed and the animal was placed under the optical imaging system and in front of the visual stimulation computer monitor. The isoflurane level was then decreased to 0.5% to establish a light anesthetic plane for experimental recording. Rectal temperature, heart rate, end-tidal CO2, mean arterial blood pressure, and blood gases were monitored and maintained within normal physiological levels during the experiments. At the end of the experiment, the ferrets were euthanized by administering 0.5 mL of potassium chloride solution (mg/kg, IV) under 4% isoflurane.
Data acquisition
OIS was performed using a custom-built imaging system (Fig. 1A). Oblique light guides connected to a halogen light source (Thermo-Oriel) were used for illumination. Images covering an area of 6 × 4 mm were recorded using a macroscope (MVX10; Olympus, Inc.) and an analog CCD camera (Sony XT-75). An analog-to-digital frame-grabbing board (Matrox, Inc.) was used to digitize 640 × 480 pixel images at a rate of 30 Hz over the same field-of-view with pixel resolution of about 10 μm. To record images sensitive to changes in deoxyhemoglobin (analogous to BOLD fMRI), a barrier filter (620 ± 7 nm) was placed at the light source (Horecker, 1943). Images were also recorded at a longer wavelength (700 ± 15 nm) to increase the sensitivity of the images to scatter and decrease signal from large blood vessels (Frostig et al., 1990; Malonek and Grinvald, 1996; Mc Loughlin and Blasdel, 1998).

Imaging setup and modes of recording.
Each experimental run consisted of 10-min OIS acquisitions in one of two conditions, evoked state and resting state (Fig. 1B). Evoked state OIS (es-OIS) data were obtained while visual stimulation was presented to the animal, while resting-state OIS (rs-OIS) data were obtained without an external visual stimulus (e.g., black monitor). A 10-min black screen period was used during the transition from evoked to resting experiments to minimize residual hemodynamic activity. The visual stimulus was isoluminant so no light artifacts would be introduced into the camera images. A summary of the data acquired from each ferret is shown in Table 1.
Each experiment consisted of continuous optical imaging of intrinsic signal acquisition for 10 min at both 620 and 700 nm.
Excluded ferret.
Visual stimulation
Visual responses were evoked by the presentation of continuously rotating full-field, 100% contrast, square-wave gratings (Kalatsky and Stryker, 2003) using a 24-inch LCD computer monitor controlled by a computer with VSG software (Cambridge Research Systems). The spatial frequency of the gratings was 0.1 cycles/deg and they drifted at a velocity of 2 cycles/sec. Stimulation was synchronized with the optical imaging acquisition system. The visual stimulus completed a full rotation (360 deg) in 60 sec and each visual stimulation run lasted 10 min for a total of 10 rotations per stimulation run.
Data analysis
The following preprocessing strategy was performed on the data from all experimental runs using custom routines implemented in MATLAB (MathWorks, Inc.). Each image was binned spatially by a factor of 4 in both dimensions for a final pixel resolution of 40 μm. The temporal resolution was also reduced to 2 Hz by averaging consecutive 15 image blocks to improve signal-to-noise ratio (SNR) and reduce computational time. A 2D rigid body motion correction algorithm was then used to register the images from each experimental run to the first recorded image. Performing this step before spatial and temporal binning did not alter the results obtained, but required significantly more computational time. A band-pass Fermi filter with passband between 0.03 and 0.2 Hz and transition bandwidth for each cutoff frequency of 0.005 and 0.05 Hz, respectively, was then applied to eliminate baseline drifts and high frequency noise. A mask was created to ensure that image locations within the brain and devoid of surface vasculature were analyzed further. Hence, a brain region of interest (ROI) was selected for each animal to exclude the skull bone, and surface vessels were excluded by applying an intensity threshold to the average image of each experimental run.
OIS data from each experimental run were inspected for artifacts by subtracting the mean image from each experimental run and observing the resulting movie. Data from one ferret consistently showed widespread oscillations in intensity at a frequency of 0.08 Hz under both evoked and resting conditions. These changes were large in magnitude and widespread, typical of vasomotion (Mayhew et al., 1996). Data from this ferret were thus excluded from analysis. Hence, 18 experiments from three animals were further analyzed (10 evoked and 8 resting for Ferrets 1, 2, and 3; Table 1) for each imaging wavelength (36 datasets in total).
Generation of orientation preference maps
Maps of orientation preference for each ferret were generated by Fourier analysis of the evoked-state OIS data (Kalatsky and Stryker, 2003). The rotating visual stimulus evoked a hemodynamic response with a prominent spectral component at the frequency of rotation and its harmonics (Kalatsky and Stryker, 2003). Since each orientation stimulus is presented twice in a rotation of the grating pattern, the frequency at which the orientation columns are activated is twice the frequency of rotation (two cycles per minute or 0.0333 Hz). Thus, the image of the Fourier component at this frequency was used as the functional map. The phase portion of this complex image corresponds to the orientation preference of each brain location. The ratio of the magnitude of this image relative to the mean image intensity (over time) corresponds to the contribution of the evoked hemodynamic response to the total signal. The mean value of this ratio over the different locations in the visual cortex was used as the evoked response amplitude. For each ferret, individual orientation preference maps were generated from data acquired at 620 and 700 nm (Supplementary Fig. S1; Supplementary Data are available online at
To test for dependencies on the actual organization of orientation columns, pseudorandom orientation preference maps were generated (e.g., Supplementary Fig. S2). These control orientation preference maps were generated from the actual functional maps of each ferret; however, two additional steps were performed. First, the functional map was spatially band-pass filtered to restrict the “patchy” appearance over the range of the actual orientation preference map. Second, the phase portion of the functional map was shuffled to randomize the orientation preference of the patches.
Examination of connectivity patterns
Two types of analysis were performed to assess the degree to which resting-state hemodynamic patterns resemble the functional organization of orientation domains. For both types of analysis, a mask was applied to exclude the skull, blood vessels, and other nonbrain regions.
Spatial correlation analysis
Although single-condition (orientation) experiments were not conducted, analogous iso-orientation maps (IOMs) representing single-orientation activation patterns at 0°, 45°, 90°, and 135° orientations were estimated for each animal (e.g., Supplementary Fig. S2C) by multiplying the magnitude of the evoked stimulus response at each location by the cosine of the orientation preference with an appropriate phase shift corresponding to the orientation angle of interest. For each rs-OIS dataset, the images were converted to percent change using the average image over time for normalization. The pixel intensities of each IOM were then correlated with their respective normalized OIS image intensities for each instance of time, and a time series of correlation coefficients was obtained for each IOM. Instances of hemodynamic difference images that have a spatial pattern that resemble the orientation response will yield higher spatial correlation coefficients. Thus, when plotting the distribution of all spatial correlation coefficients over time, greater similarity to the IOMs is represented by a wider distribution in correlation coefficients. The standard deviation of the distribution of spatial correlation coefficients was computed and used as a similarity metric for each recording. This approach was used to determine whether spontaneously arising changes in resting state images within known orientation column domains look similar to patterns that reflect the observed organization of orientation columns (Kenet et al., 2003). The analysis was repeated with es-OIS data to verify that the expected pattern is indeed present. In addition, as a negative control, this analysis was repeated using the IOMs generated from pseudorandom orientation maps (e.g., Supplementary Fig. S2D).
Temporal correlation analysis
A temporal correlation analysis was performed using the time series of each pixel in the image. This yielded a square correlation matrix with more than 8 million elements where entry (i, j) is the correlation between the time series of locations i and j. This metric was complemented by the orientation preference difference (OPD), which was calculated as the difference in angular orientation preference between locations i and j, as well as with interpixel distance (IPD), calculated as the Euclidean distance between locations i and j in millimeters. Low-frequency hemodynamic fluctuations are known to have a relatively large spatial extent (Grinvald et al., 1994; Stettler et al., 2002). Therefore, pixels that are close to each other are likely to be correlated and might make it difficult to establish an association in orientation preference. A simple linear model was used to account for contributions of IPD on hemodynamic correlation [Eq. (1)]. The correlation matrix was vectorized and binned by the difference in the orientation preference (8 bins, 11.25 degrees per bin) and IPD (10 bins, 0.2 mm per bin, roughly half the width of a single iso-orientation domain) and averaged. This step reduced the computational burden of evaluating the model.
The binned correlation data were plotted against OPD and IPD to check for linearity and appropriateness of the aforementioned linear model. Although correlation data are typically distributed in a sigmoidal manner, the differences in correlation were not large (<10%) and the linear model was able to describe the trends in the data. We then tested for significant relationships between correlation and difference in orientation preference (slope A) and between correlation and IPD (slope B) using a one-sided t-test (p < 0.05). We hypothesized that correlation would decrease with increasing difference in orientation preference (A < 0) and that correlation would decrease with increasing distance (B < 0). The same analysis was also performed for es-OIS data for comparison. As a control, rs-OIS was also analyzed using the pseudorandom orientation preference map to generate a false OPD vector.
Comparison between spatial correlation and temporal correlation analyses
From the spatial correlation and temporal correlation analyses, two separate metrics were computed to determine the degree to which hemodynamic changes reflect the functional architecture of the orientation columns: (1) the standard deviation of spatial correlation coefficient and (2) the OPD coefficient (A) obtained from temporal correlation analysis. Agreement between these metrics would be indicated by a relatively high standard deviation along with a corresponding relatively high A (negative slope). These two metrics were compared using a linear model and the slope parameter was tested for significance (one-sided t-test with p < 0.05). Since these data are inherently correlated, the degrees of freedom were adjusted assuming 50% dependence (Sen and Srivastava, 1997).
Relationship between orientation-related changes under evoked and resting conditions
To determine if the degree of connectivity at rest is related to the magnitude of the evoked response, we compared orientation preference coefficients calculated from evoked data and those calculated from resting data. In addition, we also compared the mean amplitude of the es-OIS response to visual stimulation to the orientation preference coefficients calculated from the es-OIS data, as well as those from the rs-OIS. This was done to check for the presence of an association or tendency between the magnitude of the detected evoked hemodynamic change and the degree of connectivity observed under evoked and resting conditions.
Results
Stimulation of the ferret visual cortex recorded by OIS at wavelengths of 620 and 700 nm elicited detectable responses. Maps of orientation domains were obtained from all ferrets exhibiting typical columnar organization where all orientations are clustered around a pinwheel location (a central pivot for each column; Fig. 1B). The average separation between iso-orientation domains was calculated to be 739 μm for the three ferrets, in line with previous reports. The average change in signal evoked by visual stimulation was consistently larger at 620 nm compared to 700 nm, on average by 85.3% (Fig. 2). The signal from blood vessels was also relatively larger at 620 nm than at 700 nm, on average larger by 122% (Supplementary Fig. S3). To reduce the large vessel contributions, we excluded pixels that were identified as lying within blood vessels (based on an intensity threshold) for all of our analyses. The average signal increase evoked by visual stimulation between wavelengths was maintained across ferrets, with higher responding ferrets doing so for both wavelengths. Orientation maps obtained using 620 and 700 nm were consistent for each animal (Supplementary Fig. S1). Due to the greater sensitivity to hemodynamic signals at 620 nm, we focused on the results at this wavelength.
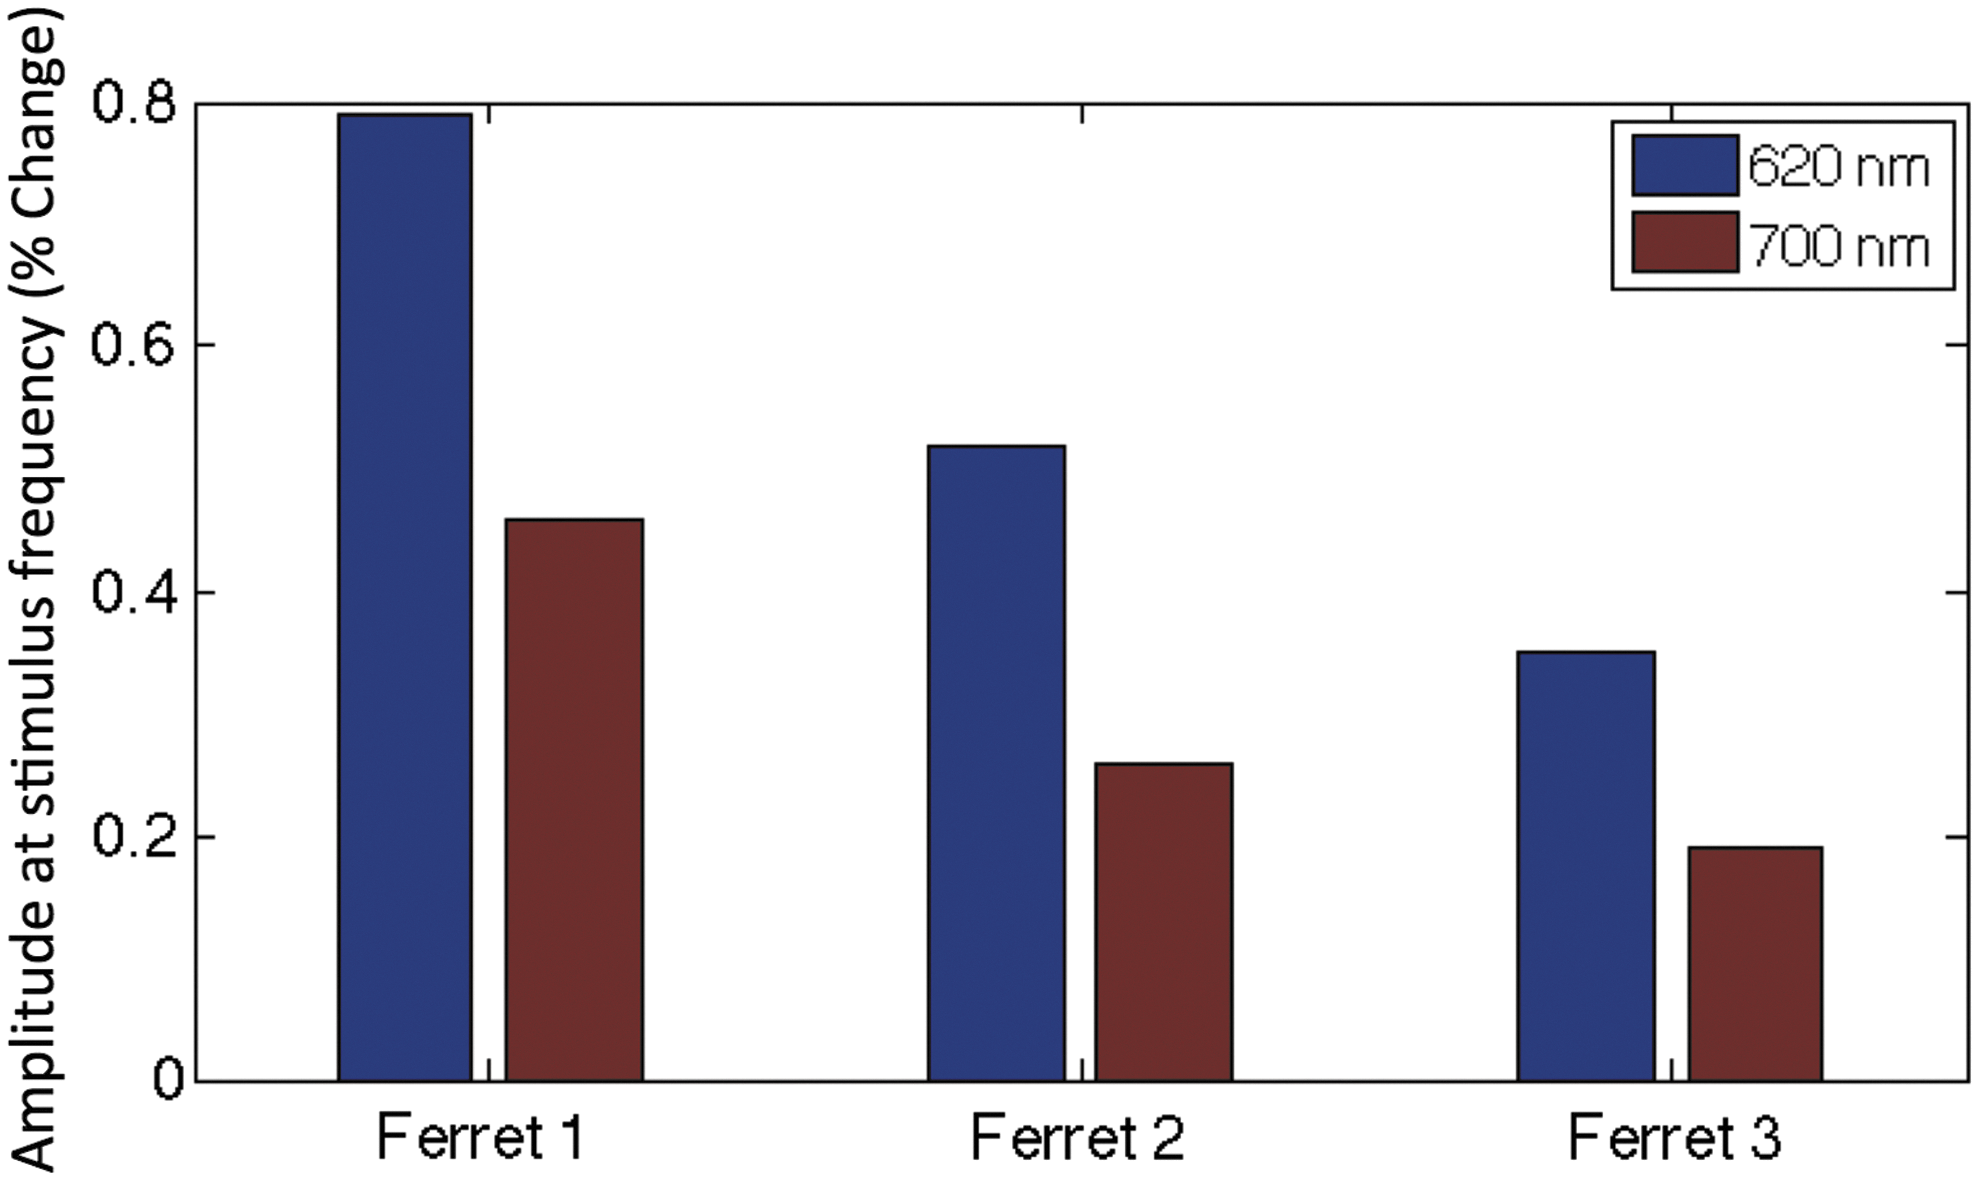
Comparison of hemodynamic response to visual stimulation recorded by OIS at 620 nm (blue bar) and 700 nm (red bar). The magnitude of the OIS signal at twice the frequency of stimulus rotation (0.0333 Hz) was isolated and used to compare the sensitivity to the hemodynamic response for these two wavelengths. We consistently observed a larger response in brain tissue areas at 620 nm compared to 700 nm.
Spatial correlation analysis
To qualitatively illustrate the spatial correlation results, the OIS image from the instance of time showing the maximal correlation to one of the IOMs from one subject is shown in Figure 3B and C for the es- and rs-OIS data, respectively, recorded using 620 nm light. Corresponding images for all three ferrets are provided in Supplementary Figure S4. These are images of percent change in the OIS signal at the point of maximal spatial correlation compared to the mean OIS signal over time at each respective pixel, thus serving as a map of hemodynamic activation for a given orientation. Dark patches that reflect the underlying organization of orientation domains (marked by red arrows in Fig. 3A) were visible not only in the evoked case but also in resting state, although not as clearly. This effect is captured in the histograms of the distribution of the spatial correlation coefficients for each image (Fig. 3D), where the spread of the correlation coefficients is higher for the es-OIS data compared to the rs-OIS data. As expected, the spread is narrowest for the IOM generated using a random orientation preference map indicating very little correlation (Fig. 3D bottom panel).
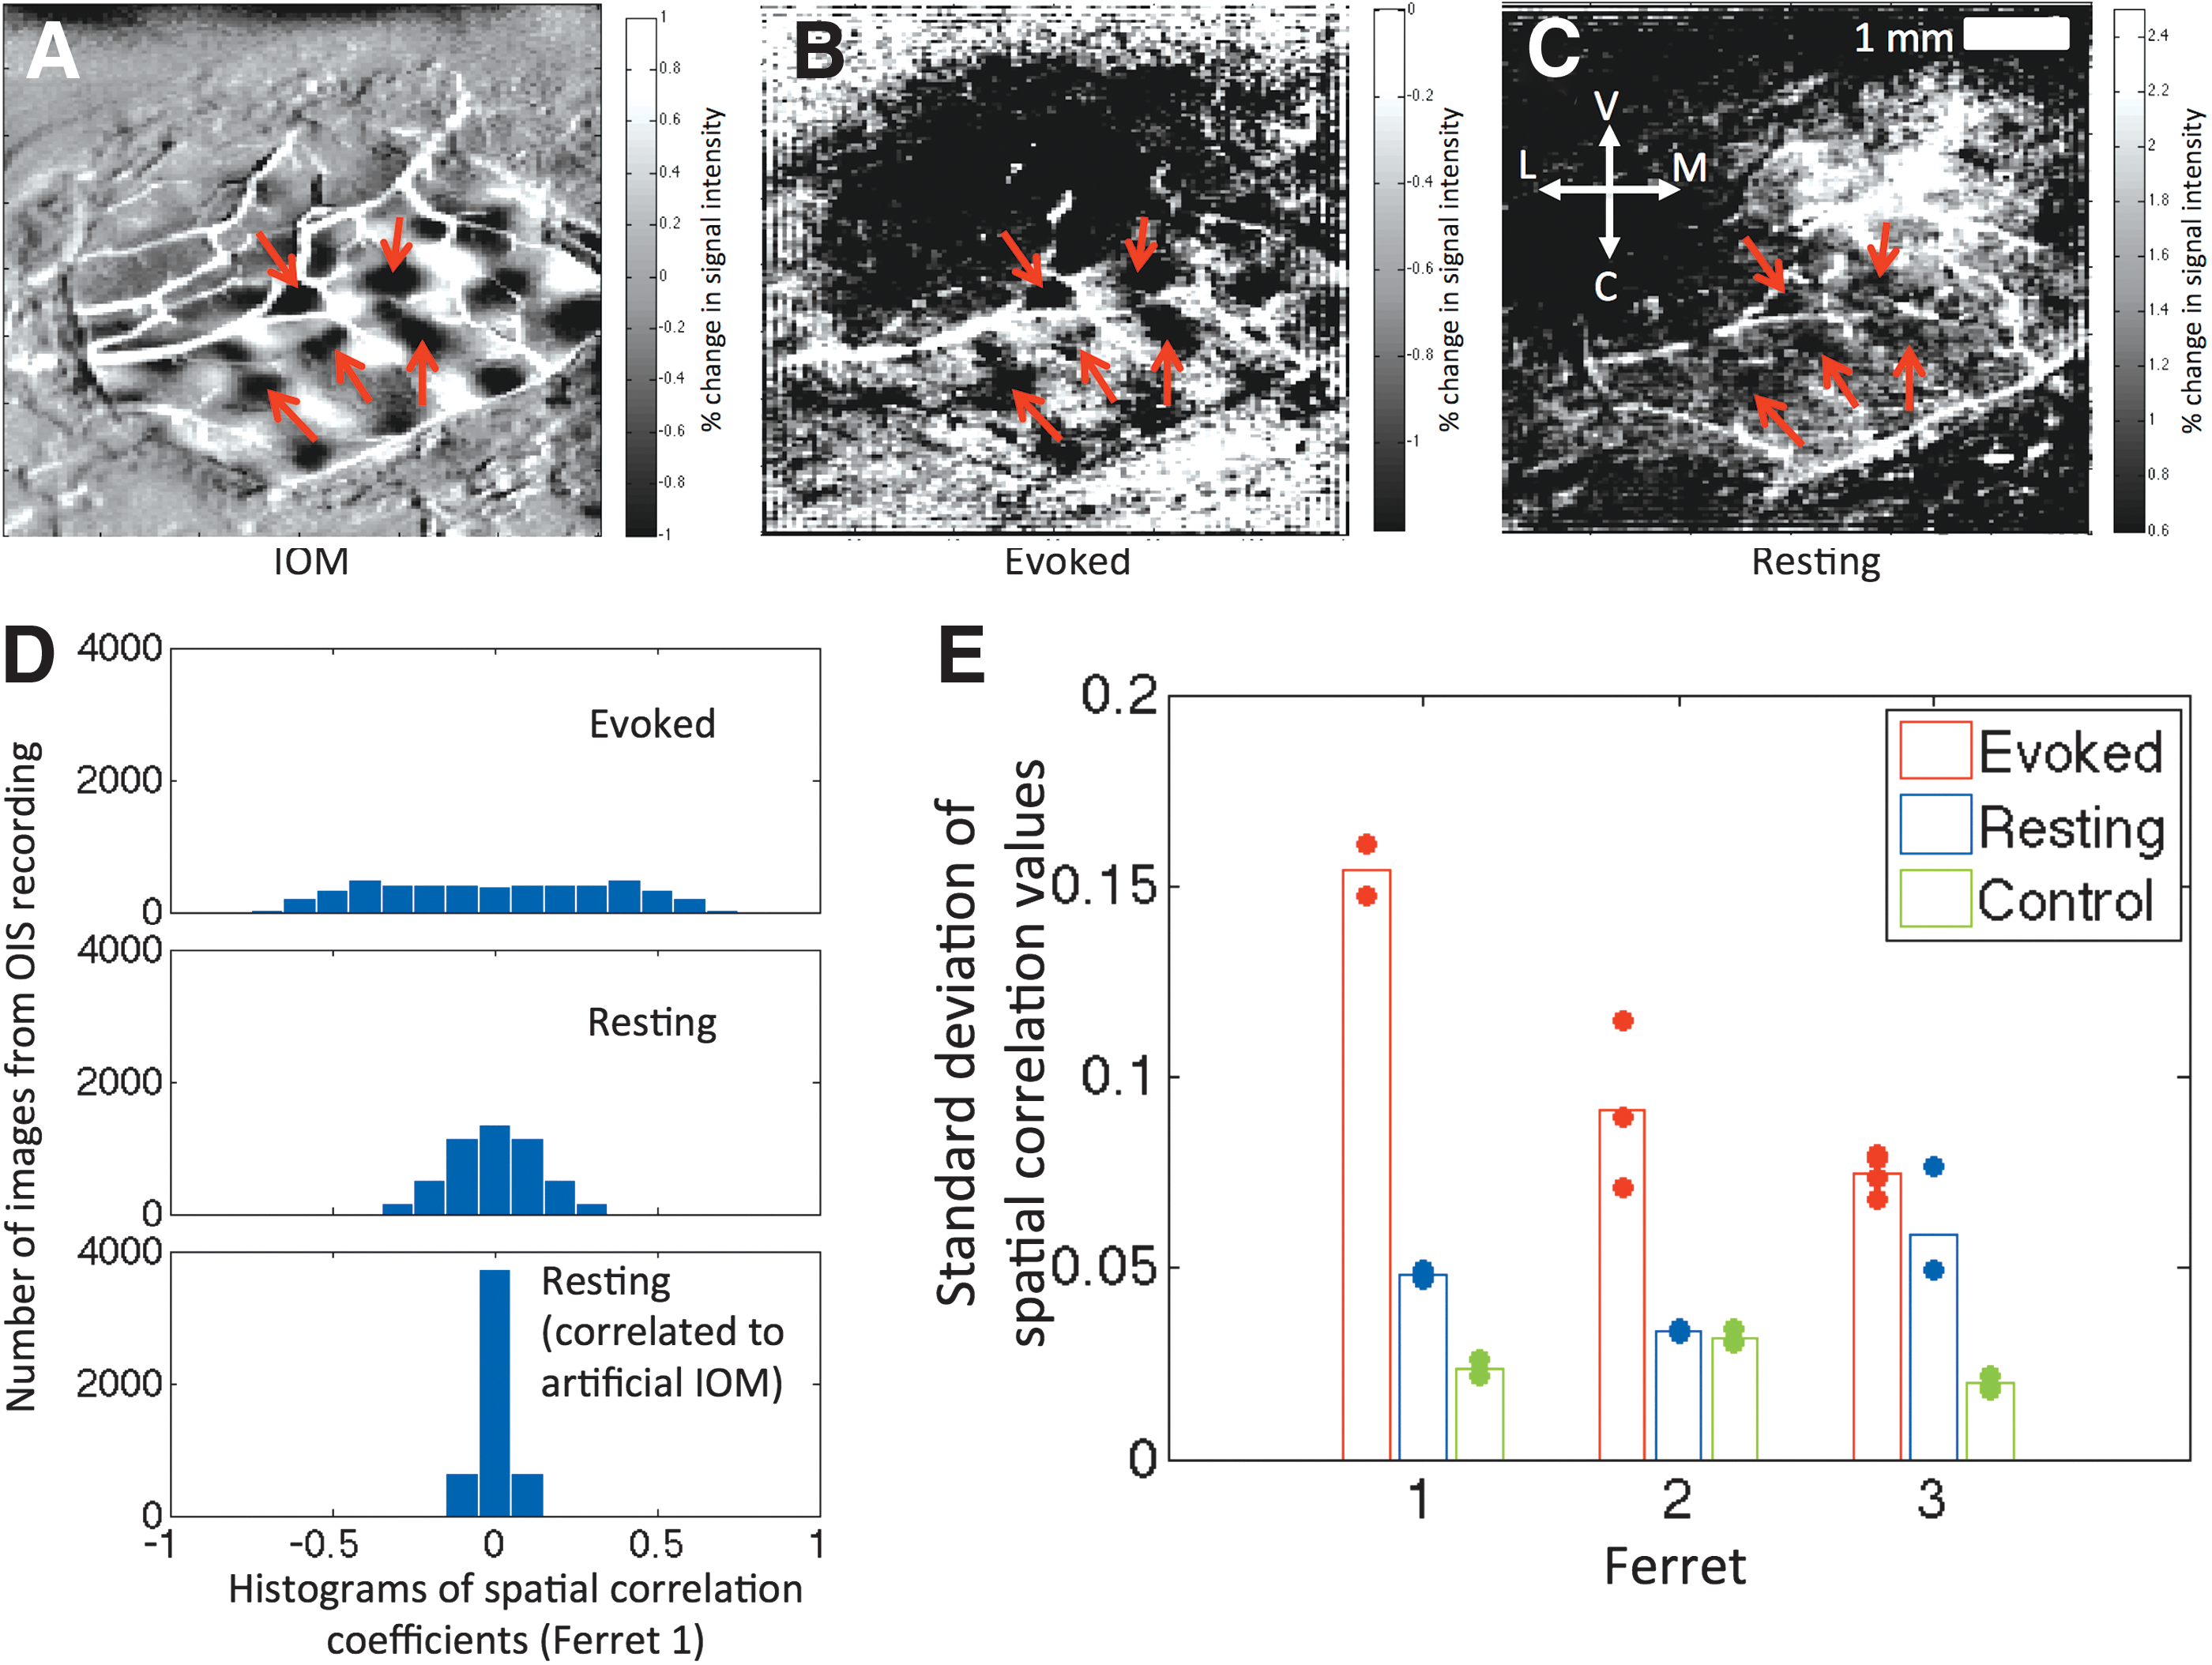
Spatial correlation analysis (620 nm data).
The standard deviation of the distribution of spatial correlation coefficients was used as a measure of similarity to the IOMs for each animal. A summary of these results for all three ferrets is shown in Figure 3E for the 620 nm data. As expected, the standard deviation of the correlation coefficients was larger for the es-OIS data compared to the rs-OIS data, on average by 128%. Compared to the control test (pseudorandom map), resting state trials showed a larger standard deviation (85% larger on average), indicating that the spatial distribution of low-frequency fluctuations is more likely to resemble the intrinsic functional architecture of the orientation columns than a pseudorandom structure. These results were consistent with the qualitative findings in Supplementary Figure S4 showing difference images with high spatial correlation for all animals. All three ferrets showed patchy areas that appear spatially similar to the IOM for es-OIS data. Rs-OIS data showed similar patterns for ferrets 1 and 3, although the effect size was less apparent compared to es-OIS data. No such patterns were visually apparent for ferret 2 in resting state, consistent with the finding that the degree of distribution in spatial correlation coefficients was similar for rs-OIS data and control analysis for the animal in Figure 3E. Spatial correlation analysis of 700 nm data yielded similar results as those observed in 620 nm.
Temporal correlation analysis
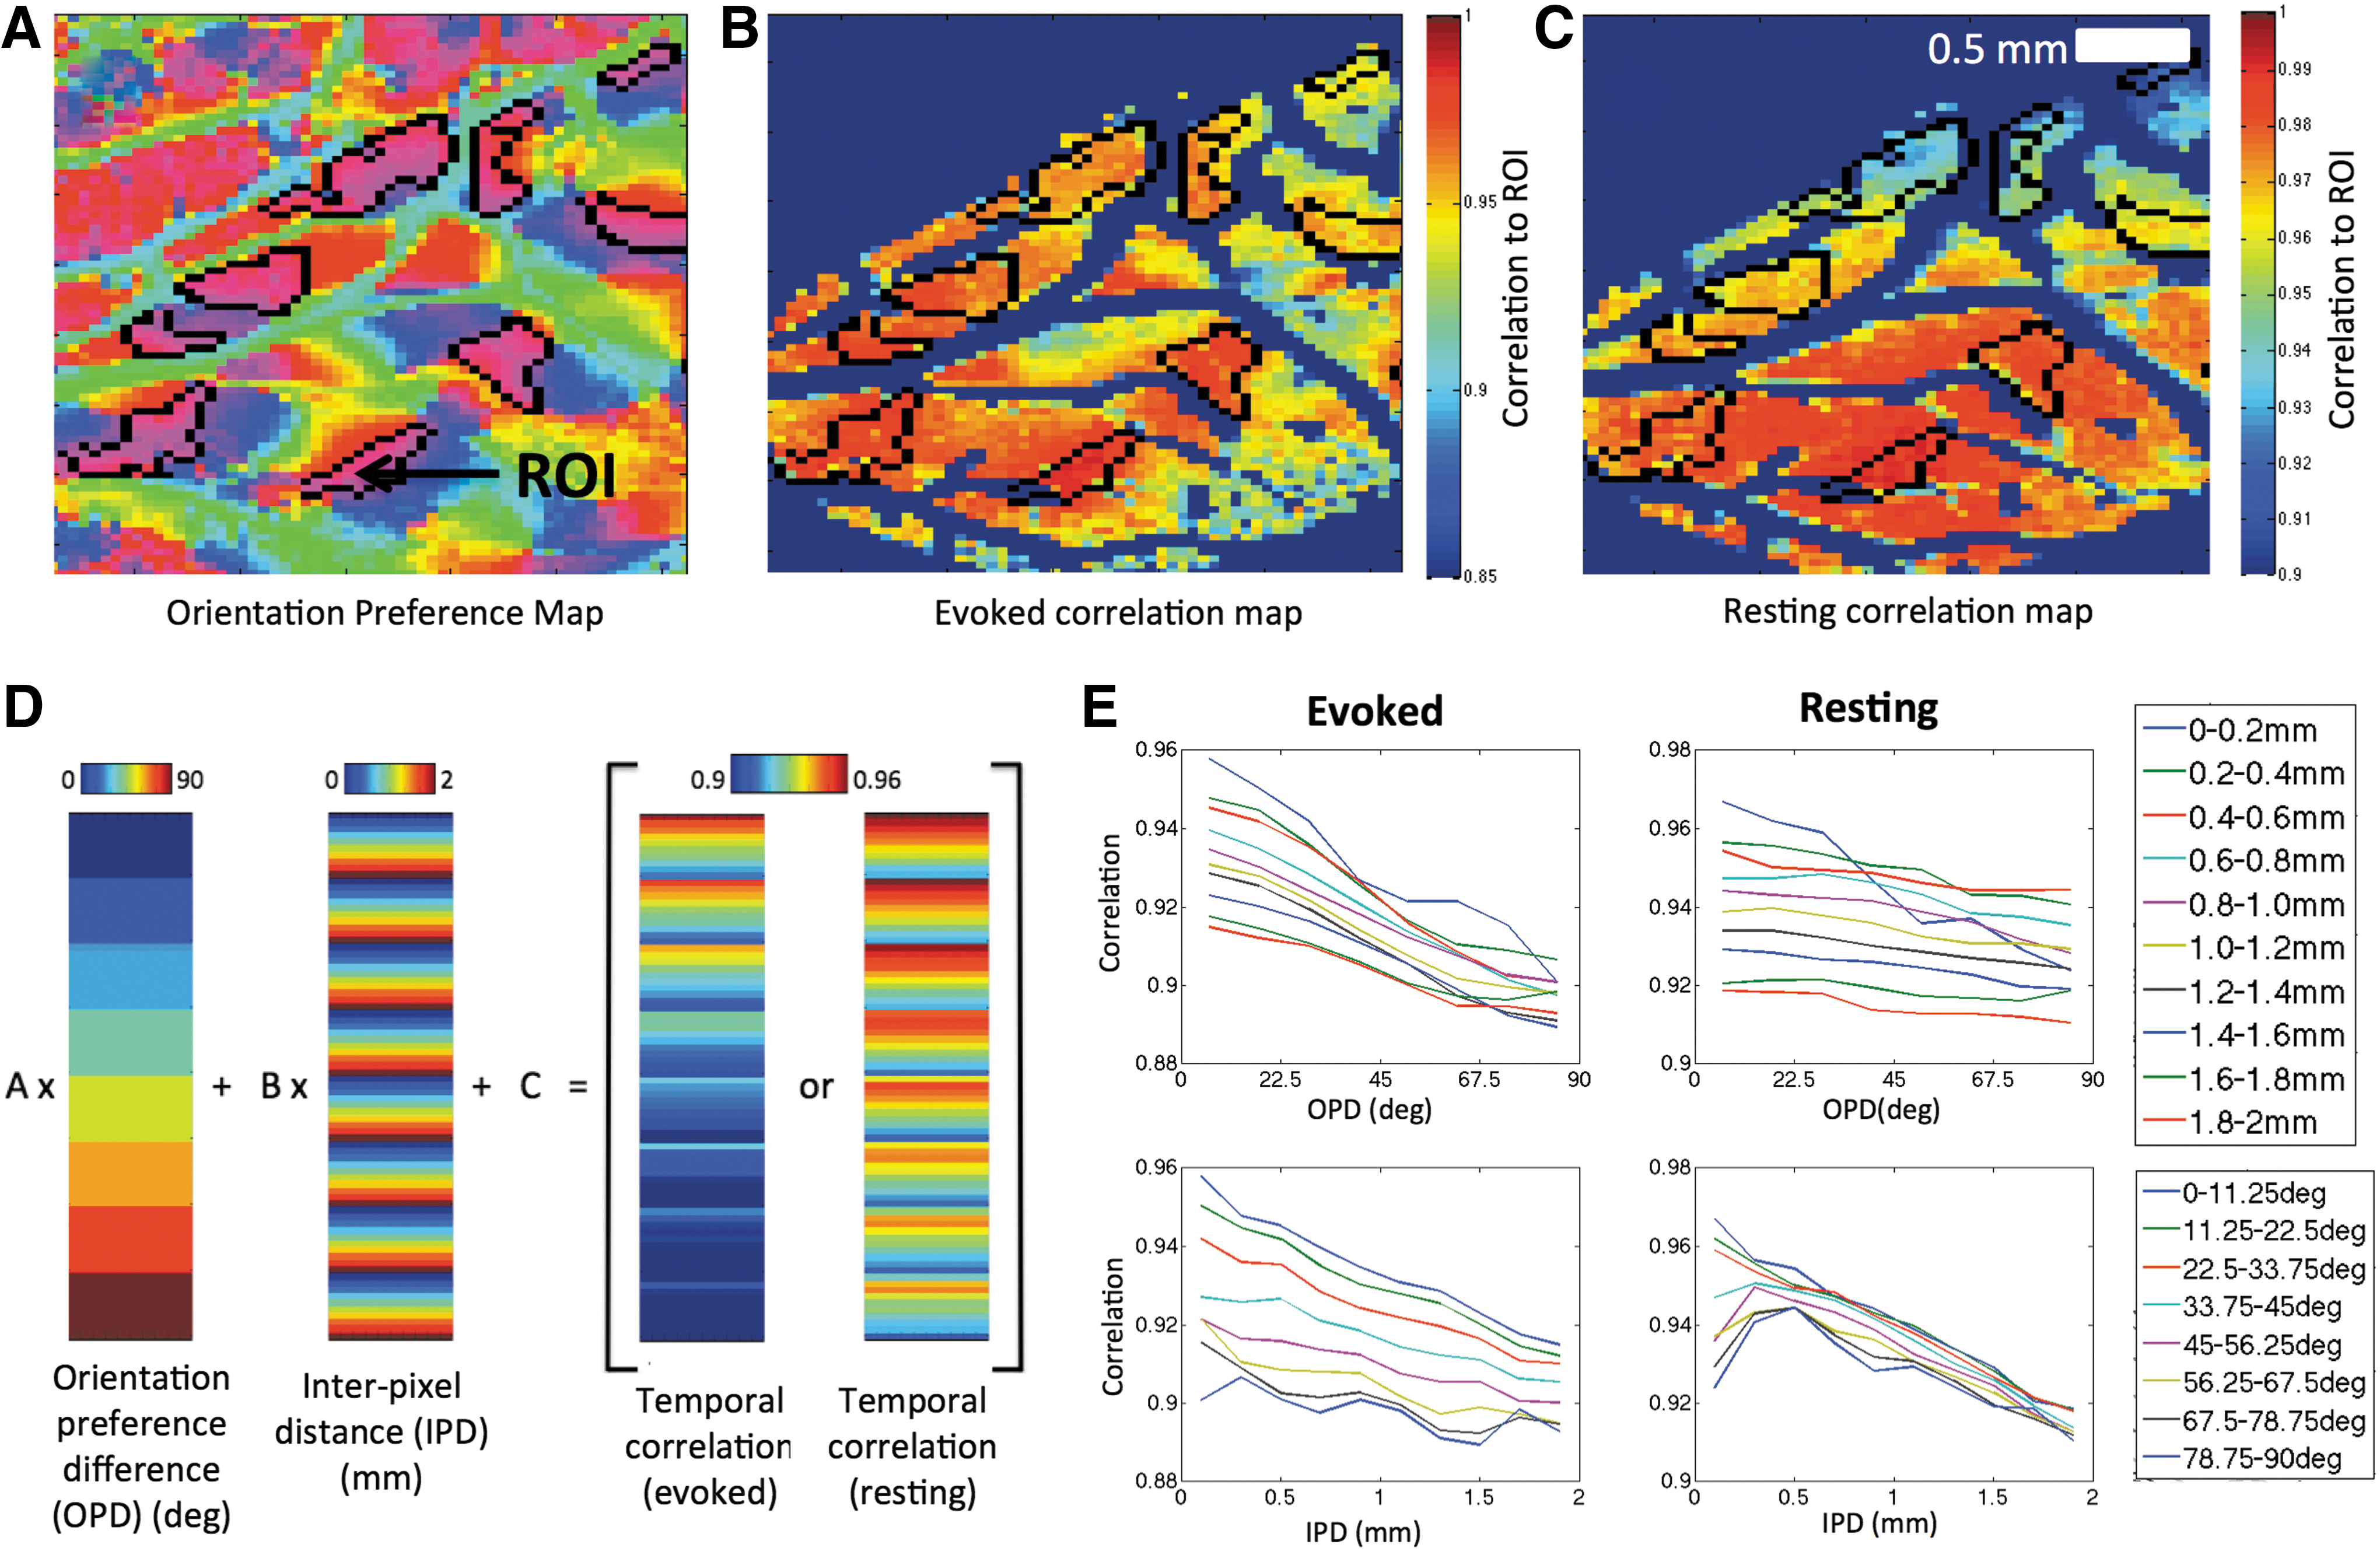
To illustrate the spatial properties of temporal correlations, a typical ROI-based temporal correlation analysis is shown for data from one of the ferrets. The ROI was comprised of pixels with similar orientation preference and is indicated by the arrow in Figure 4A. The mean signal from the ROI was correlated to data from the rest of the brain under evoked and resting conditions and the results are shown in Figure 4B and C, respectively. For the evoked data (Fig. 4B), areas of high correlation tended to fall within regions of similar orientation preference to the ROI (within the black outlines in Fig. 4A) although the strength of the correlation appears to decrease with increasing distance. This pattern is also evident in the correlation map obtained from the resting data; however, the correlation strength with similar orientation preference areas is not as clear. It is possible that orientation domains are correlated, but this effect is obscured by a distance effect.
Temporal correlation analysis.
Hence, to determine if iso-orientation domains are associated with larger correlation, the linear model in Equation (1) was developed to account for a distance effect. A schematic of this model and data is shown in Figure 4D and it revealed trends in correlation that reflect the patterns observed in vectors of difference in orientation preference and IPD. Plotting this correlation data separately against each covariate (Fig. 4E) shows that decreases in correlation with respect to these two variables are well described by a linear model.
The model coefficients and their significance are presented in Figure 5 for 620 nm data. All datasets at 620 nm for all animals (18 trials total) yielded significant values for the orientation preference coefficient (A < 0 with p < 0.05) in both evoked and resting states. Furthermore, significant differences (p < 0.05) were observed in the magnitude of the orientation preference coefficient between es-OIS and rs-OIS data and between rs-OIS data and control analysis for all three ferrets. Imaging at 700 nm yielded values for the orientation preference coefficient that were smaller in magnitude for both evoked and resting conditions, but nonetheless significant in more than half the cases (10 out of 18).
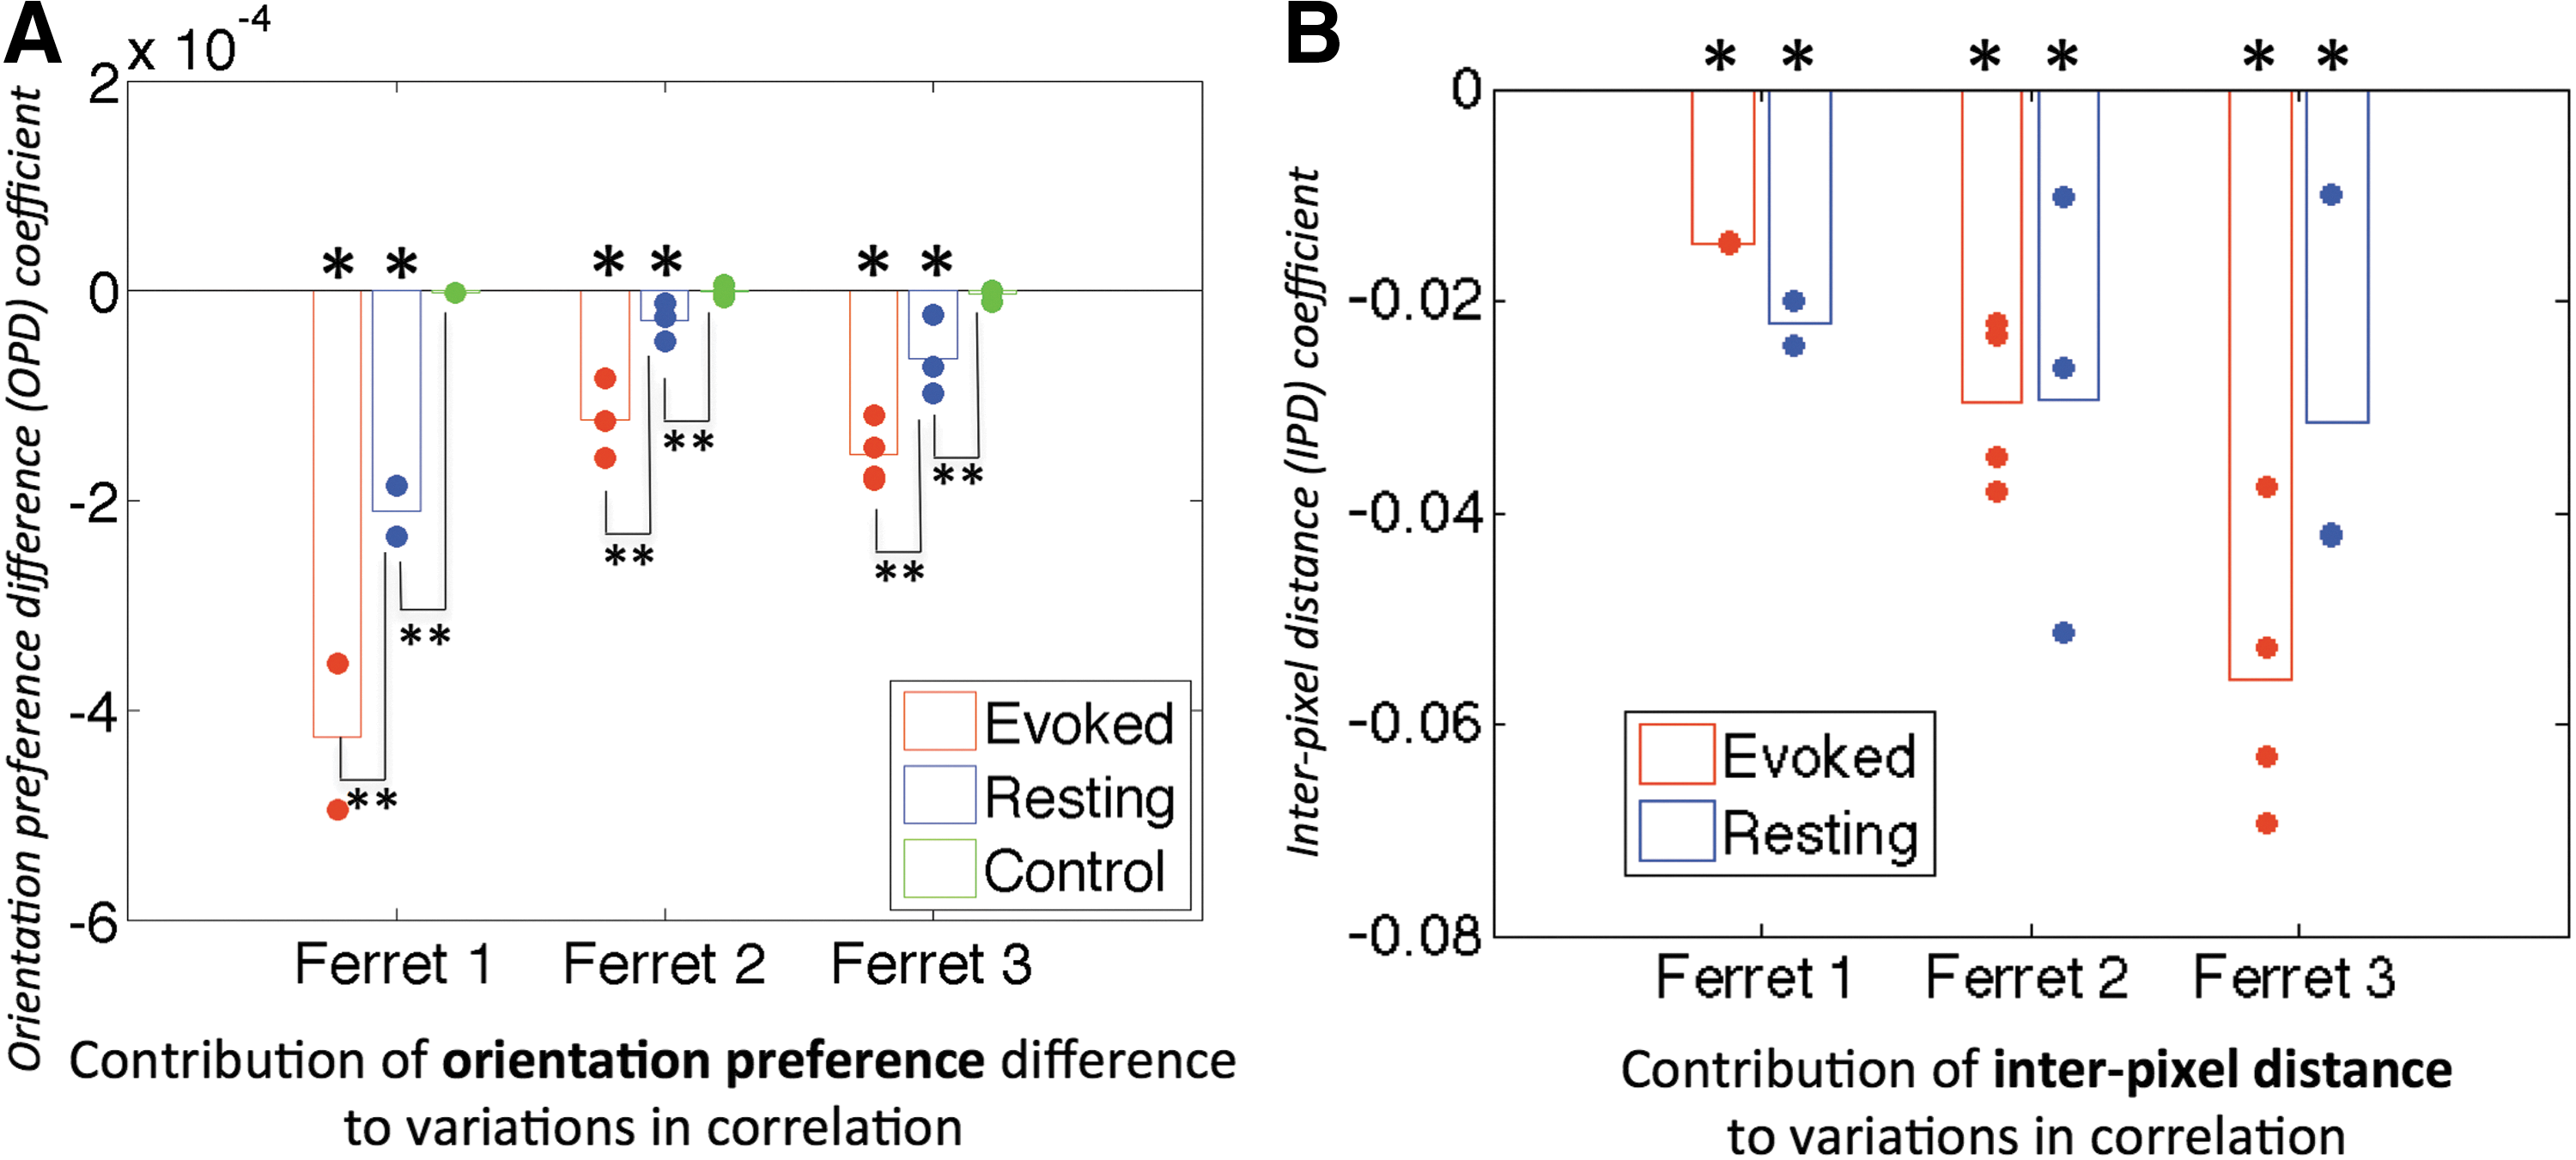
Temporal analysis results. Contributions of orientation preference difference
Comparison between spatial correlation and temporal correlation analyses
While the spatial correlation analysis provides information about the resemblance to the functional architecture at each instance of time, the temporal correlation analysis directly assesses whether signal fluctuations are coherent between areas with similar orientation preferences. To test whether the findings from these two types of analysis are consistent, we examined the relationship between the standard deviation of spatial correlation coefficients and the OPD model coefficient (A) calculated from the temporal correlation analysis (Fig. 6). Results from all experimental runs acquired with 620 nm under evoked and resting conditions were included. A significant negative slope of −0.0026 was obtained indicating that a larger spread in spatial correlation coefficients is associated with a stronger or more negative OPD coefficient.

Comparison between standard deviation of correlation coefficients from spatial correlation analysis and the OPD coefficients from temporal correlation analysis for each OIS recording. A significance of p < 0.01 was obtained after adjusting for the degrees of freedom to account for dependencies in the data (df = 11).
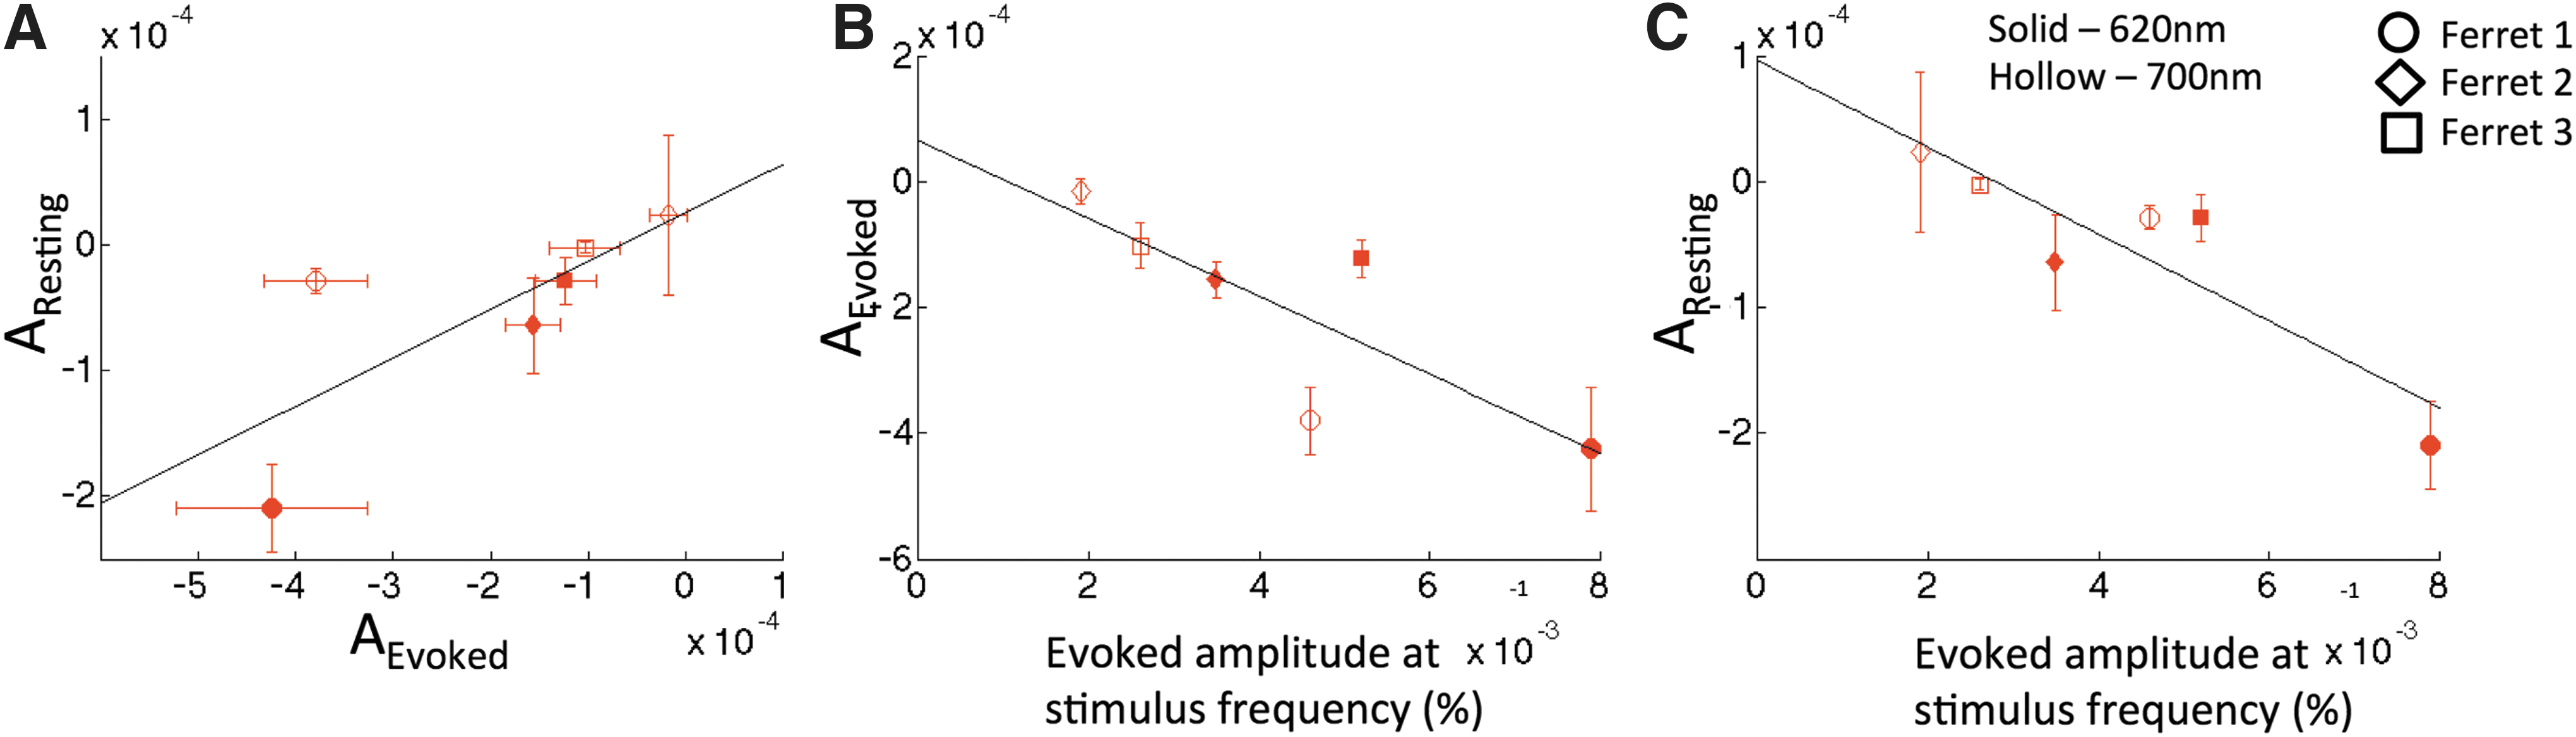
Relationship between orientation-related changes under evoked and resting conditions
The strength of iso-orientation connectivity, indicated by the OPD coefficient, was compared between the evoked and resting data (Fig. 7A). A positive relationship (slope of 0.383 resting/evoked, R = 0.756) suggests that the degree of connectivity under resting conditions is related to that observed in evoked conditions. We did not test for significance due to the small number of samples. Nonetheless, these results are consistent with previous findings comparing strength of functional connectivity between evoked and resting states (De Luca et al., 2005; Mohajerani et al., 2010) on larger spatial scales. An inverse relationship was observed between the mean es-OIS signal amplitude as a result of visual stimulation and mean orientation preference coefficient values under both evoked (slope = −0.0620, R = −0.815) and resting conditions (slope = −0.0344, R = −0.893), respectively, (Fig. 7B, C, respectively). Hence, these findings suggest that larger evoked stimulation signal changes are associated with higher magnitude (more negative) orientation preference coefficients.
Discussion
This work aimed to determine whether low-frequency hemodynamic fluctuations inherently persist within small-scale functional circuits. The ferret visual cortex was used for this purpose, and spatial and temporal correlation analyses were used to determine the significance of these potential relationships. We found that hemodynamic activation patterns at rest tend to spatially resemble the functional architecture of orientation columns and that the temporal correlation of the hemodynamic signal is stronger between areas of similar orientation preference compared to areas with orthogonal orientation preference. These findings were more apparent in data acquired during visual stimulation compared to the data acquired at rest. Our results suggest that hemodynamic data are sensitive to the functional connection within and between iso-orientation domains at rest that has been reported in neural data using voltage sensitive dye imaging (Kenet et al., 2003). To observe orientation-related changes in temporal correlation, the analysis required accounting for a decrease in correlation as a function of distance as part of our temporal correlation model. We tested whether the orientation preference coefficient of the model from rest data (i.e., slope of correlation coefficient vs. orientation difference for a given pair) was related to that under visual stimulation and found a clear tendency. Altogether, the results from the spatial and temporal analyses were consistent although both analyses required knowing the underlying functional organization of orientation domains (measured using a visual stimulus with known orientation). The data suggest that coherent low-frequency hemodynamic fluctuations are present within small-scale connected networks.
Although the number of animals is limited, we performed multiple experiments under different wavelengths and conditions that yielded robust and consistent results for both spatial and temporal analyses. Although these results are statistically significant in all resting and evoked data acquired at 620 nm, the small number of animals prevents us from drawing direct inferences on reproducibility and effect size. Rather, we focus on the consistency of our findings. To substantiate our findings, control analyses were performed using pseudorandom orientation maps and no significant relationships were found. These results indicate that hemodynamic data in resting state contain sufficient information to identify orientation-specific changes in activity, as reported in other studies using neural measures of activity (Anand et al., 2005; Kenet et al., 2003; Tsodyks et al., 1999).
Intrinsic optical imaging as a surrogate of BOLD fMRI
OIS was used to achieve high spatial resolution and sensitivity. OIS at 620 nm is very well suited to detect hemodynamic changes that correspond to visual stimulation. It provided better contrast than imaging at 700 nm. On average, the orientation selective oscillatory es-OIS was nearly twice as large under 620 nm in comparison to 700 nm (Fig. 2). These results are in agreement with previous observations (Frostig et al., 1990) and are in line with the recommendations of Bonhoeffer and Grinvald (1996), who propose that the best functional maps tend to be obtained when performing optical imaging at the wavelength corresponding to the peak difference between oxy- and deoxyhemoglobin (∼600 nm). There is consideration that using longer wavelength light in optical imaging studies provides the advantage of fewer blood vessel artifacts, greater sensitivity to scatter, and greater penetration depth (Mc Loughlin and Blasdel, 1998). However, analysis of the 620 nm data consistently showed more evident patterns of orientation-selective functional connectivity under temporal correlation analysis compared to 700 nm data. This is likely due to the lower sensitivity of the 700 nm data.
Hemodynamic-based optical imaging has been extensively used to map orientation column domains in different mammalian species, including ferrets, and its correspondence with the underlying neuronal architecture has been demonstrated (Bosking et al., 2002; Chapman et al., 1996; Grinvald et al., 1986; Maldonado et al., 1997; Niessing et al., 2005; Rao et al., 1997). The sensitivity of our measurements was sufficient to observe resting fluctuations in the ferret visual cortex and test for significant changes within and between orientation domains. Temporal correlation analysis of the 620 nm data revealed a statistically significant association between correlation and difference in orientation preference for every trial in every ferret in evoked and resting states (18 trials in total) and not for any control analyses (8 trials). The association between correlation and orientation was less apparent at 700 nm with 8 of the 18 trials not showing a significant relationship (3 evoked trials and 5 resting trials). This is likely due to the lower sensitivity of this method. We also performed temporal correlation analyses on data collected postmortem for one of the ferrets (not shown) as a control and found no association to its actual orientation preference map.
Examination of connectivity patterns
Resting-state functional connectivity patterns that reveal the orientation specificity of visual cortex have been identified using nonhemodynamic means (Kenet et al., 2003; Tsodyks et al., 1999). There is evidence from anatomical studies that horizontal axonal projections tend to preferentially connect columns of similar orientation preference (Gilbert and Wiesel, 1989; Stettler et al., 2002) and also that these connections are physiologically active (Weliky et al., 1995). These findings suggest the presence of an intrinsic functional network that reflects the orientation selectivity of the visual cortex.
Spatial correlation analysis
The spatial correlation results indicate that resemblance to the IOMs is more apparent in the evoked condition than at rest for all three ferrets, which is expected. However, instances in resting state data also tended to show resemblance to the IOMs in two of the three ferrets as measured by the spread of spatial correlation coefficients (Fig. 3E), as well as visual inspection of maximally correlated OIS images (Fig. 3C), suggesting that while orientation-specific hemodynamic changes can be observed spatially using OIS with visual stimulation, this effect is not consistently large at rest. Data from a larger sample size of animals would be needed to examine this variability and optimize the detection of orientation-specific spatial patterns at rest.
The spatial correlation results are in agreement with similar analysis performed on voltage-sensitive dye imaging data (Kenet et al., 2003). Optical imaging with voltage-sensitive dyes is a more direct measure of neuronal electrical activity and offers superior temporal resolution in comparison to OIS; however, use of voltage-sensitive dyes can also lead to pharmacological side-effects, phototoxicity, and bleaching (Frostig et al., 1990). The ability to detect functionally relevant resting-state hemodynamic patterns of activation within cortical columns using OIS indicates a correspondence between resting hemodynamic fluctuations and previously reported columnar neural activity patterns.
Temporal correlation analysis
Analysis of the temporal correlation patterns of hemodynamic signals consistently showed orientation specificity (Fig. 5B) in both evoked and resting states. These findings are strengthened by their consistency with spatial correlation analysis (Fig. 6). Correlation maps obtained using a mean time series from an iso-orientation ROI showed a strong dependence between correlation and distance, especially for the rs-OIS data (example in Fig. 4C). Even in the evoked stimulation data, there was a general decrease in temporal correlation with increasing distance from the ROI with local bright spots corresponding to other iso-orientation regions (Fig. 4B). The distance effect on correlation under both evoked and resting conditions motivated our decision to include IPD as a covariate within our general linear model.
Physiological and nonphysiological factors can contribute to the distance effect. Nonphysiological effects might include nonuniform illumination of the ferret brain or a curved brain sample where not all of the imaging area are in focus, impacting SNR. Including image intensity into the linear model as an additional covariate did not significantly impact the relationship (slope) between correlation and OPD. In addition, removing global signal fluctuations did not significantly alter the findings. Another possibility is that although many orientation domains are present in the imaged area, the field-of-view might include a portion of area V2, which also limits the extent of horizontal connections. Although area V2 also has orientation domains, the cortex is curved and not easily visible.
Known horizontal connections between iso-orientation domains in the visual cortex are likely responsible for these small but significant connectivity findings (Grinvald et al., 1994; Stettler et al., 2002). In addition, because these horizontal connections span a few orientation domains, they would also contribute to the distance effect observed. Distance dependence of temporal correlation patterns has been demonstrated using multiple imaging modalities. Optical imaging using voltage-sensitive dyes revealed that anatomical connections corresponding to retinotopic organization are distance dependent on the scale of millimeters (Grinvald et al., 1994) and that the observed decrease in correlation with increasing distance was steeper than the decrease associated with increasing difference in orientation preference (Sharon et al., 2007), in agreement with our findings (|B| > |A|). Similar findings have also been demonstrated by Wang et al. (2013) in that interareal connections in resting state within the somatosensory cortex reflect local anatomical connections. Analysis of local field potential signals acquired from the primate visual cortex under task and resting conditions showed linear decreases in coherence with increasing distance between electrodes on the scale of millimeters (Leopold et al., 2003). Our findings agree with these studies, which underscore the importance of accounting for IPD in delineating the relationship between similarity in orientation preference and signal correlation.
Finally, we observed correspondence between OPD coefficients (A) in evoked and resting states (Fig. 7A). This suggests that functional connectivity as measured using hemodynamic methods in the evoked state is related to the connectivity strength at rest. This might be due to a consistent neurovascular coupling mechanism for rest and evoked stimulation conditions. Associations between measures of functional connectivity under stimulation and at rest have been made in other studies (De Luca et al., 2005; Mohajerani et al., 2010; Smith et al., 2009) and the implication of these associations is unclear as they could indicate that evoked activity shapes spontaneous activity or vice-versa.
A noted limitation of this study is the relatively small sample size of three animals. The goal of this study was to demonstrate the novel finding that orientation-specific activity can be identified in resting state using hemodynamic methods. A study with more animals would be required to make this finding generalizable and to further optimize the experimental conditions to detect small-scale hemodynamic changes in resting state. Another limitation is the use of OIS as the hemodynamic imaging modality. Despite being sensitive to changes in blood oxygenation, OIS has superior resolution, but smaller effect sizes (signal changes) compared to fMRI. A proper fMRI study is necessary to determine the sensitivity requirements for fMRI to capture these local effects. In addition, the use of OIS requires a craniotomy and use of anesthesia, both of which can affect the hemodynamic physiology of the animals.
Conclusions
Our results suggest that spatial and temporal coherence metrics measured from hemodynamic signals using OIS can reflect known connectivity patterns at submillimeter scales at rest. Detection of functional connectivity at such small scales required knowing the functional organization of orientation columns and is complicated by the presence of signal changes that are not associated with functional organization, whether physiological or not. In this study, we used a linear model to account for these relationships. The findings in this study take us one step closer to the possibility of imaging small-scale functional structures in humans using noninvasive hemodynamic techniques like fMRI.
Footnotes
Acknowledgments
The authors thank Dr. Apostolos Georgopoulos and Dr. James Oliver for critical discussion. This work was supported by NIH grants EB003324, NS066131, NS07391, and NS079143, as well as IBS grant IBS-R015 and the Alzheimer's Association.
Author Disclosure Statement
No competing financial interests exist.
References
Supplementary Material
Please find the following supplemental material available below.
For Open Access articles published under a Creative Commons License, all supplemental material carries the same license as the article it is associated with.
For non-Open Access articles published, all supplemental material carries a non-exclusive license, and permission requests for re-use of supplemental material or any part of supplemental material shall be sent directly to the copyright owner as specified in the copyright notice associated with the article.