
Abstract
The coordinated activity of the resting-state brain can be evaluated with magnetoencephalography (MEG) for distinct brain rhythms by performing source reconstruction to estimate the activities of target brain regions and employing one of the many existent functional connectivity (FC) algorithms. Although this procedure has been applied in a great amount of studies both with healthy and pathological populations, the reliability of such FC estimates is unknown, and this impairs the use of resting-state MEG FC at the individual level. In this study, the test-retest reliability of MEG resting FC was evaluated by exploring both within- and between-subject variability in FC in 16 healthy subjects who underwent three resting-state MEG scans. FC was computed after beamforming source reconstruction with four popular FC metrics: phase-locking value (PLV), phase lag index (PLI), direct envelope correlation (d-ecor), and envelope correlation with leakage correction (lc-ecor). Then, test-restest reliability and within- and between-subject agreement were evaluated with the intraclass correlation coefficient (ICC) and Kendall's W, respectively. Reliability was found to depend on the FC metric, the frequency band, and the specific link. As a general trend, greater test-retest reliability was found for PLV in theta to gamma, and for lc-ecor and d-ecor in beta. Further inspection of the ICC distribution revealed that volume conduction effects could be contributing to high ICC in PLV and d-ecor. In addition, stronger links were found to be more reliable. Overall, this encourages the further use of resting-state MEG FC for individual-level studies, especially with PLV or envelope correlation metrics.
Introduction
S
This spontaneous brain coordination is usually characterized with functional connectivity (FC), which evaluates statistical dependencies between the activities of distinct brain regions (Pereda et al., 2005). FC can be seen as a mechanism of information transfer between brain areas, and resting FC has been proven to be indicative of an individual's brain functioning in a variety of studies (Baldassarre et al., 2012; Rosazza and Minati, 2011; Yamashita et al., 2015).
Resting-state FC has been predominantly examined with functional magnetic resonance imaging (fMRI) as correlations between blood oxygenation level-dependent (BOLD) signals (van den Heuvel et al., 2009). Although fMRI is of great use in the exploration of human brain function, slowly fluctuating BOLD signals constitute only an indirect measure of brain activity. Therefore, over the past few years, attention has been drawn to the electrophysiological basis of FC. In fact, although magnetoencephalography (MEG) is often overshadowed by the high spatial resolution of fMRI, MEG provides an exceptional insight into the time–frequency dynamics of brain activity. It is indeed a direct measure of neuronal firing and offers an excellent temporal resolution. Resting-state networks (RSNs) have been successfully extracted with MEG over the past years using source-space FC (Brookes et al., 2011a,b; de Pasquale et al., 2010; Hall et al., 2013; Hipp et al., 2012; Luckhoo et al., 2012; Wens et al., 2014). Moreover, resting-state MEG FC has been proven sensible to detect abnormal brain functioning in a variety of diseases, including Alzheimer's disease (Engels et al., 2015; López et al., 2014), multiple sclerosis (Tewarie et al., 2015), and schizophrenia (Bowyer et al., 2015).
Overall, this indicates that FC can be robustly assessed with MEG. However, FC estimates could be affected by measurement noise and the subjects' cognitive or emotional state, and it is unclear to what extent FC estimates are representative of an individual. This prevents the potential use of MEG FC in the characterization of individual subjects or in the proper classification between healthy and pathological populations. Therefore, the reliability of FC estimates needs to be carefully examined. To date, only a handful of studies have tackled test-retest reliability of MEG/electroencephalography (EEG) FC (Deuker et al., 2009; Hardmeier et al., 2014; Jin et al., 2011), and they were restricted to sensor space, therefore failing to provide the spatial resolution necessary for the evaluation of whole-brain FC. To our knowledge, no study has quantified the test-retest reliability of source-space MEG FC estimates.
In this work, we investigated the test-retest reliability of MEG FC. For that, we computed whole-brain resting state FC for 16 subjects, who were scanned thrice with a 1-week test-retest interval. For each subject and session, source reconstruction of the sensor space data was performed with beamforming, and FC was computed between 66 brain regions. FC was evaluated with four phase and envelope synchronization metrics, both with and without correction for volume conduction: envelope correlation (d-ecor), envelope correlation with leakage correction (lc-ecor), phase locking value (PLV), and phase lag index (PLI). The test-retest reliability of the FC estimates was then assessed with the intraclass correlation coefficient (ICC). The effect of the volume conduction on the variability in ICC values across FC metrics and frequency bands was assessed through a linear mixed model (LMM), including the ICC of the beamformer weights correlation. In addition, within- and between-subject agreement of FC maps was computed with Kendall's W.
Materials and Methods
Subjects and MEG acquisition
Sixteen healthy subjects (age 30.4 ± 5.8, 10 women and 6 men) underwent three resting-state MEG sessions (two conditions: eyes open and eyes closed) over 3 consecutive weeks. For each participant, scans were scheduled at the same day of the week and same time of the day (8 subjects in the morning, 8 subjects in the afternoon). The study was approved by the local Ethics Committee. MEG resting-state recordings were acquired at the Center for Biomedical Technology (Madrid, Spain) using an Elekta Vectorview system with 306 sensors (102 magnetometers and 204 planar gradiometers), inside a magnetically shielded room (Vacuumschmelze GmbH). During the measurements, participants sat 4 min with their eyes open staring at a white cross at 2 m distance and 4 min with their eyes closed. They were instructed to remain calm and move as little as possible. A Fastrak Polhemus system digitized each subject's head and four coils were attached to the forehead and mastoids, so that the head position with respect to the MEG helmet was continuously determined. The activity in electrooculogram channels was also recorded to keep track of ocular artifacts. Signals were sampled at 1000 Hz with an online filter of bandwidth 0.1–300 Hz. Maxfilter software (version 2.2., Elekta Neuromag) was used to remove external noise with the temporal extension of the signal space separation (tsss) method with movement compensation (Taulu and Simola, 2006).
Source reconstruction
The continuous resting-state sensor data were scanned for jump, muscle, and ocular artifacts with FieldTrip (Oostenveld et al., 2011) artifact detection procedures, and nonoverlapping artifact-free 6-sec epochs were located in the continuous resting-state recordings. This yielded 24.3 ± 5.7 clean epochs for the eyes open condition and 26.8 ± 4.7 clean epochs for the eyes closed condition. Then, MEG data were filtered into delta (2–4 Hz), theta (4–8 Hz), alpha (8–13 Hz), beta (13–30 Hz), and gamma (30–45 Hz) frequency bands with a finite impulse response filter of order 1000 and downsampled to a 250 Hz sampling rate.
For each subject, source models were built by spreading dipoles over the cortical surface, with 6 mm spacing. This was achieved by segmenting each subject's T1-weighted MRI with Freesurfer (version 5.1.0; Fischl et al., 2002; Ségonne et al., 2007) and using MNE software (Gramfort et al., 2014) to downsample the corresponding surfaces and realigning to the MEG coordinate system. The forward model was then solved with a three-shell boundary element method, using the inner skull, outer skull, and scalp surfaces extracted from the subject's MRI with NFT software (Acar and Makeig, 2010) and computing leadfield values with MNE.
Source time series were reconstructed with a linearly constrained minimum variance beamformer (Van Veen et al., 1997). For each subject, session, source, and frequency band beamforming filters were built with the magnetometer covariance matrix averaged over trials and a 5% regularization factor. These filters were then applied to the continuous resting-state data, yielding a 4-min time series per source location. To avoid edge artifacts, source time series were only split into clean trials after the FC computation.
FC computation
To compute FC between source time series, four different metrics were used: envelope correlation (d-ecor), envelope correlation with leakage correction (lc-ecor), PLV, and PLI. First, for all source time series
Phase synchronization was computed by evaluating the distribution of phase differences extracted from two source time series
Envelope synchronization can be directly assessed with the correlation coefficient between
Envelopes were smoothed with a 0.5 sec moving average filter. Envelope correlations are particularly relevant in MEG RSNs, since they seem to be closely related to fMRI BOLD fluctuations and have successfully reconstructed fMRI RSNs (Brookes et al., 2011a,b; Maldjian et al., 2014). As for the PLV, d-ecor estimates could be affected by volume conduction. The lc-ecor measure accounts for this effect by performing an orthogonalization of the source time series (Brookes et al., 2012) before envelope and correlation computation:
where
To avoid edge artifacts, envelopes and phases were estimated in the whole 4-min time series, but correlations PLV and PLI were only computed for the previously determined 6-sec clean trials. FC values were averaged over trials to produce a final FC estimate per pair of source locations, condition, frequency band, subject, and session.
Reliability definition and estimation
Reliability is usually considered a relative quantity, which can be defined as follows (Weir, 2005):
where
where
We assume thereby that a true quantity (or, in our case, coupling strength)
The intraclass correlation (or ICC, Shrout and Fleiss, 1979) is the most commonly employed reliability estimate when dealing with interval and ratio values. It evaluates between-subject variance
The type 1–1 ICC is:
where
where
Reliability of whole-brain FC
The test-retest FC reliability was first assessed for all links connecting 66 cortical regions of interest (ROIs). These ROIs were defined in the individual's T1 volume, using Freesurfer software (version 5.1.0) and all 33 cortical regions per hemisphere of the Desikan–Killiany atlas (Desikan et al., 2006). For each ROI, a representative time series was chosen: it corresponded to the source time series that presented the highest average correlation with the other sources within the ROI. FC between ROIs was then computed using all four FC metrics described in the FC Computation section, yielding a 66 × 66 connectivity matrix per FC metric and frequency band. ICC was then computed for each link, FC metric, and frequency band following Equation (9).
The ICC quantifies the test-retest reliability of our FC estimates, but cannot separate which fraction of the reliability is due to the underlying true FC strength and which fraction is due to artifacts in the FC estimate, such as volume conduction. In fact, we can expect that volume conduction presents lower within- than between-subject variability, and therefore may contribute to higher test-retest reliability in FC metrics such as d-ecor or PLV, which are sensible to volume conduction. As a further step, we attempted therefore to elucidate the effect of volume conduction in the ICC. We note that this is a tricky task, since there are no direct measures of volume conduction for a given MEG recording. The correlation between beamformer weights is, however, indicative of source leakage (Hillebrand et al., 2012). In fact, if source leakage exists between two sources, their beamfomer weights are similar (or highly correlated) and their reconstructed time series are highly coupled. In the opposite case, if the beamfomer weight correlation between two sources is low, it is unlikely that high FC between these two sources result from volume conduction. We accordingly computed 66 × 66 beamfomer weight correlation matrices for each frequency band, subject, and session as follows:
where
To assess the effect of beamformer weight correlation (BWC) in the ICC of FC values, the following LMM was employed:
where
Finally, to explore a possible relation between ICCFC and FC strength, Spearman correlations were computed across links between both variables, for each FC metric and frequency band separately. Furthermore, partial correlation between ICCFC and FC, controlling for the effect of ICCBWC, was computed to account for volume conduction effects. Bonferroni correction was applied to control for the multiple comparisons problem.
Within- and between-subject agreement of whole-brain FC maps
Reliability, as computed above, depends both on within- and between-subject variability. To inspect both effects separately, we evaluated the within- and between-subject agreement of FC maps. For a given condition, FC metric, and frequency band, FC maps were sorted across links (ROI pairs)
where
where
Reliability of RSNs
To further investigate the spatial characteristics of the reliability of resting-state FC, we focused on seven well-known RSNs: visual, sensorimotor, auditory, DMN (default mode network), left FP (frontoparietal), right FP, and frontoinsula networks. Each RSN was defined as a set of 2 or 3 nodes, following their spatial extent described previously in the literature (Laird et al., 2011; Smith et al., 2009). The nodes were defined as a 1 cm-radius sphere around a central coordinate defined in MNI space (Table 1), which was then transformed into subject space with a homogeneous transformation extracted from Freesurfer's cortical segmentation process.
MNI coordinates are obtained from the functional magnetic resonance imaging RSNs released by Laird et al. (2011) and Smith et al. (2009). Labels are assigned with FSL atlas tools (Desikan et al., 2006; Eickhoff et al., 2005; Jenkinson et al., 2012).
BA, Broadmann area; DMN, default mode network; FP, frontoparietal.
First, within-network reliability was quantified as the ICC of FC between all source pairs connecting given RSNs nodes, for each FC metric, RSN, and frequency band separately. Second, the reliability of seed-based FC maps was also quantified, using all nodes in Table 1 as seeds and computing the ICC of the FC between the seed and the remaining source locations. To enable within-subject comparisons, individual source meshes were transformed into a template mesh in MNI space with
Results
Reliability of whole-brain FC maps
ICCFC distribution
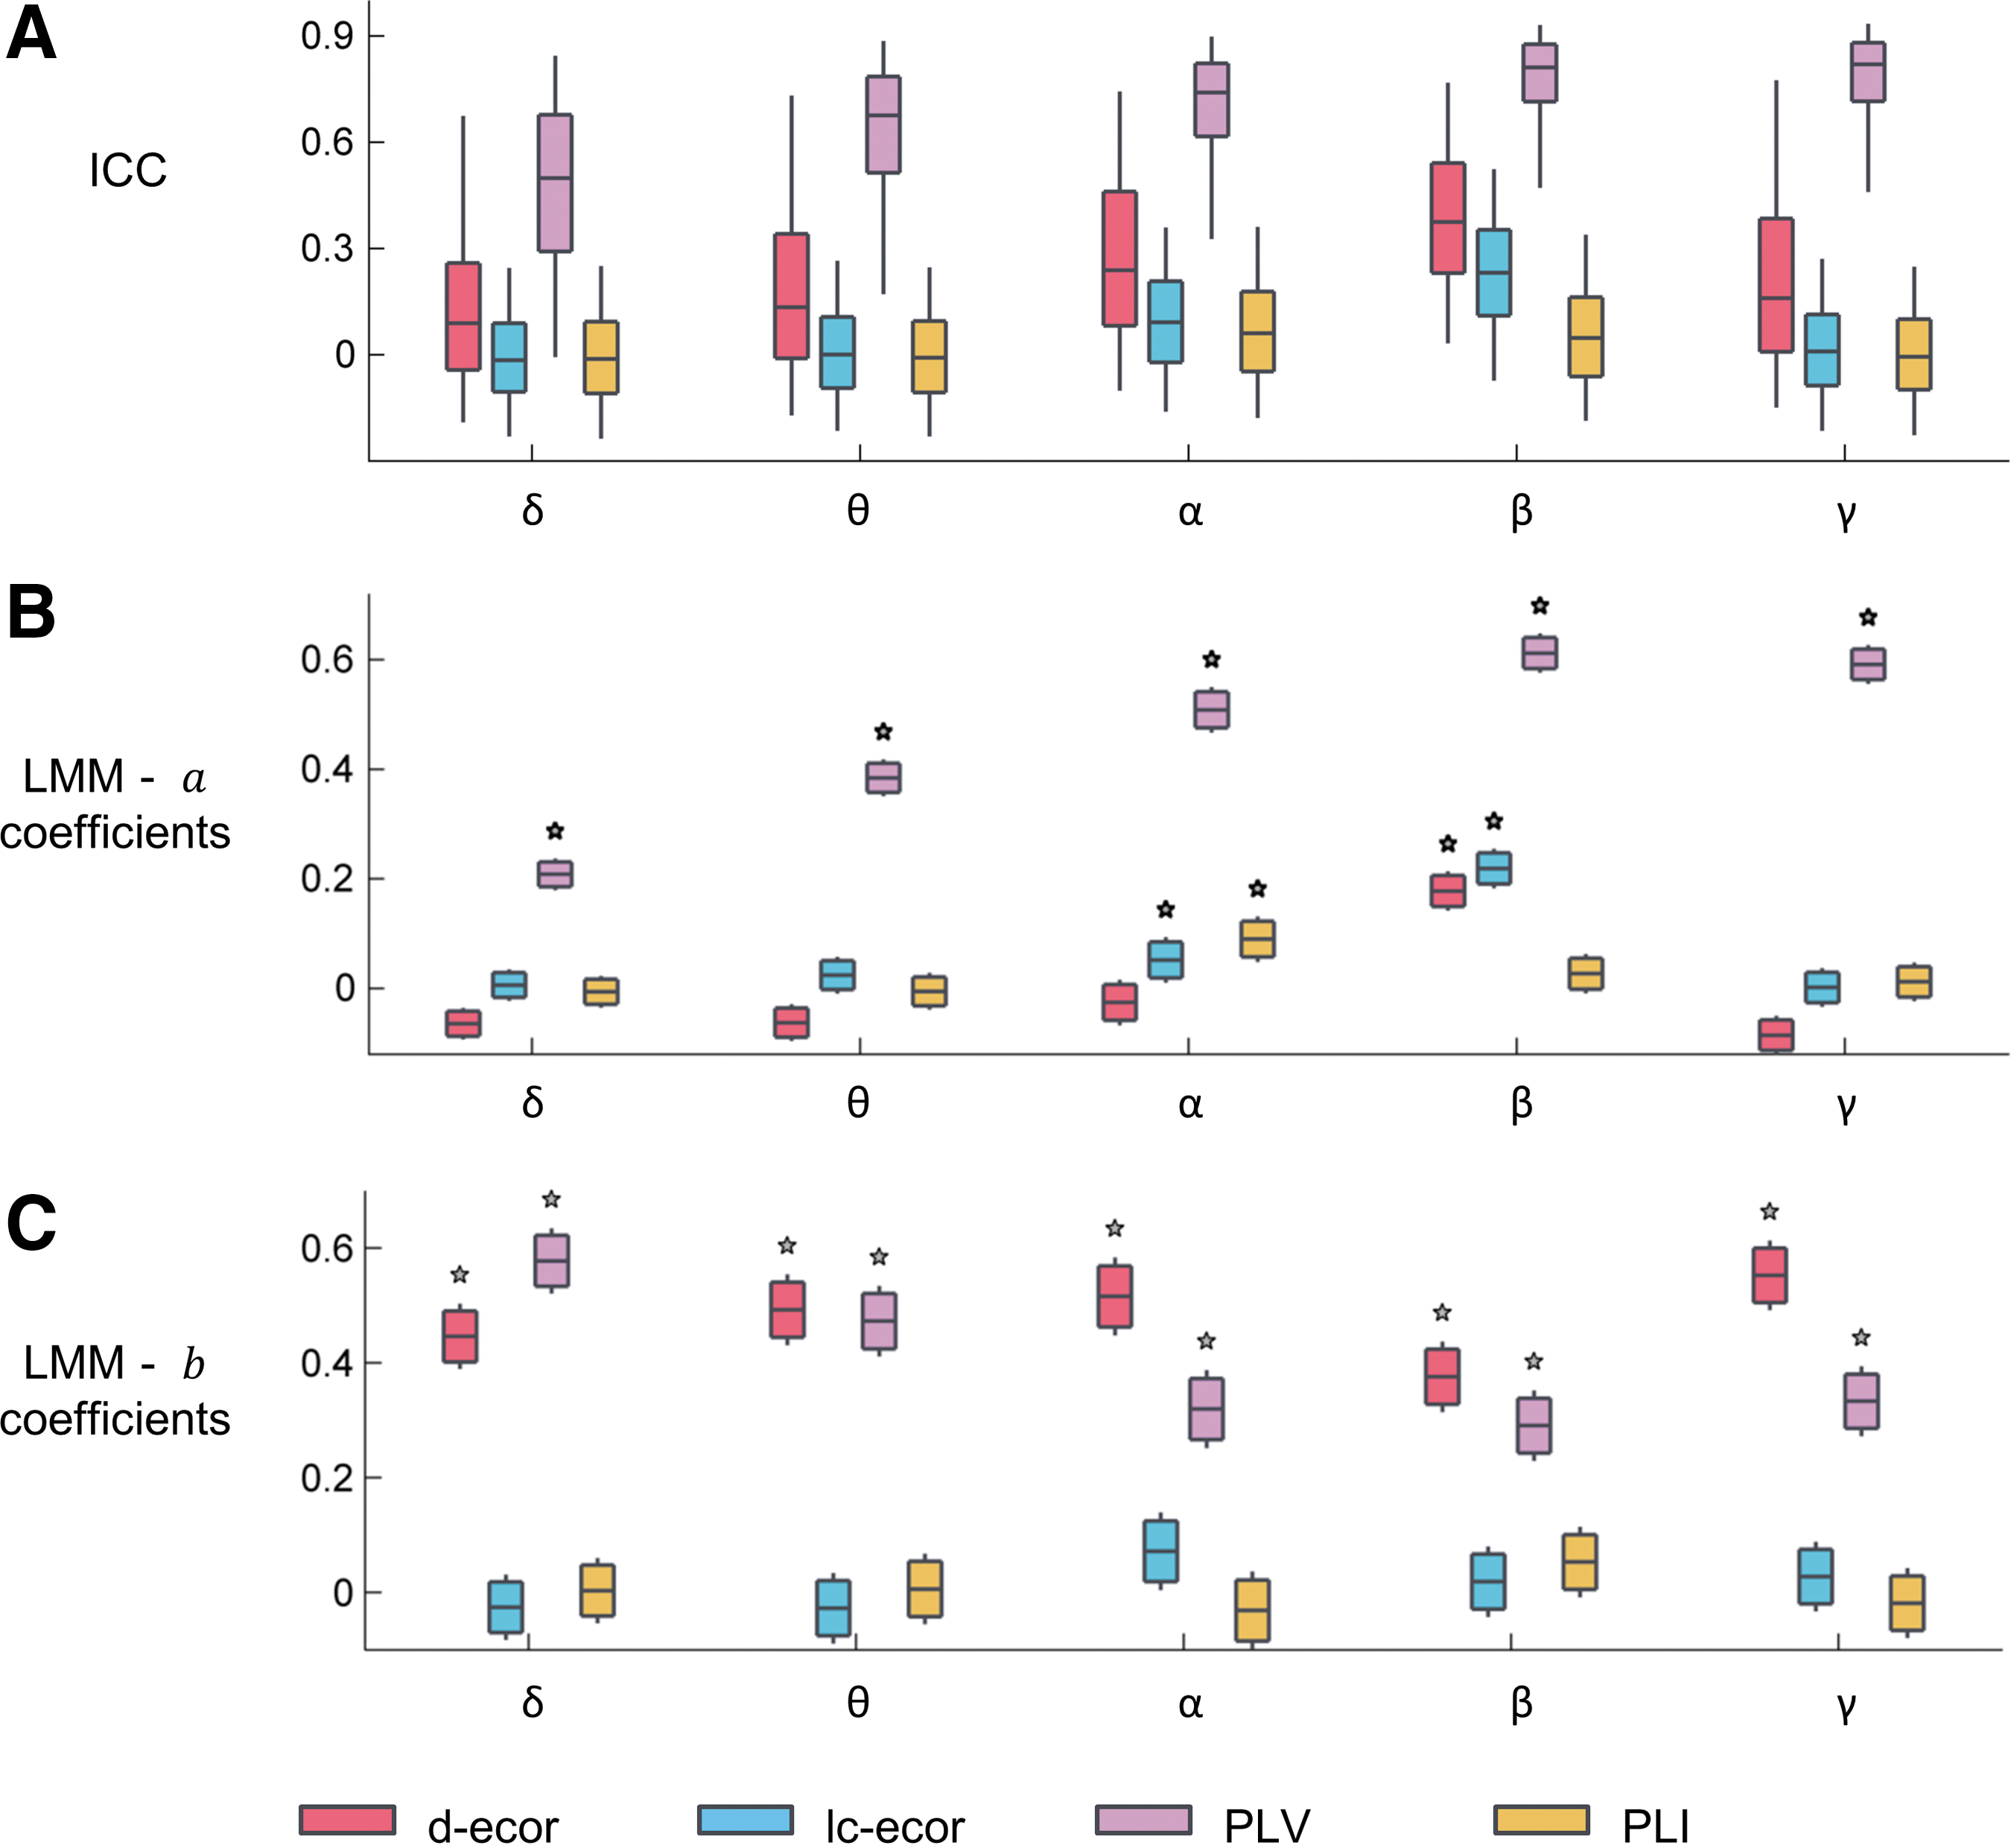
The distribution of ICCFC values, which quantify the test-retest reliability of eyes closed resting-state FC, is represented in Figure 1A. ICCFC was greatly dependent both on the FC metric and the frequency band. Highest values were reached for the PLV in alpha, beta, and gamma bands (averages 0.74–0.82). For d-ecor and lc-ecor, ICC values were generally smaller, and peaked in the beta band (average 0.23–0.37). For PLI, average ICC was lower (<0.1) for all frequency bands. The same effects across frequency bands and FC metric were obtained for the eyes open condition: results are displayed in Supplementary Figure S1 (Supplementary Data are available online at
Distribution of ICC values for whole-brain FC during resting-state eyes closed.
BWC effect
The contribution of BWC to the previously described ICCFC was explored by introducing both ICCFC and ICCBWC in an LMM, as detailed in the Reliability of whole-brain FC section. The 99% confidence intervals of the LMM coefficients are displayed in Figure 1B and C. On the one hand, the a coefficients, which weigh ICCBWC-unrelated fixed effects on ICCFC, were significantly greater than zero (p < 0.01, Bonferroni corrected) for PLV for all frequency bands, lc-ecor in alpha and beta, d-ecor in beta, and PLI in alpha. On the other hand, the b coefficients, which weigh the contribution of ICCBWC to ICCFC, were significantly greater than zero (p < 0.01, Bonferroni corrected) for d-ecor and PLV for all frequency bands, while there were close to zero for leakage-corrected FC metrics (PLI and d-ecor).
Reliability was, however, unevenly distributed across links. Figure 2 represents the 5% of links with highest
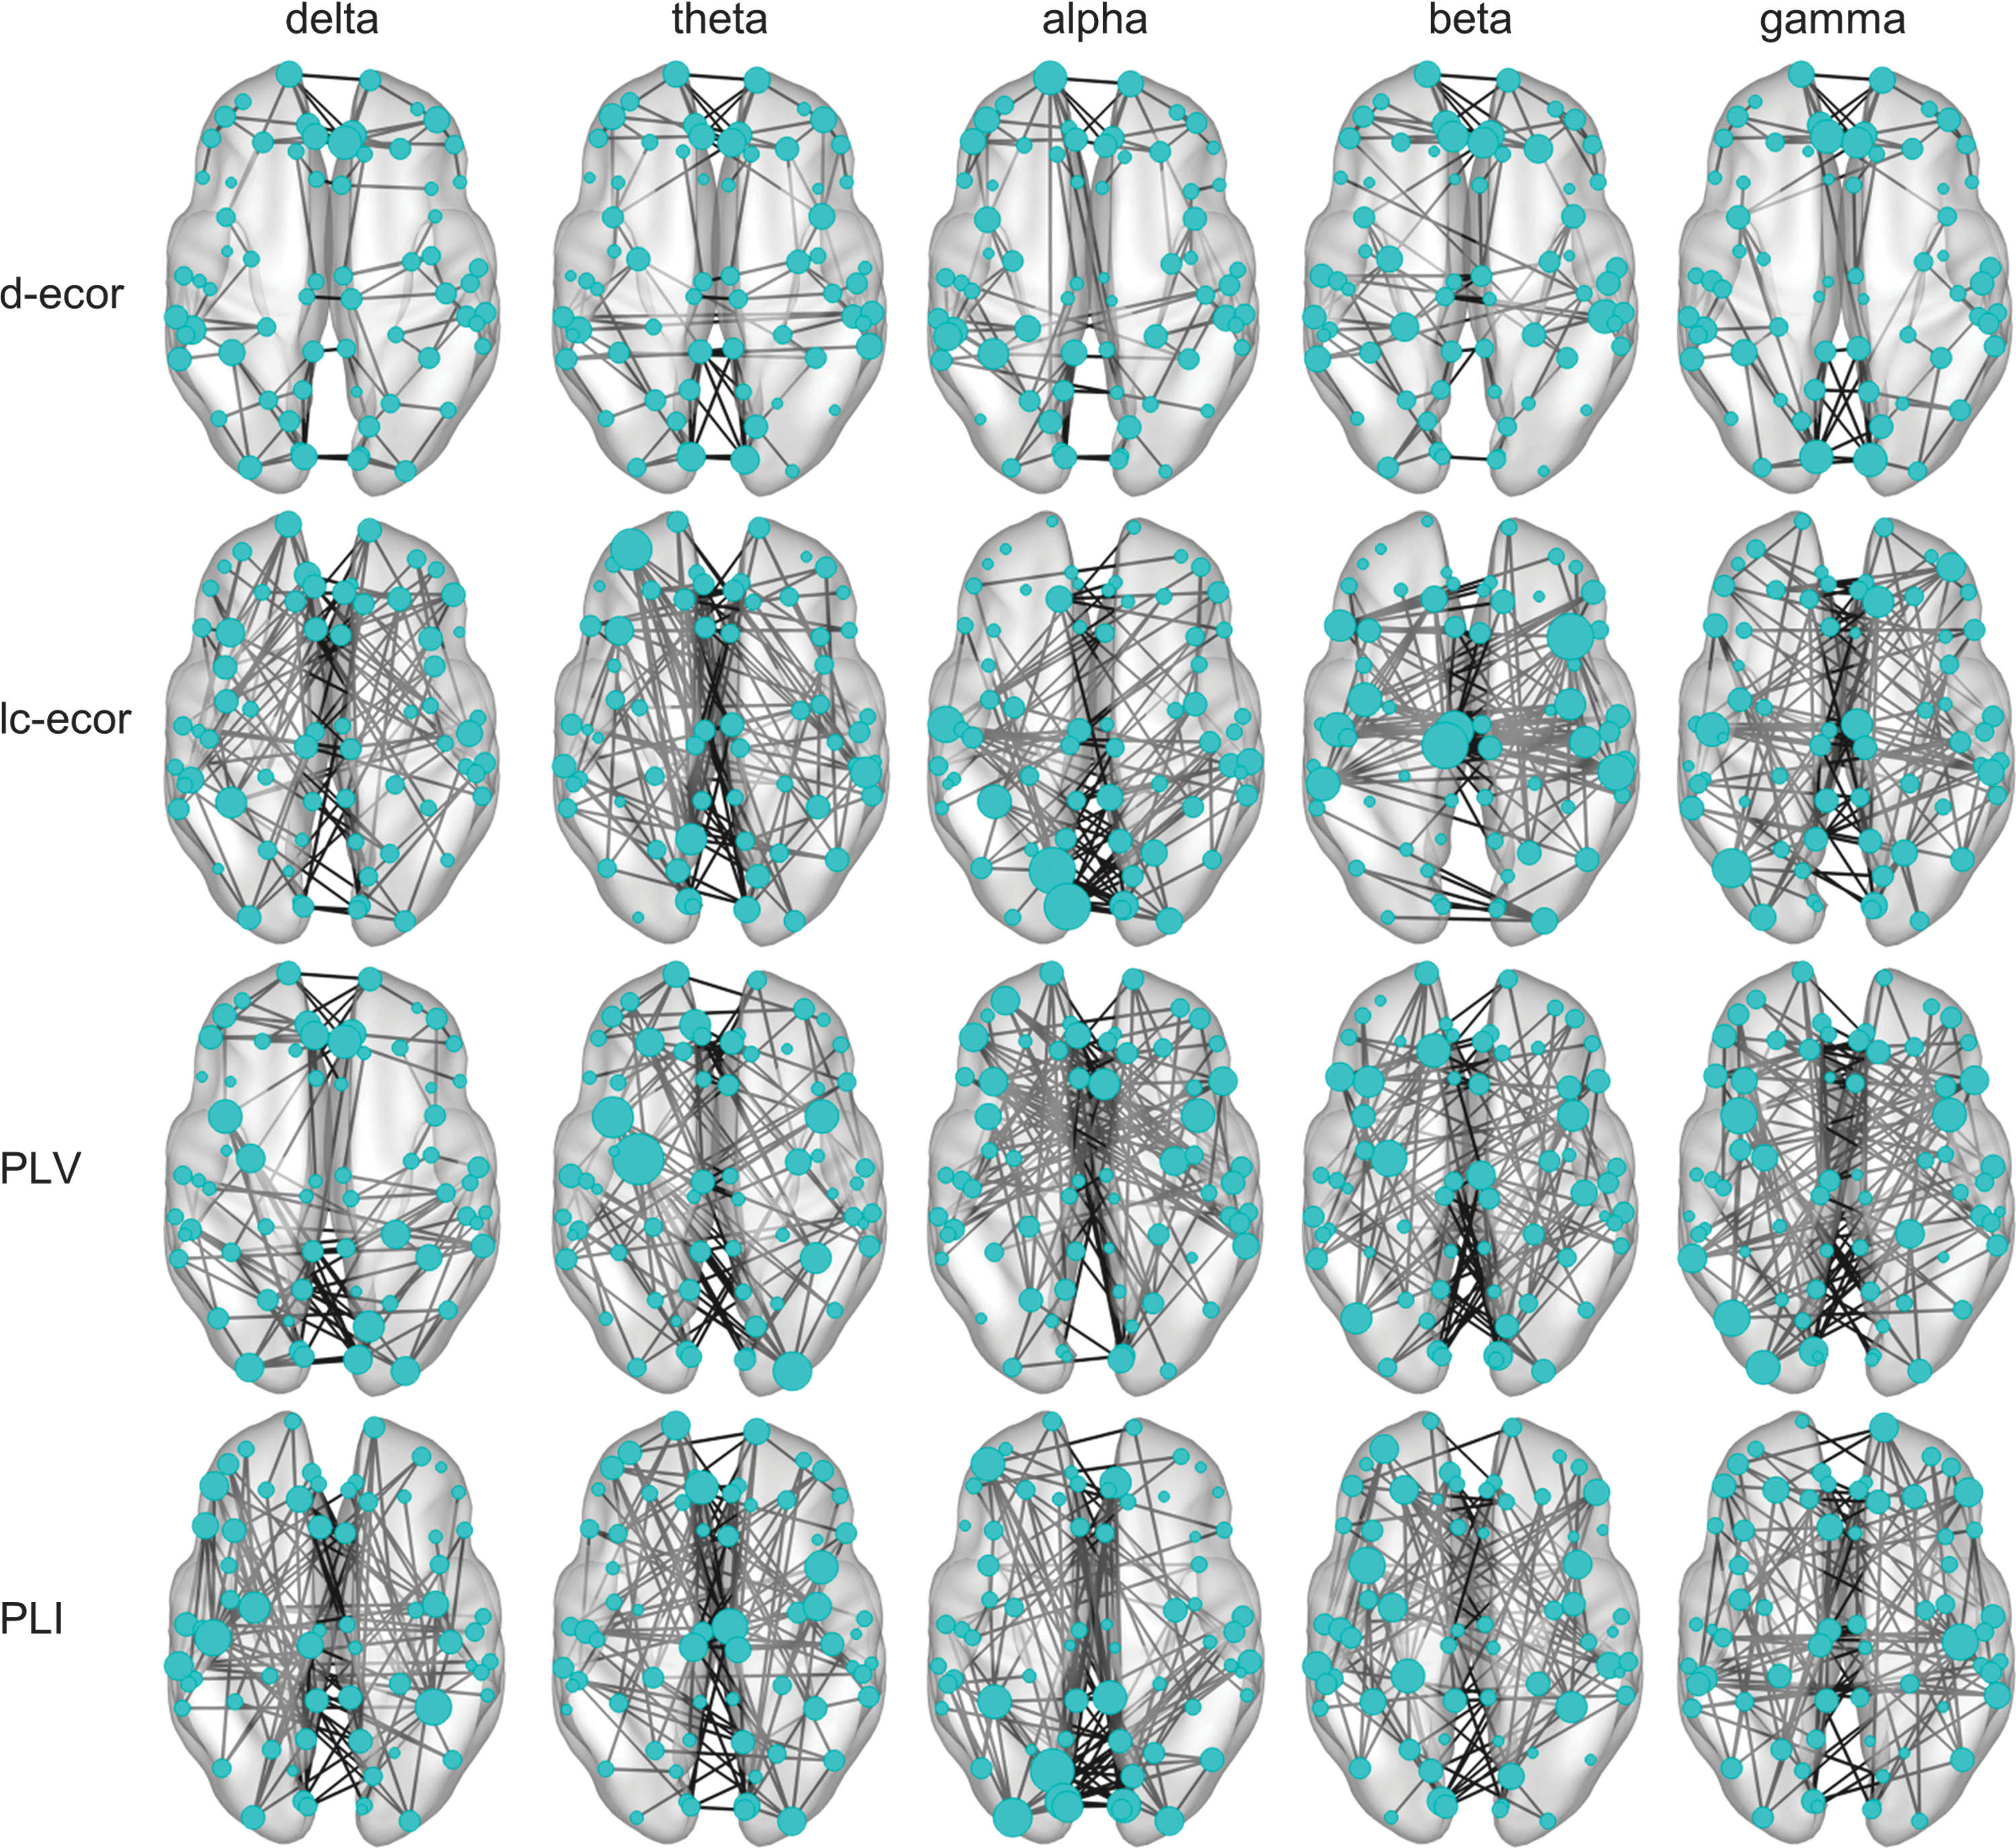
Spatial distribution of links with highest (ICCFC − b·ICCBWC). For each FC metric and frequency bands, the 5% links with highest (ICCFC − b·ICCBWC) are represented on a template brain, viewed from the top (frontal regions up, posterior regions down). For better visualization, the template brain surface was inflated with Caret software (Van Essen et al., 2001). BWC, beamformer weight correlation. Color images available online at
Dependence between ICC and FC strength
The dependence between ICC and FC was investigated with Spearman correlations. The results are listed in Table 2. ICC and FC were positively correlated, especially for d-ecor and PLV (r = 0.50–0.78). Correlations for lc-ecor and PLI were significant in alpha and beta bands (r = 0.14–0.46), and smaller (ABS|r| < 0.08) in delta, theta and gamma. When computing partial correlation between ICC and FC, while controlling for ICCBWC, correlation coefficients for d-ecor and PLV were much smaller, although remained significant for all frequency bands (r = 0.29–0.57). On the other hand, for lc-ecor and PLI, as expected, correlation coefficients between ICCFC and FC remained unchanged after controlling for ICCBWC.
In the left side, the Spearman correlation coefficients between ICC and FC across links are listed, for all FC metrics and frequency bands separately, for the resting-state eyes closed condition. In the right side, Spearman partial correlation coefficients between ICCFC and FC, controlling for BWC ICC are listed. Asterisks denote significant correlations (Bonferoni corrected, p < 0.01).
BWC, beamformer weight correlation; FC, functional connectivity; ICC, intraclass correlation coefficient; PLI, phase lag index; PLV, phase locking value.
Within- and between-subject agreement in whole-brain FC maps
The within- and between-subject agreement of FC maps was computed with Kendall's W from pairwise maps of a single and distinct subjects. The distribution of W values for every frequency band and FC metric is displayed in Figure 3. First, highest within- and between-subject average W was found for PLV (0.59–0.98). Moreover, within-subject W was significantly higher than between-subject W for PLV (20% increment on average), and this difference was higher for high-frequency bands (22% increment in beta and gamma vs. 16% in delta). Second, high average W values (0.56–0.82) were also found for d-ecor, and within-subject W was higher than between-subject W for all frequency bands (8.4% on average). Third, for lc-ecor, within- and between-subject W were generally smaller (0.42–0.63) and similar, although for the beta band, a higher W (0.42–0.79) was obtained, and within-subject W significantly exceeded between-subject W. Fourth, for PLI both between- and within-subject W values were smaller (0.48–0.60), and within-subject W was significantly greater than between-subject W for alpha and beta bands.
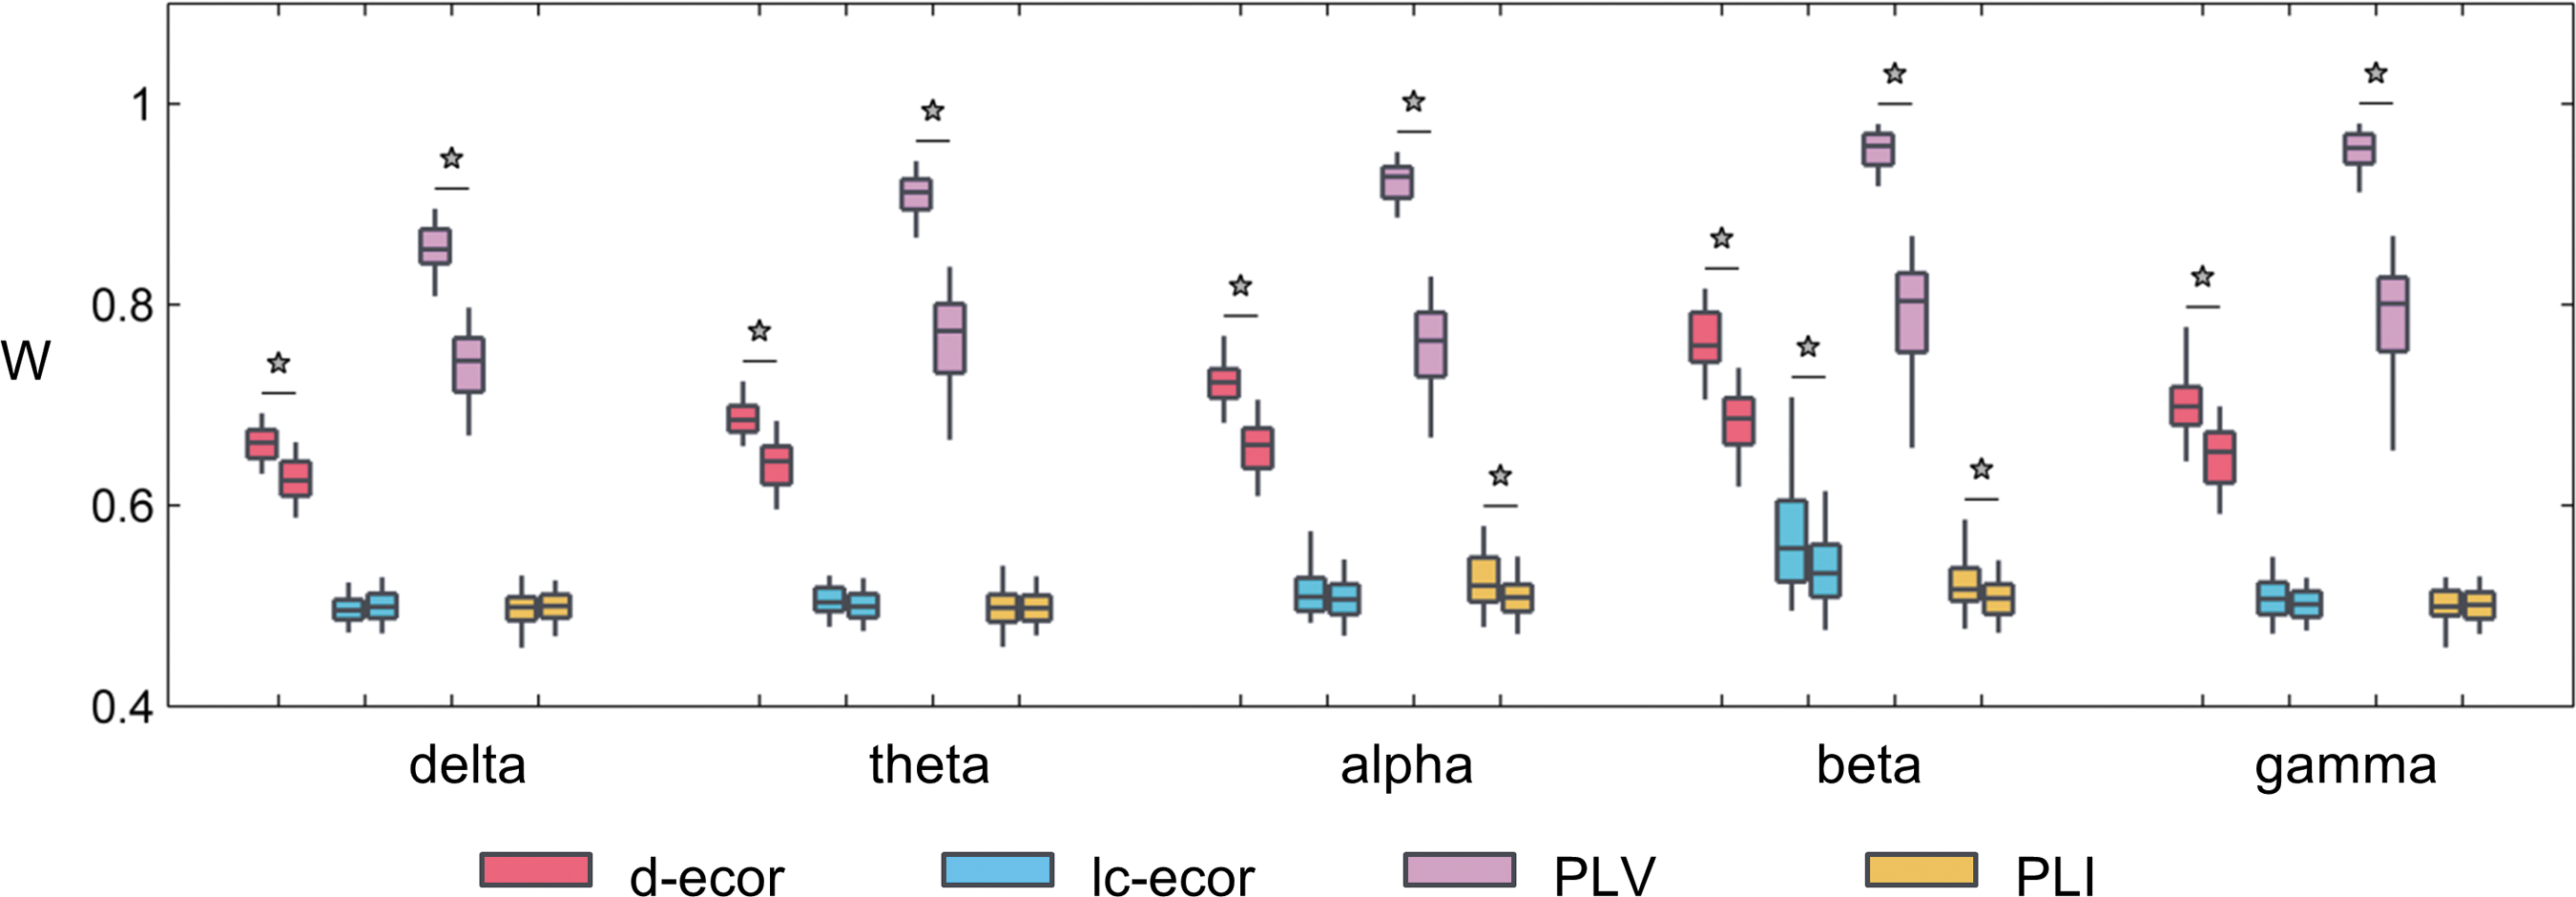
Distribution of within- and between-subject agreement of FC maps. Each pair of same-color boxplots represents the within- (left) and between-subject (right) agreement for given a frequency band and FC metric, for the resting-state eyes closed condition. Stars indicate significantly higher within- than between-subject agreement (Wilcoxon rank sum test, p < 0.01, Bonferroni corrected). Color images available online at
Reliability of RSNs
Within-network reliability
By exploring the test-retest reliability of whole-brain FC in the Reliability of Whole-Brain FC Maps section, it was found that ICC values have a great spatial variability and some of the links with higher test-retest reliability bear some similarity with the RSNs described in the literature. The test-retest reliability of seven RSNs was therefore explored. First, the reliability of the FC of links connecting nodes of the same RSN was assessed with the ICC. Results are listed in Table 3. ICC values were dependent both on the FC metric and frequency band. For all RSNs, highest ICC values were found for PLV, usually ranging from 0.7 to 0.9 in alpha, beta, and gamma bands and smaller values from 0.4 to 0.7 in delta and theta bands. High ICC values (>0.7) were, however, also found in delta and theta bands for the sensorimotor and visual networks. d-ecor and lc-ecor presented greater variability across frequency bands than PLV. The ICC of both FC metrics topped in the beta band (ICC = 0.46–0.78 for d-ecor and ICC = 0.43–0.66 for lc-ecor), while low to medium ICC (<0.5) was found for delta, theta, and gamma bands. Although ICC was rather low in the alpha band, high values (>0.6) were found with d-ecor in the visual and sensorimotor networks. With PLV and envelope correlation metrics, higher ICC values were found for the sensory networks (especially sensorimotor and visual), than for DMN, FP, and frontoinsular networks. Finally, ICC values were medium to low for the PLI in all frequency bands and networks and did not exceed 0.44.
ICC values were computed for every frequency band, FC metric, and RSN separately. For RSNs with more than two nodes (DMN and frontoinsular), the average ICC across links within the network is listed.
RSNs, resting-state networks.
Reliability of seed-based FC maps
FC was computed from each seed to the remaining source location for each condition, frequency band, and FC metric separately. Then, the ICC of the FC values was computed for each link. The distributions of ICC values over all seed locations are displayed in Supplementary Figure S2. These ICC values were lower than the corresponding within-network ones for most seeds for PLV and d-ecor across frequency bands, lc-ecor in alpha, and beta and PLI in alpha indicating greater within- than between-network reliability. Moreover, the variability over frequency bands and FC metrics was similar than in the within-network analysis. First, highest values (ICC >0.6) were found for PLV, especially in alpha, beta, and gamma bands for all seed locations, although slightly higher ICC was found for sensory seeds and precuneus. Second, ICC values for d-ecor and lc-ecor were small for delta, theta, and gamma bands (third quartile <0.3), but higher values were obtained for alpha and especially beta bands (ICC 0.3–0.6). ICC values also varied somewhat across seeds, and were higher in the beta band in sensorimotor and left middle frontal seeds with lc-ecor and in the alpha band in the sensory and precuneus seeds for both lc-ecor and d-ecor. Third, ICC was poor for PLI (third quartile <0.2).
ICC values were unevenly distributed across brain regions. As an example, beta band ICC and average FC maps for three selected seeds are displayed for lc-ecor in Figure 5 and PLV in Figure 4 (corresponding figures for d-ecor and PLI can be found in the Supplementary Figures S3 and S4). Average FC was generally higher between regions belonging to the same network. For instance, seeds in sensory networks (visual, somatosensory, and auditory cortices) were strongly connected to their homologous contralateral areas. This was less evident for DMN, FP, and frontoinsular networks. ICC maps resembled average FC maps, showing high ICC for links between homologous sensory areas. DMN and FP networks presented lower ICC than sensory networks for all FC metrics. Moreover, FC increased along with ICC values for d-ecor, lc-ecor, and PLV, as revealed by the joint distribution of both magnitudes. This relation was, however, not linear, especially for FC metrics without zero-lag correction (PLV and d-ecor), for which the ICC increased first rapidly along with FC values and then saturated for medium to high FC (Fig. 5 and Supplementary Fig. S3).
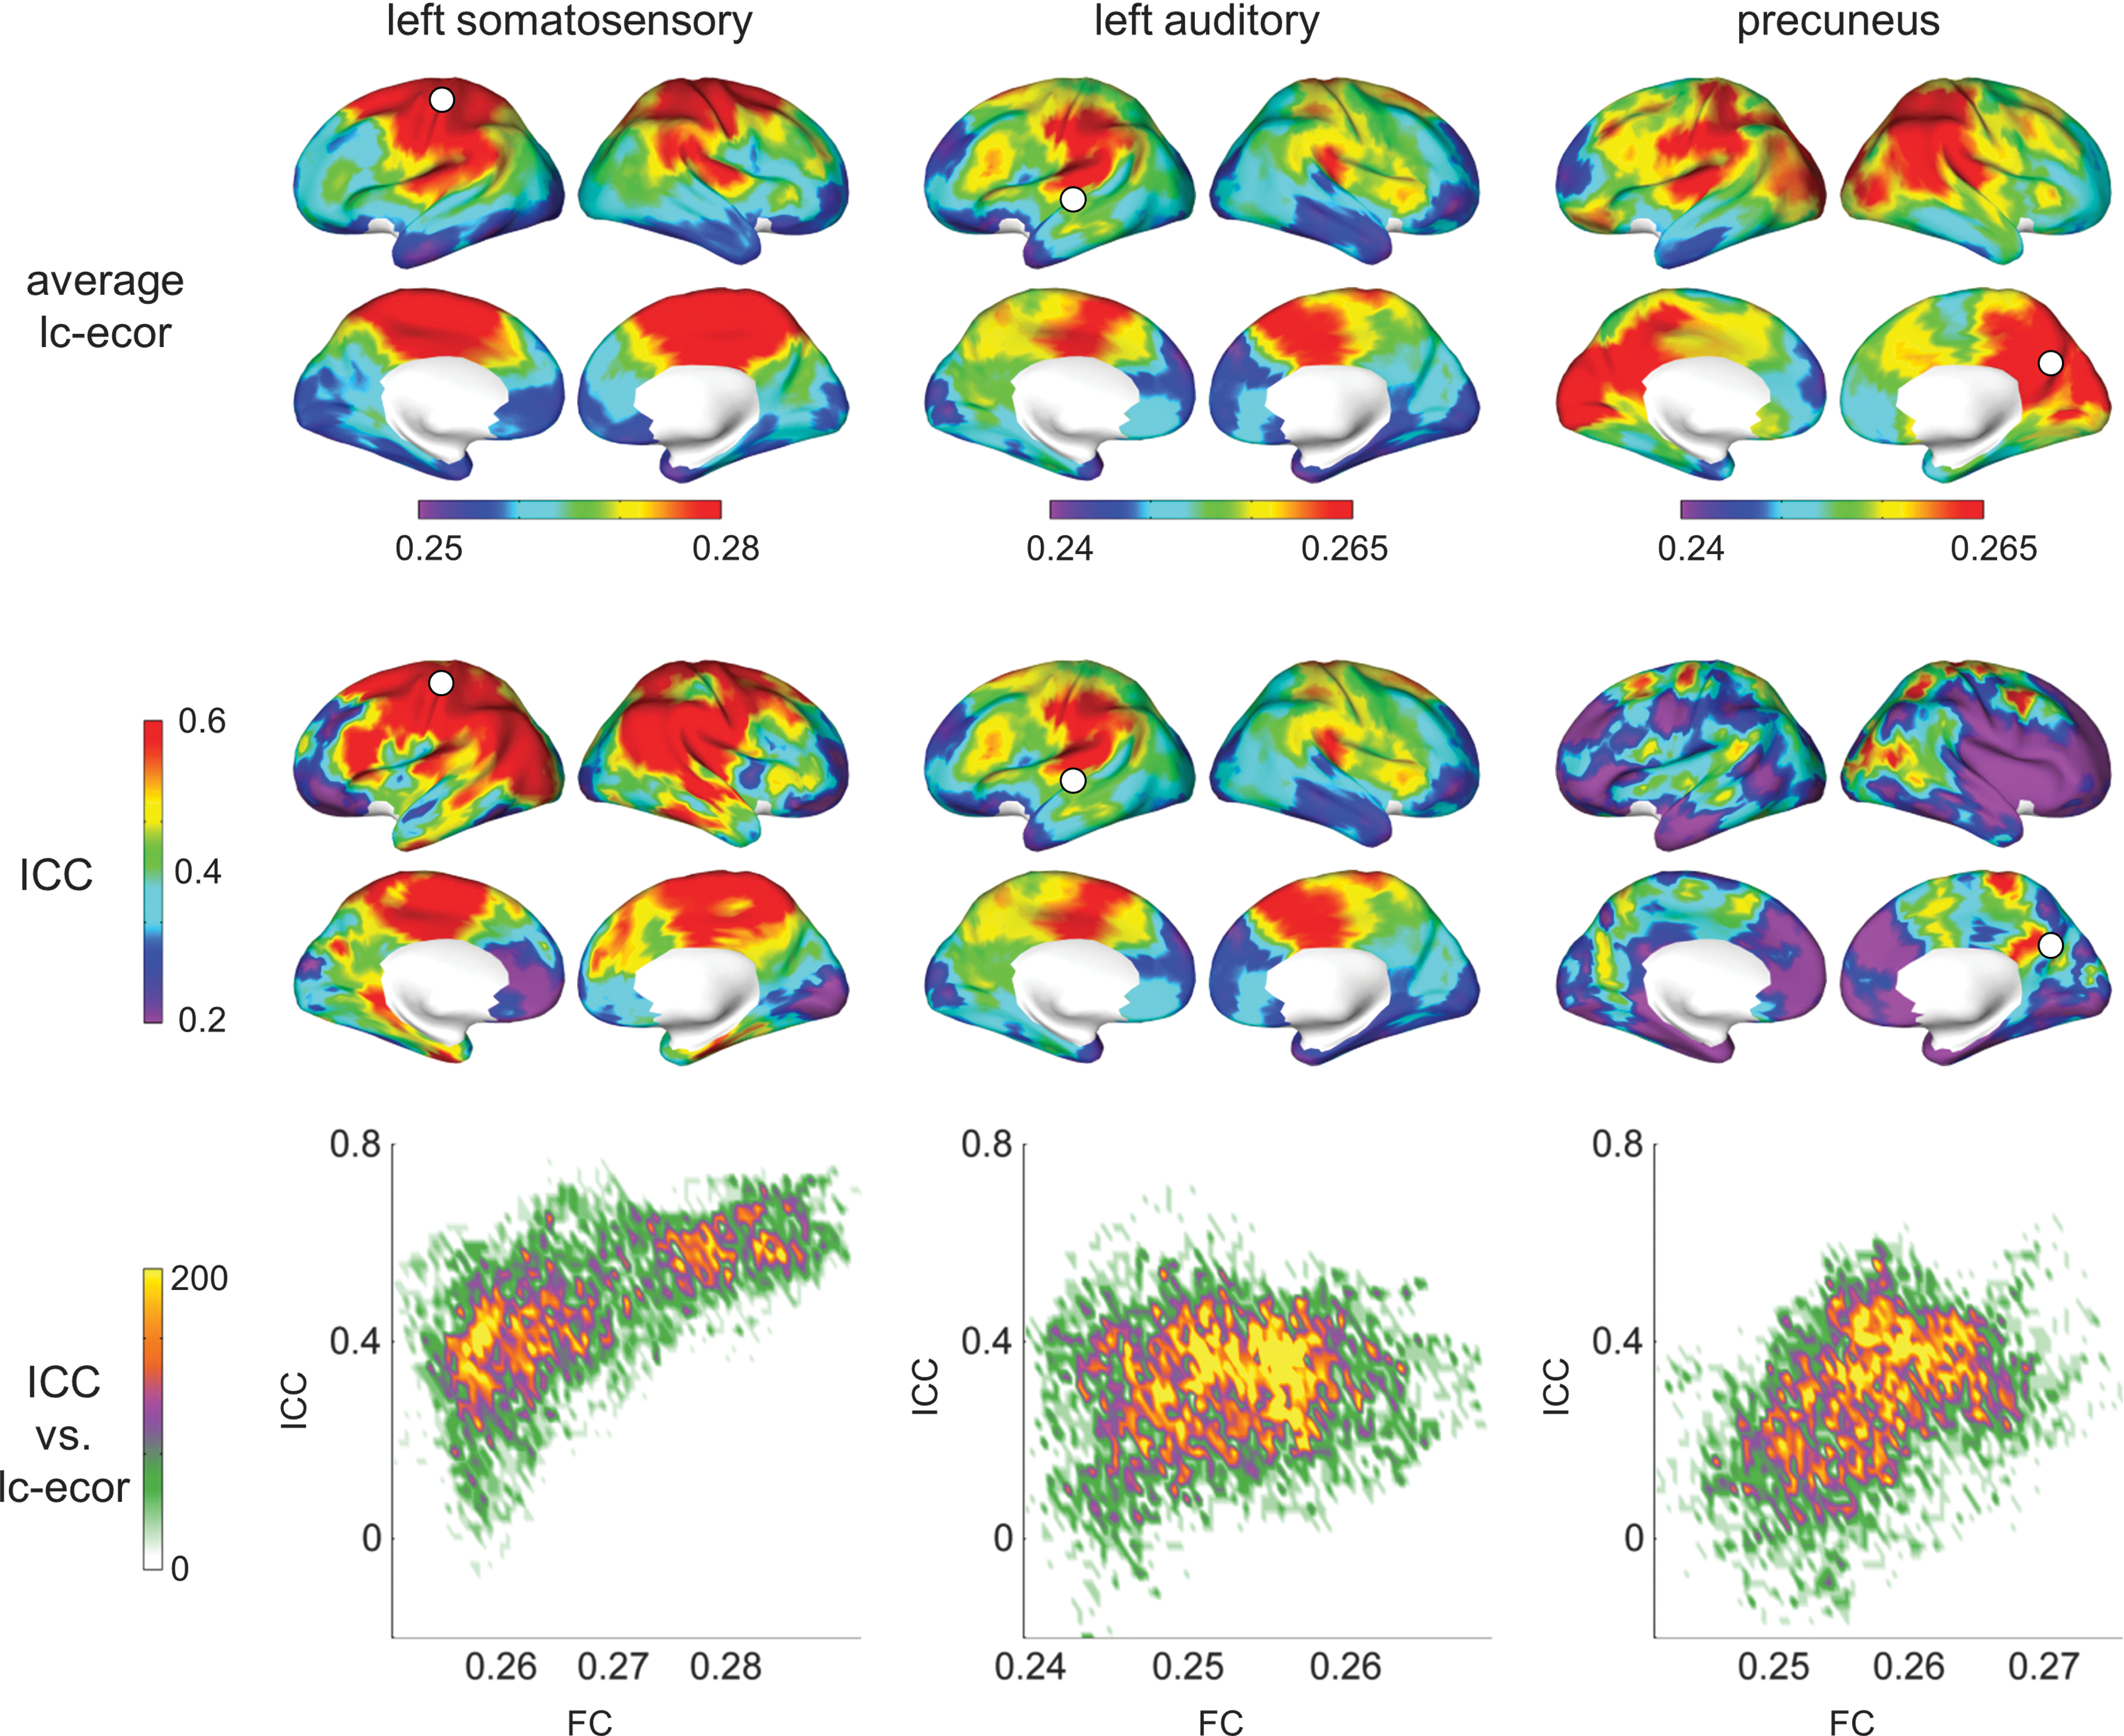
FC and ICC for beta band resting-state eyes closed and lc-ecor. For three selected seeds (left primary somatosensory, left primary auditory, and precuneus), average FC maps (first row), ICC (second row), and the normalized joint histogram of ICC and FC values (third row) are displayed. FC maps are averaged over all sessions and subjects. The seed location is indicated with a white circle. Color images available online at

FC and ICC for beta band resting-state eyes closed and PLV. For three selected seeds (left primary somatosensory, left primary auditory, and precuneus), average FC maps (first row), ICC (second row), and the normalized joint histogram of ICC and FC values (third row) are displayed. FC maps are averaged over all sessions and subjects. The seed location is indicated with a white circle. PLV, phase locking value. Color images available online at
Discussion
In this work, we assessed the test-retest reliability of resting-state FC by exploring within- and between-subject variability of FC values in a cohort of 16 subjects. Following previous resting-state MEG literature (Brookes et al., 2011b; Hillebrand et al., 2005; Schoffelen and Gross, 2009), source time series were estimated with beamforming. Then, source space FC was computed between source locations using four distinct FC metrics: d-ecor, lc-ecor, PLV, and PLI. Within- and between-subject variability was employed to assess both reliability (with the ICC) and agreement (with Kendall's W) of the FC maps. First, overall trends over FC metrics and frequency bands were inspected for whole-brain connections, exploring all links connecting 66 cortical ROIs. Average ICCFC was highest in the PLV in alpha, beta, and gamma bands (0.74–0.82), medium for d-ecor and lc-ecor in the beta band (average 0.23–0.37), and considerably low (<0.1) for PLI across frequency bands. An LMM, including ICCBWC revealed that volume conduction, indirectly assessed through BWC, could be contributing to high test-retest reliability in PLV and d-ecor. When accounting for this effect, the overall test-retest reliability of whole-brain FC was found to be significant for PLV for all frequency bands, lc-ecor in alpha and beta, d-ecor in beta, and PLI in alpha. When evaluating within- and between-subject agreement separately with Kendall's coefficient of concordance W, medium to high values were obtained (0.5–0.97), depending on the frequency band and the FC metric. W was highest with PLV and lowest with lc-ecor. In addition, within-subject W was significantly higher than between-subject FC for d-ecor and PLV throughout frequency bands, PLI in alpha and beta, and lc-ecor in beta.
In addition, FC metric and frequency band were not the only important factors influencing test-retest reliability. Instead, the FC test-retest reliability was highly dependent on the specific link considered. First, ICCFC correlated positively with the FC strength, especially in alpha and beta bands. Second, when focusing on well-known RSNs, within-network connections were particularly reliable. Within each network, similar FC metrics and frequency band trends were found than for whole-brain FC: highest values found for PLV in alpha, beta, and gamma bands and for d-ecor and lc-ecor in beta band.
To our knowledge, this constitutes the first test-retest reliability study of MEG source space FC. Test-retest reliability of FC has, however, already been explored with both sensor space MEG/EEG and fMRI. Deuker et al. (2009) and Jin et al. (2011) employed the ICC to estimate the reliability of resting-state graph metrics derived from MEG sensor space mutual information. In the first study, Deuker et al. (2009) obtained high ICC (0.5–0.8) for strength, clustering, minimum path length, synchronizability, global efficiency, cost efficiency, and small world index in alpha band, and low to medium ICC (0–0.5) in other frequency bands. Interestingly, the ICC of these graph metrics during a working memory task was found to be higher than during resting state. In the latter study, Jin et al. (2011) found medium ICC (0.4–0.65) for nodal efficiency, nodal degree, and betweeness centrality in alpha and beta bands and lower ICC for theta and gamma bands. Using EEG and sensor space PLI, Hardmeier et al. (2014) obtained good reliability (ICC range: 0.5–0.8) for clustering coefficient, average path length, and small-world index in theta, alpha, and beta bands. Test-retest studies of sensor space graph metrics have therefore obtained divergent results, although they cannot be easily compared because of differences in the processing methodology, the choice of FC metric, and the test-retest interval. Using resting-state fMRI, Shehzad et al. (2009) could directly inspect the test-retest reliability of RSNs by computing FC between ROIs selected from the fMRI literature. They overall obtained low reliability (average ICC = 0.10–0.40), although higher ICC was found when considering significant correlations exclusively. This is in agreement with our results and suggests that stronger connections are more reliable. Although not focusing on reliability, Wens et al. (2014) studied short-term within-subject variability in MEG FC with four subjects who underwent 20 scan sessions in a single day. After selecting three seeds in visual, auditory, and sensorimotor cortices, they evaluated the spatial similarity between FC maps. They finally recommended between 2 and 11 sessions to produce a robust subject average, depending on the network. Moreover, in line with our work, they obtained that the sensorimotor network presented the highest within-subject similarity and hence required the least sessions to produce good subject-representative average FC maps.
An interesting result in our work is the frequency specificity of the reliability of RSNs. With PLV, RSNs reached medium to good reliability for all frequency bands, but highest ICC values were consistently found in alpha, beta, and gamma bands. In the previously commented graph metric studies (Deuker et al., 2009; Hardmeier et al., 2014; Jin et al., 2011), reliability was generally highest for alpha, reasonably good for theta and beta, and quite low for gamma. Although we cannot establish any direct analogy between our approach and sensor space graph metrics, given that high frequency oscillations are supposed to be more local than low-frequency oscillations (Buzsáki and Draguhn, 2004), we could speculate that we found higher gamma band reliability because gamma network properties are not well captured with sensor space FC. When using d-ecor and lc-ecor, reliability varied greatly among frequency bands and was higher in beta, followed by alpha. This finding is not particularly surprising, since MEG RSNs have been predominantly studied with envelope correlation in the alpha and beta bands. In fact, although the seminal work of (Brookes et al., 2011a,b; de Pasquale et al., 2010; Hipp et al., 2012) investigated RSNs with envelope correlation at several frequency bands, they concluded that most networks were best extracted in the beta band and alpha band in de Pasquale et al. (2010) and in Brookes et al. (2011b) for the DMN. In this study, we found that the test-retest reliability was quite high across networks for alpha and beta band with envelope correlation measures, although higher values were generally found in sensory networks and DMN.
In addition, we found that the choice of FC metric greatly influenced reliability. ICC was highest for PLV, medium for d-ecor and lc-ecor, and lowest for PLI, indicating that PLV estimates are the most reliable ones. The most striking difference was found between PLV and PLI: PLV presented consistently higher test-retest reliability than PLI. This could be due to the fact that both metrics capture different aspects of phase synchronization: while PLV evaluates how much the distribution of phase differences between brain oscillations deviates from a uniform distribution, PLI quantifies asymmetries in the phase differences over
Finally, it is important to note that test-retest reliability does not evaluate the goodness of the measurement (in this case, FC estimation). The test-retest reliability is instead a relative quantity, which depends on within- and between-subject variability. Any within-subject variability produces a reliability decrease, independent of the origin: instrumentation (e.g., MEG sensors deviating from their ideal working point), measurement situation (e.g., varying magnetic fields interfering in the MEG measurement, acoustic noise that could induce interfering brain activity in the subject) or the subject itself (true change in the coupling strength between two regions within a single individual). We can therefore not conclude that an FC estimate with low test-retest reliability (small ICC) contains a great amount of error or is inaccurate: it could as well be possible that it captures a true within-subject change. In this line, higher within-subject agreement in FC maps does not necessarily imply that FC is more stable within individuals: it could as well be due to volume conduction bias in the FC metric. Reliability relates instead on how well subjects can be distinguished in a given group. It is therefore indicative of whether FC estimates can be employed to characterize individual subjects within the group sample. We should also indicate that reliability is a population-specific quantity: for a fixed within-subject variability, the more heterogeneous the subject sample, the higher the reliability.
Conclusions
In conclusion, we provided the first source space test-retest reliability report of MEG resting-state FC. We computed both whole-brain FC between 66 ROIs and seed-based FC (focusing on RSNs nodes) using four commonly employed FC metrics: d-ecor, lc-ecor, PLV, and PLI. We then evaluated the test-retest reliability of the FC estimates with the ICC, and the within- and between-subject agreement of the FC maps with Kendall's W. ICC values were greatly dependent on the FC metric, the frequency band, and the source locations. Overall, highest ICC values were obtained for PLV, even reaching 0.8 or higher for broad regions, especially in alpha, beta, and gamma bands.
Footnotes
Acknowledgments
The authors are grateful to the research participants for their participation in this study. Research by P.G. has been supported by a PICATA predoctoral contract of the Moncloa Campus of International Excellence (UCM–UPM).
Author Disclosure Statement
No competing financial interests exist.
References
Supplementary Material
Please find the following supplemental material available below.
For Open Access articles published under a Creative Commons License, all supplemental material carries the same license as the article it is associated with.
For non-Open Access articles published, all supplemental material carries a non-exclusive license, and permission requests for re-use of supplemental material or any part of supplemental material shall be sent directly to the copyright owner as specified in the copyright notice associated with the article.