
Abstract
N1 component of auditory evoked potentials is extensively used to investigate the propagation and processing of auditory inputs. However, the substantial interindividual variability of N1 could be a possible confounding factor when comparing different individuals or groups. Therefore, identifying the neuronal mechanism and origin of the interindividual variability of N1 is crucial in basic research and clinical applications. This study is aimed to use simultaneously recorded electroencephalography (EEG) and functional magnetic resonance imaging (fMRI) data to investigate the coupling between N1 and spontaneous functional connectivity (FC). EEG and fMRI data were simultaneously collected from a group of healthy individuals during a pure-tone listening task. Spontaneous FC was estimated from spontaneous blood oxygenation level-dependent (BOLD) signals that were isolated by regressing out task evoked BOLD signals from raw BOLD signals and then was correlated to N1 magnitude across individuals. It was observed that spontaneous FC between bilateral Heschl's gyrus was significantly and positively correlated with N1 magnitude across individuals (Spearman's R = 0.829, p < 0.001). The specificity of this observation was further confirmed by two whole-brain voxelwise analyses (voxel-mirrored homotopic connectivity analysis and seed-based connectivity analysis). These results enriched our understanding of the functional significance of the coupling between event-related brain responses and spontaneous brain connectivity, and hold the potential to increase the applicability of brain responses as a probe to the mechanism underlying pathophysiological conditions.
Introduction
A
It is well known that N1 component in AEPs has substantial interindividual variability (Liem et al., 2012). That is, being evoked by auditory stimuli with identical sensory perception, the magnitude of N1 varies greatly among individuals. Identifying the mechanisms and origins of this interindividual variability is crucial, since the relevant knowledge will help in ruling out possible confounding factors when comparing N1 between different individuals or groups (Boatman et al., 2008).
The interindividual variability of N1 has been related to brain structure (Liem et al., 2012), demographic characteristics, such as age (Anderer et al., 1998), sociocultural factors, such as musical training (Baumann et al., 2008), and neurological disorders, such as schizophrenia (Rosburg et al., 2008). However, the mechanism underlying N1 variability is still poorly understood. Even within the relationships mentioned earlier, experimental results were not consistently reported. For example, while larger N1 for elderly was reported in Anderer et al., 1998; Herrmann et al., 2013; and Rufener et al., 2014, lower N1 was reported in Papanicolaou et al., 1985, and Tremblay et al., 2004).
Importantly, functional connectivity (FC), that is, the inter-regional correlation of neural activity (Fox and Raichle, 2007), of spontaneous brain activities has been recently recognized as an important type of neural determinant of interindividual difference of event-related brain responses (Mennes et al., 2010). In this study, spontaneous brain activities refer to the neural activities not induced by any external tasks or stimulations (Fox and Raichle, 2007; Raichle, 2006). Based on this definition, we further define the FC measured on spontaneous brain activities as spontaneous FC (sFC) (Song et al., 2008). sFC has been shown to be able to predict an individual's brain responses evoked by a variety of sensory stimuli, such as visual stimuli, or cognitive tasks, such as those used for studying inhibition (Mennes et al., 2010; Tian et al., 2012).
Particularly, a recent EEG study (Kühnis et al., 2014) demonstrated that N1 magnitude was negatively correlated with the interhemispheric FC (as indexed by lagged phase synchronization at beta band) between bilateral Heschl's gyrus (HG), which is a region suggested to be the main generator of N1 (Liem et al., 2012; Reite et al., 1994). However, due to the limited spatial resolution of EEG and ill-posedness of the EEG source inverse problem, the localization of N1 sources (i.e., bilateral HG) and the reconstruction of source signals could be problematic (Wendel et al., 2009), and it still remains unknown whether N1-correlated sFC is specific to bilateral HG.
In this study, to overcome the intrinsic limitations of EEG in estimating sFC while retaining the possibility of acquiring N1 component, EEG and functional magnetic resonance imaging (fMRI) signals were simultaneously sampled from 19 healthy individuals during a pure-tone listening task. Compared with EEG, blood oxygenation level-dependent (BOLD) signal recorded using fMRI could provide a much higher spatial resolution and is more reliable for the estimation of sFC. Hence, simultaneous EEG-fMRI recording would allow us to assess the relationship between N1 magnitude and sFC in an accurate and comprehensive way.
We hypothesize that an individual's magnitude of AEP N1 is coupled with the fMRI-derived sFC between bilateral HG. Unlike most of previous studies where sFC was directly measured under resting-state condition, in the current study, we isolated spontaneous BOLD signals from the original signals recorded during task, and sFC was measured based on the isolated spontaneous BOLD signals. This FC analysis technique, usually referred to as task-regressed FC analysis, allows us to analyze spontaneous FC on event-related fMRI data, which is capturing increased interest in recent literature (Fair et al., 2007; Kucukboyaci et al., 2013). After sFC was estimated, we correlated sFC between bilateral HG with N1 magnitude across individuals. A strong positive coupling between N1 magnitude and sFC of bilateral HG was observed (Spearman's R = 0.829, p < 0.001). To avoid possible bias introduced by the analysis based on the preselected regions of interests (ROIs) (i.e., bilateral HG), two data-driven whole-brain voxelwise analyses, that is, voxel-mirrored homotopic connectivity (VMHC) analysis (Zuo et al., 2010) and seed-based analysis, were performed. These analyses confirmed that the observed N1-sFC coupling was specific to bilateral HG.
Materials and Methods
Participants
Nineteen healthy volunteers (11 males and 8 females) aged 21.1 ± 2.4 years (mean ± standard deviation [SD], range = 19–26 years) participated in this study. All volunteers provided their written informed consent. The Ethics Committee of the Faculty of Psychology, Southwest University, Chongqing, China, approved the experimental procedures, which were in accordance with the standards of the Declaration of Helsinki.
Stimulation and experimental design
Forty identical diotic auditory stimuli consisting of brief 800 Hz pure tones (500 ms duration, 5 ms rise and fall times, interstimulus interval: 16.5–22.5 sec) were delivered via pneumatic tubing to earphones inserted inside the acoustic canals. The earphones were mounted inside ear defenders, which could effectively reduce MRI acoustic noise. Individuals were asked to focus their attention on the stimulation with eyes open and relax their muscles. Individuals were instructed to move a slider to rate the intensity of loudness elicited by the auditory stimulus 9–12 sec after each stimulus, using an electronic 0–10 visual analog scale (VAS: the left anchor was “no sound” and the right anchor was “unbearable sound”). At the end of each trial, the slider automatically returned to the midpoint (VAS = 5). The rating operation ensures that the individuals were attending to the auditory stimuli during the experiment. To ensure high audibility of the auditory stimuli, the sound pressure level of auditory tones was individually determined before data collection such that a VAS of 6 out of 10 was obtained.
Data collection
EEG and fMRI data were simultaneously collected during the experiment. EEG was recorded using 32 Ag-AgCl electrodes (including the reference channel) placed on the head with an MR-compatible cap (pass-band: 0.01–100 Hz; sampling rate: 5000 Hz; reference: FCz; Brain Products GmbH, Munich, Germany) according to the international 10–20 system. All electrode impedances were kept below 10 kΩ.
Electrocardiographic signal was also recorded using an electrode attached to the individual's upper back to monitor ballistocardiographic (BCG) signals, which was used as a reference signal for BCG artifact removal.
Functional MRI data were acquired using a Siemens 3.0 Tesla Trio scanner with a standard head coil. A whole-brain gradient-echo, echo-planar-imaging sequence was used for functional scanning with a repetition time of 1500 ms (29 ms echo time, 25 5.0 mm-thick axial slices with 0.5 mm-thick interslice gaps, 3 × 3 mm in-plane resolution, field of view 192 × 192 mm, image matrix 64 × 64, flip angle 90°) over 330 volumes (8.25 min). A high-resolution T1-weighted structural image (1 mm3 isotropic voxel magnetization-prepared rapid acquisition with gradient echo) was acquired for anatomical registration after functional imaging.
EEG data preprocessing
MRI gradient artifacts were removed from EEG using the averaged artifact subtraction (AAS) method (Allen et al., 2000). The timings of heartbeat occurrence were estimated by detecting QRS complex from BCG signal through a combined adaptive thresholding algorithm (Niazy et al., 2005) automatically, and the result was checked by an experienced data analyst manually. The information of heartbeat timing was used to remove the BCG artifact through the AAS method. Continuous EEG data were band-pass filtered (1–30 Hz, FIR filter) and downsampled to 500 Hz.
EEG artifacts (including eye-blink artifacts and BCG artifacts) were further eliminated using the independent component analysis-based method in EEGLAB (Delorme and Makeig, 2004). Across all individuals, two to four components (mean ± SD: 3.1 ± 0.74) were removed for each individual, and the number of components rejected does not covary with the magnitude of N1 across individuals (Spearman's R = 0.150, p = 0.593).
EEG data were segmented into epochs (−1000 to 1000 ms), and epochs were baseline-corrected using the prestimulus interval (−500 to 0 ms). Finally, EEG epochs were re-referenced to a common average reference, and the epochs with a peak–peak magnitude exceeding 140 μV were discarded (mean ± SD: 1.87 ± 3.38). AEP waveform for each individual was obtained by averaging all remaining EEG epochs, and N1 magnitude was measured as the minimum of AEP waveform (75–125 ms) at Cz (Fig. 1). Individuals (n = 2) with a signal-to-noise ratio (SNR) of N1 smaller than three were discarded, where the SNR is defined as the ratio between N1 magnitude and the SD of AEP waveform within the prestimulus interval (Hu et al., 2010).
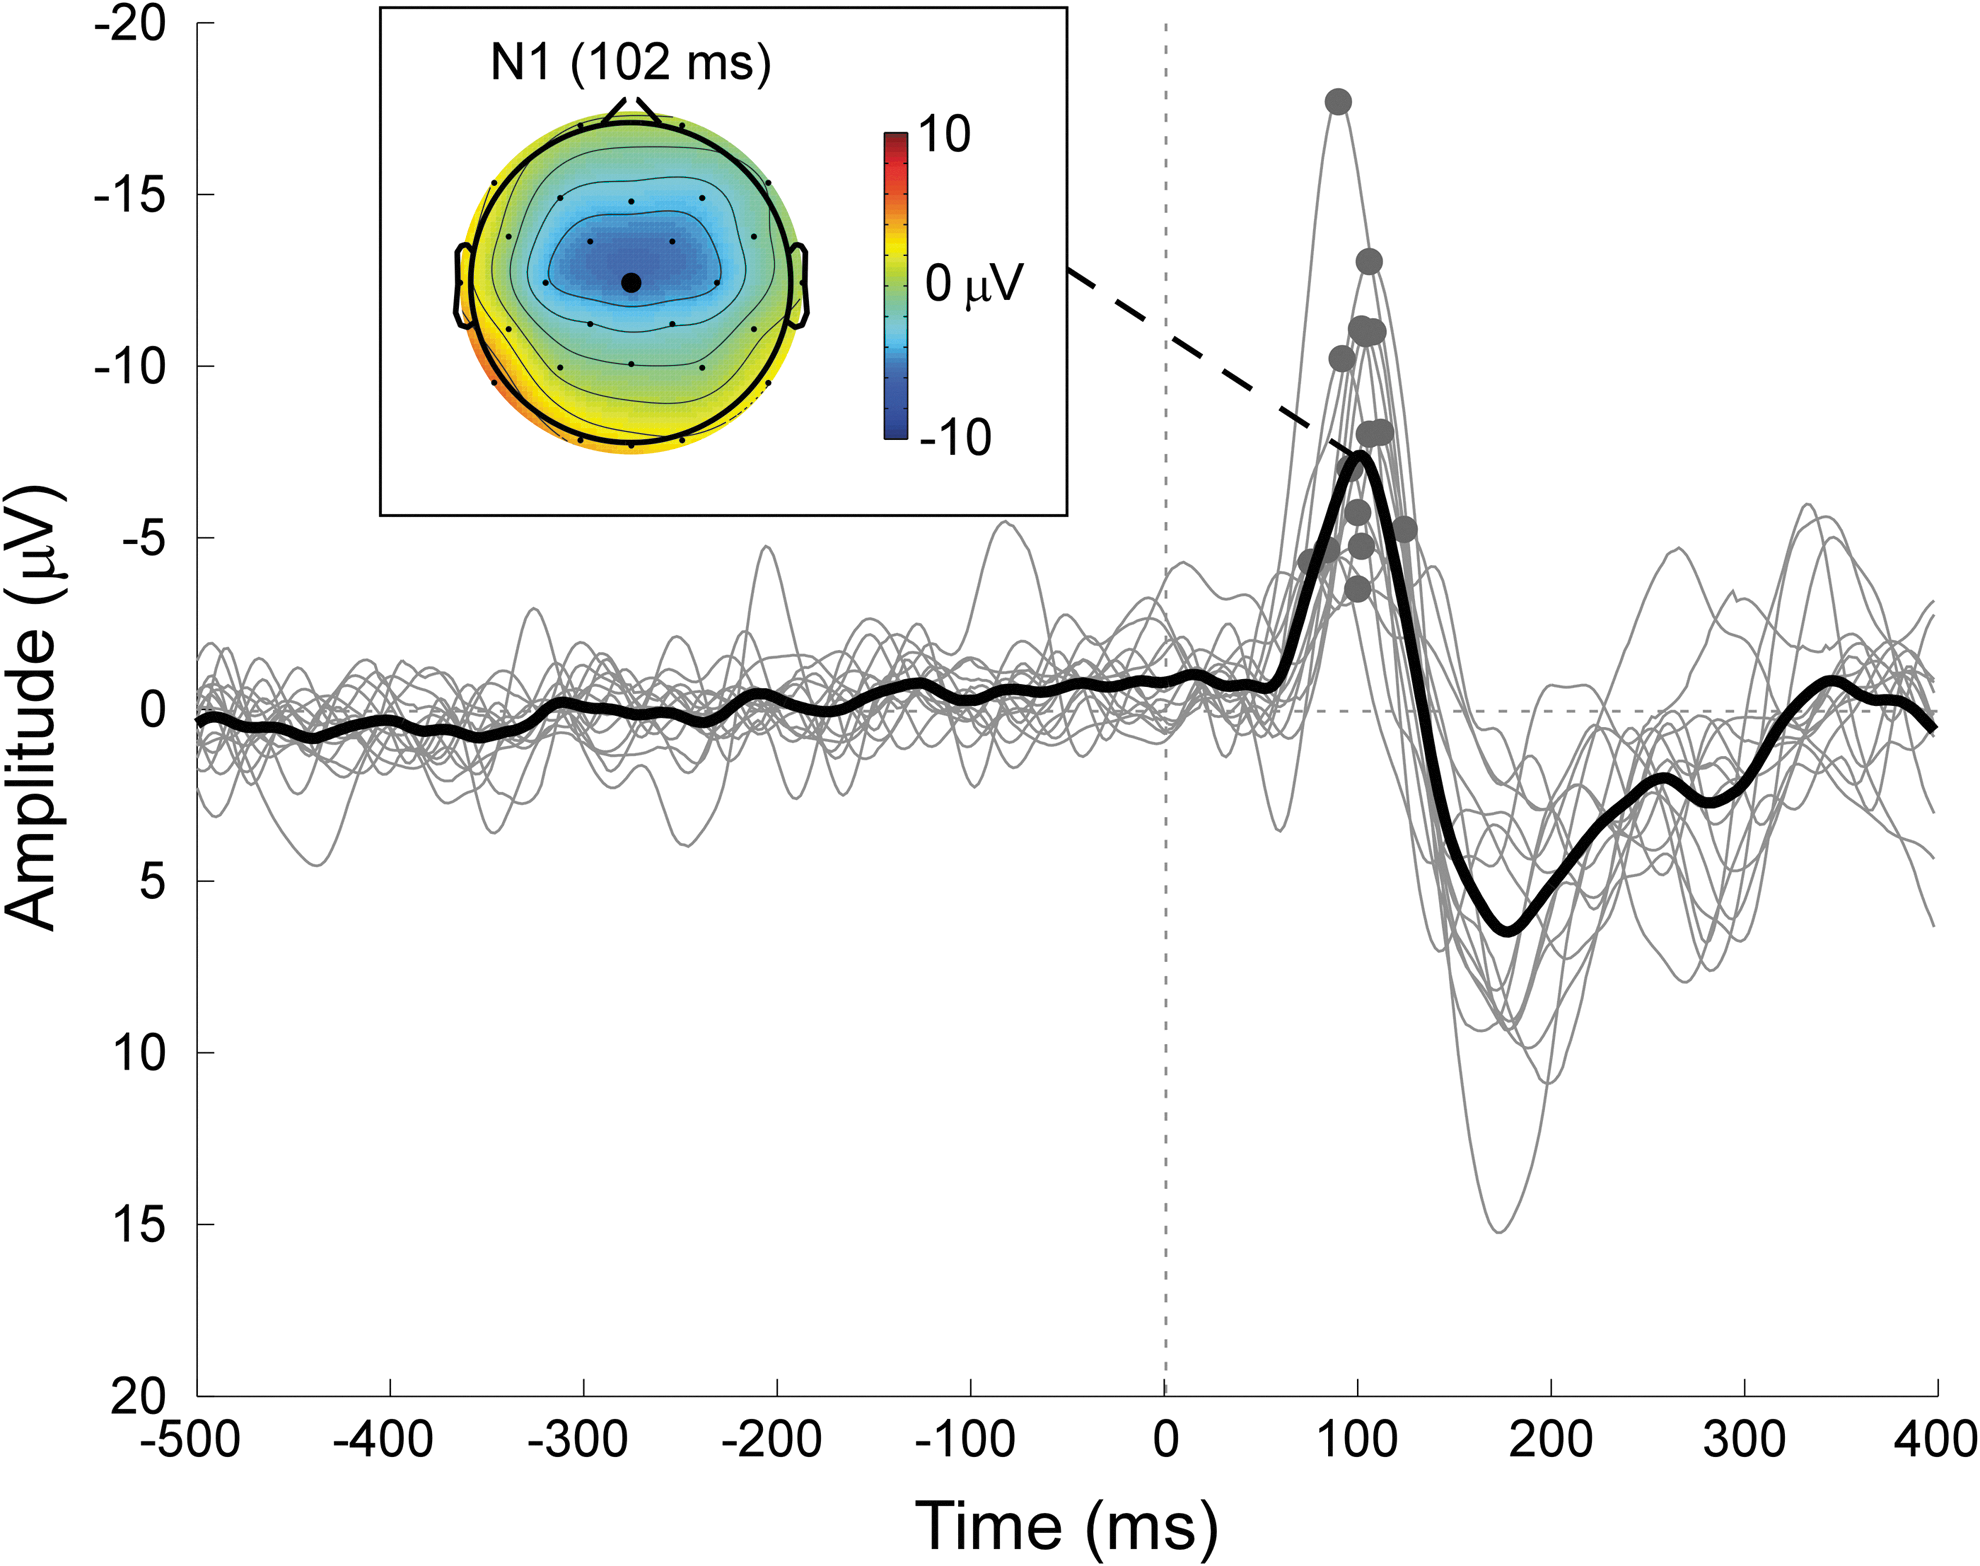
Auditory evoked potential waveforms and N1 scalp topography. Displayed signals were recorded from Cz (average reference). Single-individual average waveforms are superimposed (gray), and the group average waveform is marked with black thick line. The scalp topography of N1 component is displayed at its peak latency (102 ms). The peaks of N1 component, which show substantial interindividual variability in magnitude, are marked using gray dots. Color images available online at
It should be noted that in the current study, we used magnitude (positive value) instead of amplitude (negative value) to characterize N1. Despite the equivalence of the two measures in characterizing N1, we prefer to use N1 magnitude in the current study because it would be more intuitive to understand the correlation between positive variables.
Functional MRI data preprocessing
The fMRI data were first preprocessed using SPM8 (Wellcome Trust Center for Neuroimaging, London, United Kingdom) with routine procedures (Ashburner et al., 2012), including slice-timing and head motion correction, spatial normalization (voxel size = 3 × 3× 3 mm), spatial Gaussian smoothing (full width at half maximum = 8 mm), and grand mean scaling.
Then, we assessed BOLD activation pattern to auditory stimuli following a conventional analysis pipeline in SPM8. Specifically, the voxelwise BOLD activity for each individual was modeled with a general linear model (GLM) using a theoretical stimulus-evoked BOLD time-series (constructed by canonical hemodynamic functions at stimulus onsets) and other nuisance factors (e.g., head motion) as the regressors, and statistical significance of GLM coefficients of the first regressor was assessed at group level with one-sample t-test (corrected with false discovery rate [FDR] correction).
To ensure reliable estimation of sFC, we further applied the following steps to remove remaining noise from BOLD signals.
First, nuisance effects, including head motion, white matter (WM), and cerebrospinal fluid signals (CSF), were removed from BOLD signal for each voxel (Yan and Zang, 2010). Specifically, WM and CSF signals were extracted by averaging the voxels within predefined WM and CSF template provided by the REST toolbox (Song et al., 2011). The WM and CSF signals, together with head motion parameters estimated by head motion correction step, were then used as regressors to account for the variance contributed by these nuisance factors for each voxel through multiple linear regression (Yan and Zang, 2010). The residuals (i.e., signals that cannot be explained by the nuisance factors) of the multiple linear regression were kept for subsequent analysis.
Second, task-regressed FC analysis (Kucukboyaci et al., 2013) was performed to estimate sFC from the BOLD signal recorded during auditory task. More specifically, task-evoked BOLD time-course was constructed with canonical hemodynamic functions, and the time-course, as well as its first derivative (modeling the slight temporal drift across brain regions), was regressed out from each voxel to eliminate possible effect of auditory task on that voxel (Fair et al., 2007) (see Methodological Considerations of Discussion section for more discussion).
Third, global signal regression (GSR; i.e., removing whole-brain-averaged BOLD signal from each voxel), followed by a 2nd order Butterworth filter (0.01–0.1 Hz), was further performed, which is effective in eliminating typical fMRI noise that cannot be completely removed by previous steps (for Methodological Considerations, see Discussion section).
Fourth, to further eliminate the influence of excessive transient head motion, outlier volumes were identified in the following way: (1) calculating framewise displacement (FD) value for each volume, which is defined as the sum of the absolute values of the derivatives of the six realignment parameters (Power et al., 2012); (2) labeling those volumes with FD larger than 0.5 as outlier volumes. The identified outlier volumes were discarded in the following analyses.
Individuals (n = 2) with excessive head motion (larger than 3 mm of peak–peak translational and three degrees of peak–peak rotational movement) were discarded. After screening of EEG and fMRI data, 15 (out of 19) individuals (8 males and 7 females; aged 21.6 ± 2.4 years) were kept for the following analyses.
Coupling between N1 and sFC
To comprehensively investigate the coupling between N1 magnitude and sFC, sFC was estimated by three analysis approaches: (1) ROI-based connectivity, that is, calculating Fisher's Z-transformed Pearson's correlation coefficient between the time courses of left and right HG [defined according to Anatomical Automatic Labeling atlas (Tzourio-Mazoyer et al., 2002)]; (2) VMHC, that is, calculating Fisher's Z-transformed Pearson's correlation coefficients between all voxels in one hemisphere and their mirrored counterparts in another hemisphere (Zuo et al., 2010); and (3) seed-based connectivity, that is, calculating Fisher's Z-transformed Pearson's correlation coefficients between the seed time courses (left and right HG) and the BOLD signals of all voxels.
The sFC estimated by the first approach (ROI-based connectivity) was calculated at the ROI level between bilateral HG, which was used to be correlated with the magnitude of N1 to test the hypothetical N1-sFC coupling. On the contrary, the sFCs estimated by the latter two whole-brain voxelwise analysis approaches (VMHC and seed-based connectivity) were calculated at the voxel level covering the whole-brain, allowing us to test the specificity of the hypothetical coupling (i.e., whether N1 was coupled with the sFC between brain regions other than bilateral HG or not) in a more data-driven way.
The coupling between N1 magnitude and sFC estimated by the above three approaches was estimated, respectively, as the Spearman's rank correlation coefficient. In this study, we chose Spearman's rather than Pearson's correlation coefficient mainly because of the following reasons: (1) there is growing evidence suggesting that neurovascular coupling could be nonlinear (Hoffmeyer et al., 2007; Liu et al., 2010; Sheth et al., 2004), so Spearman's correlation coefficient is a better tool for our analysis, as it only assumes monotonicity of the relationship and hence is able to capture nonlinear relationship; and (2) Spearman's correlation coefficient is much more robust than Pearson's correlation coefficient, which is especially important for whole-brain voxelwise analyses because it is not easy to accurately identify all outliers in these analyses. Before the coupling analyses, interindividual variability in rating of loudness (5.34 ± 0.91) was partialled out by linear regression to eliminate possible confounds.
Multiple testing correction was performed on the statistical results of whole-brain analyses (VMHC and seed-based connectivity analyses) with the AlphaSim method implemented in REST toolbox (p corrected = 0.05) (Song et al., 2011). This method achieves multiple testing correction by jointly applying two thresholds to the results, including a specified p-value threshold and a cluster size threshold estimated by Monte-Carlo simulations (Ledberg et al., 1998).
Results
Auditory evoked brain responses
Figure 1 shows AEP waveforms at Cz and the scalp topography of N1 component. Similar to previous EEG studies (Mouraux and Iannetti, 2009; Zhang et al., 2013), the scalp topography of N1 was maximal at the frontocentral region and extended bilaterally toward temporal regions. Across individuals, N1 magnitude was 8.35 ± 3.96 μV. The estimated SNR of N1 magnitude across individuals was 9.08 ± 5.09 (mean ± SD).
Figure 2 shows the cortical regions significantly activated by auditory tones. These activated regions mainly included bilateral superior temporal gyrus, bilateral insular, anterior/midcingulate cortices, supplementary motor area, inferior frontal gyrus, and bilateral inferior parietal cortices (p FDR < 0.05). Significant voxels could also be observed within corpus callosum (CC). We believe these significant voxels do not indeed reflect auditory-related activity in CC, but the activity in surrounding regions of CC (e.g., MCC), which are distorted toward the boundary of CC due to a slight bias in fMRI normalization and smoothing (Reimold et al., 2006). This is supported by our observation that no matter how large a p-value threshold was chosen (up to p = 0.05 uncorrected), significant voxels within CC were always located at the boundary of CC, and the center of their belonging cluster converged around MCC and posterior cingulate cortex.
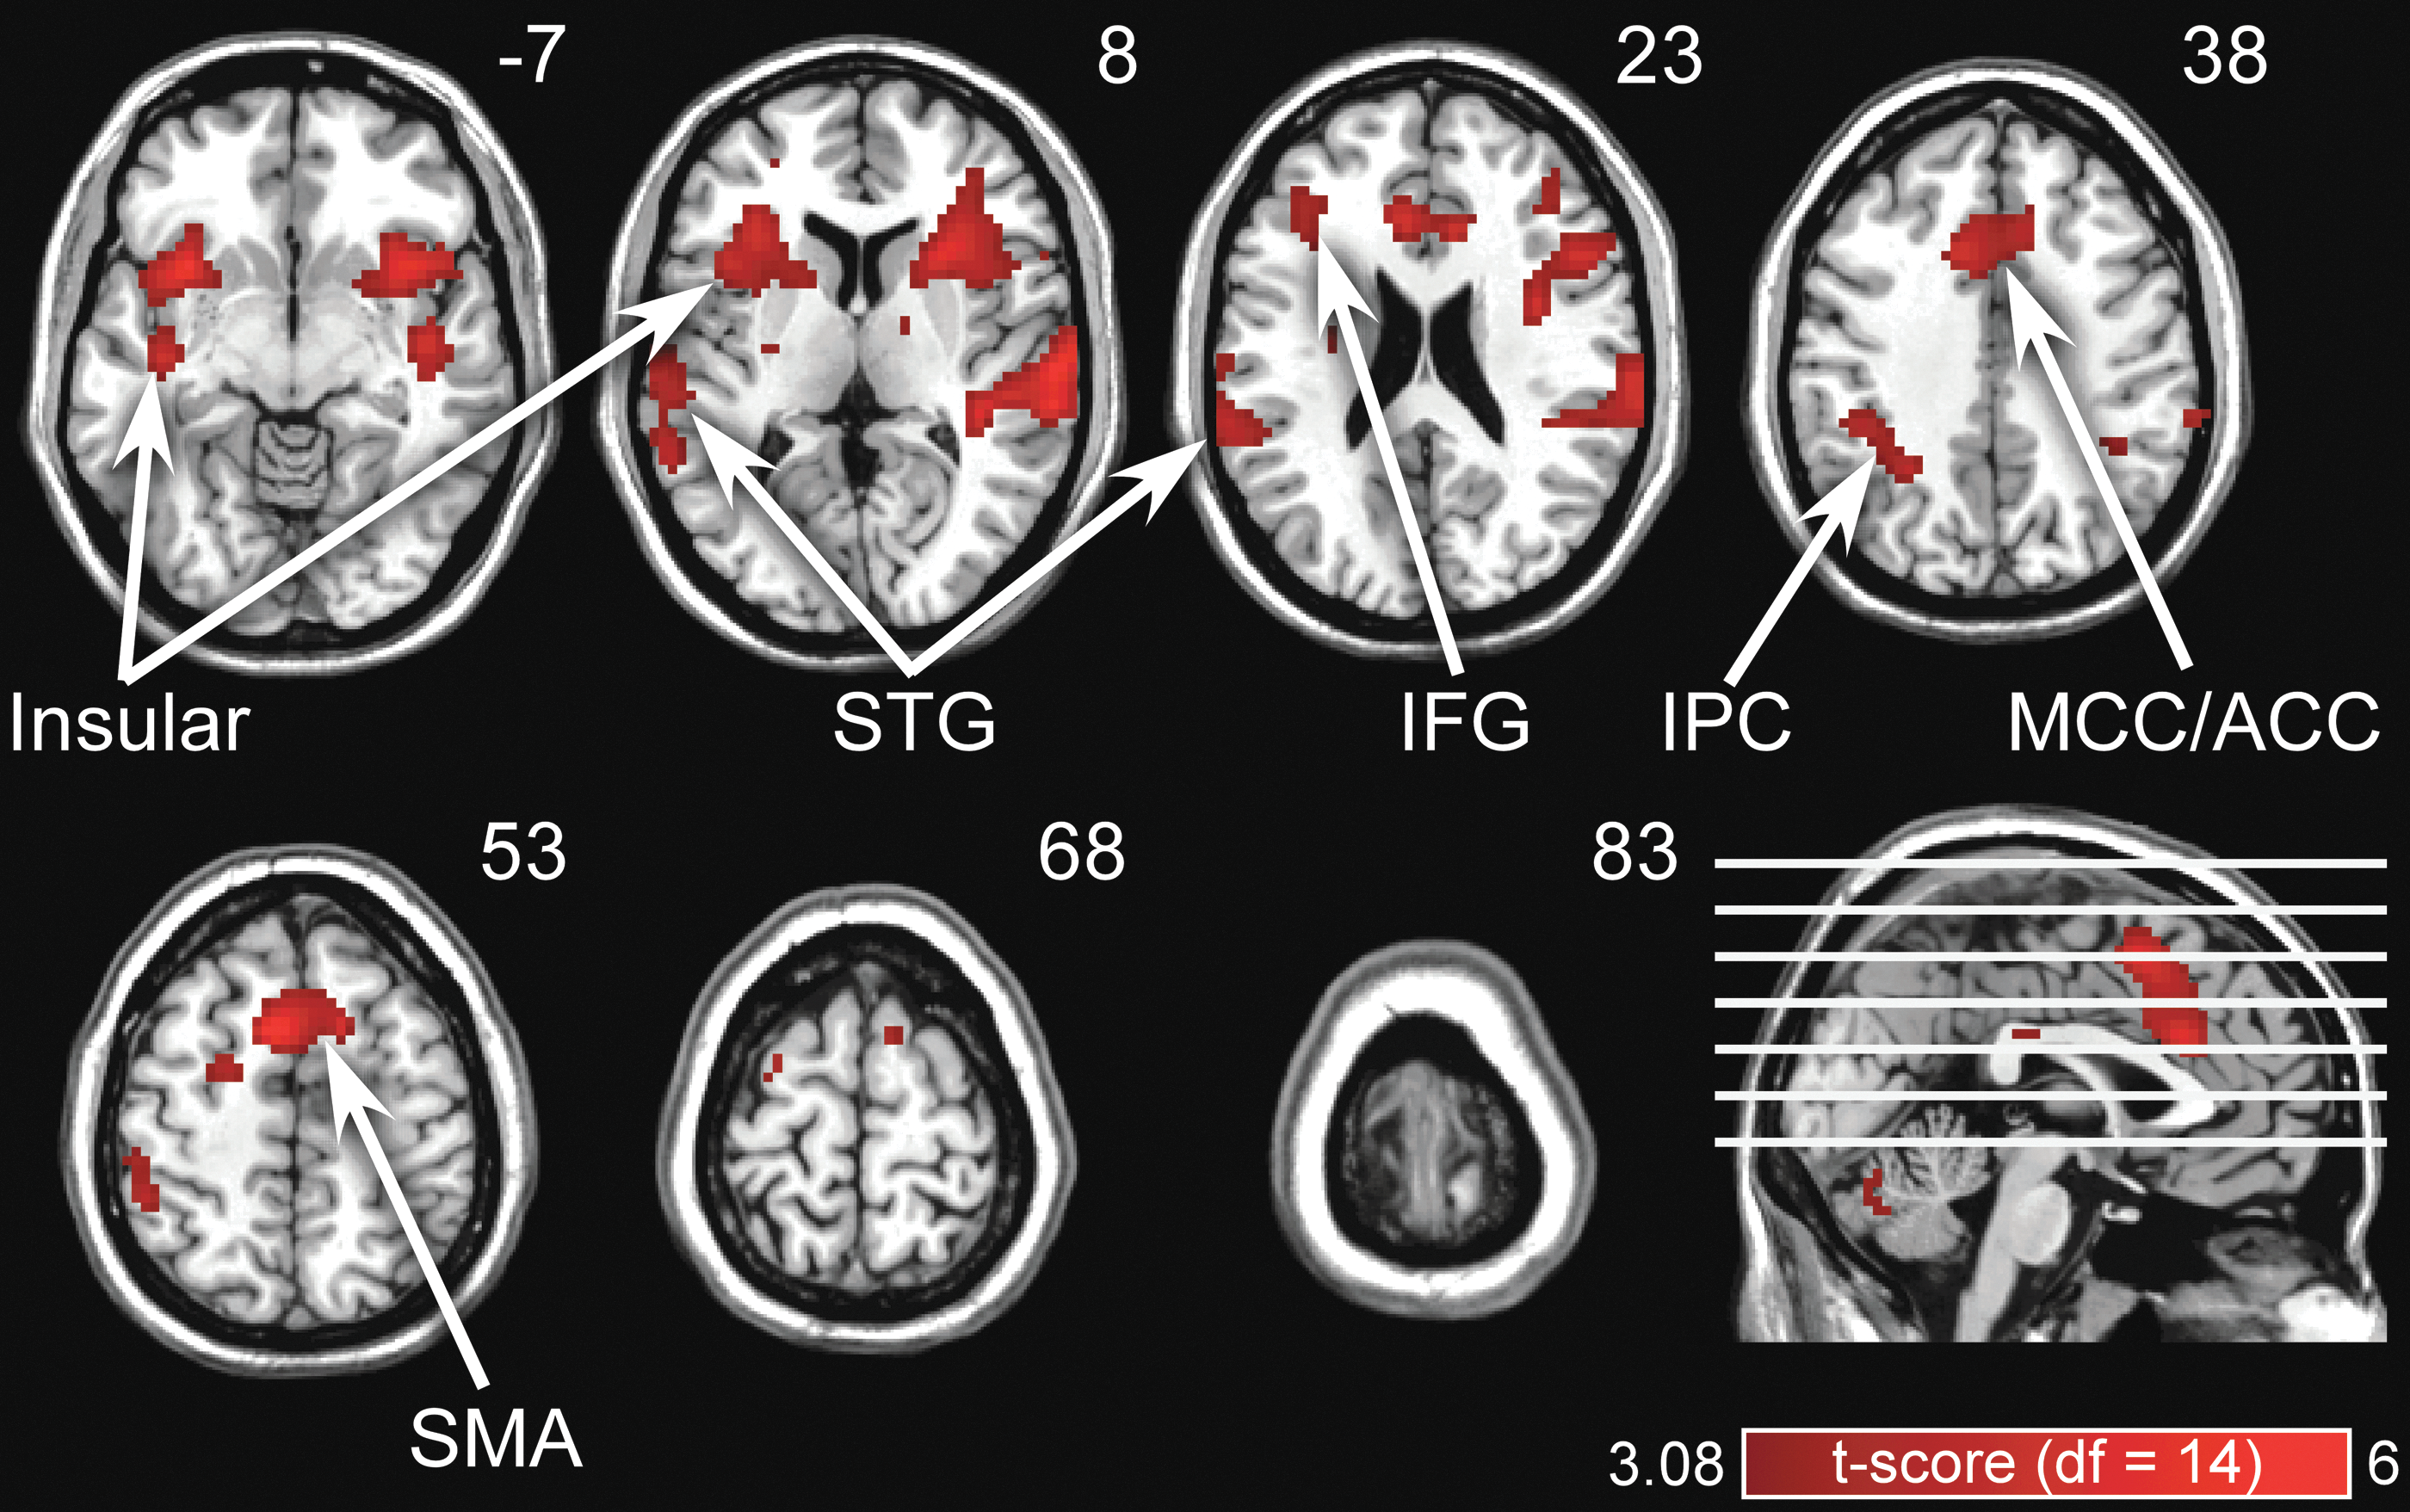
Brain regions activated by auditory stimuli (p < 0.05, false discovery rate corrected). Bilateral STG, bilateral insular, ACC/MCC, IFG, SMA, and bilateral IPCs were activated by auditory stimuli (indicated in red). ACC/MCC, anterior/midcingulate cortices; IFG, inferior frontal gyrus; IPCs, inferior parietal cortices; SMA, supplementary motor area; STG, superior temporal gyrus. Color images available online at
Coupling between N1 and sFC
ROI-based connectivity analysis
At the interindividual level, N1 magnitude (8.35 ± 3.96 μV, expressed in positive value) and sFC of bilateral HG (0.97 ± 0.31) were significantly and positively correlated (Spearman's R = 0.829, p < 0.001; Fig. 3).
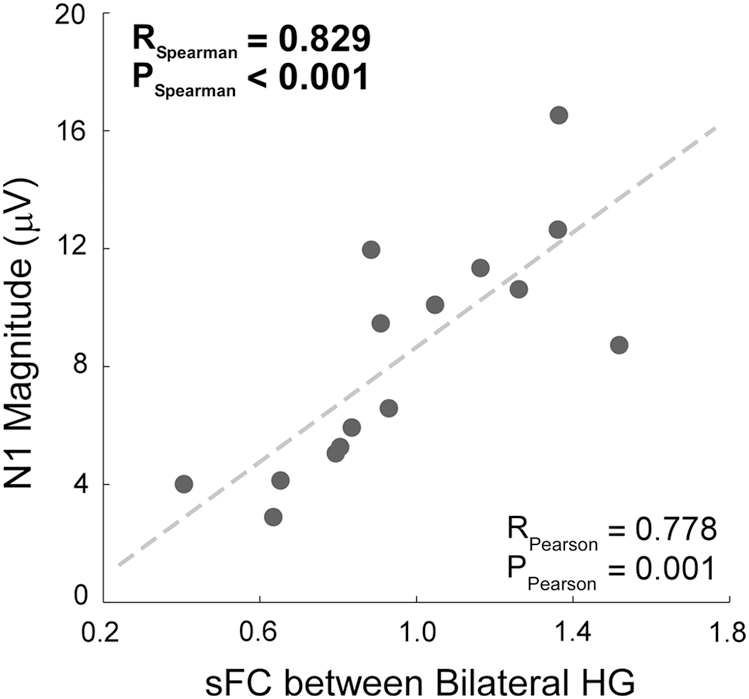
Relationship between N1 magnitude and sFC of bilateral HG (Spearman's R = 0.829, p < 0.001). Each point represents the data from one individual. Spearman's correlation coefficient was calculated to assess the relationship. The best fitting line (dash line), as well as its associated Pearson's correlation coefficient, is shown just for illustrative purpose. HG, Heschl's gyrus; sFC, spontaneous functional connectivity.
VMHC analysis
Figure 4A shows the cortical regions that N1 magnitude and VMHC were significantly correlated at the interindividual level (p AlphaSim < 0.05; uncorrected p-value threshold = 0.01; estimated cluster size threshold = 2538 mm3). Significant positive Spearman's correlations were mainly observed at bilateral medial HG (marked in red in Fig. 4A).
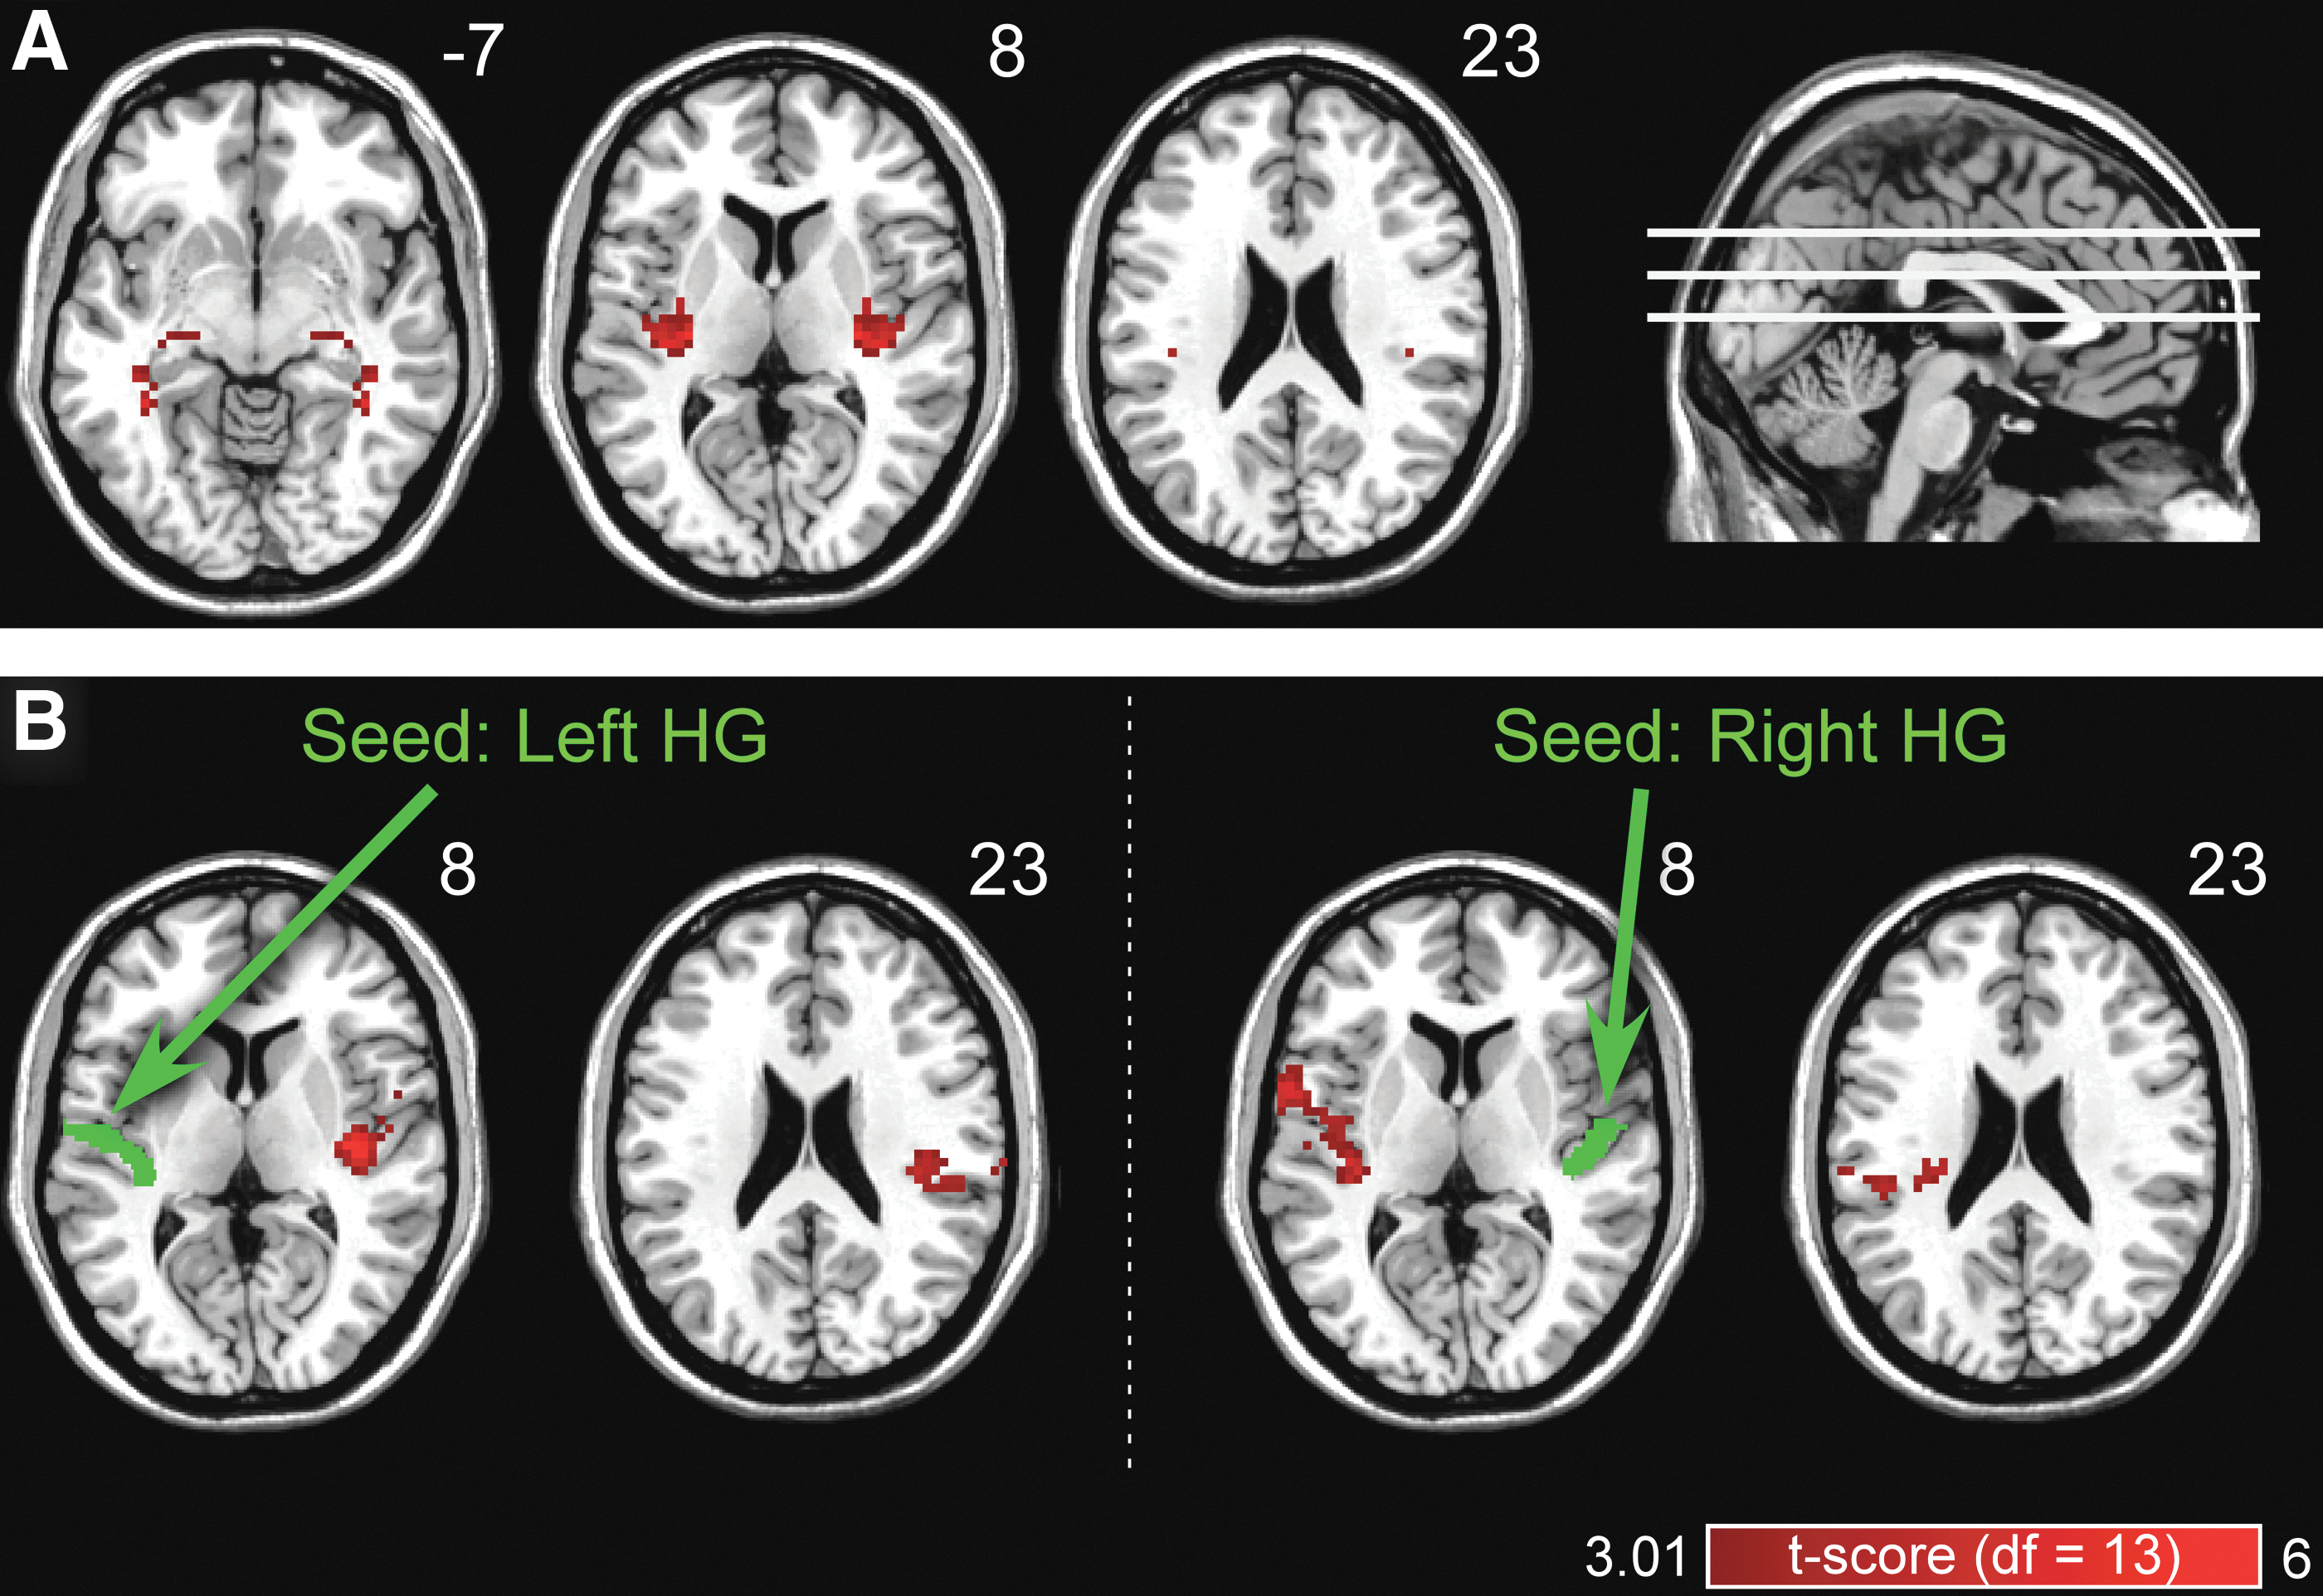
The coupling between N1 magnitude and sFC estimated using VMHC analysis and seed-based connectivity analysis.
Seed-based connectivity analysis
Figure 4B shows the cortical regions that N1 magnitude and seed-based sFC were significantly correlated at the interindividual level for two seeds (left and right HG), respectively (p AlphaSim < 0.05; uncorrected p-value threshold = 0.01; estimated cluster size threshold: left = 6102 mm3, right = 4833 mm3). Significant positive Spearman's correlations were only observed at the homotopic regions contralateral to the seeds (marked in red in Fig. 4B), while no correlation was observed at regions ipsilateral to the seeds.
Discussion
The present study provided converging evidence indicating the strong and specific interindividual relationship between N1 magnitude of AEPs and sFC of bilateral HG. ROI-based analysis showed that N1 magnitude of AEPs was positively correlated with sFC between bilateral HG at interindividual level (Spearman's R = 0.829, p < 0.001; Fig. 3). VMHC analysis and seed-based analysis confirmed the relationship between N1 magnitude and sFC of bilateral HG, and ruled out the possible contribution of the variability in N1 magnitude from sFC between other bilateral homotopic regions (Fig. 4A), as well as between HG and any other heterotopic regions (Fig. 4B).
Validity of the coupling between N1 and sFC
Although the coupling between N1 and BOLD-sFC was not directly investigated in previous studies, clues of such coupling could still be found in the literature. First, it was reported that both N1 magnitude and interhemispheric structural connectivity between bilateral auditory cortices were commonly affected by musical training (Elmer et al., 2014; Shahin et al., 2003). Second, even limited by the spatial resolution, a previous EEG study (Kühnis et al., 2014) indicated that N1 magnitude was positively correlated with EEG-based FC between bilateral HG within a musical group.
However, there are also discrepancies between our results and those reported in literature, possibility due to differences in neuroimaging modality, experimental design, or analysis strategy. In our study, a strong positive N1-sFC correlation was observed within the healthy group, while in Kühnis et al., 2014, no significant N1-sFC correlation (also positive but not significant) was observed within healthy control, but a significant negative correlation was observed within a musical group. Such discrepancies may imply a different mechanism underlying the observed N1-sFC couplings. The coupling in Kühnis et al., 2014, may capture interindividual difference in musical training effect, while the coupling in our study may capture other aspects of interindividual difference (e.g., saliency detection as discussed in the following). However, such an interpretation should be made carefully. Given that EEG is a more direct measurement of neural activity with a much higher temporal resolution than fMRI, it is possible that the FC measured by EEG and fMRI represents different aspects of synchrony between brain regions.
In the whole-brain voxelwise analyses, the results suggest that the observed N1-sFC coupling is specifically observed within bilateral HG. Bilateral HG has been identified as one of the major generators of AEP N1 in previous N1 localization studies, although other subregions within primary and secondary auditory cortices were also identified frequently (Lütkenhöner and Steinsträter, 1998; Meyer et al., 2006; Pantev et al., 1996). The slight difference in the estimated N1 source localizations could be due to the limited spatial resolution and reliability of EEG source localization techniques, and the small size of bilateral HG compared with the possible interindividual/-group variability in HG structure (Meyer et al., 2014; Morosan et al., 2001; Rademacher et al., 2001; Wong et al., 2008). Our results, by showing that N1 magnitude is correlated with the spontaneous FC between bilateral HG across individuals, suggest an important role of spontaneous FC of bilateral HG in the generation or modulation of N1.
FC of spontaneous brain activities, as a measurement of functional integration across brain regions, provides a powerful tool to capture the brain states (e.g., consciousness, attention) (Craddock et al., 2009; Martuzzi et al., 2010; Shirer et al., 2012). The brain states could influence the performance of various sensory perception tasks through a top–down process (Gilbert and Sigman, 2007). Therefore, the observation that N1 magnitude was strongly correlated with sFC between bilateral HG across healthy individuals may imply that interindividual difference in baseline information integration of bilateral HG (as indexed by sFC) could greatly influence the strength of auditory evoked neural activity in bilateral HG (as indexed by N1 magnitude). Such interindividual coupling could serve as a substantial neural mechanism underlying the processing of auditory information.
Importantly, VMHC analysis showed that N1 magnitude was correlated with sFC between bilateral medial HG, but not between bilateral lateral HG (Fig. 4A). Actually, medial HG and lateral HG belong to different subdivisions of auditory cortex: while medial HG belongs to core regions of auditory cortex, lateral HG belongs to lateral belt regions (Schönwiesner and Zatorre, 2008). From the perspective of hierarchical acoustic signal processing, acoustic input to the brain is transmitted through a pathway (from core regions to belt/parabelt regions of auditory cortex) along which acoustic features are sequentially processed by functionally specialized subregions of auditory cortex (Wessinger et al., 2001). It has been reported that auditory core regions are more sensitive to pure-tone stimuli, and belt/parabelt regions are more sensitive to complex sounds (Okada et al., 2010), which also applies to bilateral HG: with intracranial recording, it was reported that while medial HG is more sensitive to onset processing, lateral HG is more involved in processing pitch variation. (Schönwiesner and Zatorre, 2008). The VMHC result seems to coincide with the functional role of medial HG (which is more sensitive to pure-tone onset processing), given that pure-tone stimulation was used in our experiment.
In addition, previous studies demonstrated that N1 component, as a typical vertex potential, was involved in bottom–up cognitive mechanisms of saliency detection, arousal, or attentional reorientation (i.e., more related to onset processing of auditory information than pitch processing) (Downar et al., 2000; Mouraux and Iannetti, 2009). Considering the functional similarity between N1 component and medial HG, it is not surprising that N1 magnitude and sFC of bilateral medial HG were highly coupled at the interindividual level, and their coupling could reflect interindividual difference in onset processing of auditory information, for example, the distinct ability of saliency detection of different individuals.
The significance of the coupling between N1 magnitude and sFC
The observation that N1 magnitude and sFC between bilateral HG were strongly coupled has two important practical implications.
First, it is important to consolidate event-related brain responses and ongoing neural activities in understanding cortical processing to sensory inputs and tasks, since event-related brain responses (e.g., N1 in AEPs) are not only determined by experimental operations (e.g., intensity of sensory inputs) but also influenced by the brain states (Olofsson and Polich, 2007) as reflected by ongoing neural activities (e.g., sFC between bilateral HG). Similar to previous studies (Liu et al., 2011a; Mennes et al., 2010; Smith et al., 2009; Tian et al., 2012), our finding added to the scientific evidence concerning the inherent relationship between event-related brain responses and spontaneous brain connectivity. Investigating such a relationship could provide a more comprehensive description on an individual's cortical processing to sensory stimuli or tasks and can enrich our understanding in the functional significance of the coupling between event-related brain responses and spontaneous brain connectivity per se.
Second, it is important to rule out possible interindividual variability in brain responses when comparing different experimental groups. Intuitively, interindividual variability in brain states is an important confounding factor in various pathological studies, since the brain states, as reflected by spontaneous brain activities/connectivity, could be quite different between patients and healthy individuals. If this confounding factor was not controlled, significant difference of event-related brain responses could reflect the entangled effects of experimental manipulations and the state of the brain. Possibly due to this reason, previous studies assessing the difference of N1 magnitude between different populations (e.g., between young and elderly) yielded inconsistent results: larger N1 magnitude was reported in Anderer et al., 1998; Herrmann et al., 2013; Rufener et al., 2014, while lower magnitude was reported in Papanicolaou et al., 1985; Tremblay et al., 2004. Spontaneous FC holds the potential to capture interindividual variability in brain states. This information could be utilized to remove the variability in N1 magnitude induced by different brain states, thus increasing the reliability and applicability of brain responses as a probe to the mechanism underlying pathophysiological conditions. For this purpose, more work should be done in the future to extract information of brain states from spontaneous FC.
Methodological considerations
To accurately and reliably assess the relationship between event-related EEG responses and sFC, several methodological considerations should be highlighted.
First, it should be made clear that we did not estimate FC directly using the original BOLD signals, but using the spontaneous BOLD signals isolated from the original signals. To stress this point, we used sFC instead of FC to refer to our estimated FC values. Under the resting-state condition, sFC could be directed measured by the correlation coefficients between spontaneous BOLD activities, as the resting-state paradigm guarantees the “spontaneous” nature of observed signals. Under task conditions, however, sFC could not be directly estimated because the recorded BOLD signals reflect a mixed effect of spontaneous and task-induced brain activities. In addition, it is important to analyze sFC instead of FC in event-related studies, because if FC is calculated between original signals recorded during task, it would contain entangled information from evoked responses and spontaneous signals, making interpretation difficult.
Fortunately, strong evidence has indicated recently that BOLD signal recorded during task could be well approximated by the linear superposition of spontaneous and task-induced BOLD activity (Fox et al., 2006). This finding suggested that we are able to isolate spontaneous BOLD signals by subtracting task-induced BOLD variations from original BOLD recording. Therefore, to estimate sFC from our data, first, we modeled task-induced BOLD activities using canonical hemodynamic function and removed the effect of task-induced BOLD activities by multiple linear regression (Fair et al., 2007). After that, sFC was calculated based on the task-regressed spontaneous BOLD signals. This method, usually termed “task-regressed FC analysis” in the literature, allows us to analyze spontaneous FC on event-related fMRI data, which extended the applicability of FC analysis, and is gaining support from recent literature (Fair et al., 2007; Kucukboyaci et al., 2013).
It should be noted that previous studies have suggested altered FC under continuous cognitive/perception tasks (Hampson et al., 2002; Liu et al., 2011b; Lowe et al., 2000; Xu et al., 2006). Therefore, although evoked BOLD responses have been effectively removed by task-regressed FC analysis, spontaneous BOLD fluctuations (and hence the sFC strength) could still be modulated by the engagement of the auditory tasks. However, there is also evidence showing that event-related tasks do not substantially influence FC strength (Morgan and Price, 2004), probably due to the relatively lower cognitive load required for these tasks. Given the long interstimulus interval and low cognitive load of our event-related auditory task, we believe that the sFC estimated in our study largely reflects the synchronization of resting-state spontaneous brain activities.
Second, GSR was performed before connectivity analysis, since it can efficiently reduce the influence of interindividual difference caused by typical fMRI artifacts, for example, cardiac, respiratory, and head motion artifacts (Fox et al., 2009). Although GSR was criticized for its tendency to bias BOLD-FC to negative values (Murphy et al., 2009), our analyses were focused on sFC between homotopic regions which is normally positive and thus were minimally influenced by the distortion effect of GSR (Fox et al., 2009).
Conclusion
In this study, we observed a strong coupling between the magnitude of AEP N1 and sFC of bilateral HG with simultaneous EEG-fMRI recording. The result may imply that interindividual difference in baseline information integration of bilateral HG could influence the strength of auditory evoked neural activity in bilateral HG. This finding could reflect important neural mechanism underlying auditory information processing, which holds the potential to increase the applicability of brain responses as a probe to the mechanism underlying pathophysiological conditions.
Footnotes
Acknowledgments
We thank all healthy volunteers for their kind participation. A.T., Y.H.T. and Y.S.H. are supported by the Hong Kong RGC GRF grant (HKU 785913M). L.H. is supported by the National Natural Science Foundation of China (No. 31471082), Chongqing Research Program of Basic Research and Frontier Technology (No. cstc2015jcyjBX0050), and the Scientific Foundation project of Institute of Psychology, Chinese Academy of Sciences (No. Y6CX021008). Z.G.Z. is supported by the Recruitment Program for Young Professionals.
Authors’ Contributions
L.H. and R.C. designed the experiment and collected the data. A.T. analyzed the data. A.T., Y.H.T., Y.S.H., Z.G.Z., and L.H. drafted the manuscript. All authors discussed the results and implications, and approved the final version of the manuscript.
Author Disclosure Statement
The authors declare no competing financial interests.