
Abstract
To evaluate the influence of poststroke aphasia on the functional association of widespread large-scale neuronal networks, we analyzed functional connectivity (FC) between resting-state brain networks (RSNs) in aphasic patients (N = 15) and in healthy volunteers (N = 17) of the same age using resting-state functional connectivity magnetic resonance imaging. As a result, six RSNs were isolated and cross-correlation matrices were computed for their time courses. Aphasic patients showed decreased correlations between posterior part of the default mode (pDMN) and both auditory (AUD) and right frontoparietal (RFP) networks. Additionally, we calculated regions of interest-based FC (ROI-FC), gray and white matter volumes in the ROIs overlapping with pDMN, AUD, and RFP. ROI-FC analysis showed decreased FC between the right pars triangularis and both right middle frontal and right superior frontal gyri. The decreased pDMN-RFP connectivity in patients is likely to reflect changes in FC of these nodes. The lesion in the regions overlapping with pDMN and AUD networks leads to the significantly decreased pDMN-AUD connectivity. Our results suggest that abnormal FC in stroke patients may reflect the impairment of activity not only in the regions directly affected by stroke lesion in the left hemisphere but also in the homotopic regions of the intact right hemisphere. The increase of gray and white matter volume in the right supramarginal gyrus, the functional hub of pDMN, AUD, and RFP networks, correlated with less speech impairment. This increase might reflect a right hemisphere neuroplasticity process to compensate the impaired function of the homotopic region of left frontoparietal network (LFP), pDMN, and AUD in the left hemisphere. The presented results contribute to the hypothesized compensative role of the transfer of attention and executive functions from the damaged areas in the left hemisphere to the right homotopic areas, accompanied by more preserved language skills at the chronic stroke stage.
Introduction
A
However, the impact of the contralateral hemisphere in recovery after stroke could be more complex and depend on many factors such as lesion size and time after stroke. Several studies suggested that there is a relationship between lesion size and the rate of hemispheric transfer, where larger lesions do not allow the restoration of original language network to occur in the left hemisphere. Consequently, large lesions may result in the complete transfer of functions to the contralateral hemisphere, while in the case of a smaller lesion, intact areas of the damaged hemisphere may prevent complete transfer (Grafman, 2000). The other studies have concluded that homotopic language regions in the right hemisphere contribute to recovery only at the chronic stage after stroke (Mimura et al., 1998; Richter et al., 2008).
One of the widely used approaches to evaluate altered inter-regional neural interactions in stroke patient is the functional connectivity (FC) analysis. There are a growing number of studies that applied FC analysis to understand the changes in brain networks in stroke patients with aphasia as well as the mechanism of neural plasticity during recovery (Brownsett et al., 2014; van Hees et al., 2014; Warren et al., 2009; Zhu et al., 2014). FC analysis is applicable for functional connectivity magnetic resonance imaging (fMRI) data obtained both during cognitive or motor tasks and during resting state. Abnormal patterns of resting-state FC (rsFC) have been recently investigated across a variety of neuropsychiatric disorders, and there is growing evidence that such abnormalities may potentially provide valid and reliable biomarkers of brain diseases (Broyd et al., 2009; Greicius, 2008).
Unlike most psychiatric disorders, stroke leads to substantial changes in brain tissues particularly affecting the values of hemodynamic response (HR) and blood oxygenation level-dependent (BOLD) signal, such as baseline perfusion and cerebrovascular reactivity, and leads to low signal-to-noise ratio (Veldsman et al., 2015). In this sense, rsFC analysis is more applicable for the stroke population than model-based analysis in fMRI as it does not depend on the HR shape. FC analysis is more frequently used in research of motor system reorganization and recovery in stroke patients. These studies have reported that stroke induces changes in functional and effective connectivity within and across hemispheres, which refers to motor impairments and recovery (Rehme and Grefkes, 2013). However, the rsFC method is even more convenient for studying widespread alterations in brain networks of patients with profound speech impairment, because it does not depend on the patient's ability to understand and execute cognitive tasks.
In the present study, we focused at evaluation of widespread resting-state functional network connectivity (rsFNC) changes in ischemic stroke patients with aphasia. We are particularly interested in the possible role of contralateral hemisphere in the compensation of language function at the subacute and chronic stage of rehabilitation after stroke. We used rsFNC analysis (Jafri et al., 2008) to evaluate the differences in interactions between well-known and widely described brain resting-state networks (RSNs) in stroke patients (Beckmann et al., 2005; Damoiseaux et al., 2006).
We assumed that the analysis of FC between large-scale networks might shed light on the mechanisms of cognitive impairment and rehabilitation of aphasic patients as it integrates information on both hemispheres. We expected the differences in rsFNC to appear within and between bilateral areas of the networks that mostly overlap with the lesion in the left hemisphere. In addition, we tested the volumes of gray and white matter in the right hemisphere regions of the RSNs and performed conventional FC analysis between selected regions of interest (ROIs) to reveal whether the connectivity in the intact hemisphere is changed in aphasic patients and whether these changes are reflected in rsFNC data.
Materials and Methods
Participants
Fifteen elderly healthy volunteers (61–82 years old, mean age 67.8 ± 5.1, 8 males) and 17 patients after a single episode of ischemic stroke in the left hemisphere at subacute (i.e., >1 month after accident) and chronic stages (i.e., >6 month after accident) of poststroke rehabilitation (48–77 years old, mean age 63.9 ± 8.4, 13 males; Table 1) were recruited through the Center for Speech Pathology and Neurorehabilitation.
According to 6-point scale Luria (1973).
Exclusion criteria for healthy volunteers were clinical or radiological evidence of previous cerebrovascular accident and magnetic resonance imaging (MRI) contraindications. Intensive head movements during fMRI scanning were also the cause of exclusion from further analysis. All selected patients had their first mild to moderate ischemic stroke (NIHSS score of 4–12 at the acute stage of stroke, the values were taken from the previous clinical records of stroke patients) in the left middle cerebral artery more than a month before the investigation. Clinical evaluations of patients were performed by several neurologists (with 5 years minimum experience) of the Center for Speech Pathology and Neurorehabilitation.
All healthy participants had no history of psychiatric or neurological disorders and were not taking any psychiatric or neurological medications at the time of scanning. Patients were excluded from the study if they had a history of other neurological or psychiatric disorders. All patients had mild to moderate severity of poststroke aphasia (mean scores 3 ± 1, Table 1) and stayed in the center mainly for speech rehabilitation procedures.
Aphasia diagnoses and the severity of speech disorders were determined by different speech–language pathologists from the center who examined each patient with a speech and language protocol designed to elicit the features of aphasia. The protocol contained the evaluation criteria of cognitive impairment adopted from the neuropsychological tests of Luria (1973). Luria's neuropsychological school is generally accepted in Russian hospitals. This school has a slightly different classification of aphasia than the common one but mostly coincides with it. Luria's school distinguishes several types of poststroke aphasia, and among them there are sensory (Wernicke's) aphasia, motor (Broca's) aphasia, and sensorimotor aphasia (the mixed type of Broca-Wernicke, which is the most frequent case of speech disorders after the vast left hemisphere stroke). In the current study, we used Luria's classification and aphasia severity rating. Due to the frequent mixed type of poststroke speech disorders, the degree of aphasia was rated depending on the main impairment such as speech comprehension or/and production ability at a 6-point scale, where 0-score meant an absence of speech impairment and 5-score meant very severe speech impairment.
Ethics statement
This study was approved by the Ethics Committee of Institute of Higher Nervous System and Neurophysiology of Russian Academy of Science and the Center for Speech Pathology and Neurorehabilitation (Moscow, Russia). All subjects provided their written informed consent after receiving a complete description of this study.
Data acquisition
Participants lay supine in an MRI scanner (1.5 T MAGNETOM AVANTO MRI Scanner, Siemens, Germany). Participants were instructed to remain calm, with their eyes closed, not falling asleep, and not thinking about anything in particular. To minimize head movement, foam pads were used to fix the head during MRI acquisition. A high-resolution, T1-weighted, anatomic rapid gradient-echo image was acquired first (T1 MPRAGE sequence: time of response (TR) 1900 msec, time of echo (TE) 3.4 msec, flip angle (FA) 15°, 176 slices with slice thickness 1 mm and slice gap of 0.5 mm; field of view 256 mm with matrix size 256 × 256). Then, each participant underwent T2*-weighted echo planar imaging (EPI) session containing 180 volumes (9 min). Parameters of the EPI sequence were as follows: TR 3 sec, TE 50 msec, FA 90°, 35 slices with slice thickness of 3 mm and slice gap of 0.8 mm, the field of view was 252 mm, and matrix size 64 × 64.
Patient lesion mapping
Stroke lesion volume was calculated manually by drawing an outline of the lesion on the T1-weighted image of each patient and computing its volume with BrainVoyager QX 2.6 (Brain Innovation, Maastricht, The Netherlands) (Goebel et al., 2006). A lesion overlap image was constructed for all 17 patients on the template image by means of MRIcron software (Rorden et al., 2007) (Supplementary Fig. S1; Supplementary Data are available online at
Data preprocessing
The functional images were processed with statistical parametric mapping toolbox (SPM8; Welcome Department of Imaging Neuroscience, London, England) for MATLAB 7.0.4 (Math Works, Natick, MA). The preprocessing procedure included realignment of T2*-weighted images with the mean functional image for motion correction. Values of head motions in three dimensions were also checked manually and only the data of subjects with the head movements less than 1 mm and 1° were accepted for further analysis. The mean functional image was coregistered with the anatomic image. After that, all the images were normalized into the standard MNI space (Friston et al., 1994) with the voxel size 1.5 × 1.5 × 1.5 mm3. This procedure was performed in three stages.
At first, structural images were segmented into gray and white matter, cerebrospinal fluid, bones, and air using New Segment tool. Gray and white matter images were used to create a template image in Diffeomorphic Anatomical Registration Through Exponentiated Lie Algebra (DARTEL) SPM toolbox for all subjects for each group separately. Spatial normalization using DARTEL template was used to normalize functional and structural images of each subject. Smoothing was applied to fMR images with a Gaussian kernel with full-width at half-maximum of 6 mm. As the resting-state networks prevail at low frequencies (<0.1 Hz) (Friston et al., 2000), we applied band pass temporal filtering. A fifth order Butterworth filter was used with a frequency window from 0.01 to 0.1 Hz.
To obtain the coregistration of the MNI Colin27 atlas with the T1-wieighted images in the individual space, structural images were additionally processed using BrainSuite 15b software (Shattuck and Leahy, 2002) and underwent the cortical extraction sequence. The procedure is exhaustively described at the BrainSuite software webpages (
Independent component analysis
Consequently, fMRI data for each group separately was decomposed into 30 independent components (ICs) using Group IC analysis (ICA) toolbox (GIFT,
Activation spatial maps were scaled to Z-scores. Six consistent networks (Fig. 1) were chosen according to the following two criteria: a maximal overlap with gray matter regions and a maximal spatial correlation with known RSN spatial maps (Beckmann et al., 2005; Damoiseaux et al., 2006; Hacker et al., 2013), which we constructed using WFU PickAtlas 3.0.4. (Maldjian et al., 2003). The number of voxels (NoV) was estimated for the spatial maps of the selected components in both hemispheres (RFP calculated only in the right hemisphere) with the threshold of 2 (Damoiseaux et al., 2006). The laterality index (LI) was calculated by subtraction of the NoV in the right hemisphere from the NoV in the left one divided by their sum. The mean NoV and LI scores are presented in Supplementary Table S2.
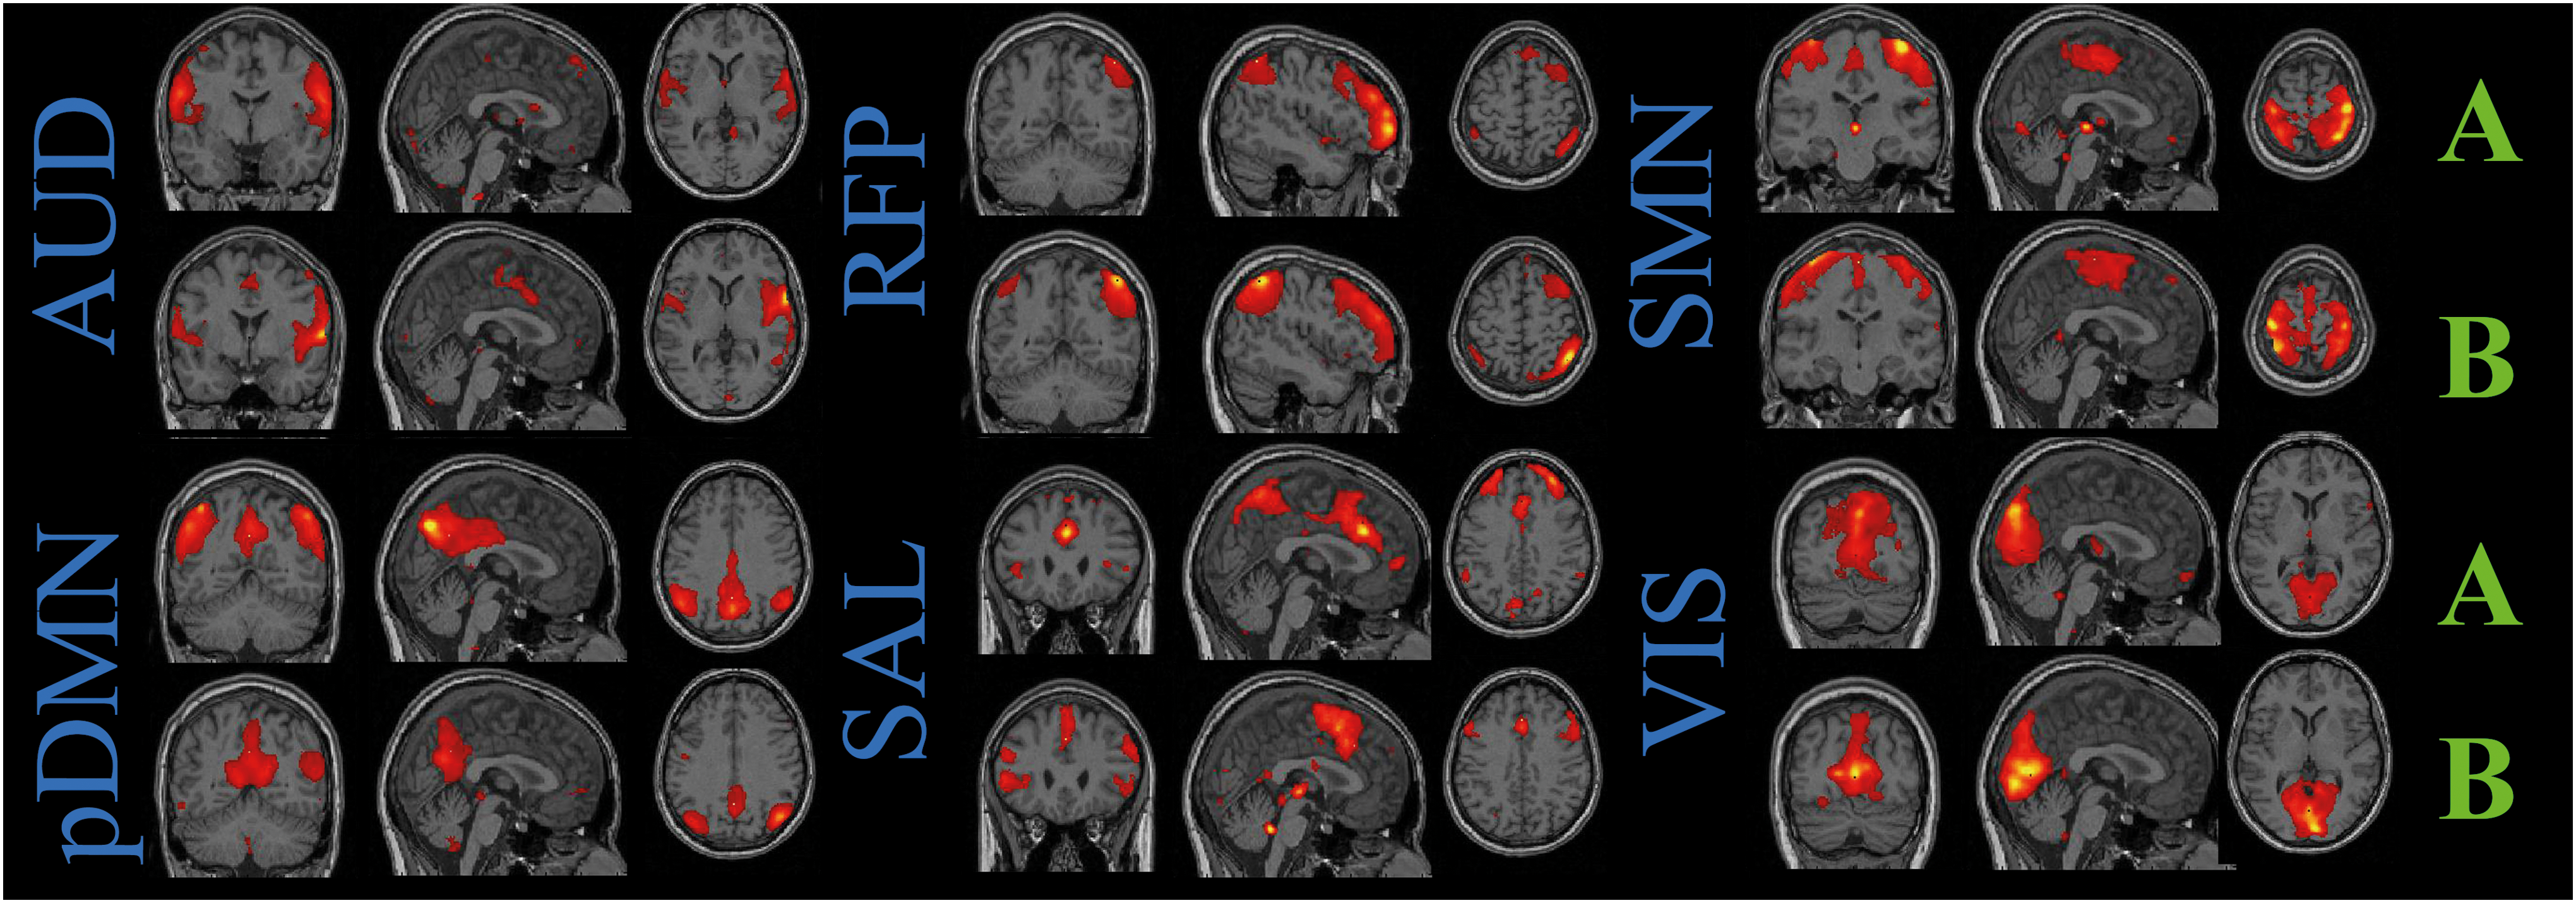
Spatial maps of the components revealed by independent component analysis (ICA) and corresponding to resting-state networks: auditory (AUD), posterior default mode (pDMN), right frontoparietal (RFP), salience (SAL), sensorimotor (SMN), and visual (VIS) networks are shown as Z-scores thresholded at Z>2 at equal slices for each network in healthy subjects (A) and patients (B). Slices are presented in neurological view. Color images available online at
FNC analysis
We used FC analysis between the resting-state networks (rsFNC), described by Jafri et al. (2008). Time courses corresponding to chosen ICs were processed with Functional Network Connectivity toolbox (FNC;
We assumed that the shift of ±6 sec should cover all possible derivations in HR both in healthy participants and stroke patients. Stroke patients could have significantly delayed HR, however, previous studies have reported that the HRF peak latency did not exceeded 10–12 sec in stroke patients (Bonakdarpour et al., 2007; Gallagher et al., 2013; Siegel et al., 2015). As this delay was frequently observed as an effect of stroke, we did not analyze differences in the lags between time courses. Only the maximal values of CCs within the given shift for each pair of networks were taken for further analysis and underwent Fisher's r-to-z transformation. The correlation matrix of size 6 × 6 was computed for both groups. Spatial maps for the ICs, which showed significant differences in their functional interconnection between groups, were subjected to interest-based FC (ROI-FC) analysis.
ROI-FC analysis
ROIs were taken from the BrainSuite brain atlas structure labels, which overlapped with the ICA spatial maps selected at the previous stage. For each structural element, we estimated the number of voxels overlapping with the IC spatial map and chose the elements when the number of overlapping voxels was more than 1000. As we assumed that the stroke lesion could seriously affect FC values, we included only those structural elements with the lesion overlap less than 100 voxels for one or more subjects. All ROIs located in the left hemisphere did not pass the inclusion criteria and were excluded from further analysis. As a result, eight regions of the right hemisphere were chosen for ROI-FC analysis (Table 2). The atlas spatial maps were resliced from T1 image space to EPI space, and then, the ROI-FC analysis was performed extracting mean BOLD signal for each subject from the chosen areas from original EPI images.
MNI coordinates of the center of each element are presented. Homotopic regions marked in bold.
FC, functional connectivity; MNI, Montreal Neurological Institute; ROI, region of interest; RFP, right frontoparietal network; pDMN, posterior part of the default mode.
Twenty-eight pairwise CC were calculated between these time courses for each group after temporal bandpass filtering with the window from 0.01 to 0.1 Hz. The CC were computed with a shift of ±6 sec (2 TR) in correspondence with rsFNC analysis and the maximal value was used to compare between groups. Each value underwent Fisher r-to-z transformation. In addition, gray and white matter images were derived via the segmentation procedure by the New Segment tool (SPM8) for each ROI with the followed calculation of their volumes normalized on the whole-brain volume for each subject to test possible influence of the gray and white matter levels on the obtained rsFNC values. The FNC values that differed significantly between groups were also tested for correlation with the lesion volume.
Statistical analysis
Z-scores of CC between time courses of six networks, NoV in symmetrical components in both hemispheres, and LIs were subjected to General Linear Model with Group and Sex as categorical predictors, and Age and Lesion volume as nuisance variables. Post-hoc Tukey test was used for controlling Type I errors.
The amounts of gray and white matter in the selected ROIs and ROI-FC values were subjected to Factorial ANOVA with Group and Sex as categorical predictors.
Furthermore, Spearman correlation analysis was performed to test possible associations between the FNC, which showed significant differences among groups, the ROI-FC values, ROI gray and white matter volumes, the lesion volume, and degree of aphasia.
Results
Resting-state networks
Six components out of 30 were selected for each group as they spatially overlapped with RSNs presented in the previous studies (Beckmann et al., 2005; Damoiseaux et al., 2006; Hacker et al., 2013). These six components were classified as the visual network (VIS), the auditory network (AUD), the sensory-motor network (SMN), the default mode network (DMN), the right frontoparietal network (RFP), and the salience network (SAL). All RSNs are displayed in Figure 1. In the present study, we observed only the posterior part of DMN (pDMN) (La et al., 2015; Wang et al., 2015). The left frontoparietal network (LFP) was absent in the patient group and was not included in the further FC analysis.
Due to its partial overlap with the stroke lesion, the volume of the left AUD component was significantly less in stroke patients compared to the healthy group (p < 0.05, FDR corrected) (Supplementary Table S2 and Supplementary Fig. S2). Regions of AUD in the left hemisphere overlap with the lesion for 12/17 patients (Table S1). However, the NoV for this component in the right hemisphere was higher for stroke patients compared to healthy participants (p < 0.05, FDR corrected). The mean LI of the AUD was 0.40 for the patient group and significantly differed from the one calculated for the control group (p < 0.05, FDR corrected). This finding is also supported by values of Spearman CC, significantly different from zero, between the NoV value of the left AUD, LI score, and the lesion size (CC = –0.52 and = 0.59, respectively, p < 0.05).
Surprisingly, the volume of SMN in the left hemisphere turned out to be less for the healthy participant group in contrast with the patient group (p < 0.05, FDR corrected), and also the correlation between activation volume of SMN in the left hemisphere and lesion size was positive (CC = 0.64, p < 0.01) (Supplementary Fig. S2). The regions of SMN in the left hemisphere overlap with the lesion for 11/17 patients (Table S1). The LI scores of the VIS network did not differ significantly between groups but the activation volume in the right hemisphere appeared to be less for patients (p < 0.05, FDR corrected). The regions of VIS in the left hemisphere overlap with the lesion for 7/17 patients (Table S1).
The regions of pDMN in the left hemisphere overlap with the lesion for 11/17, respectively (Table S1). As expected, the pDMN volume was higher in the left hemisphere for healthy subjects in contrast with the group of patients (p < 0.05, FDR corrected). The significant difference for this component is also reflected in LI scores (p < 0.05, FDR corrected) (Table S2). However, NoV and LI score for pDMN did not correlate with the lesion size in patients as these values for AUD. The NoV value of the SAL varied between groups in the right hemisphere and was higher for healthy participants (p < 0.05, FDR corrected). The regions of SAL in the left hemisphere overlap with the lesion for 7/17 patients (Table S1). Although some differences of the LI values for the SAL and the pDMN networks were significant, the LIs for both groups were below the value of 0.2, which is usually used in the laterality studies (Seghier, 2008).
Group differences in rsFNC
Figure 2 illustrates the correlation matrices between six obtained networks for both groups of participants. In the group of aphasic patients, a group-averaged time course of the AUD network poorly correlated with the pDMN time course compared to the healthy group (p < 0.05, FDR corrected). The pDMN-RFP correlation was also less prominent (p < 0.05, FDR corrected) for stroke patients compared to healthy subjects. The derived values did not differ between males and females and did not correlate with age or lesion volumes.
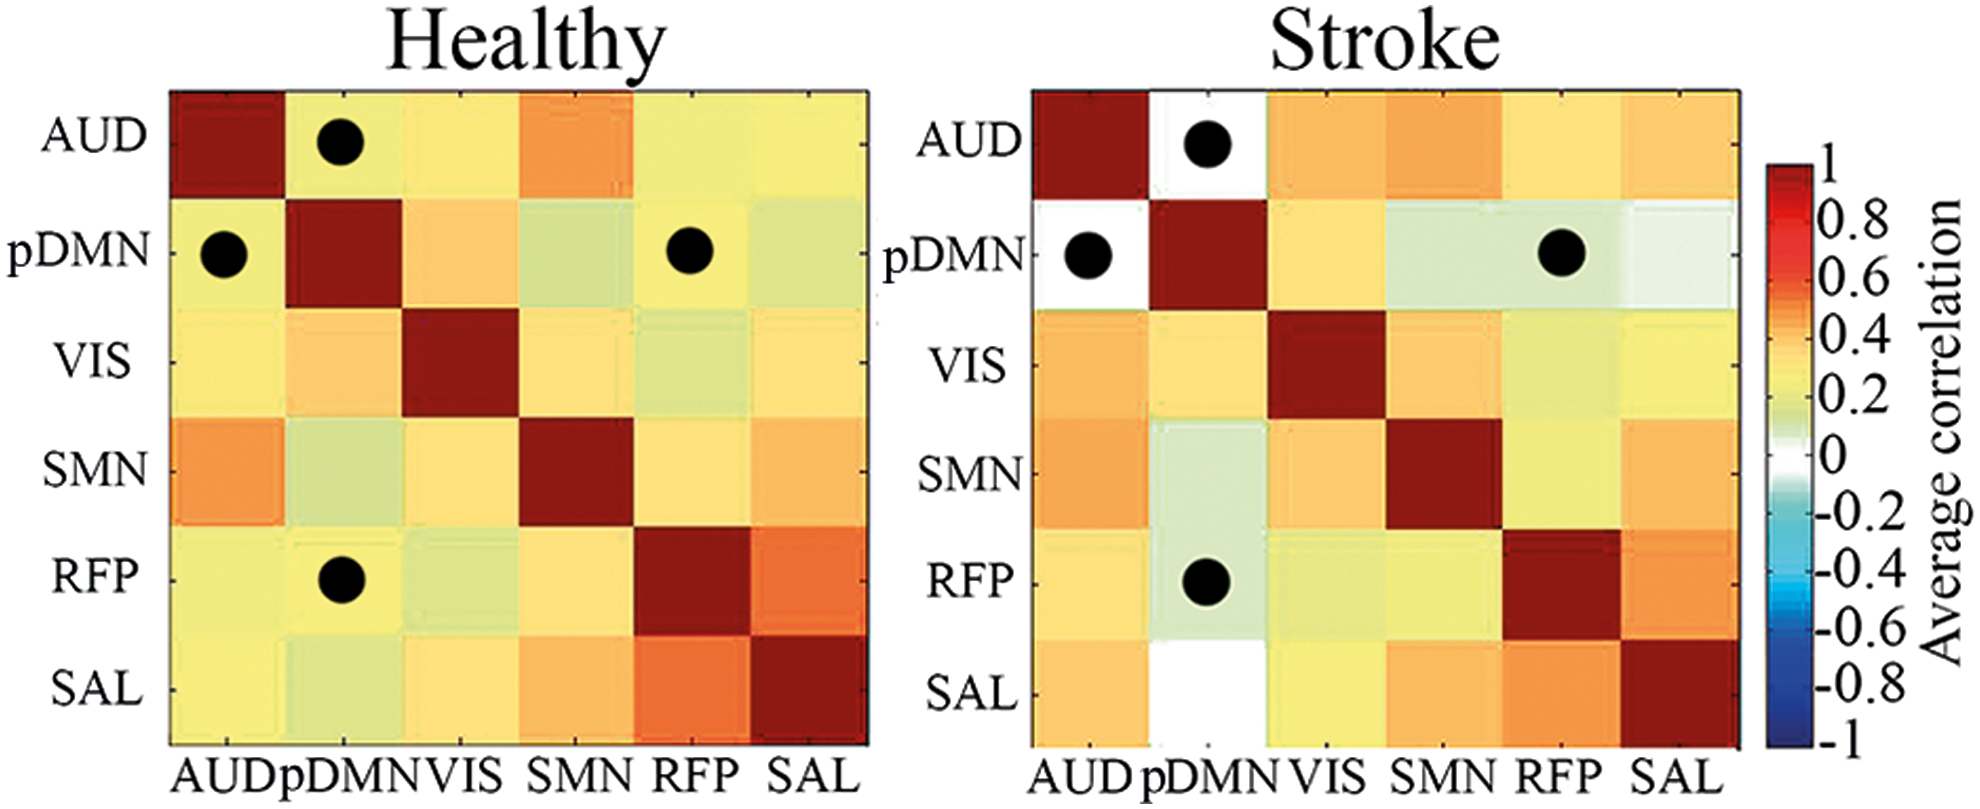
Cross-correlation maps between time courses of resting-state networks for healthy participants and stroke patients. Significant differences are marked by points. Color images available online at
Differences in ROI-FC
Table 2 contains eight ROIs of the right hemisphere that overlapped mostly with pDMN, RFP, and AUD networks for the corresponding mean spatial maps of both groups. Their left homotopic areas were not included in the ROI-FC analysis since overlapped with the lesion for several patients. According to CC calculated between these specified regions, the patient group showed significantly less FC between the right pars triangularis (part of the inferior frontal gyrus) and right superior frontal gyrus (p < 0.01, uncorrected), and between the right pars triangularis and superior frontal gyrus (p < 0.01, uncorrected) (Fig. 3a). The right pars triangularis was a part of RFP for both groups, however, it was observed in AUD network of patients, but was absent in AUD of healthy subjects. Both superior frontal gyri were present in pDMN, but only the right one was observed in patients. The superior frontal gyrus and right middle frontal gyrus were observed for RFP activation in both groups (Table 2).

FC of right pars triangularis (rPTr) with right middle frontal gyrus (rMFG) and right superior frontal gyrus (rSFG).
The amount of gray and white matter volumes in the right supramarginal gyrus normalized on the whole-brain volume was significantly higher for aphasic patients in contrast to healthy controls (p < 0.05, FDR corrected), while other volumes of the selected ROIs did not differ significantly between groups (Fig. 3b). Important to note that the activation in the supramarginal gyri was observed as a part of AUD, pDMN, and RFP in the healthy group, while in patients, we found only the right supramarginal gyrus activation in RFP (Table 2).
Correlations between rsFNC, ROI-FC, and severity of aphasia in patients
The Spearmen correlation analysis showed a significant negative association between the mean NoV values in the RFP component and degree of aphasia (CC = –0.52, p < 0.05), indicating that increased NoV of RFP coincided with less severe speech impairment. The pDMN-RFP FC positively correlated with FC values of the right pars triangularis with the right superior and middle frontal gyri (CC = 0.45 and 0.47, p < 0.01; Fig. 3), implying that the more rsFNC increased between pDMN and RFP the more FC increased between three subregions of these networks in the right hemisphere. Gray and white matter volumes of the right supramarginal gyrus showed negative correlation with the severity of aphasia (CC = −0.51 and −0.63, respectively; p < 0.05; Fig. 3) in patients.
Discussion
In the current study, we performed ICA and subsequent rsFNC analysis (Jafri et al., 2008) to compare patterns of brain activity at rest in the left hemisphere stroke patients with aphasia and the healthy baseline. We chose similar ICs corresponding to well-known networks (Beckmann et al., 2005) in patients and healthy participants. Using ICA and RSN spatial templates, we isolated six RSNs in both groups of participants: pDMN, VIS, AUD, SMN, RFP, and SAL and performed rsFNC analysis on their time courses.
After applying the rsFNC analysis to the time courses of the obtained RSNs, we found a lack of correlation between the pDMN and the AUD in the group of aphasic patients compared to healthy control. The pDMN size of activation was also attenuated in the left hemisphere of patients but did not show significant correlation with the lesion volume. The regions of AUD and pDMN in the left hemisphere overlapped with the lesion for 12/17 patients and 11/17 patients, respectively (Table S1).
Moreover, the AUD was the only network found to be right lateralized in the group of patients with LI equal to 0.4. The volume of the AUD was less in the left hemisphere for patients as it was expected and this fact is confirmed by a significant negative correlation between the lesion size and the AUD volume in the left hemisphere. The pDMN activation was also significantly decreased in the left hemisphere in the patient group. Thus, the significant decrease in FC between the pDMN and AUD at the group level in patients could be directly influenced by the lesion size and location in the left hemisphere. The other significant finding of rsFNC analysis was the decreased correlation between pDMN and RFP in patients compared to healthy subjects. We also performed ROI-FC analysis on structural elements overlapping mostly with pDMN, RFP, and AUD in the right hemisphere. This analysis was done to check whether the decreased network interaction reflects altered connectivity not only in the impaired areas of the networks in the left hemisphere but also in the intact homotopic areas as well.
As a result, we obtained decreased FC within two pairs of areas located in the right frontal lobe: the pars triangularis and the middle frontal gyrus, the pars triangularis and the superior frontal gyrus. Besides the primary and secondary auditory cortices, which might be directly integrated in speech perception, the areas of the AUD network also involved bilateral insula, prefrontal and sensorimotor cortices that often intersect with a specific language network. Although in the current study we did not observe the language network, the AUD network of patients included right pars triangularis–homotopic area of Broca in the right hemisphere. The RFP network also included the right pars triangularis in both groups. The middle and superior frontal gyri were observed in the RFP network for both groups of participants (Table 2). However, Spearman correlation analysis did not show an association between FC of the AUD-pDMN and FC of the ROIs mentioned above, as there was no significant dependence of ROI-FC values and rsFNC values for AUD-pDMN coupling on severity of aphasia.
Thus, it is more likely that the lesion in the left hemisphere resulted in the decrease of AUD-pDMN FC in aphasic patients. In addition, it might be a reflection of the altered interhemispheric connectivity or intraconnectivity in the left hemisphere, rather than an impaired connectivity of these two networks in the right intact hemisphere. Preserved interhemispheric connectivity of anterior temporal lobe (a part of AUD) was also indicative of better performance of aphasic stroke patients in language tasks (Warren et al., 2009). Tuladhar et al. (2013) reported about a reduced FC between the left medial temporal lobe, posterior cingulate, and medial prefrontal cortical areas within the DMN in stroke patients. However, we cannot fully confirm that altered rsFNC between AUD and pDMN networks in our study was influenced by interhemispheric changes in FC, since we did not measure conventional FC between hemispheres or within the left hemisphere.
Although rsFNC and ROI-FC for AUD-pDMN was decreased at the group level for patients, these values did not correlate significantly with aphasia severity. However, both networks contribute to the language function at different extents. Damage of the superior temporal cortex (a part of AUD) in stroke patients reduced the ability to comprehend spoken sentences (Leff et al., 2009). Various single-task investigations have found that certain DMN components can show semantic sensitivity (Seghier and Price, 2012; Seghier et al., 2010; Shapira-Lichter et al., 2013; Wirth et al., 2011).
Rather more solid findings of the present study relate to the altered connectivity between pDMN and RFP networks as well as between their subregions in the right hemisphere. Values of pDMN-RFP FC positively correlated with FC of the right pars triangularis, right superior and middle frontal gyri. This fact implies that a higher increase in rsFNC between pDMN and RFP if followed by higher increase FC between three subregions of these networks in the right hemisphere. In addition, aphasia severity scores were less, the more the size of RFP in the patient group. These results support a hypothesis about the inseparable role of attention and cognitive control systems in compensation of impaired language functions (Brownsett et al., 2014). The frontoparietal network usually encompasses regions identified as supporting cognitive control and decision-making processes, including the lateral prefrontal cortex and the inferior parietal lobule (Kroger et al., 2002; Vincent et al., 2008).
Zhu et al. (2014) report the decreased intrinsic connectivity within the LFP in aphasic patients associated with reduced comprehension ability. They found reduced FC between the LFP and the right middle frontal cortex and medial frontal cortex in aphasic patients. In our study, the RFP volume negatively correlated with degree of aphasia, suggesting that RFP might be associated with mechanisms of cognitive control trying to compensate impaired language function at the subacute and chronic stages of stroke. Data of the task-induced fMRI activity also support the latter assumption. At least some of the activity observed in aphasic patients may relate to greater engagement of intact executive and attentional networks in language tasks (Brownsett et al., 2014; Wise, 2003).
As it was discussed in relation to pDMN-AUD coupling, DMN-frontoparietal network integrated activity may also play a role in the language function. Xu et al. (2016) have recently proposed functional architecture for semantic processing basing on 120 neuroimaging studies. The main concept of this framework lies in the interaction of three networks: the DMN, LFP, and the perisylvian network. Authors claim that the following three major hubs link these networks: the angular gyrus, superior frontal, and middle frontal gyri of the left hemisphere. In case of our study, these areas overlapped with lesion and the disrupted connectivity of these hubs might result in the altered connectivity between pDMN and RFP.
Despite the absence of significant correlations between values of rsFNC for pDMN-RFP and their ROI-FC with degree of aphasia, we found increased volumes of gray and white matter in right supramarginal gyrus in patients, and these volumes showed negative correlation with the severity of aphasia. The supramarginal gyri are spatially interposed between the AUD and the pDMN. In the current study, they were observed in all three selected networks of healthy subjects, but only in RFP of patients. The increased gray and white matter volumes in right supramarginal gyrus and its negative correlation with the severity of aphasia might also indicate compensatory poststroke changes in the intact hemisphere. Within the semantic framework described by Xu et al. (2016), the left supramarginal gyrus was responsible for the connection between DMN and LFP. An impairment of this area in LFP might cause a function transfer to the homotopic area of the right hemisphere and resulted in the compensatory increase of the white and gray matter volumes.
In patients, the increased activation was also observed for VIS and SAL networks in the right hemisphere in contrast with the control group, but no relatiosnip with the lesion size was found for these components. Frequent observations of the increased activity of the undamaged hemisphere in stroke patients, associated with better cognitive performance (Chollet et al., 1991; Gerloff et al., 2006; Maiorova et al., 2013; Tombari et al., 2004; Ward et al., 2003), additionally support the assumption that compensatory mechanisms are associated with interhemispheric interactions and the increase of the intact hemispheric activity.
It is important to note that this increased activity might be also the result of the compensative increase general attention and executive functions rather than specific language functions at the chronic stage of stroke. For example, activity in response to a language task, observed in the homotopic regions of Broca's and Wernicke's areas, may reflect not only the partial language-specific recovery but also the impact of domain-general control-executive system (Geranmayeh et al., 2014). Although the number of findings relates a successful language recovery in aphasia to the right hemisphere activity (Abo et al., 2004; Gold and Kertesz, 2000; Teki et al., 2013; Weiller et al., 1995), the greatest activity may be observed in the right homotopic Broca's area in those patients who have shown the least recovery because they have the greatest difficulty with task performance (Geranmayeh et al., 2014).
Unlike the increased activation of AUD and RFP in the right hemisphere, the SMN volume was higher for the left hemisphere in patients compared to the control group. The SMN volume in the left hemisphere was also correlated positively with the lesion size. These findings may be relevant to the reorganization of primary motor areas to ipsilateral basic movement parameters as previously observed for stroke patients (Chollet et al., 1991; Fridman et al., 2004). However, we cannot confirm this assumption by our data (for instance, by adding additional correlation with motor recovery) since we were limited to acquire motor performance scores in the patients who participated in the current study.
In summary, our results prove the efficiency of the rsFNC method for studying aphasia since it may potentially indicate abnormal FC. The rsFNC helps to avoid the calculation of the direct FC between damaged and undamaged hemispheres but still reflects whole-brain changes. This type of analysis is independent of task design and performance and highlights the aphasia-related whole-brain changes caused both by the damage itself and by the reorganization of the contralesional structural elements.
Conclusion
We found decreased FC between pDMN-AUD and pDMN-RFP networks in aphasic patients at the subacute and chronic stages of stroke. The lesion in the left areas of AUD and pDMN differentially influenced abnormal connectivity between these networks. In addition, the FC values of the right pars triangularis with right middle and right superior frontal gyri were decreased in aphasic patients and directly correlated with pDMN-RFP connectivity.
Our results suggest that abnormal FC in stroke patients may reflect the impairment of activity not only in the regions directly affected by stroke lesion in the left hemisphere but also in the homotopic regions of the intact right hemisphere. On the contrary, the gray and white matter volumes of the right supramarginal gyrus, which was active only in RFP resting-state network of patients, were higher in patients and negatively correlated with severity of aphasia. The increase of actual volume of gray and white matter in the right supramarginal gyrus might play a compensative role of the transfer of attention and executive functions from the damaged areas in the left hemisphere to the right homotopic areas, which is accompanied by the more preserved language skills.
Footnotes
Acknowledgments
This work was supported by the Russian Foundation for Humanities (Grant No 14-06-00747) and by the Russian Academic Excellence Project “5-100.” The funders had no role in the study design, data collection and analysis, decision to publish, or preparation of the manuscript. We thank our, colleagues from the Center of Speech Pathology and, in particular, the radiologist, Oksana Fedina, for her help with the performance of fMRI experiments and analysis of brain lesions. We express our deepest acknowledgment to all volunteers and patients for their participation in the study. We also show our gratitude to Larisa Mayorova for the inspiration of the study.
Author Disclosure Statement
No competing financial interests exist.
References
Supplementary Material
Please find the following supplemental material available below.
For Open Access articles published under a Creative Commons License, all supplemental material carries the same license as the article it is associated with.
For non-Open Access articles published, all supplemental material carries a non-exclusive license, and permission requests for re-use of supplemental material or any part of supplemental material shall be sent directly to the copyright owner as specified in the copyright notice associated with the article.