
Abstract
In typical functional connectivity studies, connections between voxels or regions in the brain are represented as edges in a network. Networks for different subjects are constructed at a given graph density and are summarized by some network measure such as path length. Examining these summary measures for many density values yields samples of connectivity curves, one for each individual. This has led to the adoption of basic tools of functional data analysis, most commonly to compare control and disease groups through the average curves in each group. Such group differences, however, neglect the variability in the sample of connectivity curves. In this article, the use of functional principal component analysis (FPCA) is demonstrated to enrich functional connectivity studies by providing increased power and flexibility for statistical inference. Specifically, individual connectivity curves are related to individual characteristics such as age and measures of cognitive function, thus providing a tool to relate brain connectivity with these variables at the individual level. This individual level analysis opens a new perspective that goes beyond previous group level comparisons. Using a large data set of resting-state functional magnetic resonance imaging scans, relationships between connectivity and two measures of cognitive function—episodic memory and executive function—were investigated. The group-based approach was implemented by dichotomizing the continuous cognitive variable and testing for group differences, resulting in no statistically significant findings. To demonstrate the new approach, FPCA was implemented, followed by linear regression models with cognitive scores as responses, identifying significant associations of connectivity in the right middle temporal region with both cognitive scores.
Introduction
I
In network-based approaches to this problem, groupings of spatial locations are represented as nodes in a graph, and edges between nodes represent a high level of time series similarity between the constituent nodes. We consider connectivity at the local level, where the nodes are individual voxels within a specific brain region (Meskaldji et al., 2011; Kaiser, 2011), complementing previous quantifications of short-range connectivity such as regional homogeneity (Zang et al., 2004) and local functional connectivity density mapping (Tomasi and Volkow, 2010). Similarity is quantified by the Pearson correlation, as is common in fMRI analyses (Achard et al., 2006; Bassett and Bullmore, 2006; Buckner et al., 2009; Tomasi and Volkow, 2011; van den Heuvel et al., 2008; Worsley et al., 2005; Zalesky et al., 2012). Once such a graph is constructed, functional connectivity can be quantified in terms of a wide variety of summary measures of graph characteristics, which we refer to as network connectivity measures (Sporns, 2011). These measures are useful for identifying common topological properties in functional brain networks. In addition, it is of great interest to study relationships between the connectivity measures and age, cognitive functioning, genetics, and physical health of the individuals receiving fMRI scans, thus investigating the relationships between brain organization and other characteristics of the individual.
Because the similarity between two nodes in a network is measured on a continuous scale, network edges are often instantiated by comparing these similarities with a threshold (Buckner et al., 2009; Tomasi and Volkow, 2011; van den Heuvel et al., 2008). When network connectivity measures are used to compare the networks of different subjects, the prevailing approach is to use subject-specific thresholds so that the resulting networks have the same density, that is, an equal number of edges (Bassett et al., 2012; Hosseini et al., 2012a; Van Wijk et al., 2010). While some studies have conducted network analyses by choosing a single density (Bassett et al., 2009), it is more common to construct and compare networks over a range of density values (Bassett et al., 2006; Ginestet et al., 2011; Hosseini and Kesler, 2013; Hosseini et al., 2012a; Klimm et al., 2014; Lynall et al., 2010; Siebenhühner et al., 2013; Singhet al., 2013; Yu et al., 2011). In this case, the connectivity measure used to summarize the network is a function of the density, so that methods of functional data analysis (FDA) are applicable [for an introduction to FDA, see, e.g., Ramsay and Silverman (2005)]. The usefulness of these methods in connectivity studies was first observed in Bassett et al. (2012).
However, the full power of functional data analysis in connectivity and other neuroimaging studies is yet to be utilized, especially in the context of relating connectivity to other variables. Specifically, the ubiquitous approach for comparing two groups (e.g., healthy/diseased or young/elderly) is to compare their mean connectivity curves through a permutation test (Bassett et al., 2012; Hosseini and Kesler, 2013; Hosseini et al., 2012a; Klimm et al., 2014; Siebenhühner et al., 2013; Singh et al., 2013). An alternative is the so-called “area under the curve” or cost integration approach (Ginestet et al., 2011), although there is a consensus that the resulting inference is less powerful as it is less sensitive to curve shape. While such tests of group mean differences have yielded interesting scientific findings, they are insufficient for identifying differences in variance, for example, or, more importantly, for inferring relationships with a continuous covariate such as age. For example, it is of great interest to study the magnitude and direction of associations between individual connectivity and various outcomes, such as test scores of episodic memory, executive function, and other cognitive measures.
Since permutation tests for group differences are inadequate to address these questions, we propose to use functional principal component analysis (FPCA), which transforms the connectivity of each subject into a subject-specific vector of so-called functional principal component (FPC) scores. In turn, this allows one to formulate regression models where these scores that quantify subject-specific connectivity serve as predictors or responses. Another advantage of these subject-specific FPC scores is the enhanced ability to visualize the variability in connectivity between subjects. For example, examining the joint and marginal distributions of the FPC scores can aid in detecting subgroups and identifying outliers, among other applications, which are extremely difficult tasks to perform with the raw sample of curves. In addition, the effects of the FPC scores on curve shape can be easily visualized, lending interpretability to the regression models.
Due to the known effect of normal aging on connectivity (Betzel et al., 2014; Cao et al., 2014; Ferreira and Busatto, 2013), differences in connectivity between disease and control groups are only meaningful if these groups are age matched. For data that are not age matched, there is no convenient method for incorporating age as a nuisance covariate when testing for group differences in mean curves. However, when implementing the proposed FPCA regression approach to investigate the effects of network connectivity on cognitive performance, one must consider that cognitive performance also declines with age. In this setting, the confounding effect of age can be adjusted for easily by including age as covariate in the regression model. We describe the different aspects of FPCA regression analysis in the Materials and Methods section and demonstrate its various advantages, including the convenience of the adjustment for age and other covariates, in the Results section.
Materials and Methods
Participants
This study included 341 elderly participants in a longitudinal study of cognitive impairment that has been described previously (Hinton et al., 2010). All participants were evaluated within the research program of the University of California, Davis Alzheimer's Disease Center (UCD ADC). Clinical evaluation of this cohort, including the neuropsychological test battery, has been described previously (He et al., 2012). Tables 1 and 2 contain statistical summaries of the groups under comparison in the Group Differences section.
fMRI acquisition
Participants received one fMRI scan (He et al., 2012) at the UC Davis Imaging Research Center on a 1.5T GE Signa Horizon LX Echospeed system. Participants received an 8-min axial echo-planar imaging BOLD fMRI scan and were provided with no specific instructions before the acquisition other than to keep their eyes open. Scan parameters were as follows: TR 2.0 sec, TE 40 msec, FOV 22 cm, Flip angle 90°, 24 5-mm thick contiguous slices with bandwidth 62.5 KHz, and 64 × 64 matrix with R-L frequency encode direction. This sequence provided 240 time points of data at each voxel.
fMRI preprocessing
The preprocessing steps for each scan include correction for differences in slice timing, correction for head motion, and coregistration to the subject's 3DT1 MRI scan. Multiple linear regression was applied to the signal at each voxel to remove the global linear trend (to account for signal drift) along with two other global signals corresponding to cerebral spinal fluid and white matter. Finally, each signal was band-pass filtered to preserve frequency components between 0.01 and 0.08 Hz. Temporal and spatial processing of the fMRI data were performed in Statistical Parametric Mapping (SPM8,
Graph construction and connectivity measures
In our experiments, we considered connectivity within local hubs corresponding to 10 anatomic regions previously identified in Buckner et al. (2009) as functional connectivity hubs. The identification of these hubs, or regions with an abnormally large number of functional connections, is important to understand the integration of distinct processes and networks in the brain, as well as their relationships with disease, for example. A natural follow-up question is how to quantify the strength or integrity of a particular hub at the subject or group level and how to relate it to external variables such as age or cognitive function. To address this in the current study, for each of the 10 hubs mentioned, a local network was constructed by isolating a 11 × 11 × 11 cube of voxels centered at the corresponding seed voxel listed in Table 3 of Buckner et al., 2009; nongray matter voxels were then discarded using a template. This resulted in 10 networks for each subject, with the number of nodes ranging between 610 and 1331 voxels. We remark that, while distinct hub locations may differ in the number of network nodes, the number of nodes in any particular hub is the same across all subjects. This is an important consideration, since it is known that networks with an unequal number of nodes cannot be compared equitably (Van Wijk et al., 2010).
For each of these sets of voxels, we used the Pearson correlation between the signals at two voxels as a similarity measure. In previous work (Ginestet et al., 2011), it has been noted that positive correlations imply different biological processes than negative correlations. In our analyses, we focused on positive correlations only and, accordingly, all negative correlations were effectively set to 0, as has been done in other studies (Bruno et al., 2012; Fan et al., 2011; He et al., 2007; Hosseini et al., 2012b). Denoting by N the total number of possible connections and by M the number of positive correlations in the network, for a given graph density value
For each of the 10 distinct networks, the range of network densities considered was an interval
Before carrying out the analyses, subjects with poor data quality (e.g., presence of constant signals after preprocessing) were identified and removed. For each subject, the percentage of signals that were constant was computed separately for each of the 10 hubs. If any of these percentages were greater than 1%, the individual was considered an outlier and removed. This resulted in the removal of 9 subjects, leaving 332 subjects for the analysis.
Functional principal component analysis
For a fixed hub, let
where the functions
To reduce the function Xi
to a finite sequence of scores
Relationships between network connectivity and cognition
The goal of the experiments in the Results section is to relate the network connectivity measures to scientifically relevant outcomes of interest: two continuous standardized measures of cognitive functioning that assess episodic memory and executive function. We compare traditional group difference methodology and the proposed FPCA technique in their ability to capture and quantify these associations.
For each of the 10 hubs considered for network construction, we obtained samples of network connectivity measure functions, as outlined in the Graph Construction and Connectivity Measures section, using all
Results
Group differences
For both episodic memory and executive function, the low- and high-performing groups were compared for each combination of hub and network connectivity measure, for a total of 40 tests per cognitive score. After correcting these p-values using false discovery rate (FDR) with
Average network connectivity curves in the RMT hub for low (solid line) and high (dashed line) episodic memory score groups. Permutation tests revealed no significant difference, as the means are virtually identical, while the FPCA analyses were significant. Corresponding curve comparisons for groups defined by executive function are indistinguishable, so they are not shown in this study. FPCA, functional principal component analysis; RMT, right middle temporal.
Functional principal component analysis
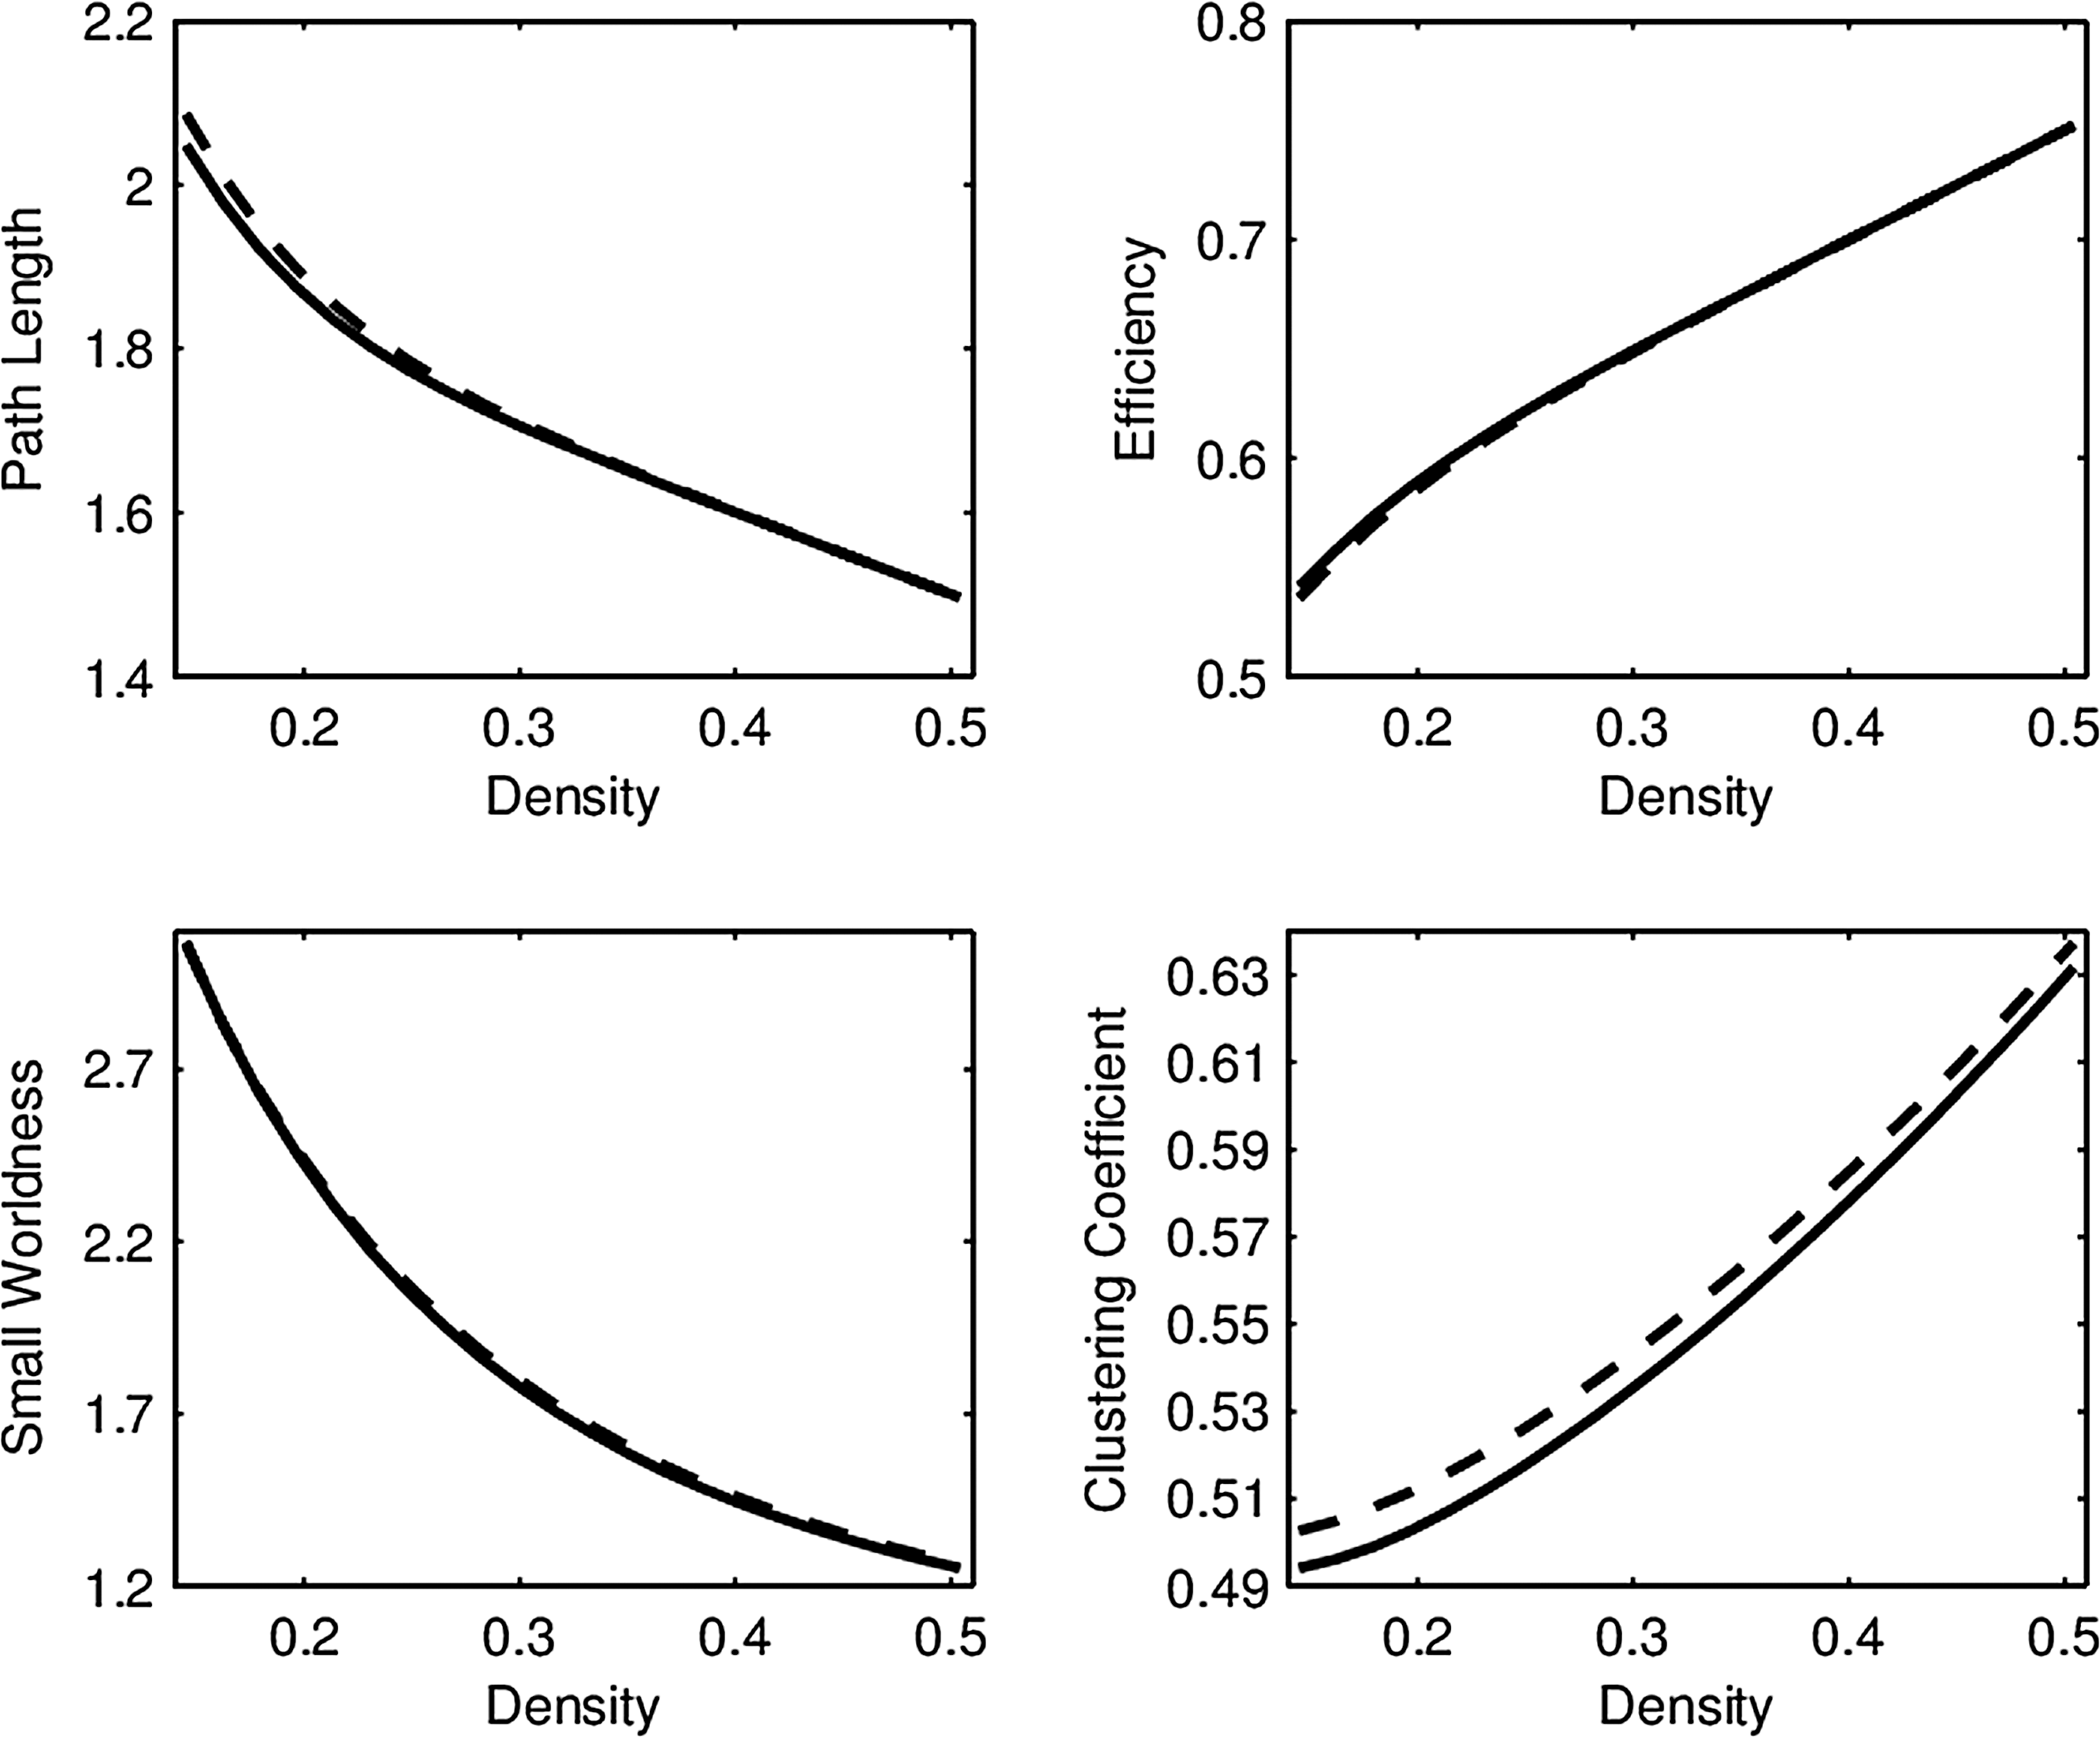
For each of the four network connectivity measures, the distribution of connectivity functions in the sample for the RMT hub is visualized in Figure 2 by a functional version of the box plot (Hyndman and Shang, 2012). Figure 3 shows the mean network connectivity curves for each measure for all subjects combined, as opposed to the group means in Figure 1. Plots for the other hubs can be done similarly; these are shown due to the significance of this hub in the ensuing regression models. The minimum and maximum densities for this hub were
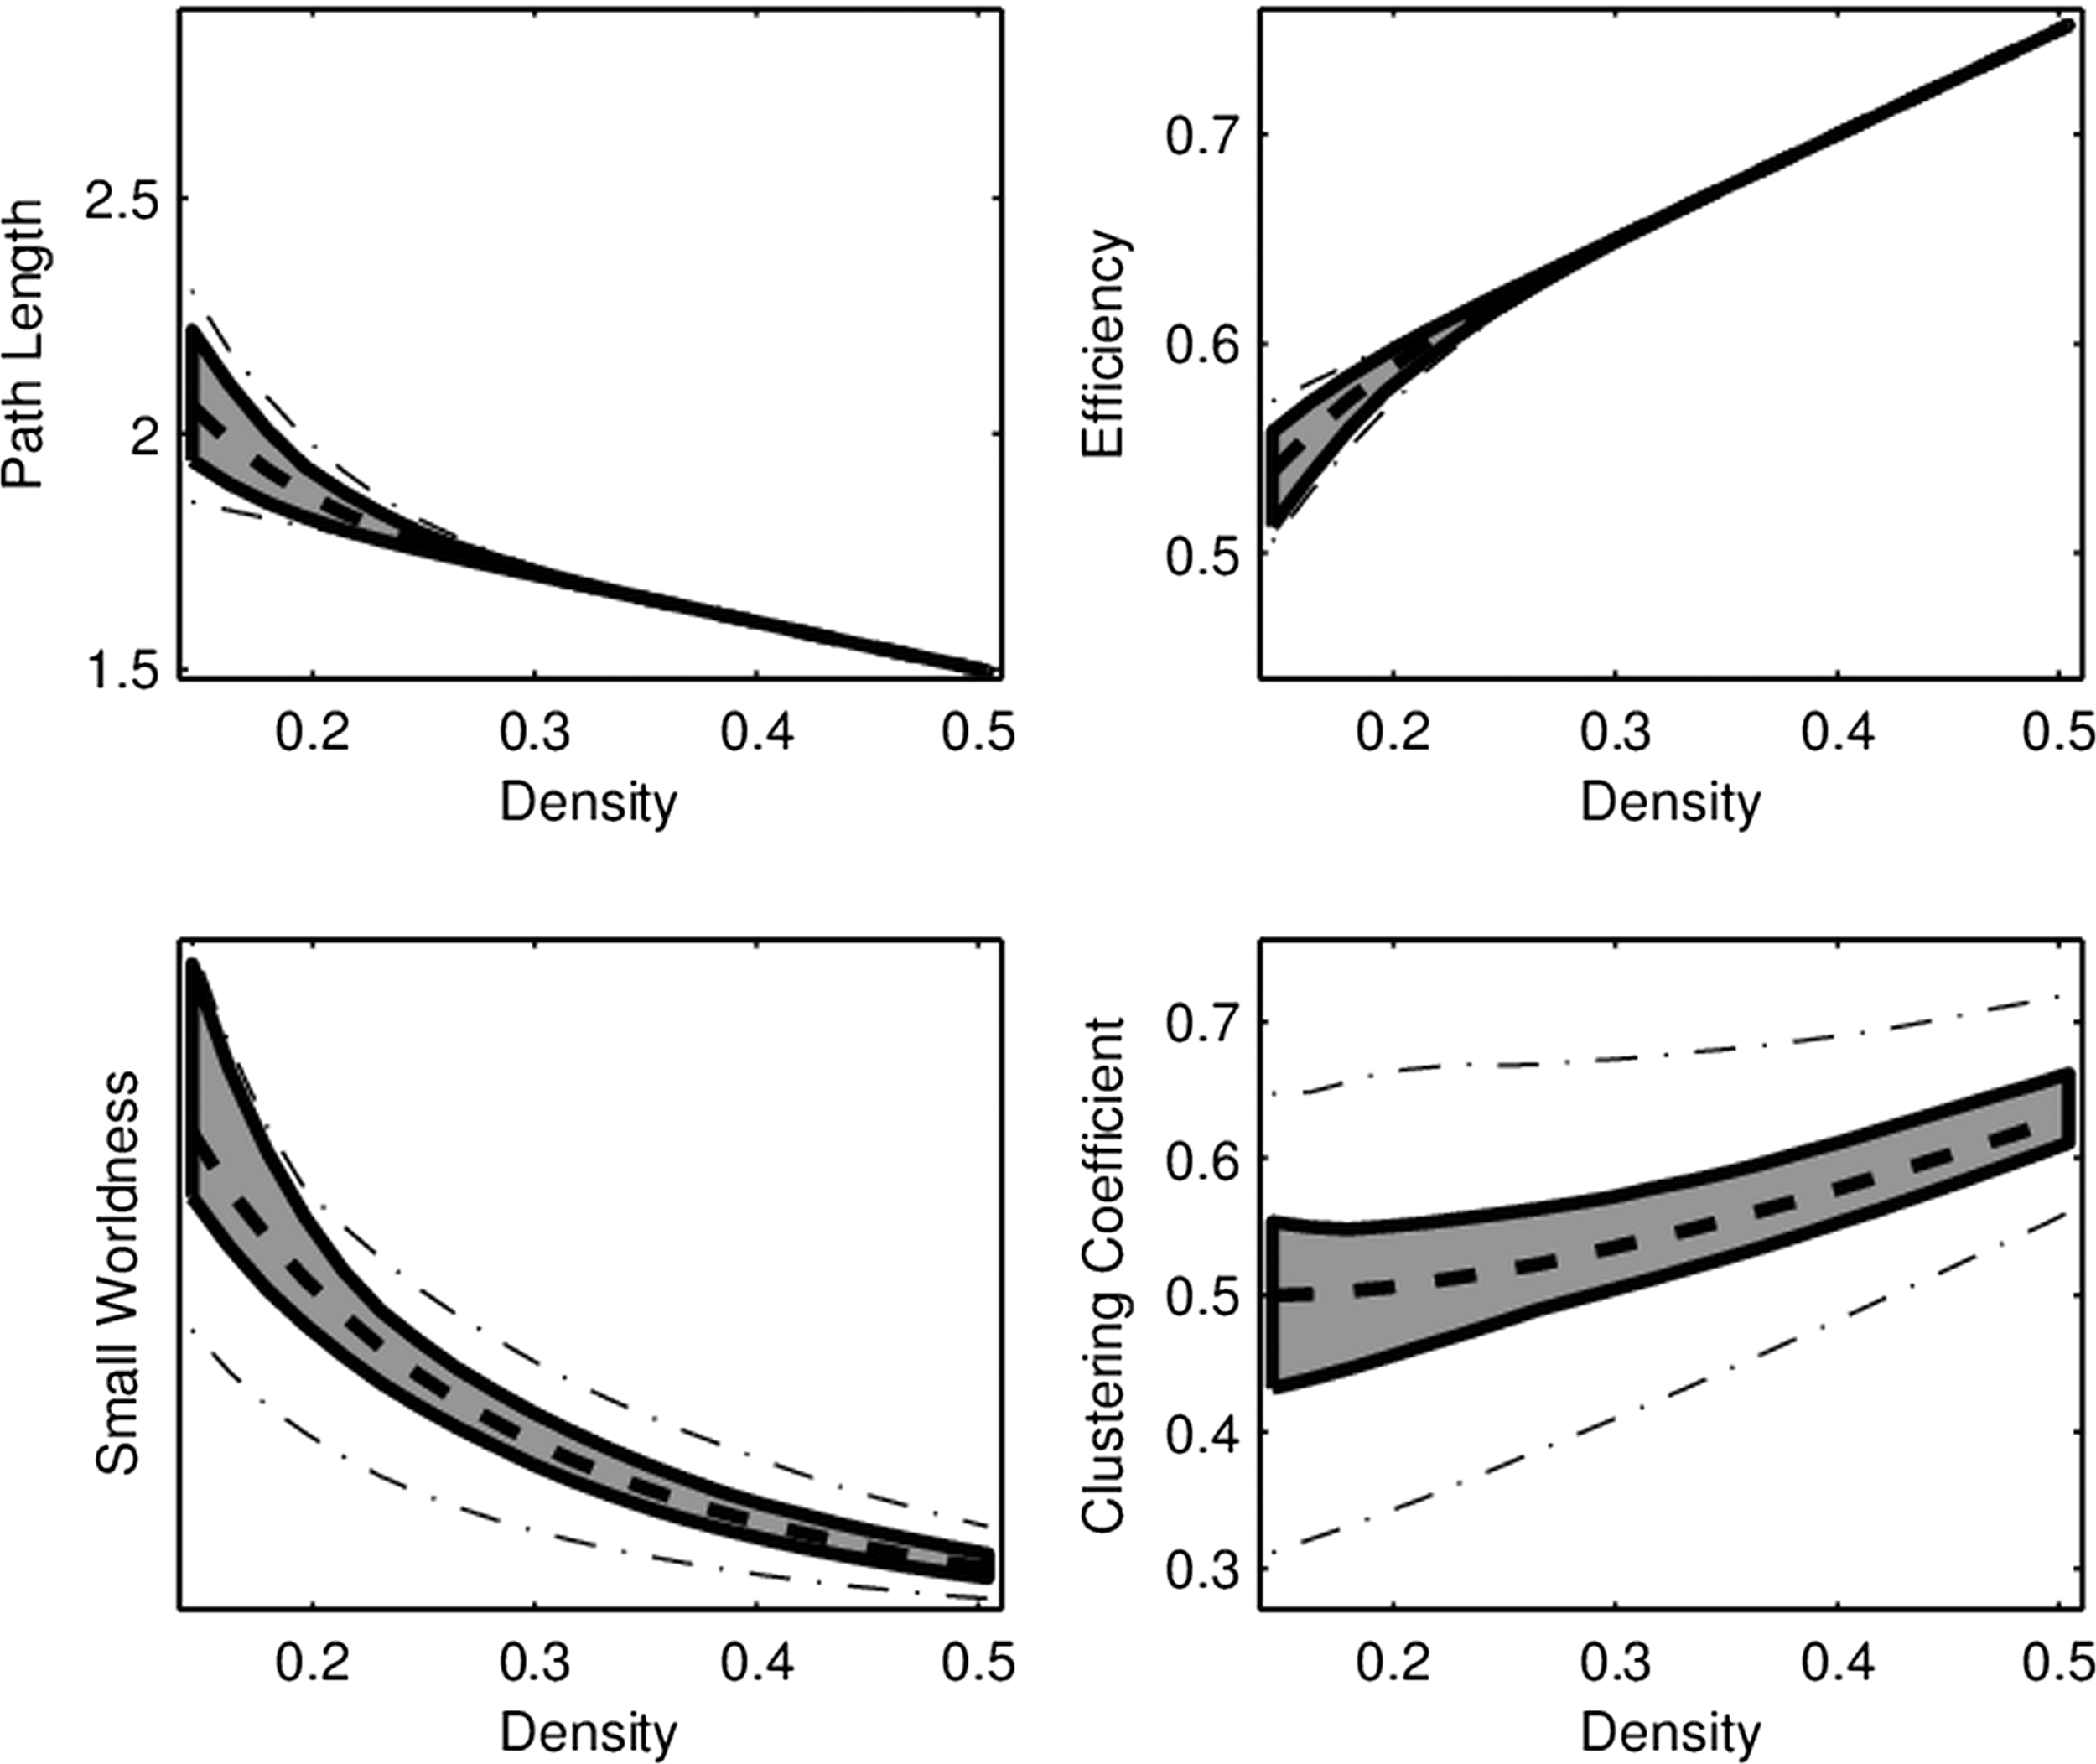
Functional box plot of network connectivity curves in the RMT hub as a function of density. Similar to the box in a standard box plot, the gray region marks the area covered by the middle 50% of curves. The dashed line corresponds to the “median” curve, while the “whiskers” correspond to the dash-dotted lines.
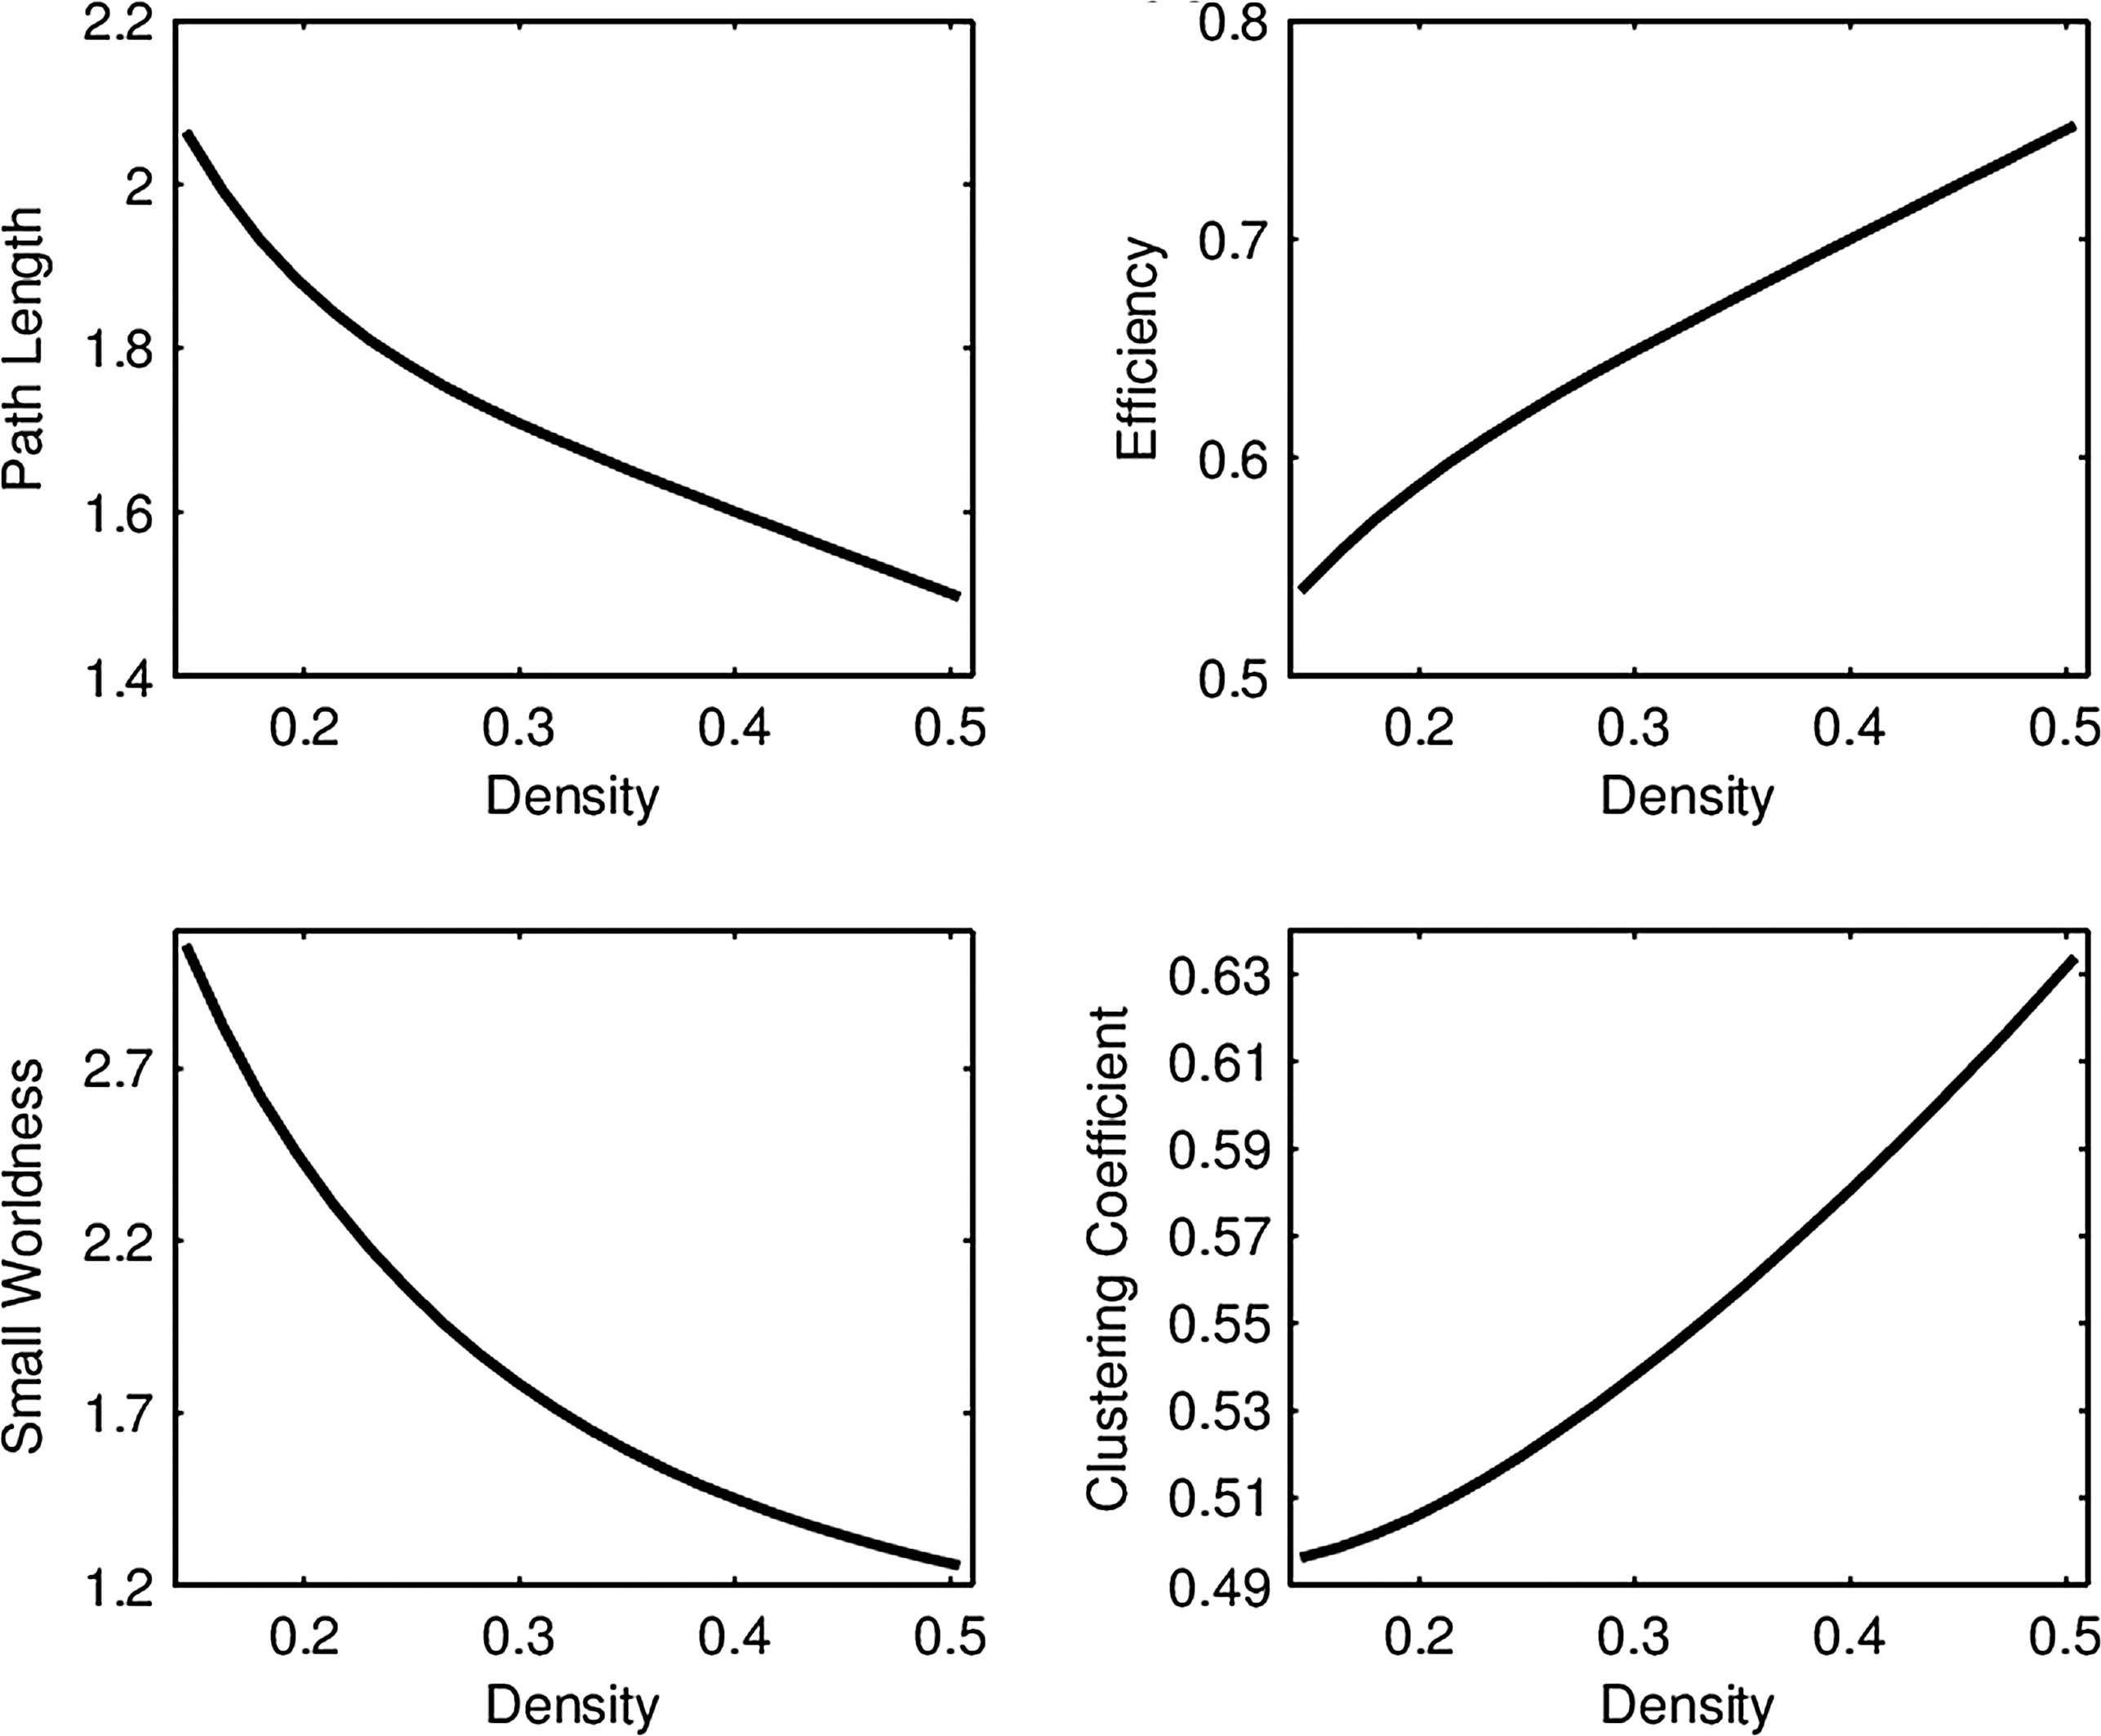
Average network connectivity curves in the RMT hub using all subjects.
Unlike group differences, where the mean curve in each group is most relevant (Fig. 1), the important objects in FPCA are the eigenfunctions
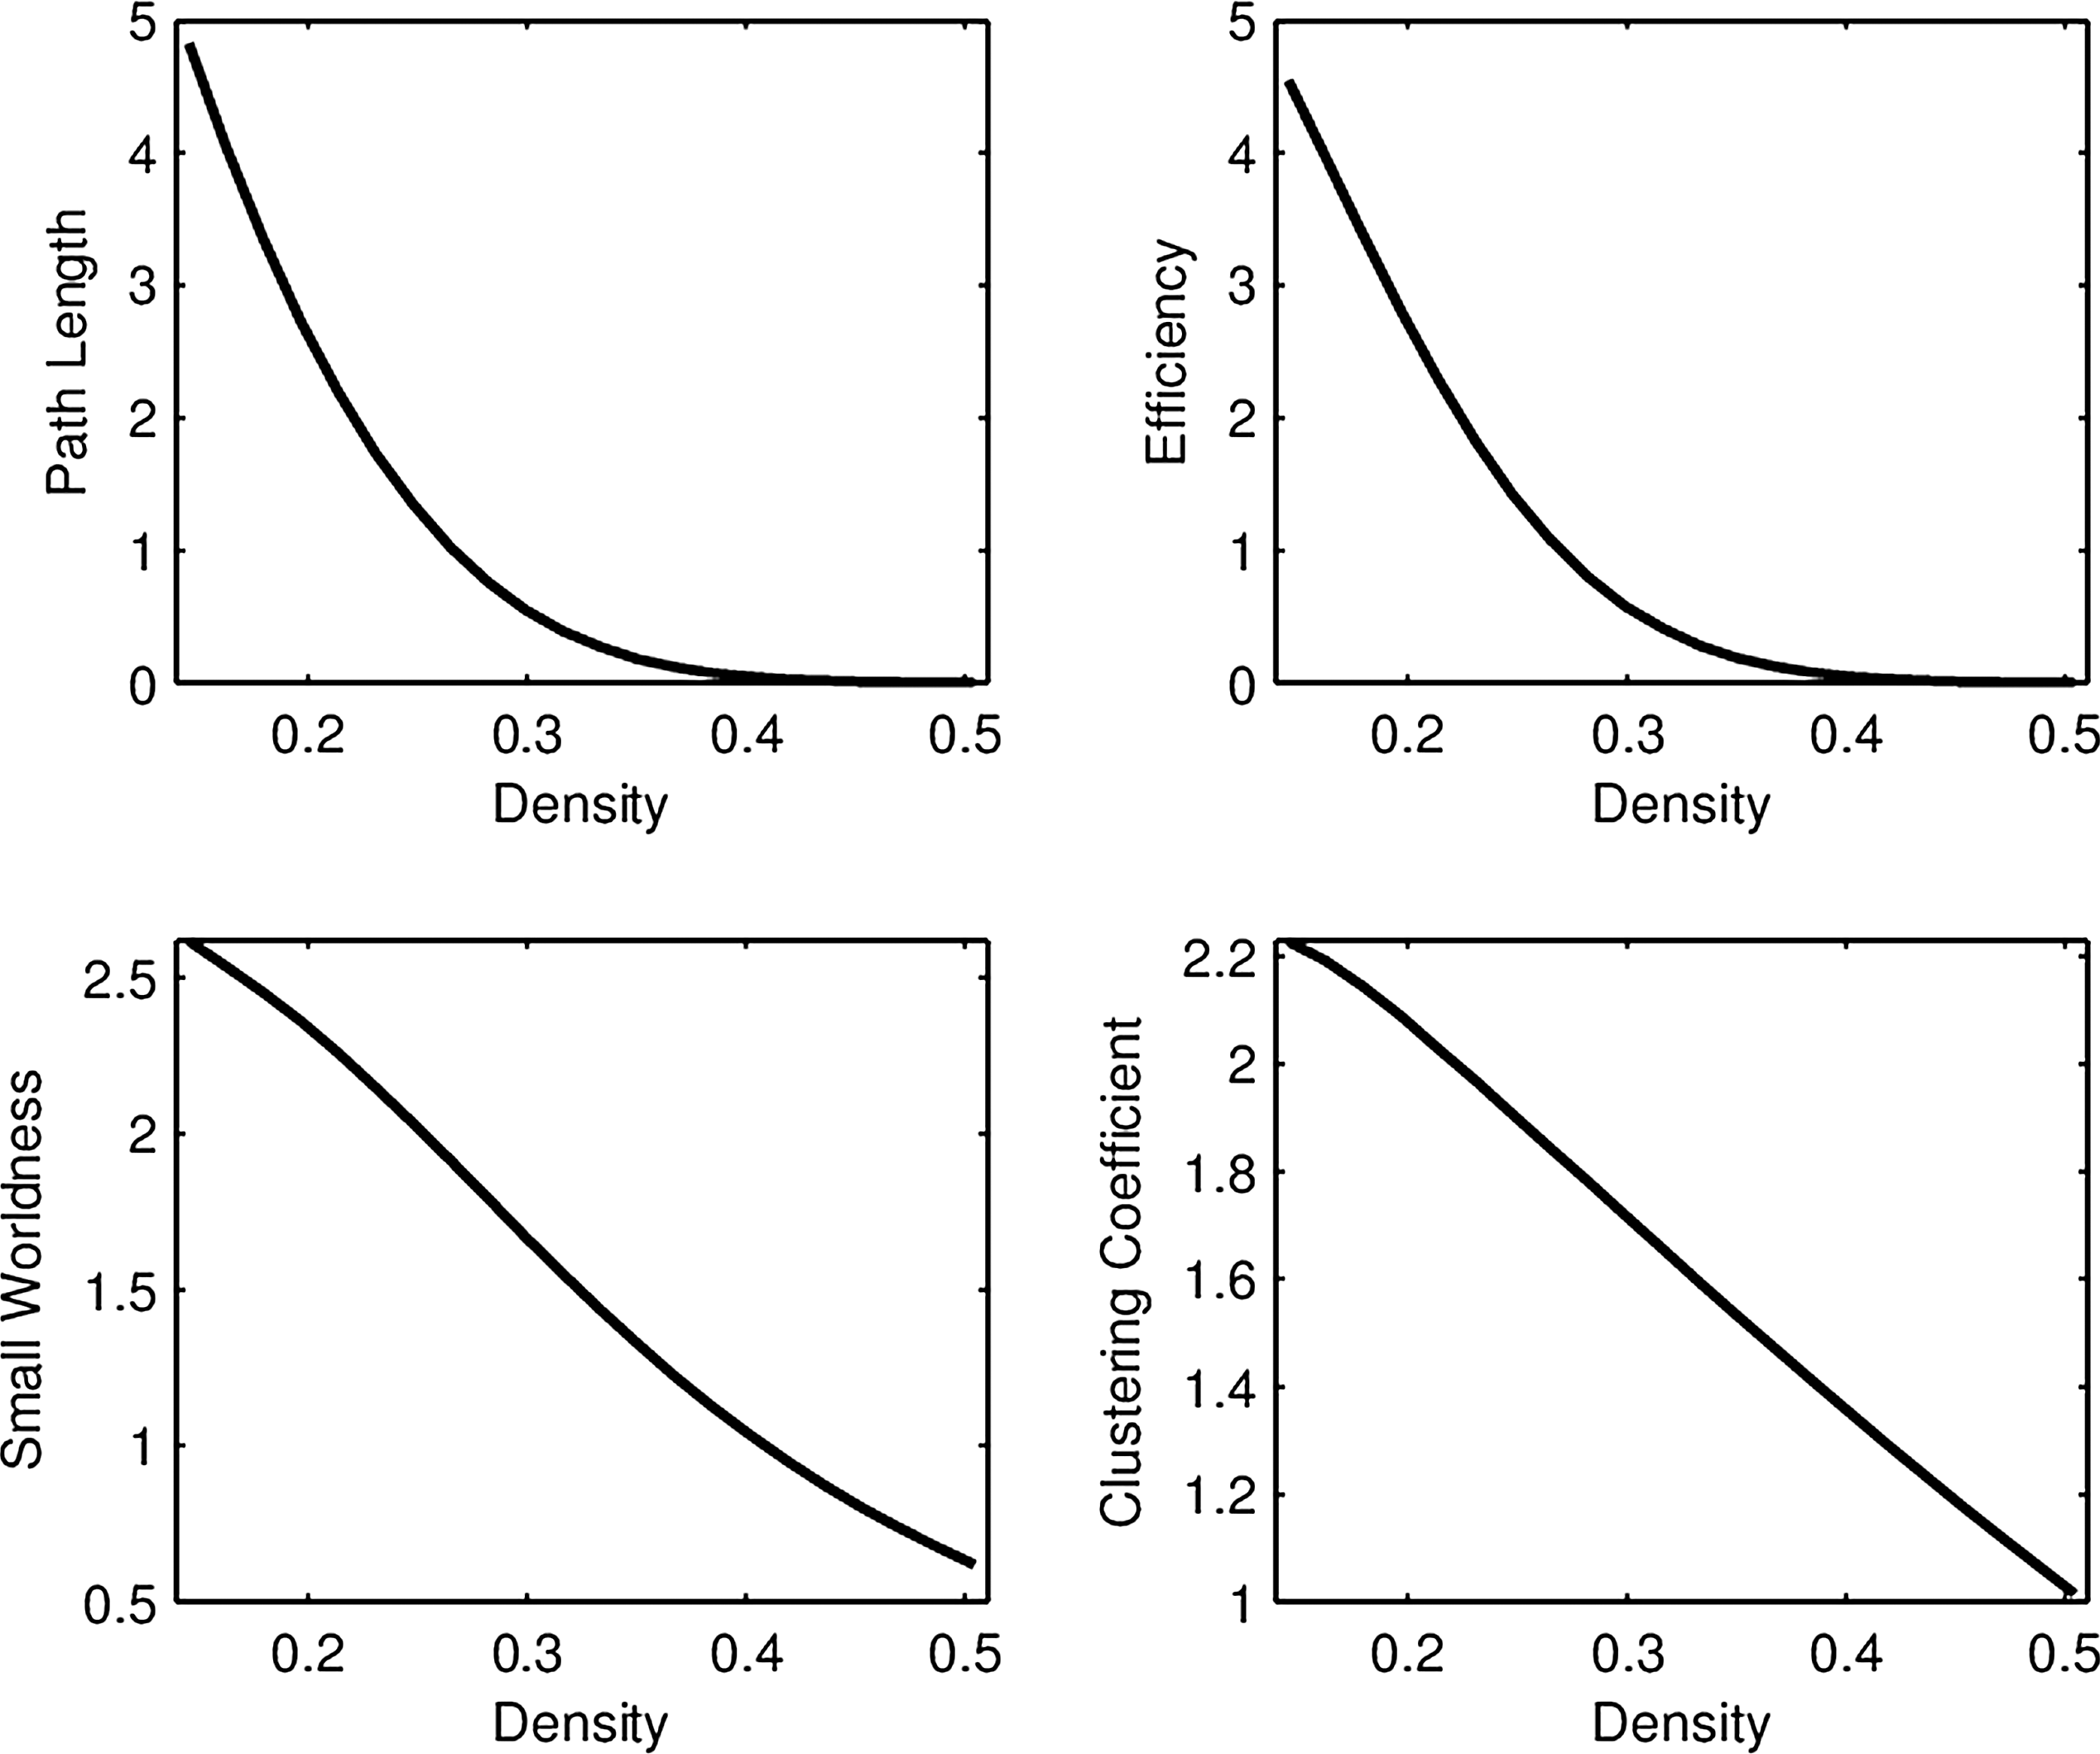
First FPCA eigenfunction for each network connectivity measure in the RMT hub. The first eigenfunctions for path length, efficiency, small worldness, and clustering accounted for 98%, 97%, 96%, and 99% of the total variability, respectively.
Similar to group differences, 40 regression models were fit for each cognitive score, with age included as one of the predictors. For each cognitive score, the 40 p-values were corrected using FDR with
Discussion
We have broadened the application of functional data analysis tools in neuroimaging studies by utilizing FPCA to fit regression models with cognitive scores as the dependent variable, as opposed to simple two-sample tests for detecting group differences. There are three main findings.
First, these models are an improvement in terms of their power to detect significant relationships between connectivity measures and continuous measures of cognitive function. Even after controlling for age and multiple testing, the FPCA regressions found four significant associations, whereas group comparisons did not reveal any significance.
Second, by interpreting the FPC scores using their corresponding eigenfunction, it is possible to identify shape characteristics in subject-specific network connectivity curves that relate to the desired outcomes; this aspect is absent in testing for group differences. In our experiments, we found that above average path length and below average efficiency of local connectivity within the RMT hub, particularly for smaller network densities, are positively associated with episodic memory and executive function. The importance of this hub with regard to episodic memory and executive function is consistent with the existing cognitive neuroscience literature (Banich et al., 2000; Milham et al., 2003a,b; Nyberg et al., 1996; Ragland et al., 2004; Spaniol et al., 2009; van Veen and Carter, 2005). To our knowledge, however, the specific relationship to these network connectivity measures is novel, as is the nature of the relationship. The associations between graph metrics (efficiency and path length) in this local region and cognitive function (episodic memory and executive function) may appear counterintuitive at first sight. However, we remark that previous studies have identified regions in which local connectivity increases with age [Ferreira and Busatto (2013) and references therein], providing further evidence that stronger local connectivity may be linked to cognitive decline.
Finally, nuisance variables such as age can easily be controlled in the FPCA regression models, whereas analysis based on group differences does not readily allow to adjust for such factors. While age is a prominent and ubiquitous example of a nuisance covariate, there are many others that matter in neuroscience studies, such as medication doses and education levels.
As mentioned in the Introduction the utility of FPCA for quantifying connectivity extends beyond regression. As an example, scatterplots of FPC scores can provide interesting visualizations of the distribution of network connectivity curves, which could be useful for subgroup detection, classification, and differentiating groups by variability, among other statistical techniques.
The key strength of this study is its thorough experimental evaluation of samples of functional connectivity networks through FPCA regression, as well as comparison with traditional group difference testing, on a large, real-world fMRI data set that included state-of-the-art measurement of cognitive functioning in two relevant domains. One potential limitation of our approach is that there is no guarantee that FPCA will provide eigenfunctions that are easy to interpret. In our experiments, the eigenfunctions were relatively easy to interpret in terms of what characteristics of connectivity change the eigenfunction captures over the range of densities. This was mostly due to the smooth nature of the underlying samples of curves. However, FPCA may feature more complex eigenfunctions that are harder to interpret.
Future work of interest will move beyond FPCA to more advanced functional data analysis methods, especially methods of dimensionality reduction. One such promising method is the ISOMAP (Tenenbaum et al., 2000), which has been extended to functional data and can often provide insightful interpretations for samples of functions. In addition, there are many other network connectivity measures besides the four considered in our experiments that may be useful in characterizing these networks for the purpose of relating connectivity to other observed variables. Finally, while we have focused on a small subset of local brain networks, the same approach can be used for any network-based connectivity study.
Footnotes
Acknowledgments
This work was supported by National Science Foundation grant DMS-1228369 and DMS-1407852, National Institutes of Health grants AG10220, AG10129, AG 030514, AG031252, and AG021028, and California Department of Public Health Alzheimer's Disease Program Contracts 06-55311 and 06-55312.
Author Disclosure Statement
No competing financial interests exist.