
Abstract
Previous functional magnetic resonance imaging studies have consistently shown that perception of visual objects, such as faces and houses, involves distributed brain networks that include the fusiform face area (FFA), parahippocampal place area (PPA), and dorsolateral prefrontal cortex (DLPFC). These regions are commonly observed to be coactivated in BOLD measurements during perception of visual objects. In this study, we aimed to disentangle node-level and network-level activities in millisecond timescale of perception and decision-making in attempts to answer questions about timing and frequency of brain oscillatory activities. We used clear and noisy face–house image categorization tasks and human scalp electroencephalography recordings combined with source reconstruction techniques to study when and how oscillatory activity organizes within the FFA, PPA, and DLPFC. We uncovered the dynamics of two oscillatory networks—beta (13–30 Hz) and gamma (30–100 Hz). In beta band, the node and network activities were enhanced in time frame of 125–250 msec after stimulus onset, the FFA and PPA acted as main outflow hubs and the DLPFC as a main inflow hub, and network activities negatively correlated with behavior measures of noise levels (response times). In gamma band, node and network activities were elevated in time frame of 0–125 msec after stimulus onset, the DLPFC acted as a main outflow hub, and finally network activities were positively correlated with the noise level. These findings broaden our understanding of temporal evolution of node and network features associated with visual perceptual decision-making.
Introduction
H
Neuroimaging studies in humans suggest that a specific brain area within the ventral temporal cortex (VTC) responds more to faces than other visual objects (stimuli) and this brain area in the right hemisphere is often referred to as the fusiform face area (FFA) (Heekeren et al., 2004; Kanwisher and Yovel, 2006; Kanwisher et al., 1997). In a similar vein, another brain area within the VTC activates more to houses than other visual stimuli, and this brain area in the left hemisphere is often called the parahippocampal place area (PPA) (Aguirre et al., 1998; Baldauf and Desimone, 2014; Epstein and Kanwisher, 1998; Haxby et al., 2001). Functional magnetic resonance imaging (fMRI) studies have revealed that a higher order cortical area in the brain, named the dorsolateral prefrontal cortex (DLPFC), computes higher-level cognitive functions (Bar et al., 2001; Carlson et al., 2006; Gabrieli et al., 1998), including image categorization (Heekeren et al., 2008; Pasupathy and Miller, 2005). During image categorization (face or house), the DLPFC is proposed to compute a decision by comparing the relevant sensory evidence in the FFA and PPA for their respective choices (Heekeren et al., 2008). However, how a sensory signal enters and organizes within this network has remained less understood in a timescale of human sensory perception and cognition. How do the DLPFC, FFA, and PPA causally interact in a millisecond timescale, what the temporal flow of underlying overall activity in these brain areas is, and what frequency bands of information flow bind them in a network are largely unknown to date.
As the FFA, PPA, and DLPFC are often coactivated, it had been hard to disentangle their causal features in longer timescale measures such as from fMRI. In this study, we recorded human scalp electroencephalography (EEG) while participants performed face or house image categorization task, reconstructed source waveforms, and used the spectral Granger causality (GC) (Dhamala et al., 2008a, 2008b). We tested our hypothesis that the FFA, PPA, and DLPFC interact during face or house perception. We further added noise to the images to examine whether a noisy stimulus modulates the network activity.
Materials and Methods
Participants
Twenty-six neurologically normal human volunteers (21 males, five females) of age ranging from 22 to 38 years (mean: 26.3 years, standard deviation (SD): 4.7 years) participated in this study. A written informed consent was collected from each participant before data collection. Experimental protocol was approved by the Institutional Review Board of Georgia State University. Three participants were excluded from the final analyses because of low behavioral performance and/or unmanageable artifacts and noise present in their EEG data.
Stimuli
We used total 28 images of faces and houses (14 images of each category). Face images were from the Ekman series (Ekman and Friesen, 1976). Fast Fourier transforms (FFT) of these images were computed, providing 28 magnitude and 28 phase matrices. The average magnitude matrix of this set was stored. Images were produced from the inverse FFT (IFFT) of average magnitude matrix and individual phase matrices. Phase matrix used for IFFT was a linear combination of original phase matrix computed during forward Fourier transforms and random Gaussian noise matrix. Resulting images had an identical frequency power spectrum (corresponding to the average magnitude matrix) with graded amount of noise similar to a previous study (Heekeren et al., 2004). Finally, the stimuli consisted of three different noise levels: 0%, 40%, and 55%. The E-Prime 2.0 software was used to display the stimuli and control the task sequences.
Experimental design
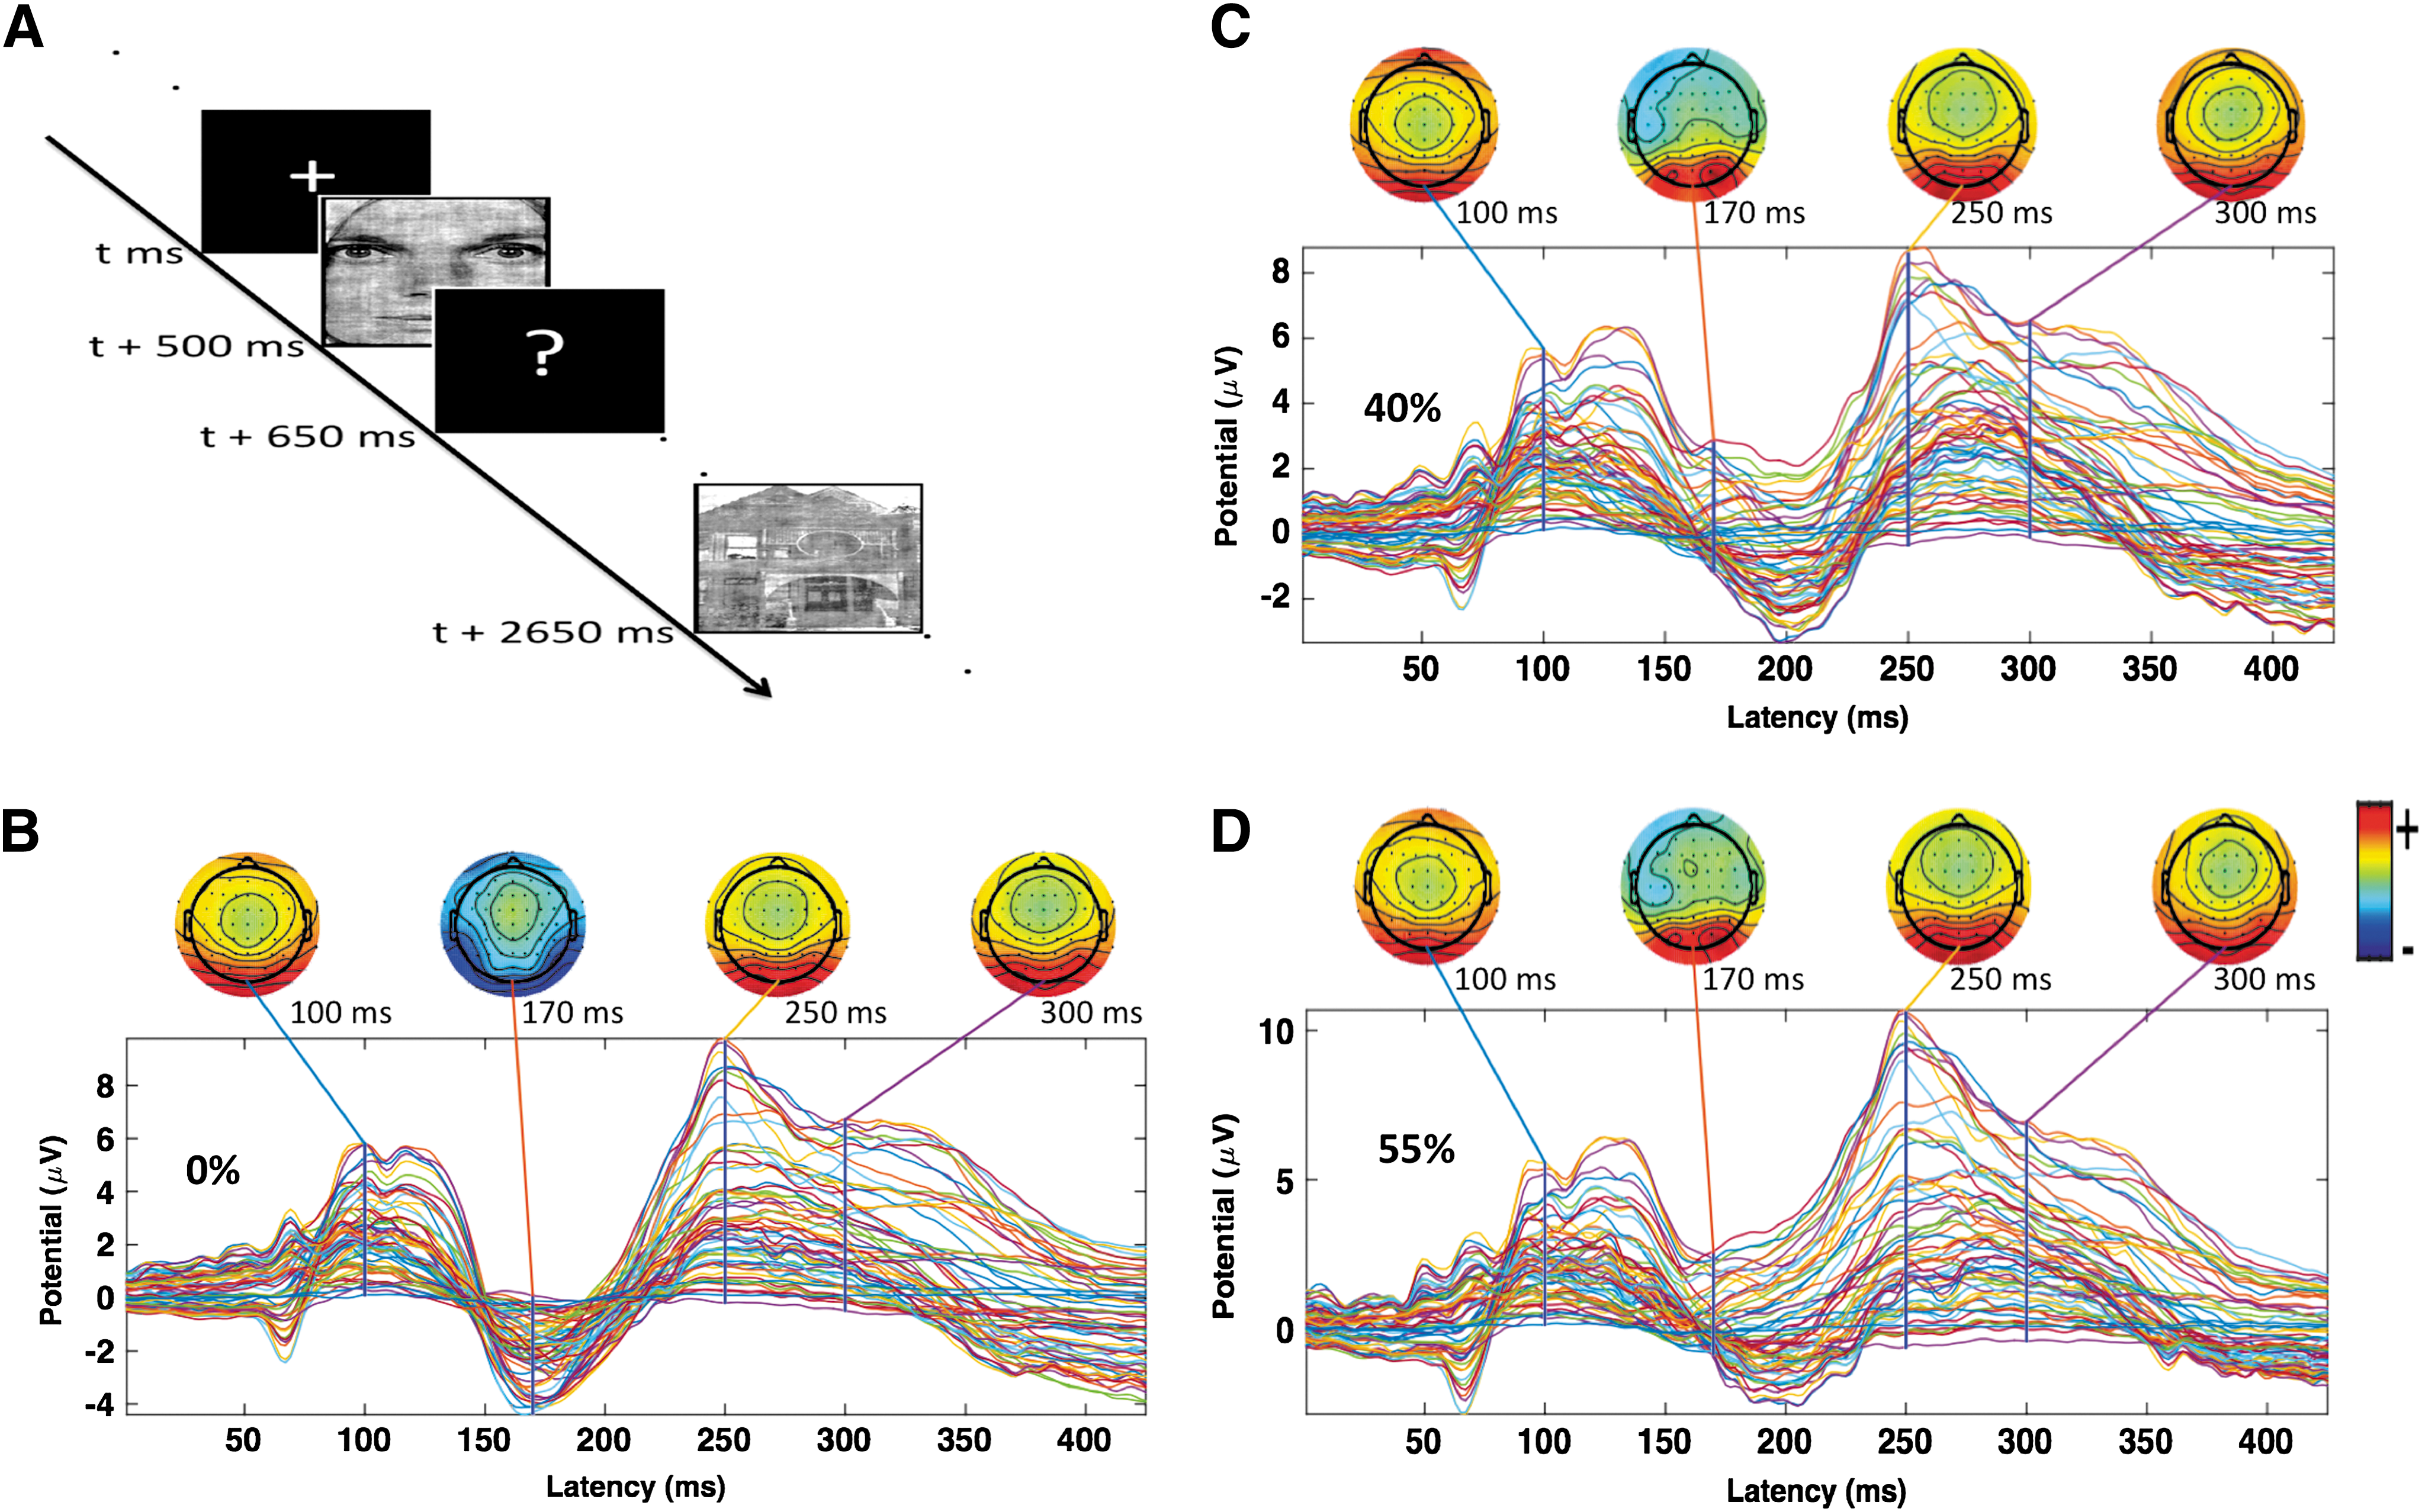
Before experimental task, participants were briefly explained about task paradigm. Participants sat in a dark room (only source of light was from experimenter's computer screen) and viewing distance was ∼60 cm (chin rest). Figure 1 shows a schematic of experimental paradigm used. Experiment consisted of four blocks of 168 trials (672 trials in total with 224 trials for each noise level). On each trial, a small fixation cross (“+” in the middle of screen) was presented for 500 msec. Then, a stimulus was presented for 150 msec, followed by black screen with question mark (“?”) for 1500 msec during which time participants were allowed to indicate their decision (either face or house) by keyboard button press. The responses after that delay were considered incorrect.
Data acquisition and preprocessing
EEG data were acquired with a 64-channel EEG system from Brain Vision LLC (
Data analysis
The preprocessed EEG data were analyzed in the following main steps: (1) computation of ERPs, (2) EEG-source reconstruction from ERPs and distributed dipole modeling and reconstruction of single-trial source waveforms, and (3) computation of spectral power and GC based on single-trial source signals using parametric spectral approach (Dhamala et al., 2008a, 2008b).
Computation of ERPs
Continuous EEG data were segmented into trials of 450-msec duration (prestimulus: −50–0 msec, poststimulus: 0–400 msec) based on the stimulus-onset time as a reference. The trials corresponding to correct responses were separated and baseline correction was performed using prestimulus duration. The trials that had three SDs below or above the means were considered as outliers (Junghofer et al., 2000) and they were discarded from the subsequent analysis.
EEG source and single-trial source waveform reconstruction
The ERPs of correct percept (only poststimulus) were grand averaged across participants and imported to BESA software version 5.3.7 (
DLPFC, dorsolateral prefrontal cortex; LPPA, left parahippocampal place area; RFFA, right fusiform face area.
Spectral power and GC analyses
We computed power spectra using the parametric method (Chand and Dhamala, 2014; Dhamala et al., 2008a, 2008b) from source waveforms of the FFA, PPA, and DLPFC. The optimal model order, which is four for these data, was selected by comparing the spectral power from both parametric and nonparametric approaches (Dhamala et al., 2008a) at different model orders and picking the model order that renders the lowest power difference between two approaches. We first computed GC spectra using a sliding window to see the activity over the entire time frame (Supplementary Fig. S1; Supplementary Data are available online at
Brain–behavior relationship
Response time (RT) of each participant for each stimulus was recorded. To examine brain–behavior correlation, RTs for all three noise levels (only correct responses) were converted into z scores and plotted with GC peak values in each band. The relationship between GC and RT was tested using both Spearman's rank correlation and Pearson's correlation. The results reported here are in terms of Spearman's rank correlation method, followed by false discovery rate (FDR) of multiple comparisons (Benjamini and Hochberg, 1995). If p < 0.05 (FDR corrected), the correlation was considered significant.
Results
Behavioral results
The overall performance—a ratio of the number of correct decisions to the total number of responses (correct and incorrect both)—was calculated for all three noise levels. Performance was compared between all three possible pairs of noise levels using the Mann–Whitney U test. We found that the performance decreased significantly with increase in noise level. In contrast, RT increased significantly with increase in noise level (Fig. 2).

Behavior responses.
Electrophysiological (Brain) results
ERP features
The average ERPs for correct responses were computed for 0% noise (faces and houses, separately) to examine the related ERP features over occipital–temporal channels. Figure 3A is the Brain Products 10–20 EEG system showing standard channel information. We found the first negative peak at ∼170 msec, which is often called N170-component. The ERPs for 0% faces are significantly higher than that of 0% houses (p = 0.004).

ERPs over the occipital–temporal channels.
Temporal evolution of cortically localized sources
Average ERPs for correct responses were used for the inverse technique, LORETA (Pascual-Marqui et al., 1994), to find cortically localized sources. Figure 4 shows the location of peak source activity (shown by crossing of lines) as it traversed the cortical surface (first row) and the locations and orientations of fitted dipoles used to obtain the single-trial source waveforms (second row). Earliest peak of cortical activity occurred in the visual area (BA17/18) at ∼60 msec after stimulus onset. We observed activation in the areas of VTC (BA37: right FFA and left PPA) at ∼160 msec and finally in the left DLPFC (BA9) at ∼224 msec. Table 1 lists the ERP source locations, dipole orientations of source model, and dominant activation time frame of cortical sources. Dipoles fitted at the locations and orientations shown explained ∼80% of variance in the EEG signal for trials with correct responses.
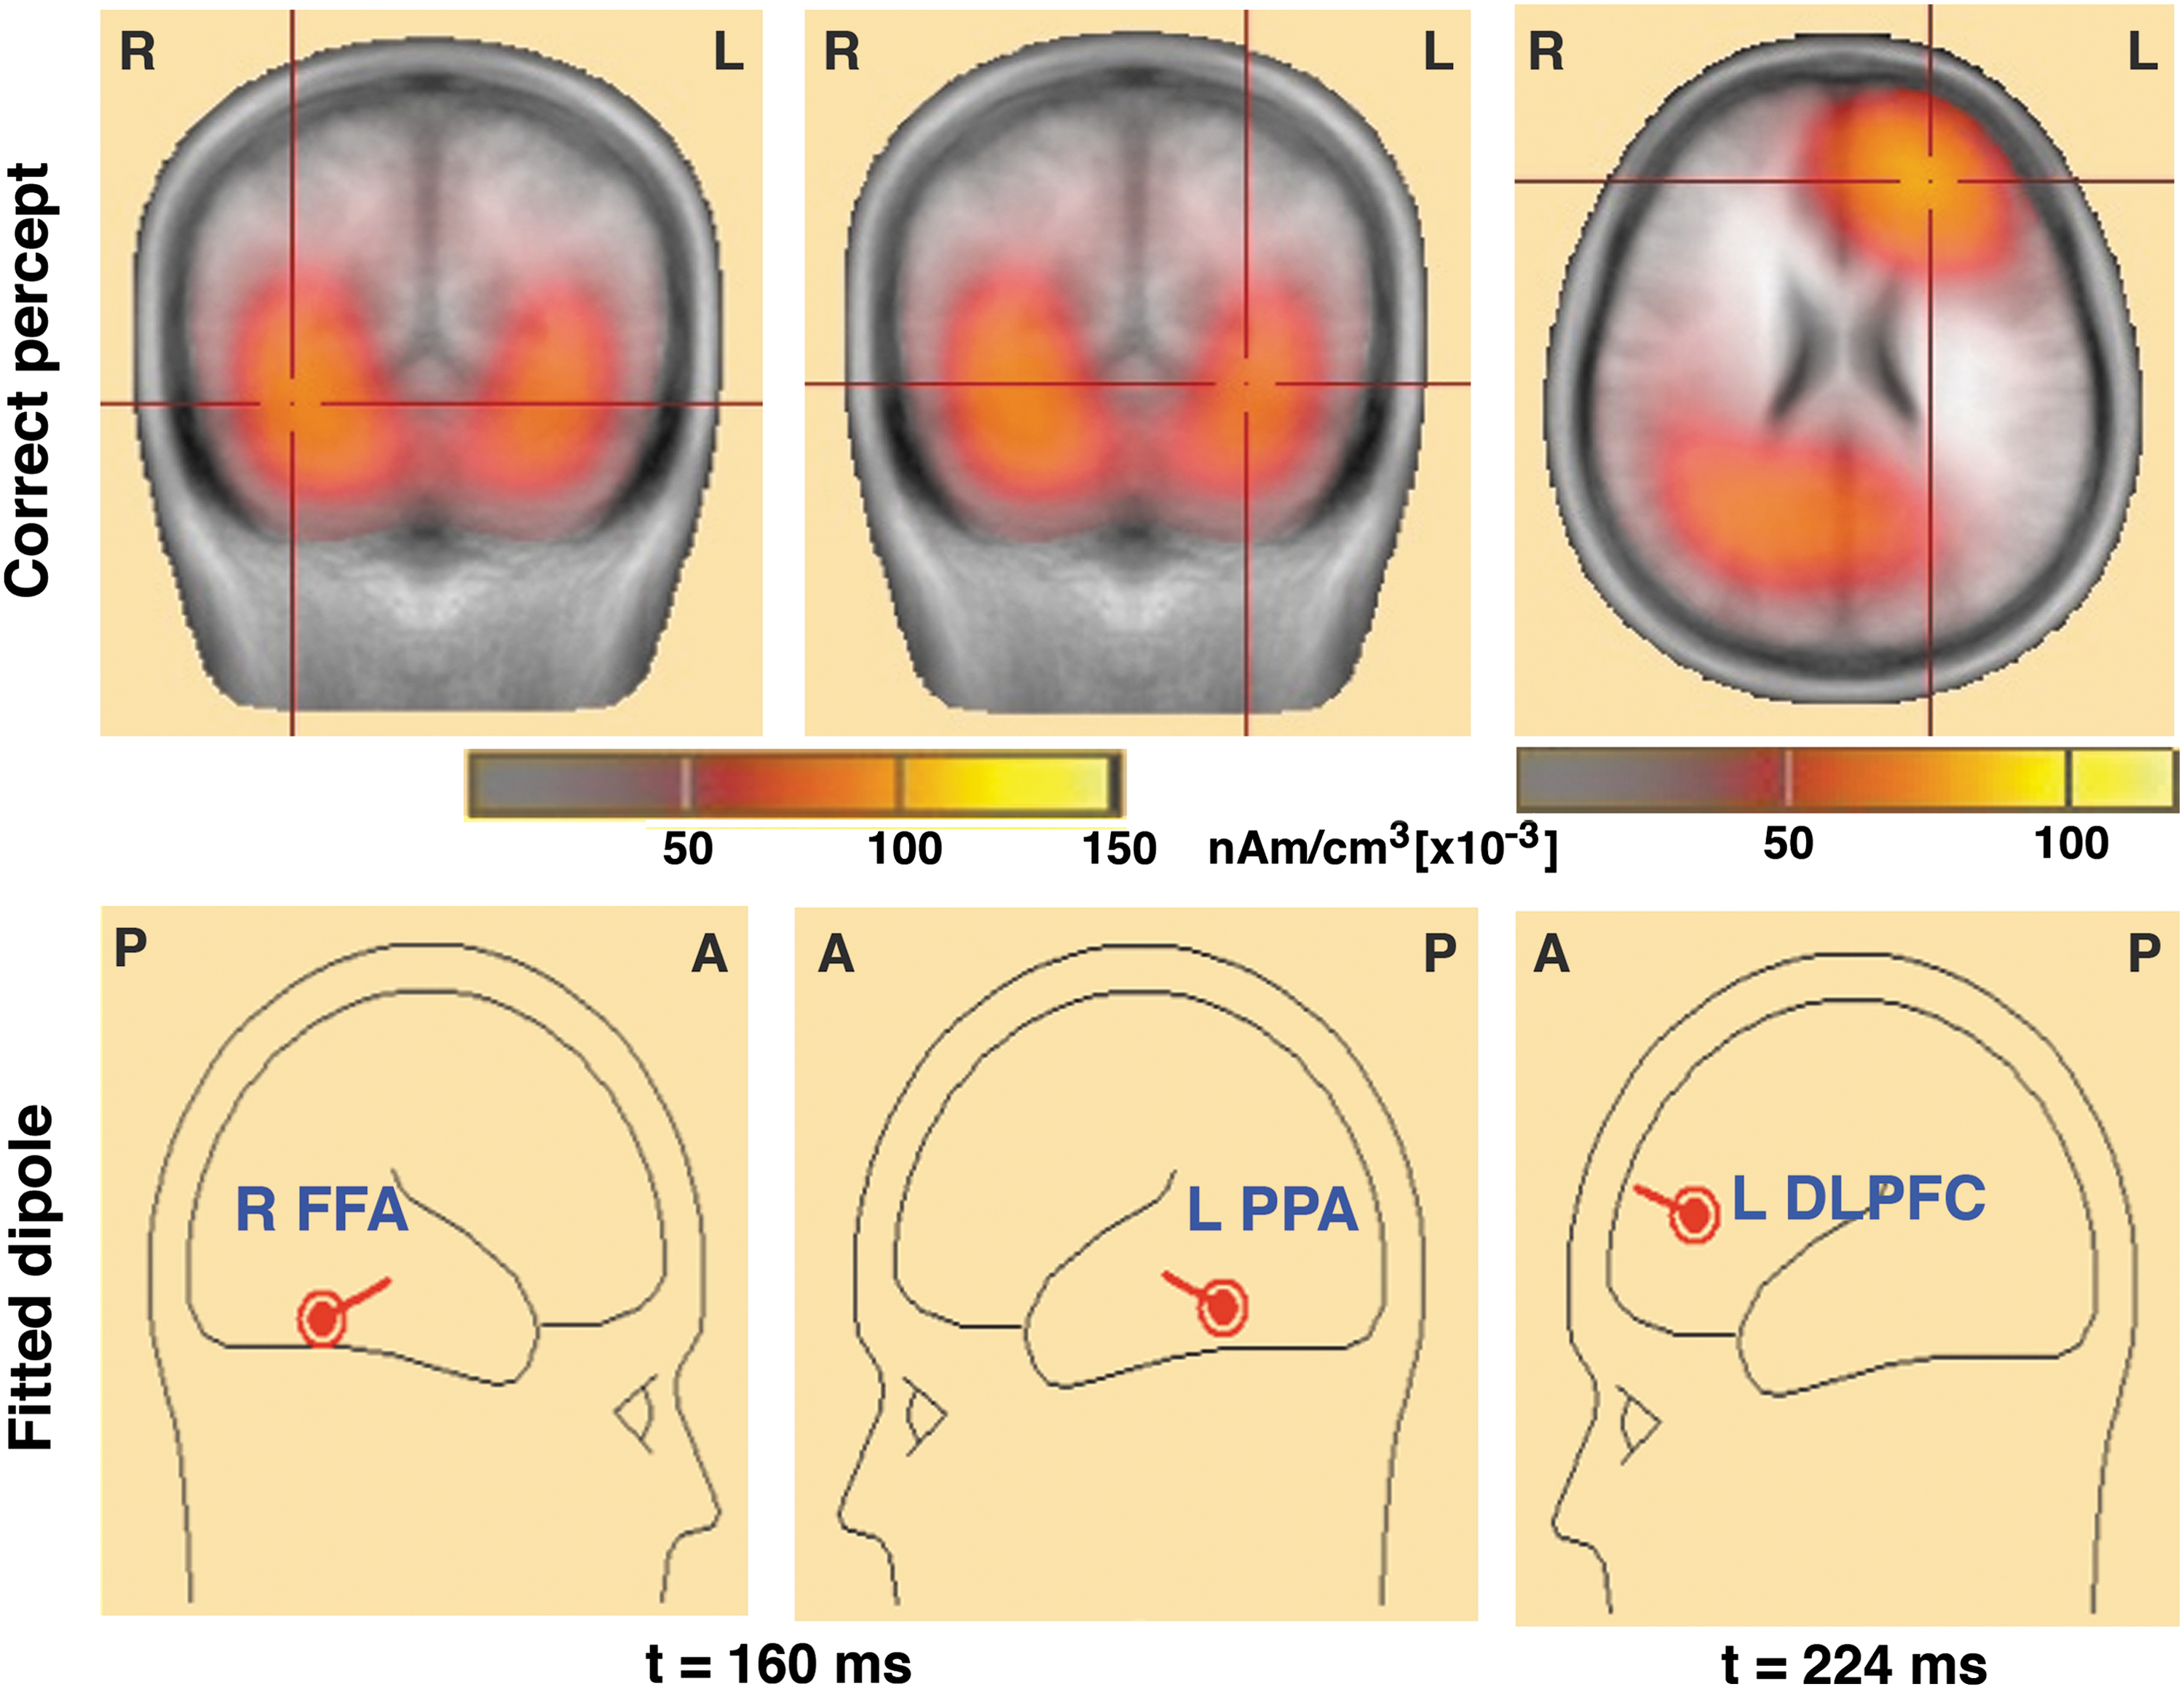
Spatiotemporal profiles of peak source-level brain activity. The first row shows peak source-level brain activity in the FFA and PPA at 160 msec and the DLPFC at 224 msec, and the second row shows fitted dipoles at those nodes. DLPFC, dorsolateral prefrontal cortex; FFA, fusiform face area; PPA, parahippocampal place area. Color images available online at
Power and GC spectra
Network of the DLPFC, FFA, and PPA for 0% noisy stimuli
We first computed GC spectra using a sliding window technique to observe the activity over the entire time frame (Supplementary Fig. S1). We further computed GC spectra for faces & houses (Supplementary Fig. S5). To further better access how power and GC spectra change over time, we then performed calculations at three time frames. Power spectra computed in three consecutive time frames—TF1 (0–125 msec), TF2 (125–250 msec), and TF3 (250–375 msec)—at the DLPFC, FFA, and PPA showed peak activity in beta band and gamma band when the participants perceived 0% noisy stimuli (Supplementary Fig. S2). Overall power over these nodes was compared among these TFs using the Mann–Whitney U test. We found that beta power was significantly higher in TF2 compared with other TFs; however, gamma power was significantly higher in TF1 (Fig. 5).
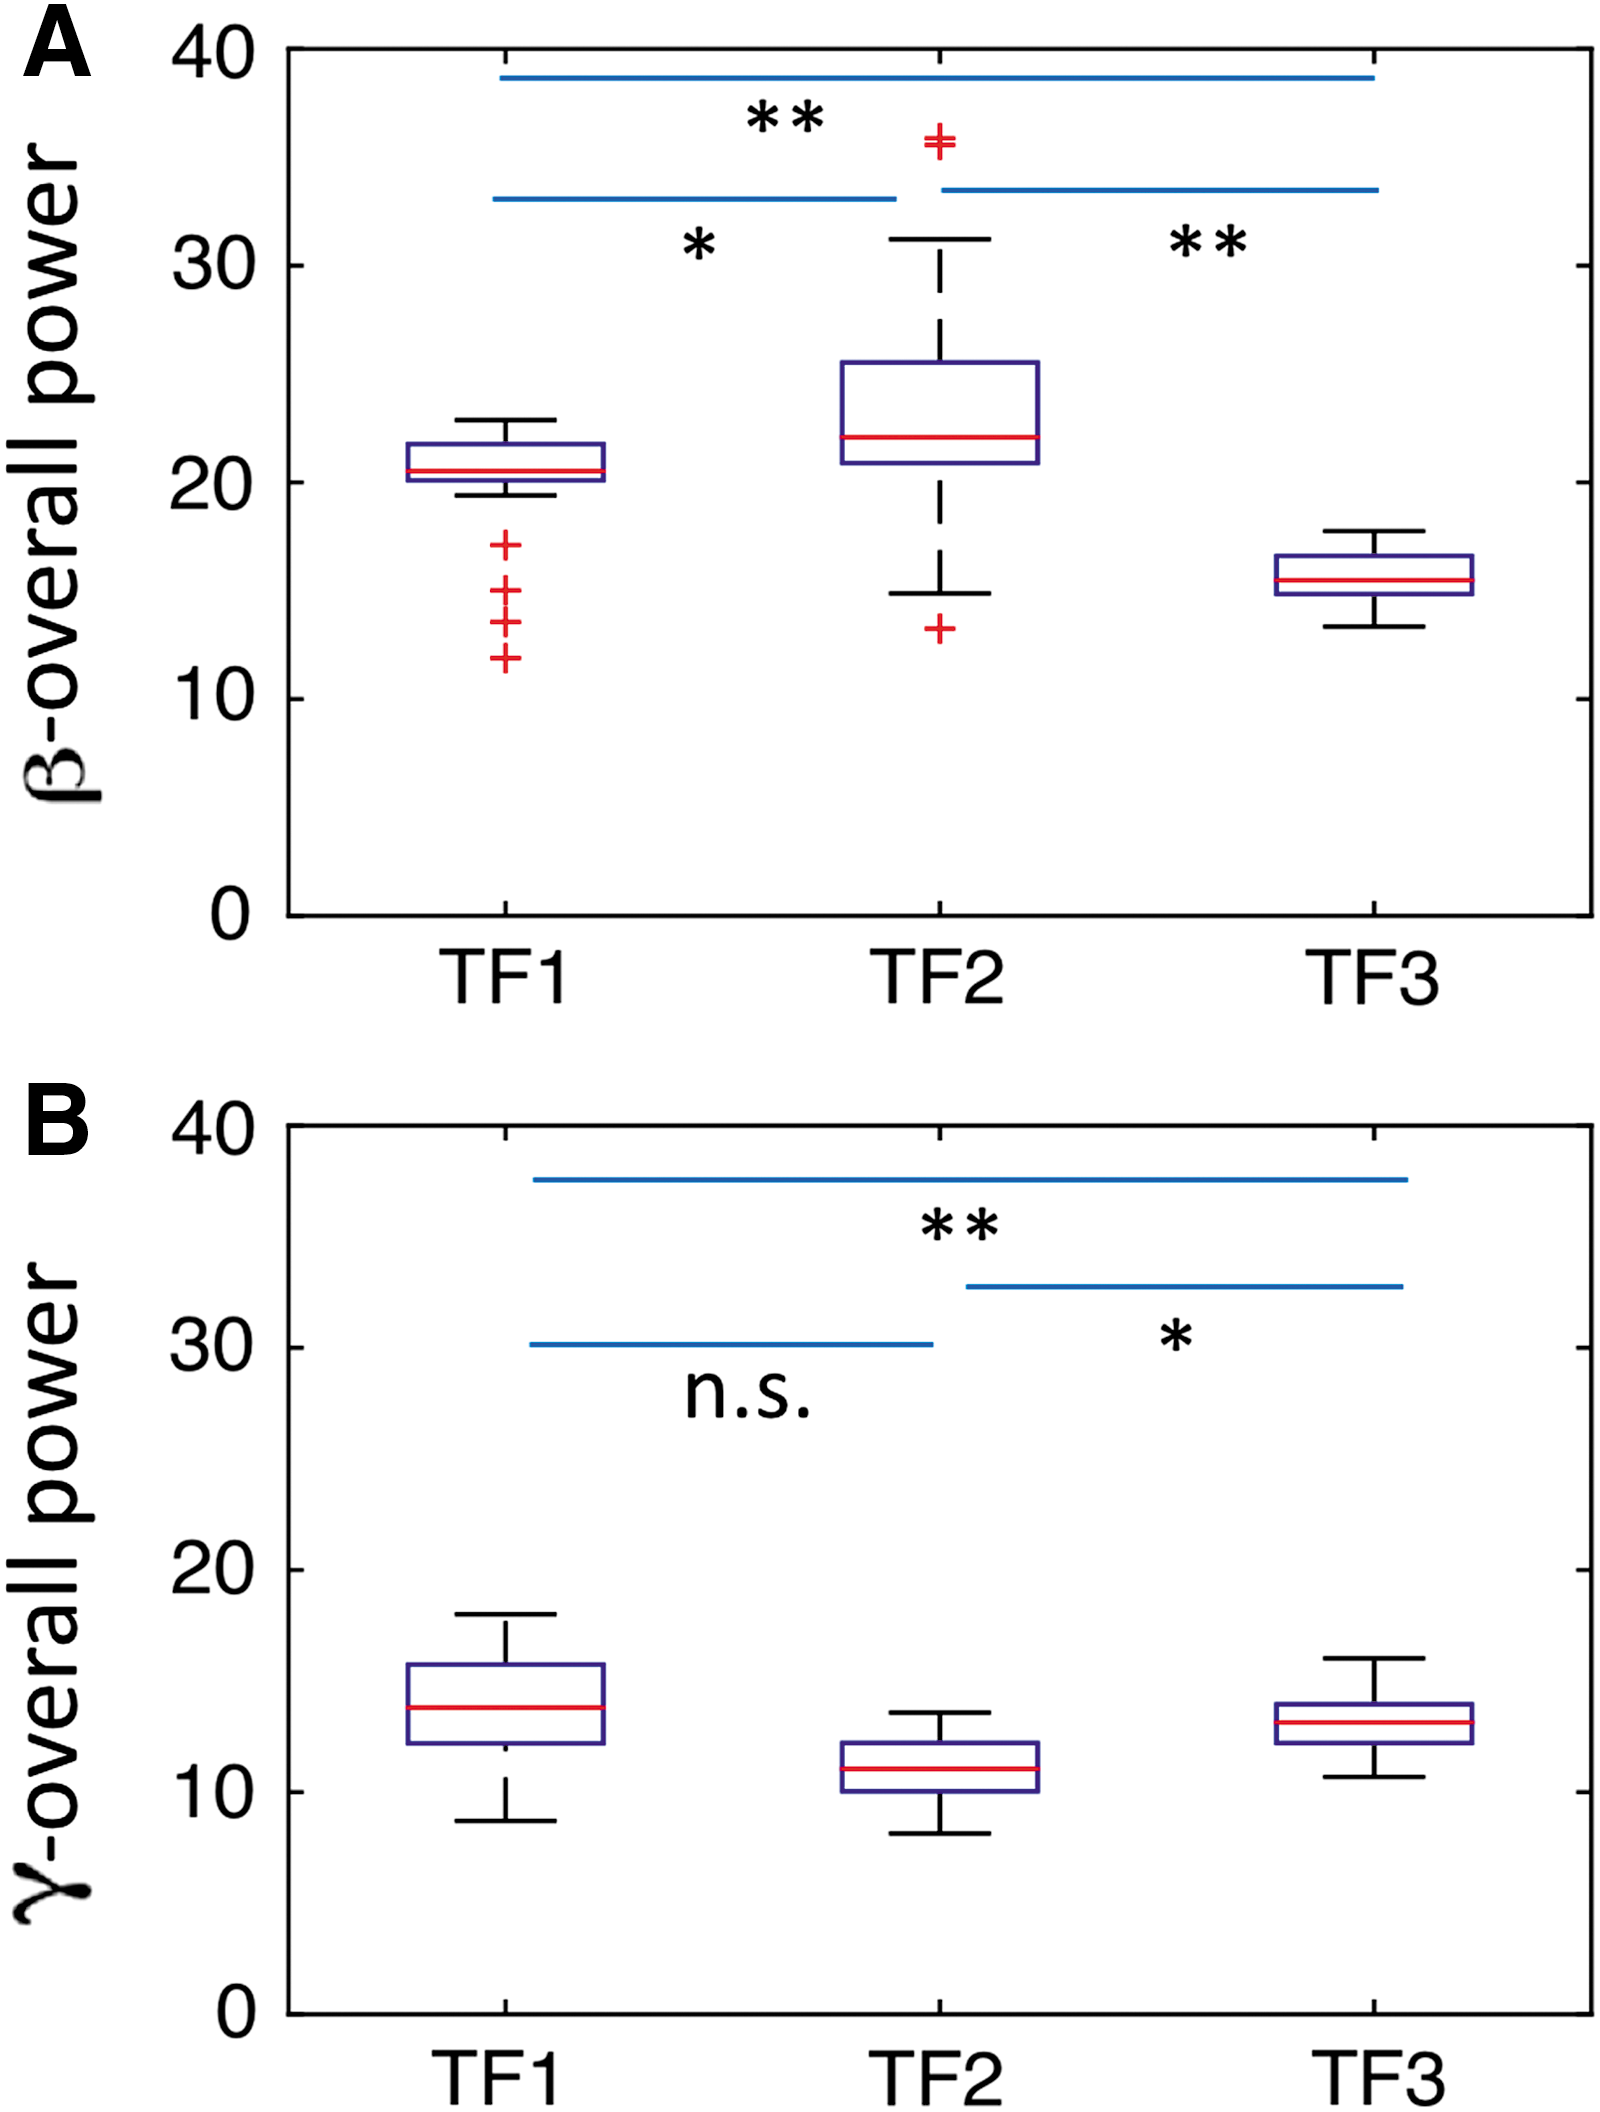
Power comparison at the DLPFC, FFA, and PPA in three consecutive time frames (TF1: 0–125 msec, TF2: 125–250 msec, and TF3: 250–375 msec) for 0% noise level.
GC spectra were calculated to assess the oscillatory neural network interactions among these nodes. Figure 6 shows GC spectra as a function of frequency, where horizontal lines represent statistically significant threshold value. Beta band network interactions among these nodes are enhanced in TF2 relative to the other TFs (other columns). The overall beta connectivity strength among these nodes was significantly higher in TF2 compared with other TFs (Fig. 7A); however, overall gamma connectivity strength was higher in TF1 (Fig. 7B). Net beta outflow calculations at each node in TF2 (time frame of higher power and connectivity) revealed that the FFA and PPA act as main outflow hubs and the DLPFC acts as a main inflow hub within a network (Fig. 8A). In contrast, net gamma outflow calculations in TF1 (time frame of higher power and connectivity) uncovered that the DLPFC acts as the main outflow hub within a network (Fig. 8B).
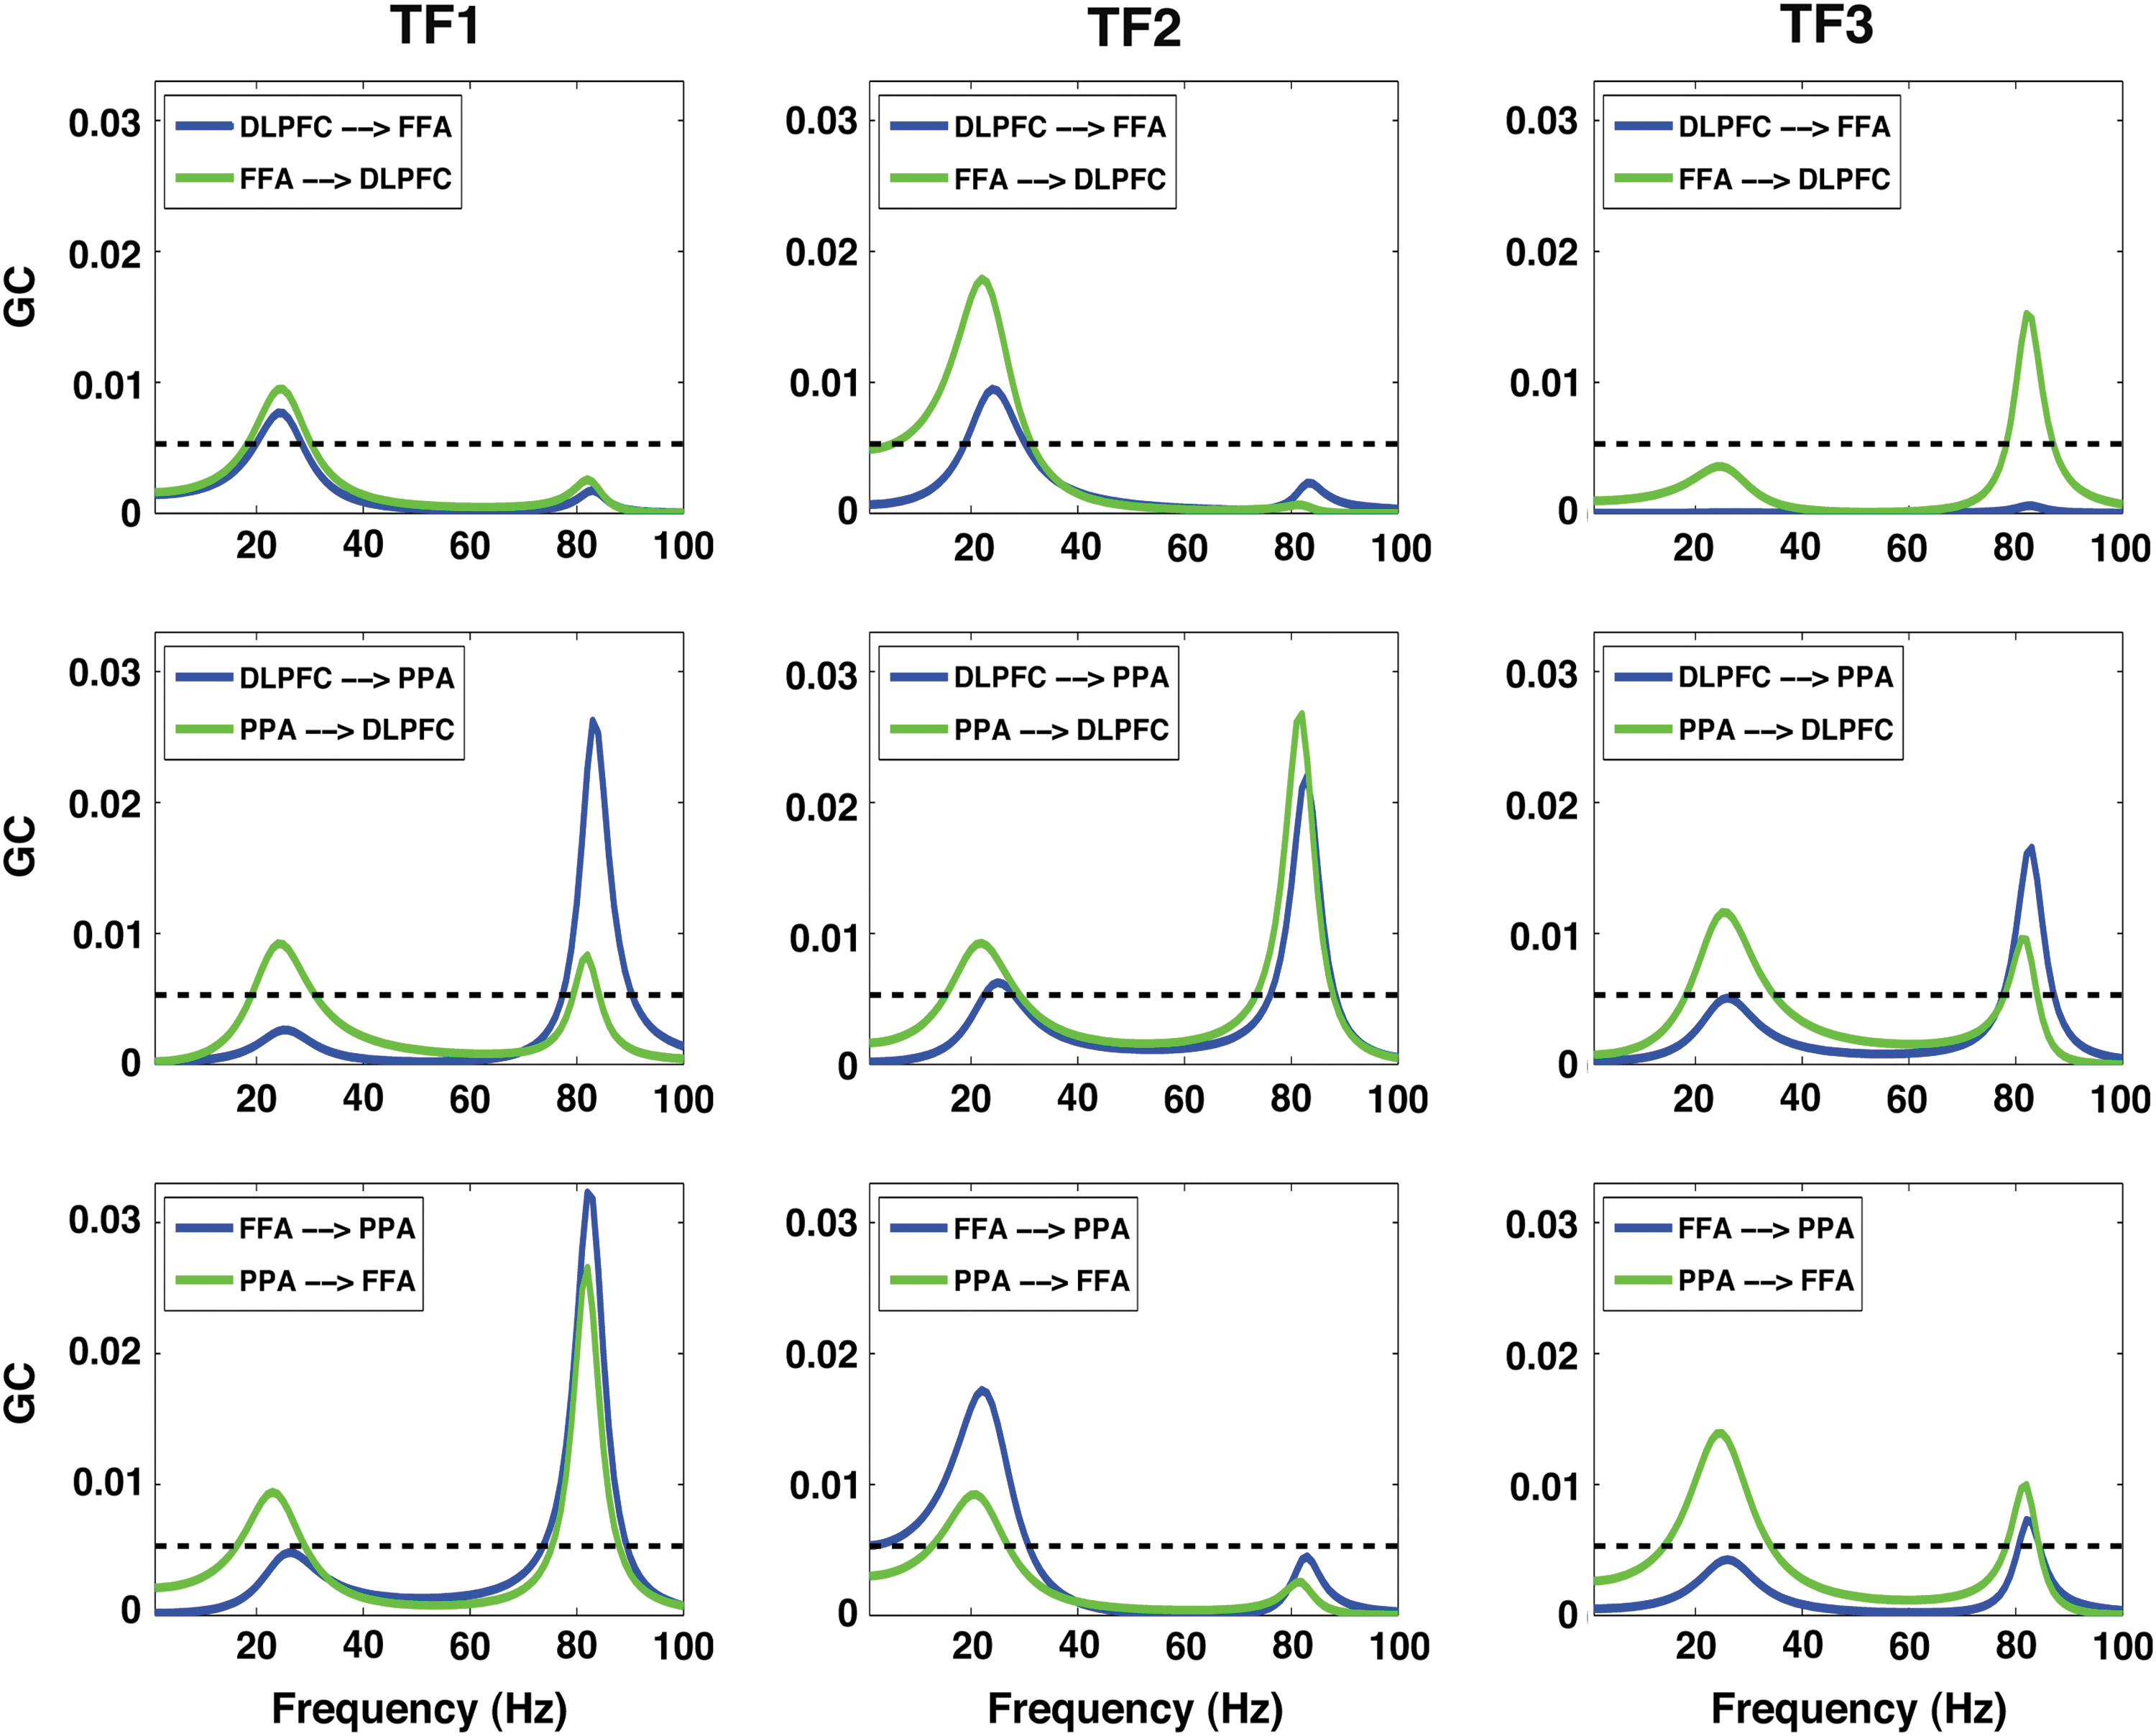
GC spectra of all possible pairs among the FFA, PPA, and DLPFC for 0% noise level in three consecutive time frames (TF1: 0–125 msec, TF2: 125–250 msec, and TF3: 250–375 msec mentioned at the top of each column) showing beta and gamma oscillations. GC, Granger causality. Color images available online at
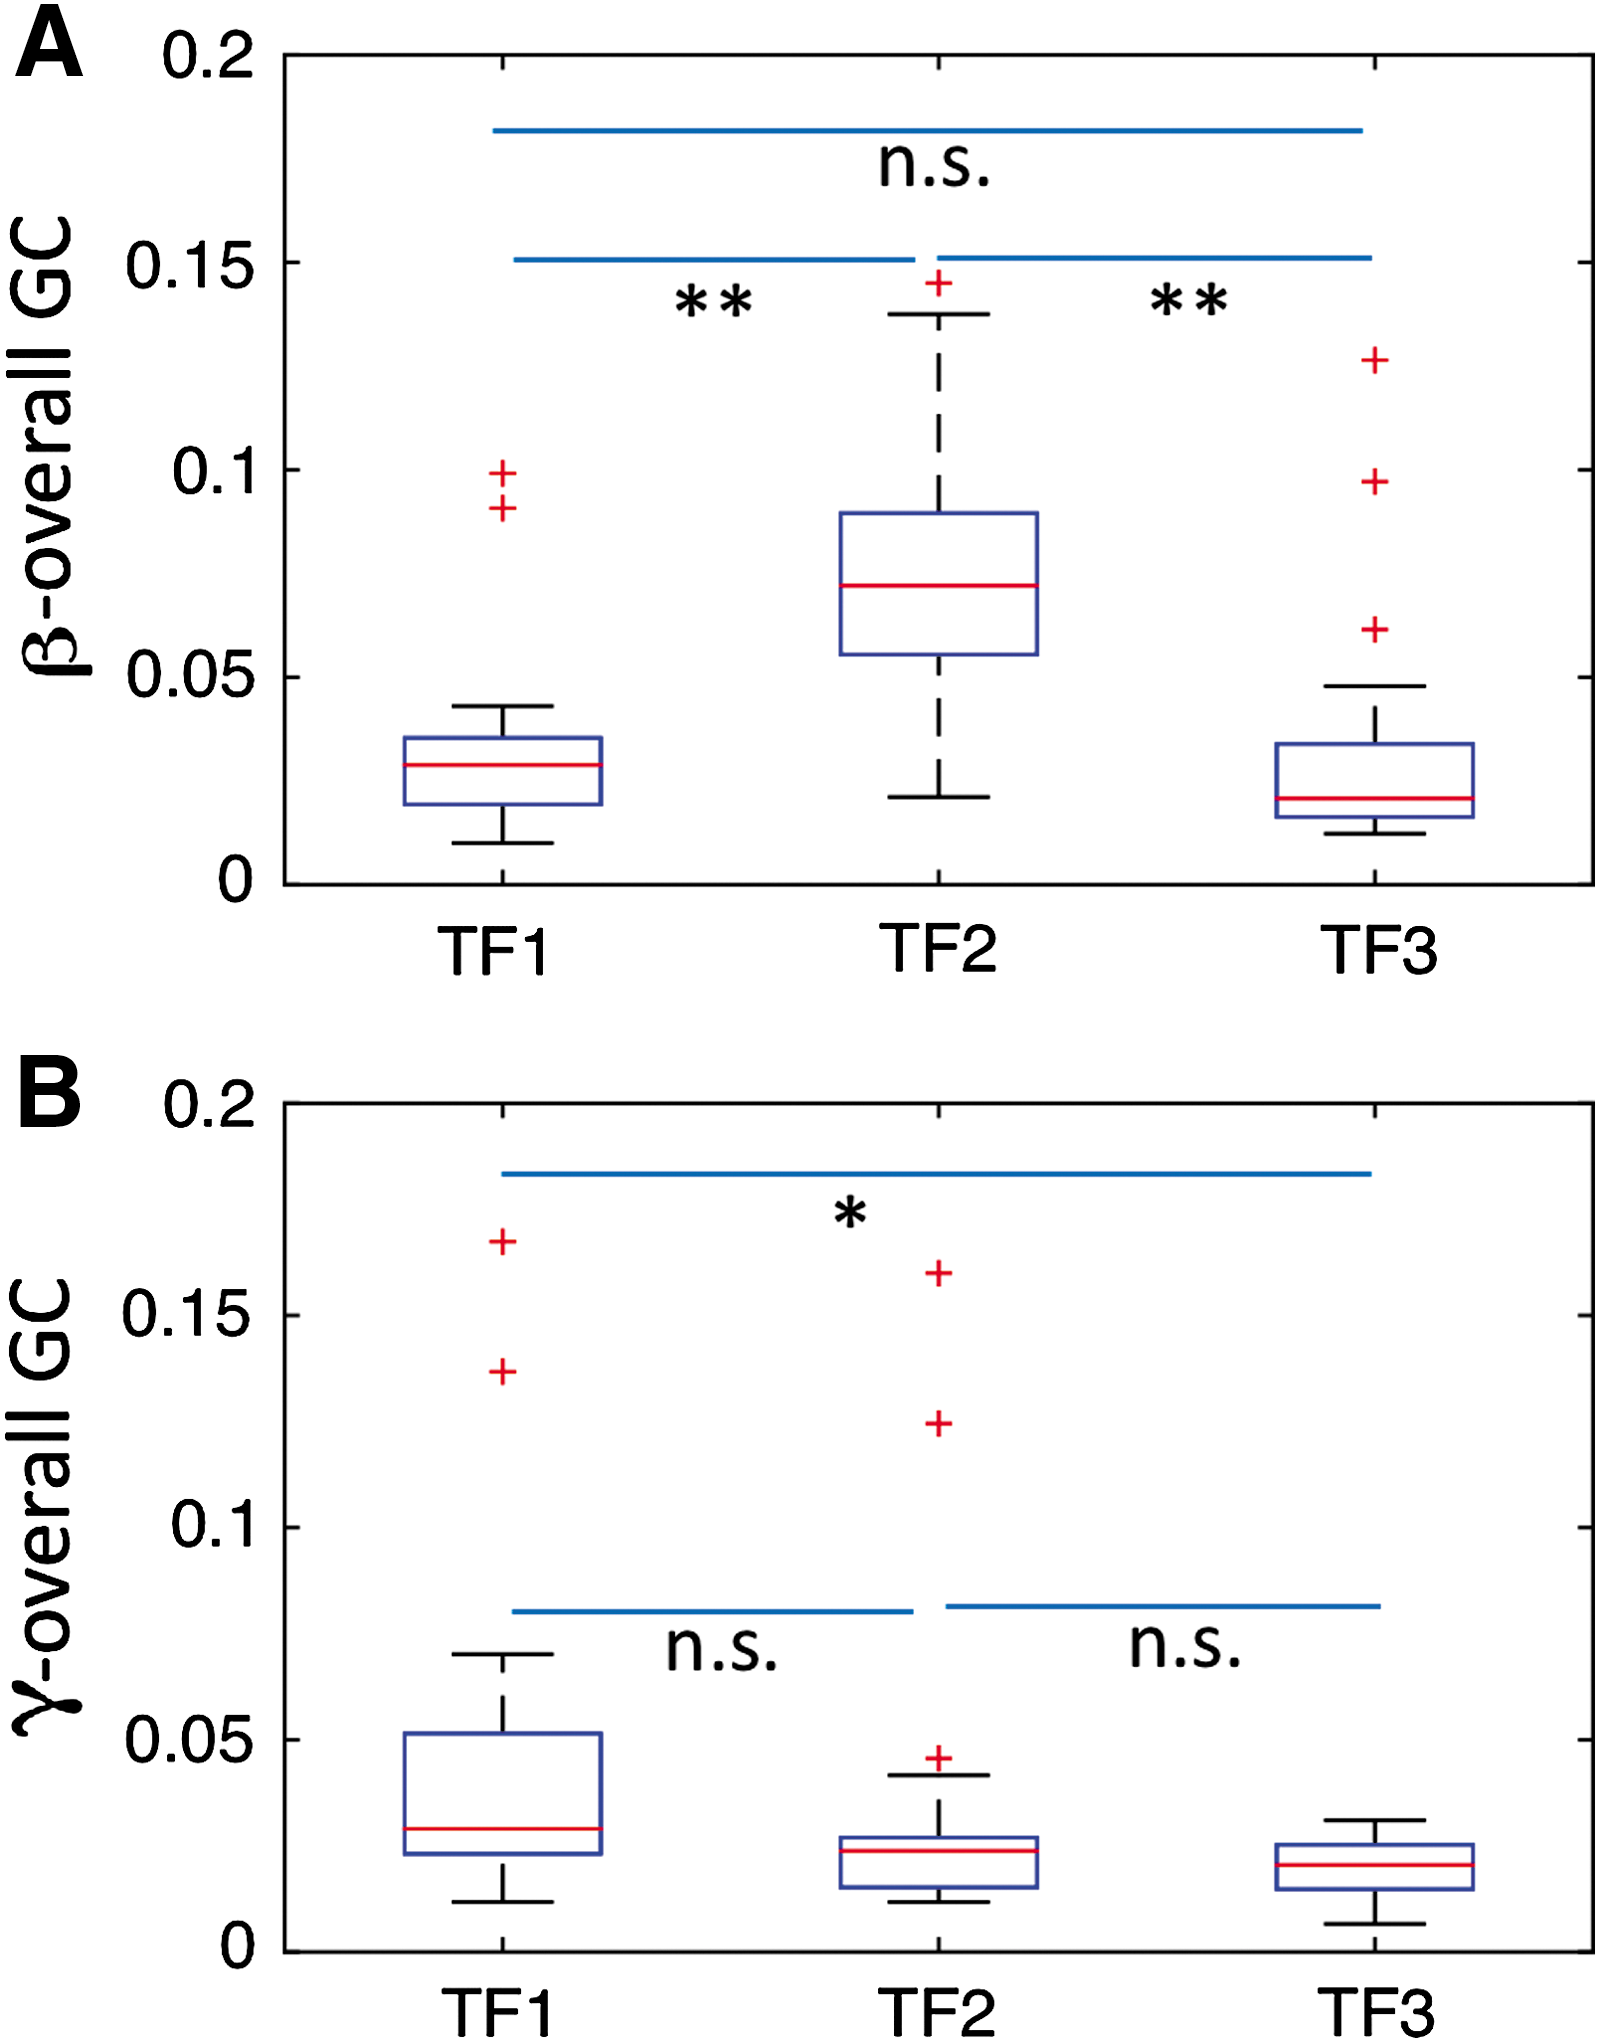
Comparison of overall connectivity strength within the FFA, PPA, and DLPFC among three consecutive time frames (TF1: 0–125 msec, TF2: 125–250 msec, and TF3: 250–375 msec) for 0% noise level in
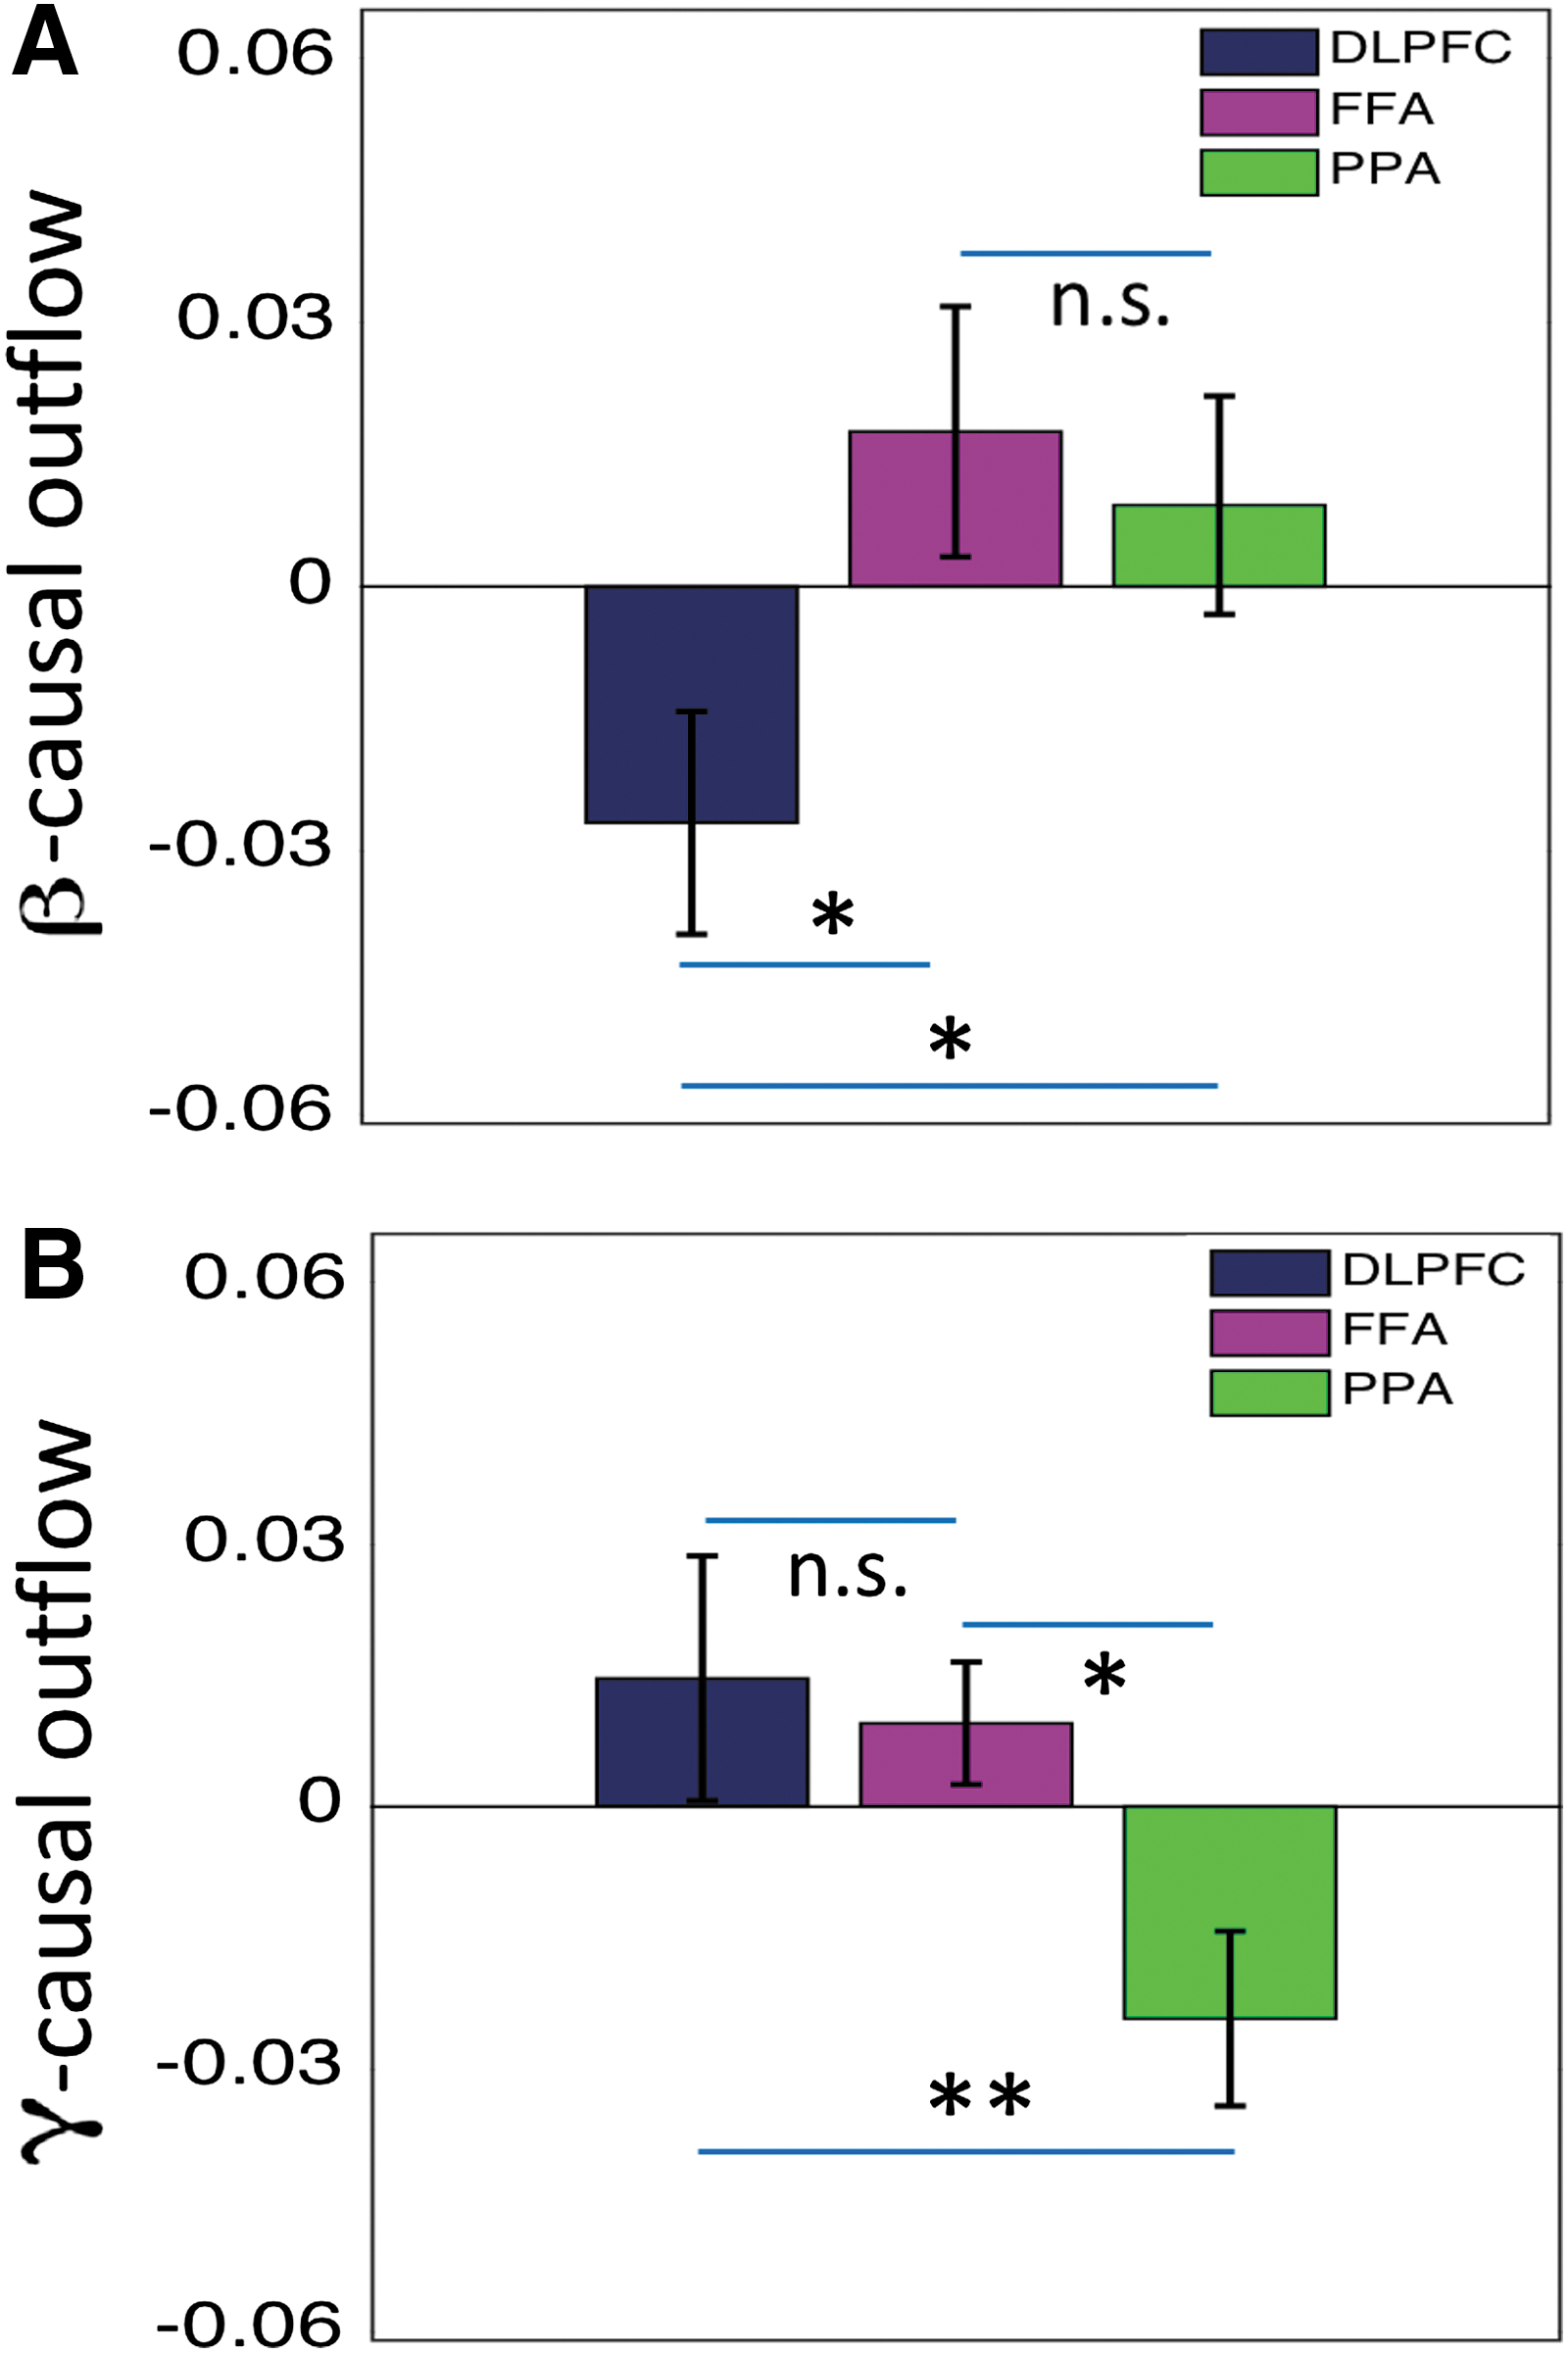
Net causal outflow computed in
Network of the DLPFC, FFA, and PPA for 40% and 55% noisy stimuli
Power spectra were also computed in TF1, TF2, and TF3 at the DLPFC, FFA, and PPA when participants perceived 40% and 55% noisy stimuli. Power spectra calculations also demonstrated peak activity in beta band and gamma band (Supplementary Figs. S3 and S4). Both beta and gamma overall powers were significantly enhanced with increase in noise level of stimuli (Fig. 9). GC spectra were computed to further assess the interactions among these nodes.
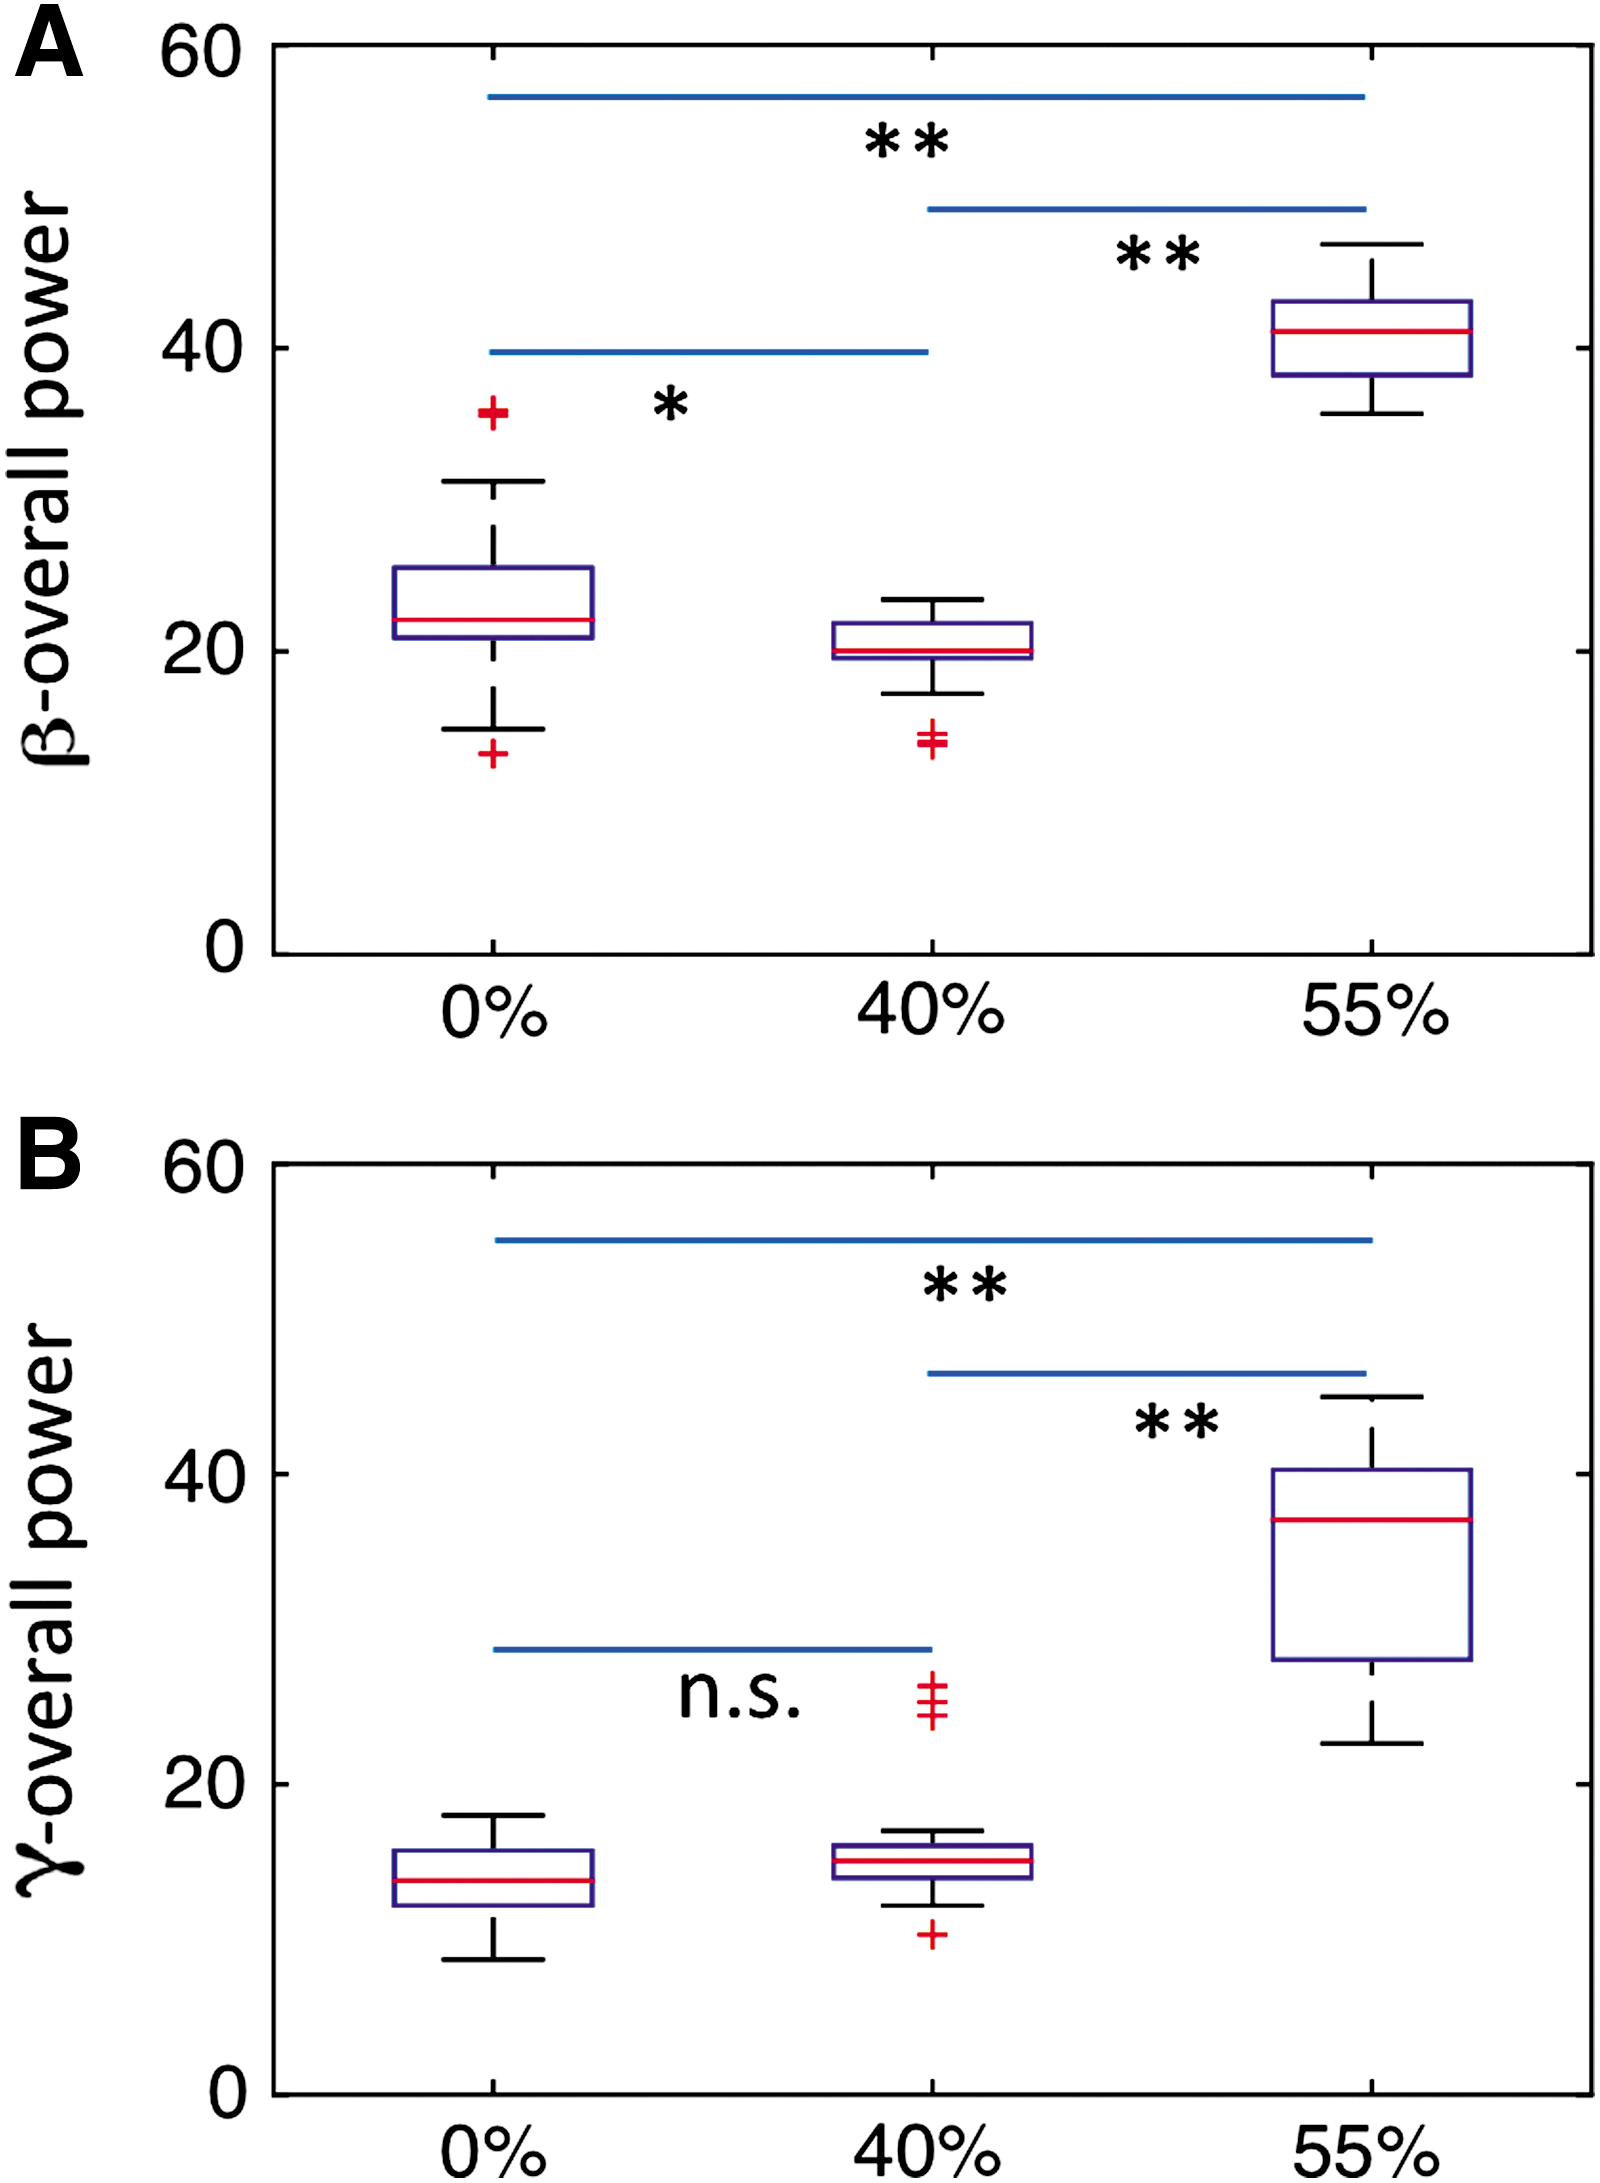
Comparison of overall power at the FFA, PPA, and DLPFC among all three noise levels in
Beta overall network interactions among these nodes were compared among three noise levels. We found that overall beta connectivity strengths were significantly suppressed with increase in noise level of stimuli (Fig. 10A). One the other hand, we uncovered that overall gamma connectivity strengths were significantly enhanced with increase in noise level of stimuli (Fig. 10B).
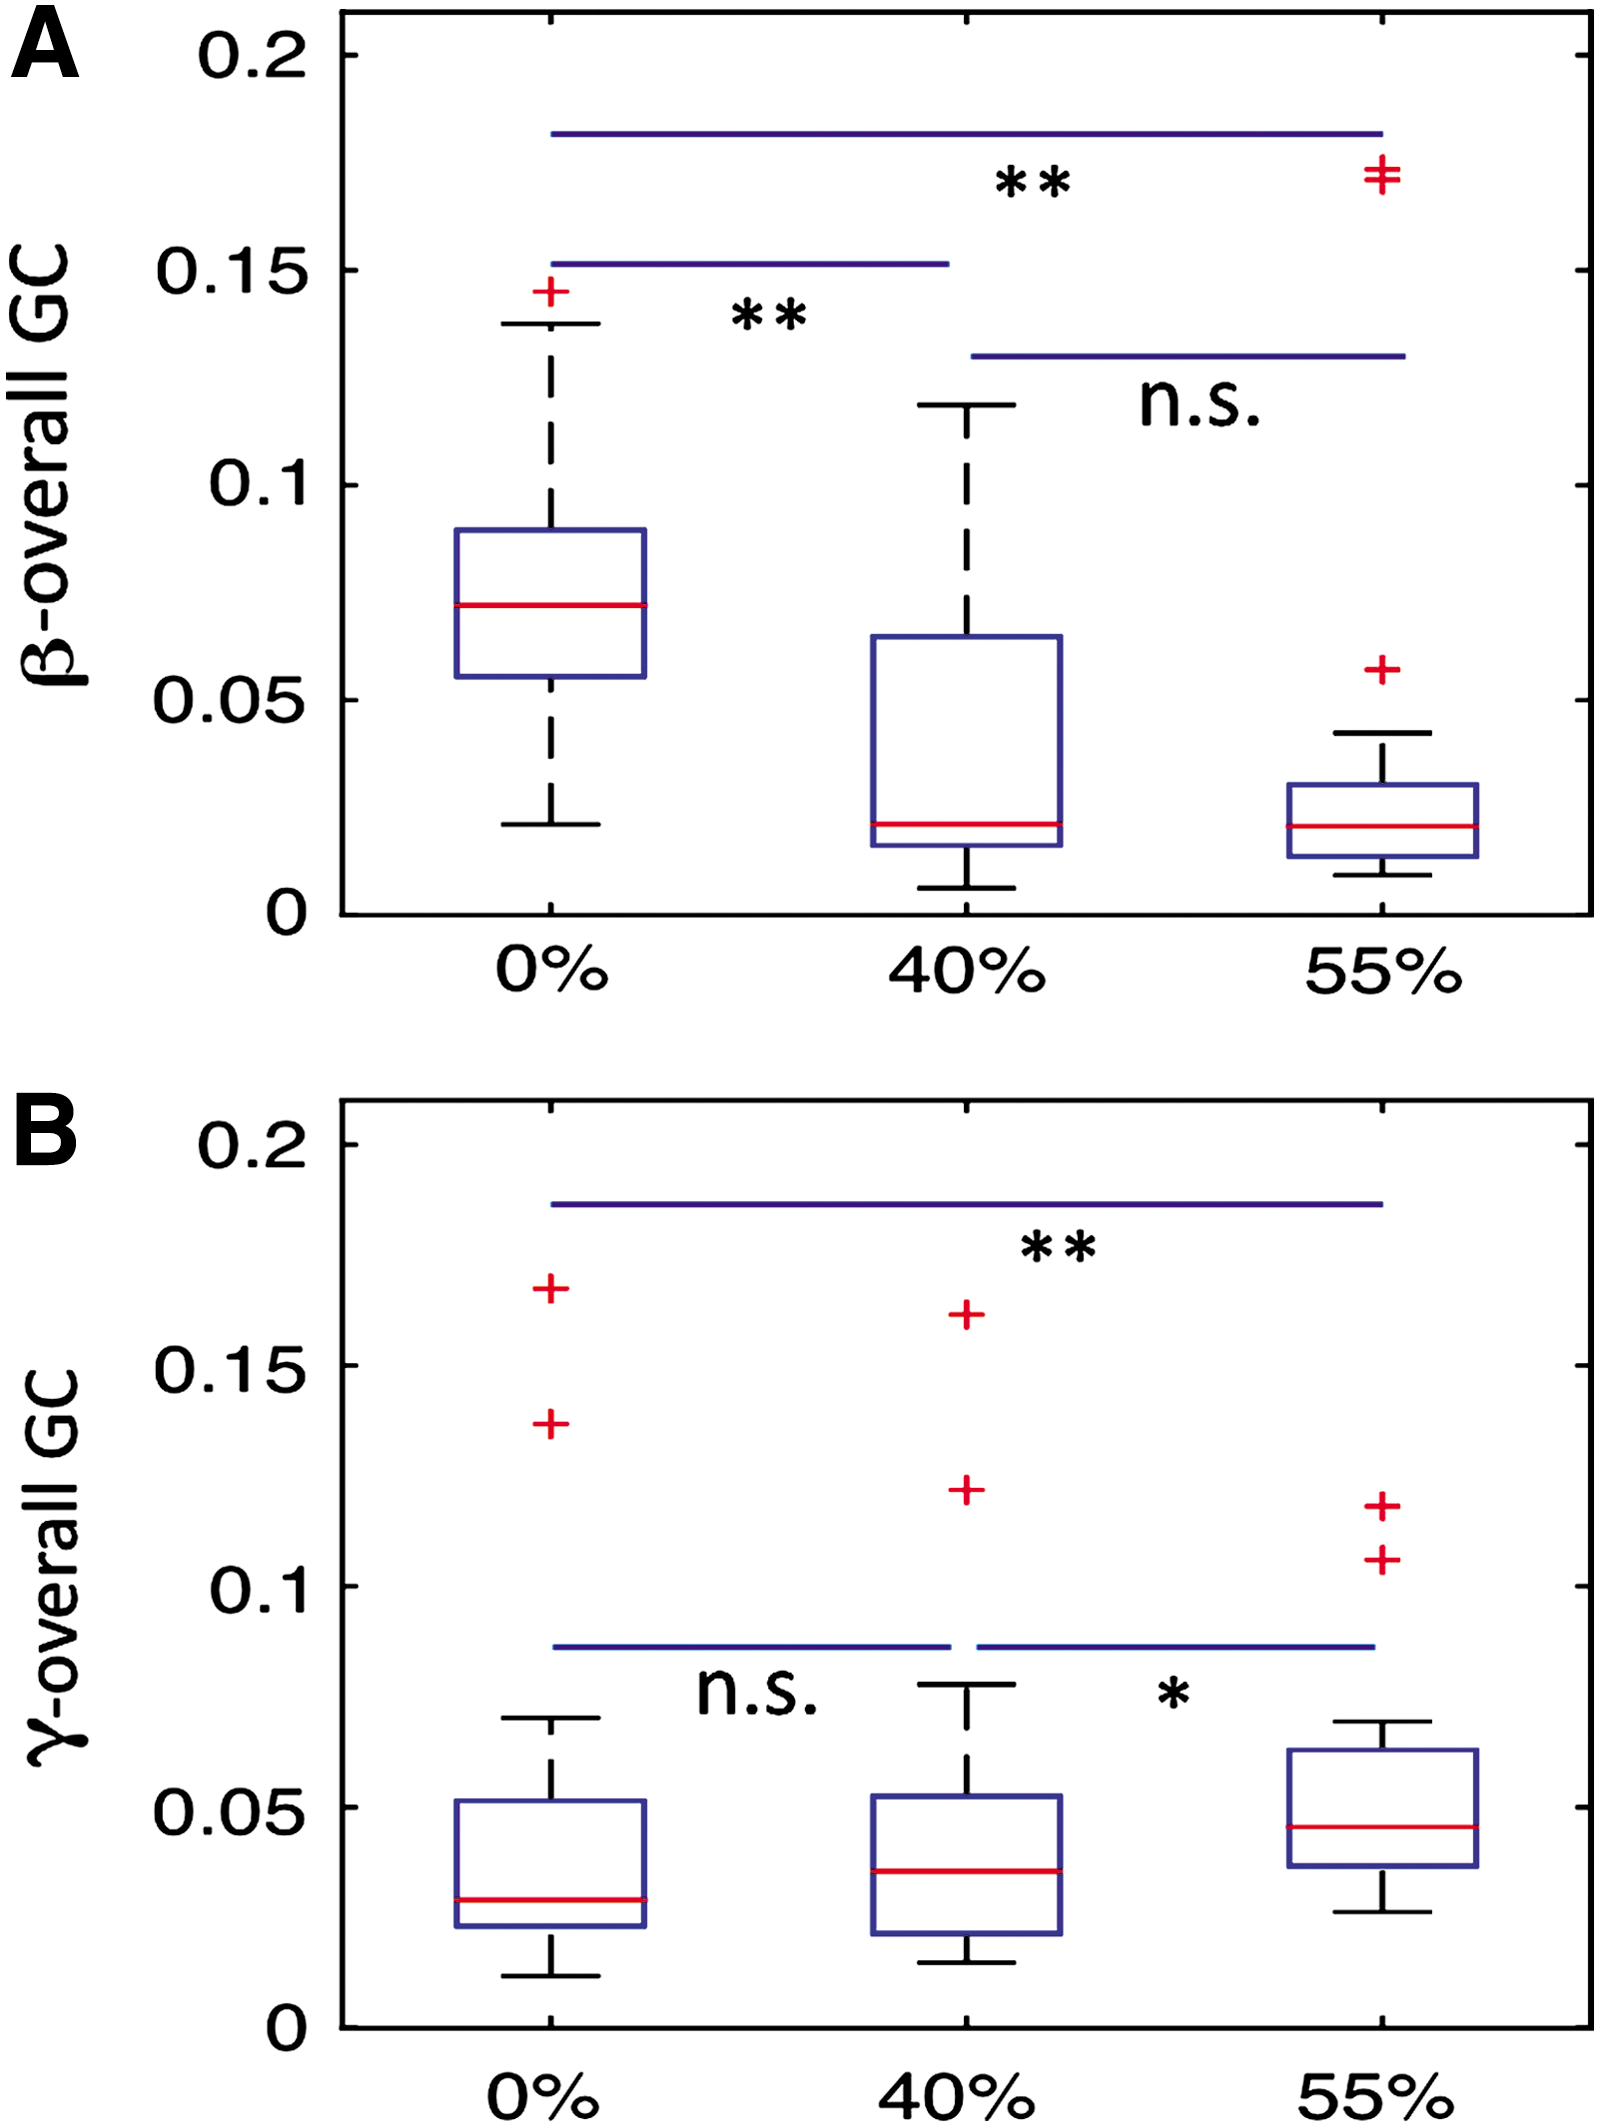
Comparison of overall connectivity strength between the FFA, PPA, and DLPFC among all three noise levels in
Brain–behavior correlation
In gamma band, the RTs positively correlated with the measures of network activity, especially in the FFA-PPA pair (Fig. 11A, B). The correlation coefficient (r) and corresponding p value (FDR corrected) are presented. In beta band (Fig. 11C–F), the measures of connectivity showed a negative trend with the RTs, but did not reach a significant threshold after FDR correction, except the FFA to PPA connection (Fig. 11E).

Relationship between connectivity strength (GC) and RT of all three noise levels in TF1 (0–125 msec) for gamma band
Discussion
The present study examined the neural oscillatory networks and their dynamics in face or house image categorization. The key nodes involved in such visual processing—FFA, PPA, and DLPFC—often coactivate even in milliseconds, therefore making it difficult to clearly identify their distinct functional roles within a network in previous fMRI studies. This study resolved the overall temporal flow of activation (in msec) in the FFA, PPA, and DLPFC by source localization of EEG recordings. Using GC analyses, we found two distinct oscillatory networks—beta band and gamma band—and their temporal dynamics. First, we demonstrated that beta power and beta causal interactions at both nodes and within network were significantly higher in 125–250-msec time frame, the FFA and PPA played as main outflow hubs and the DLPFC acted as an inflow hub within the network, and network interactions were negatively correlated with increase in noise level of stimuli. Second, gamma power and gamma causal interactions at nodes and within network were significantly higher in 0–125-msec time frame, the DLPFC acted as the outflow hub, and network interactions were positively correlated with increase in noise levels of stimuli. We have chosen to use GC methods in this study although other methods such as dynamic causal modeling (DCM) (Stephen et al., 2010) can achieve similar goals. GC is a data-driven technique and relies on fewer assumptions about the underlying interactions and dynamics. GC is also computationally less intensive than DCM. Recent studies indicate that if applied appropriately, both GC and DCM can yield similar and consistent results.
Earliest peak of cortical activity occurred in the visual cortex (BA17/18) at ∼60 msec after stimulus onset, which was in accord with previous findings (Vanni et al., 2001). Peak activation then occurred in the VTC (BA37: the right FFA and the left PPA) at ∼160 msec. Activation of FFA and PPA for perception of faces or houses was consistent with fMRI and MEG investigations (Baldauf and Desimone, 2014; Haxby et al., 2001; Ishai, 2008; Ishai et al., 2005; Kanwisher and Yovel, 2006). Moreover, activation time frame of FFA was also similar to prior reports (Herrmann et al., 2005; Wynn et al., 2008). The peak activation observed in the DLPFC (BA9) at ∼224 msec was close in accord with an electrophysiological study that reported activation of the DLPFC at ∼170–210 msec (Adhikari et al., 2014); however, it was in a somatosensory domain. Activation of the DLPFC in decision-making has been repeatedly reported in previous fMRI and EEG studies (Adhikari et al., 2014; Heekeren et al., 2004, 2006, 2008; Liu et al., 2013; Philiastides and Sajda, 2007). Our findings thus resolved a systematic source-level activation pattern of temporal evolution in the FFA, PPA, and DLPFC for visual face or house categorization. One limitation of our study is it lacks activation of the superior temporal sulcus, which is usually reported in a distributed network for face perception (Haxby et al., 2000).
Power spectra at the FFA, PPA, and DLPFC showed peak activity in beta band and gamma band when the participants categorized face or house images. Prior studies have linked beta oscillations with motor functions (Baker, 2007; Chakarov et al., 2009; Davis et al., 2012; Klostermann et al., 2007; Riddle and Baker, 2006). Beta oscillations are shown in maintaining accuracy of task in decision-making (Hipp et al., 2011; Siegel et al., 2011). Gamma oscillations have been demonstrated in a wide range of brain processes, including multisensory and sensorimotor integration, attention, memory formation, and perceptual binding (Buzsaki and Wang, 2012; Fries, 2009; Jensen et al., 2007; Senkowski et al., 2008). These neural oscillatory features reflect the distinct aspect of neuronal synchronization similar to that observed in auditory–visual (Hipp et al., 2011) and somatosensory (Adhikari et al., 2014) perceptions. GC spectra results demonstrated that interareal brain synchronization and interactions were mediated by beta band and gamma band. The anatomical interareal and laminar neural circuitry in the brain might support the occurrence of such oscillatory activities and their modulations in cognitive tasks (Buzsaki and Wang, 2012; Siegel et al., 2012). Anatomical studies have provided the evidence of rich connections of the DLPFC with sensory brain areas (Miller and Cohen, 2001). The DLPFC receives visual, somatosensory, and auditory sensory inputs from occipital, parietal, and temporal cortices (Petrides and Pandya, 1999) and its anatomical connection with premotor/motor areas supports the motor outputs (Lu et al., 1994).
Beta power and beta network activity were significantly higher in the 125–250-msec time frame after stimulus onset, consistent with average source-level peak activities. Causal outflow calculations further demonstrated that the lower order sensory areas (FFA and PPA) acted as outflow hubs and the DLPFC as the inflow hub. This was supported by the model of feedforward hierarchical integration process from sensation to those that ultimately end up into action (Mazurek et al., 2003; Smith and Ratcliff, 2004). As cortical circuits implementing cognitive processes might engage highly recurrent interactions (Wang, 2008) mediated by bidirectional cortico-cortical connections (Felleman and Van Essen, 1991), our results also demonstrate that interactions were bidirectional, such as in the time frame of highest activity (TF2). Overall beta connectivity strength was significantly suppressed for elevated noise level of stimuli. Since beta oscillation has been reported for better accuracy or precision during perceptual decision-making (Hipp et al., 2011; Siegel et al., 2011), the network activity suppressed in our results might implicate the underlying neural mechanisms that have also been behaviorally reflected for elevated noise levels. Such suppression might result due to less flow of decision-related information among the FFA, PPA, and DLPFC when the stimuli were degraded.
In contrast, gamma band results revealed that node and network activities were higher in 0–125-msec time frame compared with other time frames. Net causal outflow calculations further uncovered that the DLPFC was the outflow hub. This was in accord with a well-known role of DLPFC in top-down processing for attentional selection of relevant sensory information and sensory updating (Miller and Cohen, 2001). We provided this direct evidence from temporal evolution of enhanced gamma activity. Gamma oscillations have been consistently reported for perceptual binding (Uhlhaas and Singer, 2006; Uhlhaas et al., 2008) for a variety of tasks. Enhanced features of the node and the network activities with increase in noise might imply that such bindings are required when sensory information is limited. Recent reports also suggest that the larger prediction error is associated with increase in gamma activity (van Pelt et al., 2016) and larger precision or accuracy is associated with increase in beta activity (Hipp et al., 2011; Siegel et al., 2011). Therefore, an increase in connectivity in gamma band and a decrease in connectivity in beta band with noise levels are also consistent with functional role of beta and gamma oscillations as suggested by the theory of prediction error framework (van Pelt et al., 2016).
In summary, we evaluated the timing and oscillatory network dynamics in the key nodes—the FFA, PPA, and DLPFC—of face or house perception. We demonstrated that beta band node and network activities were most active at 125–250 msec, the FFA and PPA acted as main outflow hubs, and the beta network was negatively correlated with increase in noise levels of face or house images. We further found that gamma band node and network activities were most active at 0–125 msec, the DLPFC acted as the main outflow hub, and the network was correlated with noise level. These findings provide important insights about how sensory information enters and organizes in the FFA, PPA, and DLPFC in visual perceptual decision-making.
Footnotes
Acknowledgment
The author, M.D., would like to acknowledge the National Science Foundation grant support (CAREER AWARD BCS 0955037).
Author Disclosure Statement
No competing financial interests exist.
References
Supplementary Material
Please find the following supplemental material available below.
For Open Access articles published under a Creative Commons License, all supplemental material carries the same license as the article it is associated with.
For non-Open Access articles published, all supplemental material carries a non-exclusive license, and permission requests for re-use of supplemental material or any part of supplemental material shall be sent directly to the copyright owner as specified in the copyright notice associated with the article.