
Abstract
Listening to familiar music has recently been reported to be beneficial during recovery from stroke. A better understanding of changes in functional connectivity and information flow is warranted to further optimize and target this approach through music therapy. Twelve healthy volunteers listened to seven different auditory samples during an fMRI scanning session: a musical piece chosen by the volunteer that evokes a strong emotional response (referred to as: “self-selected emotional”), two unfamiliar music pieces (Invention #1 by J. S. Bach and Gagaku — Japanese classical opera, referred to as “unfamiliar”), the Bach piece repeated with visual guidance (directed music listening [DML]), and three spoken language pieces (unfamiliar African click language, an excerpt of emotionally charged language, and an unemotional reading of a news bulletin). Functional connectivity and betweenness maps, a measure for information flow, were created with a graph-theoretical approach. Distinct variation in functional connectivity was found for different auditory samples consistently for all subjects. Largest brain areas were recruited for processing self-selected emotional music or culturally unfamiliar music. Maps of information flow correlated significantly with fMRI blood oxygenation level dependent (BOLD) activation maps (p < 0.05). Observed differences in BOLD activation and functional connectivity may help explain previously observed beneficial effects in stroke recovery, as increased blood flow to damaged brain areas stimulated by active engagement through music listening may have supported a state more conducive to therapy.
Introduction
E
Due to this widespread activation across various functional networks, music listening has been proposed to be beneficial as a therapeutic instrument in stroke rehabilitation (Sarkamo et al., 2008). A recent study following patients with left or right middle cerebral artery stroke up to 6 months postinjury demonstrated enhanced recovery in the domains of verbal memory and focused attention when listening to self-selected music in addition to standard therapy compared to a control group that consisted of patients listening to spoken words in addition to standard therapy or only receiving standard therapy (Sarkamo et al., 2008). In that study, the authors assume “self-selected” music to be familiar to the listener, but the degree of emotional connection or intensity was unknown. That is, a piece that was liked or a piece that evoked a heightened or extreme emotional response. Evaluation of changes in gray matter volume (GMV) based on structural magnetic resonance imaging (MRI) at baseline (1 week after stroke onset) and at 6 months follow-up revealed a specific network of frontal areas (left and right superior frontal gyrus [SFG], right medial SFG) and limbic areas (left ventral/subgenual anterior cingulate cortex [SACC] and right ventral striatum) in patients with left hemisphere damage, in which GMV increases were larger for subjects listening to self-selected music than the control groups. Moreover, the gray matter (GM) reorganization in the frontal areas correlated with enhanced recovery of verbal memory, focused attention, and language skills, whereas the GM reorganization in the SACC correlated with reduced negative mood (Sarkamo et al., 2014).
Clearly, listening to self-selected music introduces the element of familiarity, but it remains unclear if this element was the determining factor enhancing recovery rather than inherent properties of music as such. In particular, the reorganization of the SACC may be a direct consequence of listening to a known familiar piece repetitively right after the stroke assault. To better understand the effects of music itself, we conducted the here presented pilot study, in which healthy volunteers listened to different genres of music (“self-selected emotional” and “unfamiliar”), and to spoken words (unfamiliar, emotionally charged, and unemotional) during fMRI scanning sessions, and differences between the experiences were quantified in BOLD activation maps, in functional connectivity, and in the flow of information. We hypothesize that active listening to self-selected emotional music and to unfamiliar music will result generally in larger activation, as well as increased functional connectivity, in both common and unique activations areas, than listening to the different forms of spoken words. Such a finding would be in support of the beneficial effects of music listening observed by Sarkamo et al. (2014) and would help to better understand how music listening might be optimized and even targeted to provide optimal rehabilitative and therapeutic support in a music therapy context. We also hypothesize that in addition to brain activation when concurrently listening to music, latent processing may occur. To be able to detect and quantify this latent effect, a block design was chosen with alternating periods of rest and music.
Methods and Materials
Subject information
Approval of the institutional review board was obtained for this prospective study. Twelve healthy volunteers (no chronic medication, no psychoactive drugs, eight female, four male, with varying relationships to music [no music experience, novice, professional] from ages 18 to 82, four males) were recruited. We chose a heterogeneous group of subjects not to be biased in the results toward gender, age, or degree of music education/knowledge. The focus of this study is on similarities across subjects for each music and language piece and differences across pieces.
MRI acquisition protocol
The fMRI experiment was carried out on a dedicated imaging research human MRI scanner of the MRI core of our institution (Ingenia 3T, Philips Healthcare, Best, The Netherlands) and consisted of two parts: acquisition of a high-resolution scan for anatomical reference (turbo field echo pulse sequence, FOV = 24 × 24 × 16.5 cm, resolution = 1.0 mm isotropic, TR = 8.2 msec, and TE = 3.8 msec) covering the entire brain in axial orientation and the rapid acquisition of T2* weighted contiguous slices covering the entire brain during the fMRI paradigms while the subject listened to the different auditory stimuli (echo planar imaging pulse sequence, orientation = axial, FOV = 22 × 22 × 12 cm, resolution = 1.5 × 1.5 × 3.0 mm, TR = 2400 msec, TE = 35 msec, number of dynamics = 130, and repetition time = 2.4 sec). The fMRI paradigm was of a block design with six alternating periods of silence and auditory stimulus, followed by a period of 24 sec of silence (duration: 5 min 12 sec, total number of acquired brain volumes: 130).
Auditory pieces
The goal of the playlist presented to the subject was to present examples of music and speech that contrasted in their levels of familiarity and emotional engagement. In particular, we wanted to investigate whether there was coherence among the subject group in their responses to familiar versus unfamiliar stimuli and emotional versus unemotional stimuli. Would we be able to eventually tell, just by looking at a scan, whether the subject was listening to music they loved or had never heard before? To speech they did or did not understand? The answers to these questions would give us further insights into how exposure to familiar music might affect stroke recovery: it would show us a spectrum of responses in healthy subjects; and it would give us a clearer picture of which brain regions are activated by familiarity and emotional attachment. The number of auditory pieces varied depending on tolerance of the total scan duration by the subject. A total of seven auditory pieces were used in this order: 1. Self-selected emotional music (self): selected by the subject, a piece with strong emotional attachment (downloaded from iTunes, Apple, Inc., Cupertino) (12 subjects). 2. J. S. Bach Invention #1 (Bach): an instrumental piano piece (12 subjects). Selected for its medium level of rhythmic and melodic variation. That is, not to be so complex as to make listening and following the music difficult, possibly resulting in a less active or attentive listening experience, and not to be so repetitive as to lose the interest of the listener, also risking a less active or attentive listening experience. 3. J. S. Bach Invention #1 DML (Bach visual): with simultaneous display of a moving cursor on a score sheet (red) to guide the subject, and colored notes (blue) on primary motives to aid the eye, correlating to the ear, in following the development of the music (9 subjects, subjects #1, #7, and #8 excluded). 4. Gagaku (Gagaku): an instrumental excerpt from a classical Japanese opera (12 subjects). This music from the medieval Japanese court is largely unfamiliar to Western listeners: its use of deliberate detuning, irregular rhythms, and expressive performance noises marks it as very different from traditional Western practice. 5. Click language (Click): an excerpt of unfamiliar speech in the clicking language of the Xhosa tribe of South Africa (11 subjects, subject #5 excluded). The percussive “clicks” are unlike anything found in Indo-European languages. 6. Emotionally spoken language (Chaplin): An excerpt of Charlie Chaplin's climactic speech in “The Great Dictator” (7 subjects, subjects #1, #5, #9, #10, and #12 excluded). 7. Unemotional spoken language (Cronkite): a dispassionate reading of news bulletins by the anchorman Walter Cronkite (five subjects, subjects #1, #2, #4, #5, #9, #10, and #12 excluded). This selection was chosen to contrast with the emotionally spoken language.
Audio and video system
To enhance the audio quality, an additional speaker, placed in the MRI control room, was connected to the scanner bed headphones through air tubing. The digital equalizer of the digital audio playback device (iTunes, Apple, Cupertino, CA) was ramped to enhance high frequencies, as the tubing preferentially attenuated these tones, so that the research subjects could hear the full-frequency spectrum of the audio tracks.
For DML, a video was presented on a computer screen, which was observed by the subjects through a mirror placed on top of the MRI head coil.
MRI analysis
BOLD activation analysis
The functional MRI (fMRI) image data were analyzed using the Generalized Linear Model (GLM) as implemented by the AFNI software (Cox et al., 2012). Standard preprocessing included motion correction and spatial smoothing. BOLD activation for all tasks was determined relative to the rest periods in the paradigm (i.e., the 30 sec periods of silence interleaved with the music periods). BOLD activation maps represent t-values from the GLM analysis using the AFNI program 3dDeconvolve.
Group BOLD activation maps
Individual BOLD activation maps were transferred into Talairach space, and averaged group BOLD activation maps were created by conducting a student's t-test and only keeping voxels with statistically significant activation determined by a p value lower than 0.05.
Comparison of group BOLD activation patterns
Similarity of the group-averaged BOLD activation maps was quantified by the pairwise Pearson CC of the activation pattern that was obtained using the maximum BOLD activation value for each Brodmann region (AFNI Talairach atlas).
fMRI cluster analysis
The largest six clusters of activation in the group-averaged BOLD activation maps were determined for each auditory piece with the AFNI 3dclust software (cluster connection radius: 1 mm, minimum cluster volume: 600 m3).
Functional connectivity analysis
Preprocessing of fMRI datasets
Network graphs of functional connectivity during listening to each individual auditory sample were created using conventional methodology (F Helekar SA et al., 2010; Friston, 2011) with implementation and applications described in the studies (Karmonik et al., 2013; Shy et al., 2014; Killock, 2014). In short, fMRI datasets were first motion corrected and bandpass filtered to remove constant offset and high-frequency contributions in the time BOLD signal curves. Then, from the group-averaged BOLD activation maps, a mask was created (AFNI, Student's t-test, p < 0.05, voxels included within 45% of highest activation) to only select brain regions that participated strongly in the music listening task (Fig. 1). The voxel BOLD signal time courses were extracted and voxel–voxel correlation was quantified by calculating the Pearson CC pairwise between all voxels in the brain that passed the masking procedure described above. Graph networks were created as gml files with the voxels as vertices and the CC values as edge weights (igraph package of the R project).
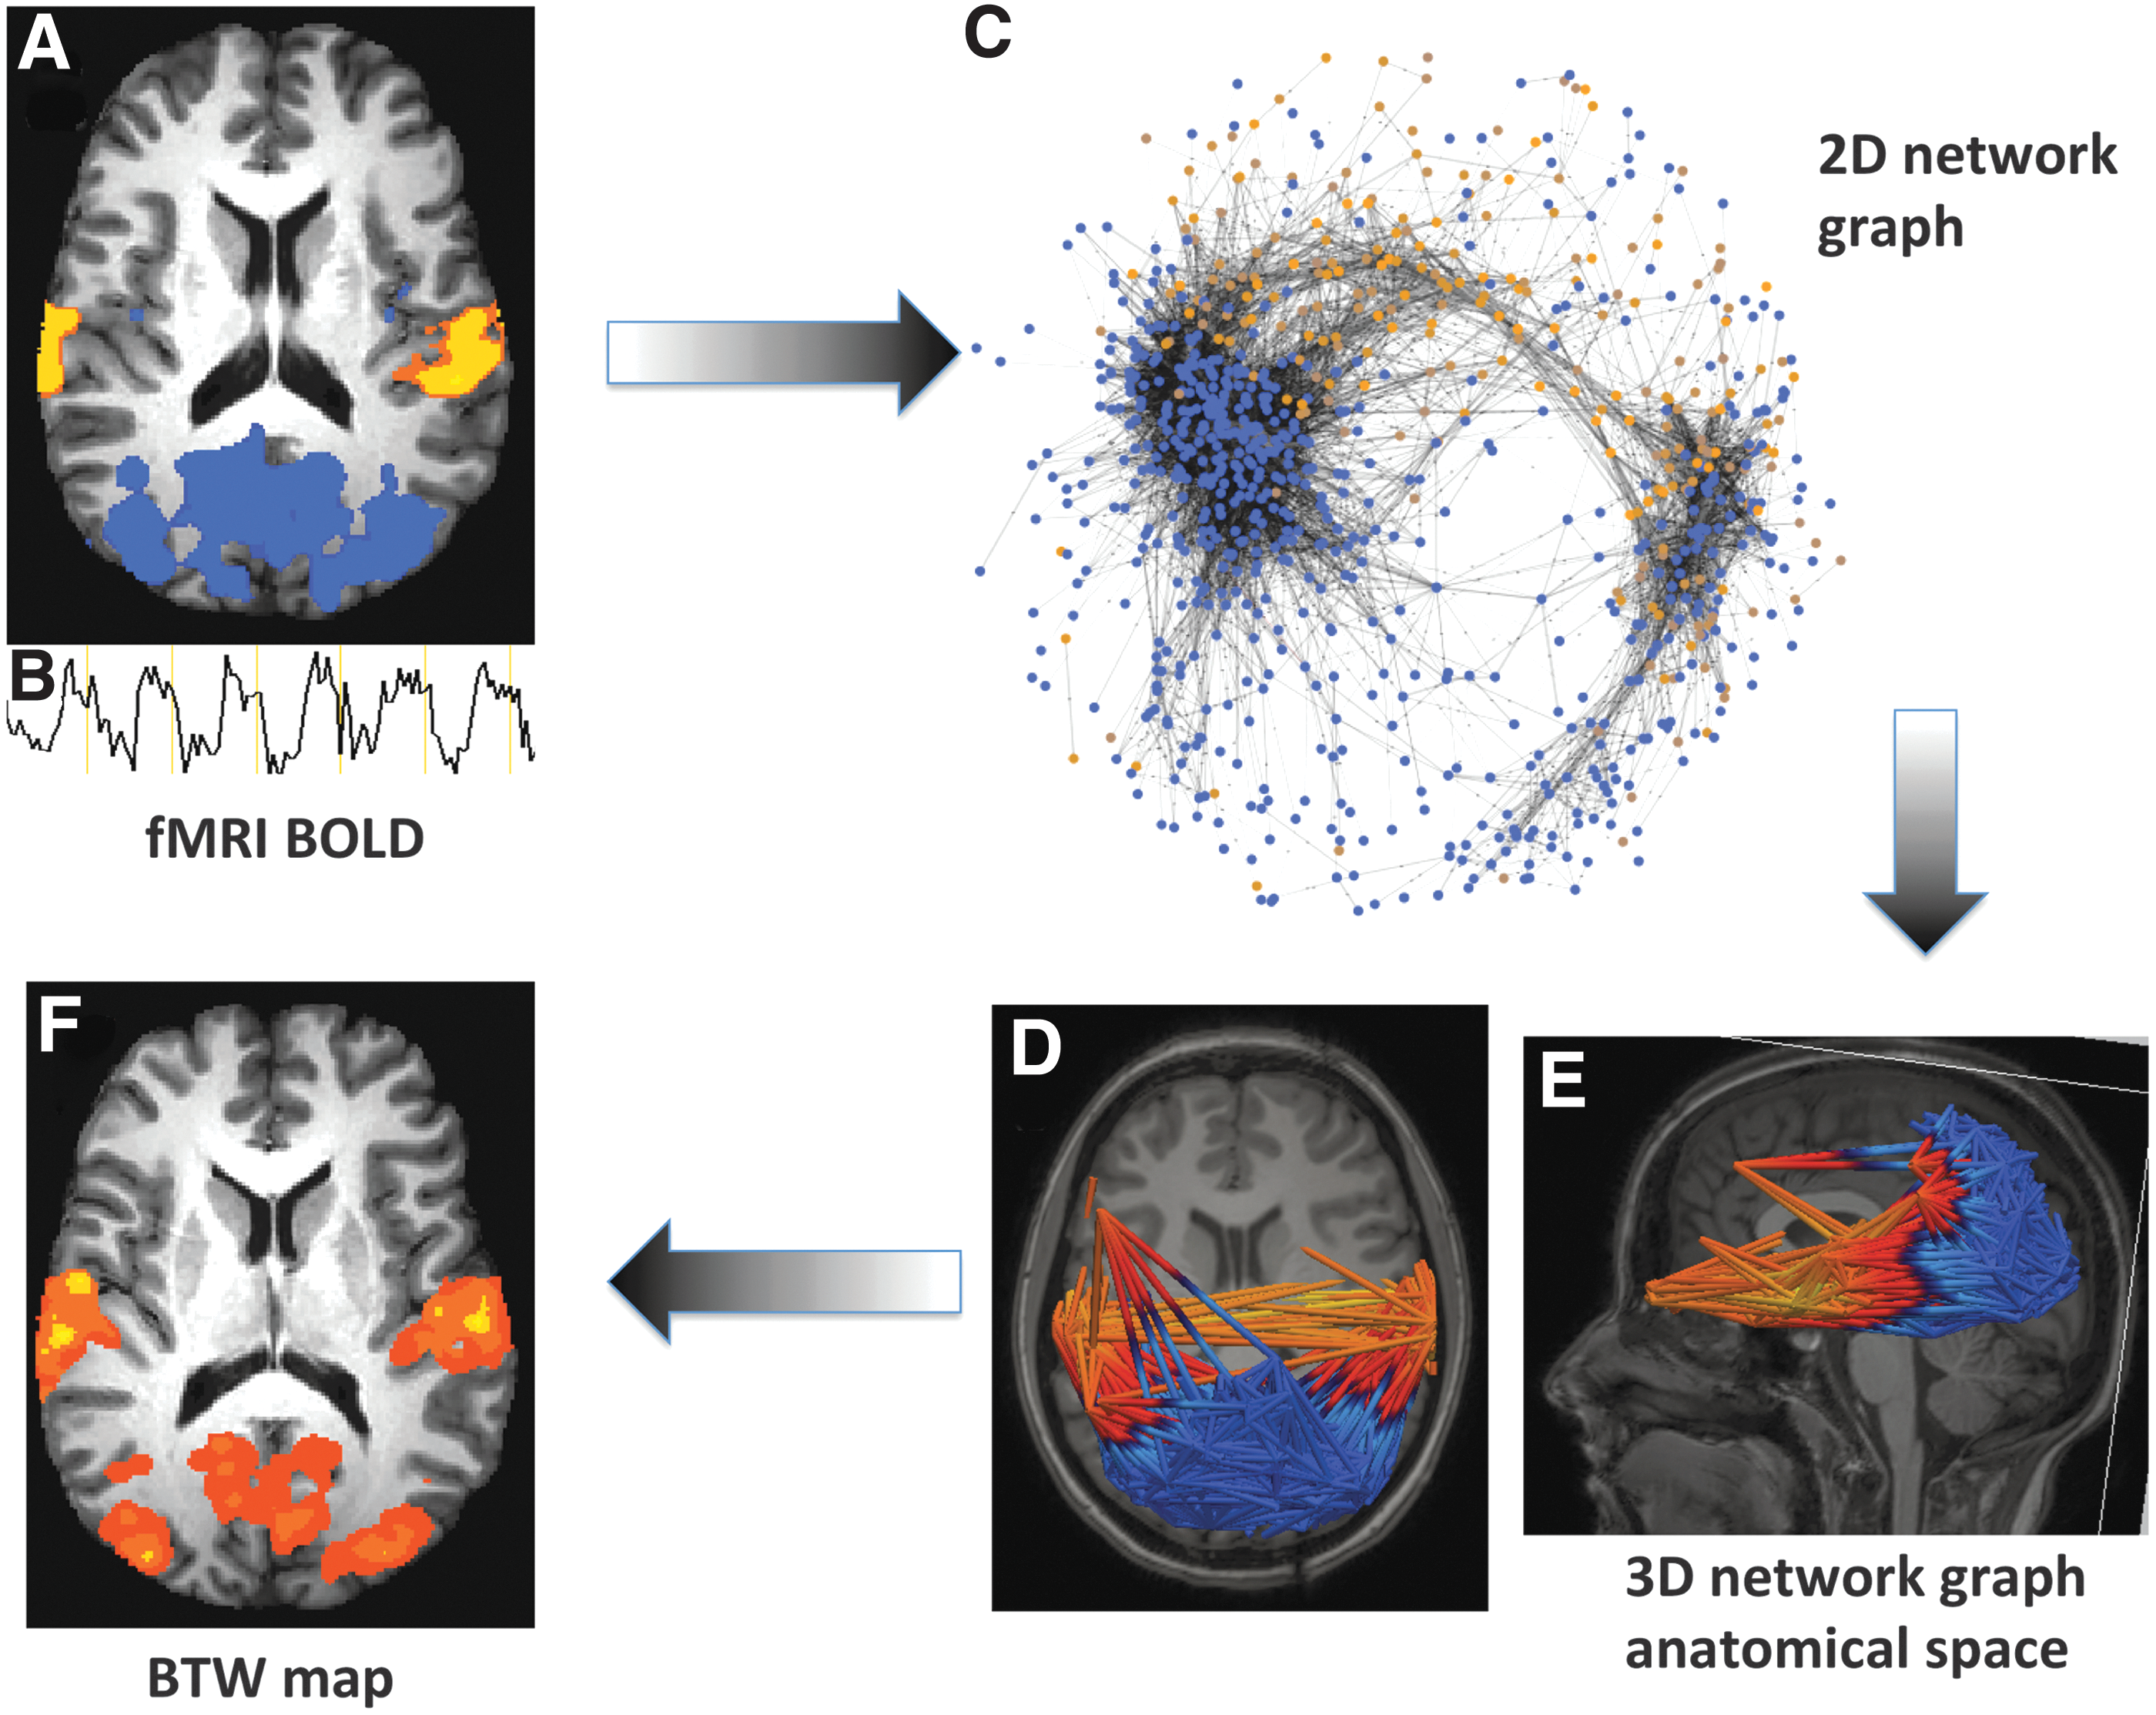
Schematically illustrating the algorithm that was used to create the 2D and 3D graph networks. Network nodes were selected as voxel from the average fMRI blood oxygenation level dependent (BOLD) activation maps (p < 0.05)
Graph network parameters
Graph density, average path length, network diameter, clustering coefficient, and the largest and second largest eigenvalue of the graph adjacency matrix were calculated and compared between groups (t-test, p < 0.05) as a measure of similarity for the functional connectivity graphs. Correlation between these parameters for different auditory pieces was determined using the values of these parameters for individual subjects.
Visualization of functional connectivity graphs in individual anatomical space
A conventional approach for the visualization of graph networks consists of a two-dimensional display (igraph, R project). As the nodes of the networks represent voxels in the brain, edges between these nodes can be transferred into the anatomical space of each individual subject (ParaView, Kitware, Inc.) and the corresponding graph networks can so be visualized as 3D networks to better illustrate the connections between different regions in the brain.
Anatomical betweenness maps
From the functional connectivity graph, the BTW parameter, a graph network parameter, was derived. This parameter measures to what extent a node is part of information flow across the network among other vertices (igraph Package, R project) and is defined as the number of shortest paths passing through the vertex (here representing a brain voxel). BTW values were then transformed back from the network graph into anatomical space, and average BTW maps for each auditory piece were created in Talairach space. The Pearson CC was calculated between the absolute maximum BOLD and BTW values of each Brodmann region as defined by the AFNI Talairach atlas.
Results
BOLD activation analysis
Cluster analysis and activation overlap
The BOLD activation maps for all auditory pieces showed strong activation along the bilateral STG and the bilateral inferior frontal gyrus (Fig. 2). Except for those regions, BOLD activation varied between samples (Fig. 3) as discussed qualitatively in the following. The detailed results for the cluster analysis can be found in Table 1.
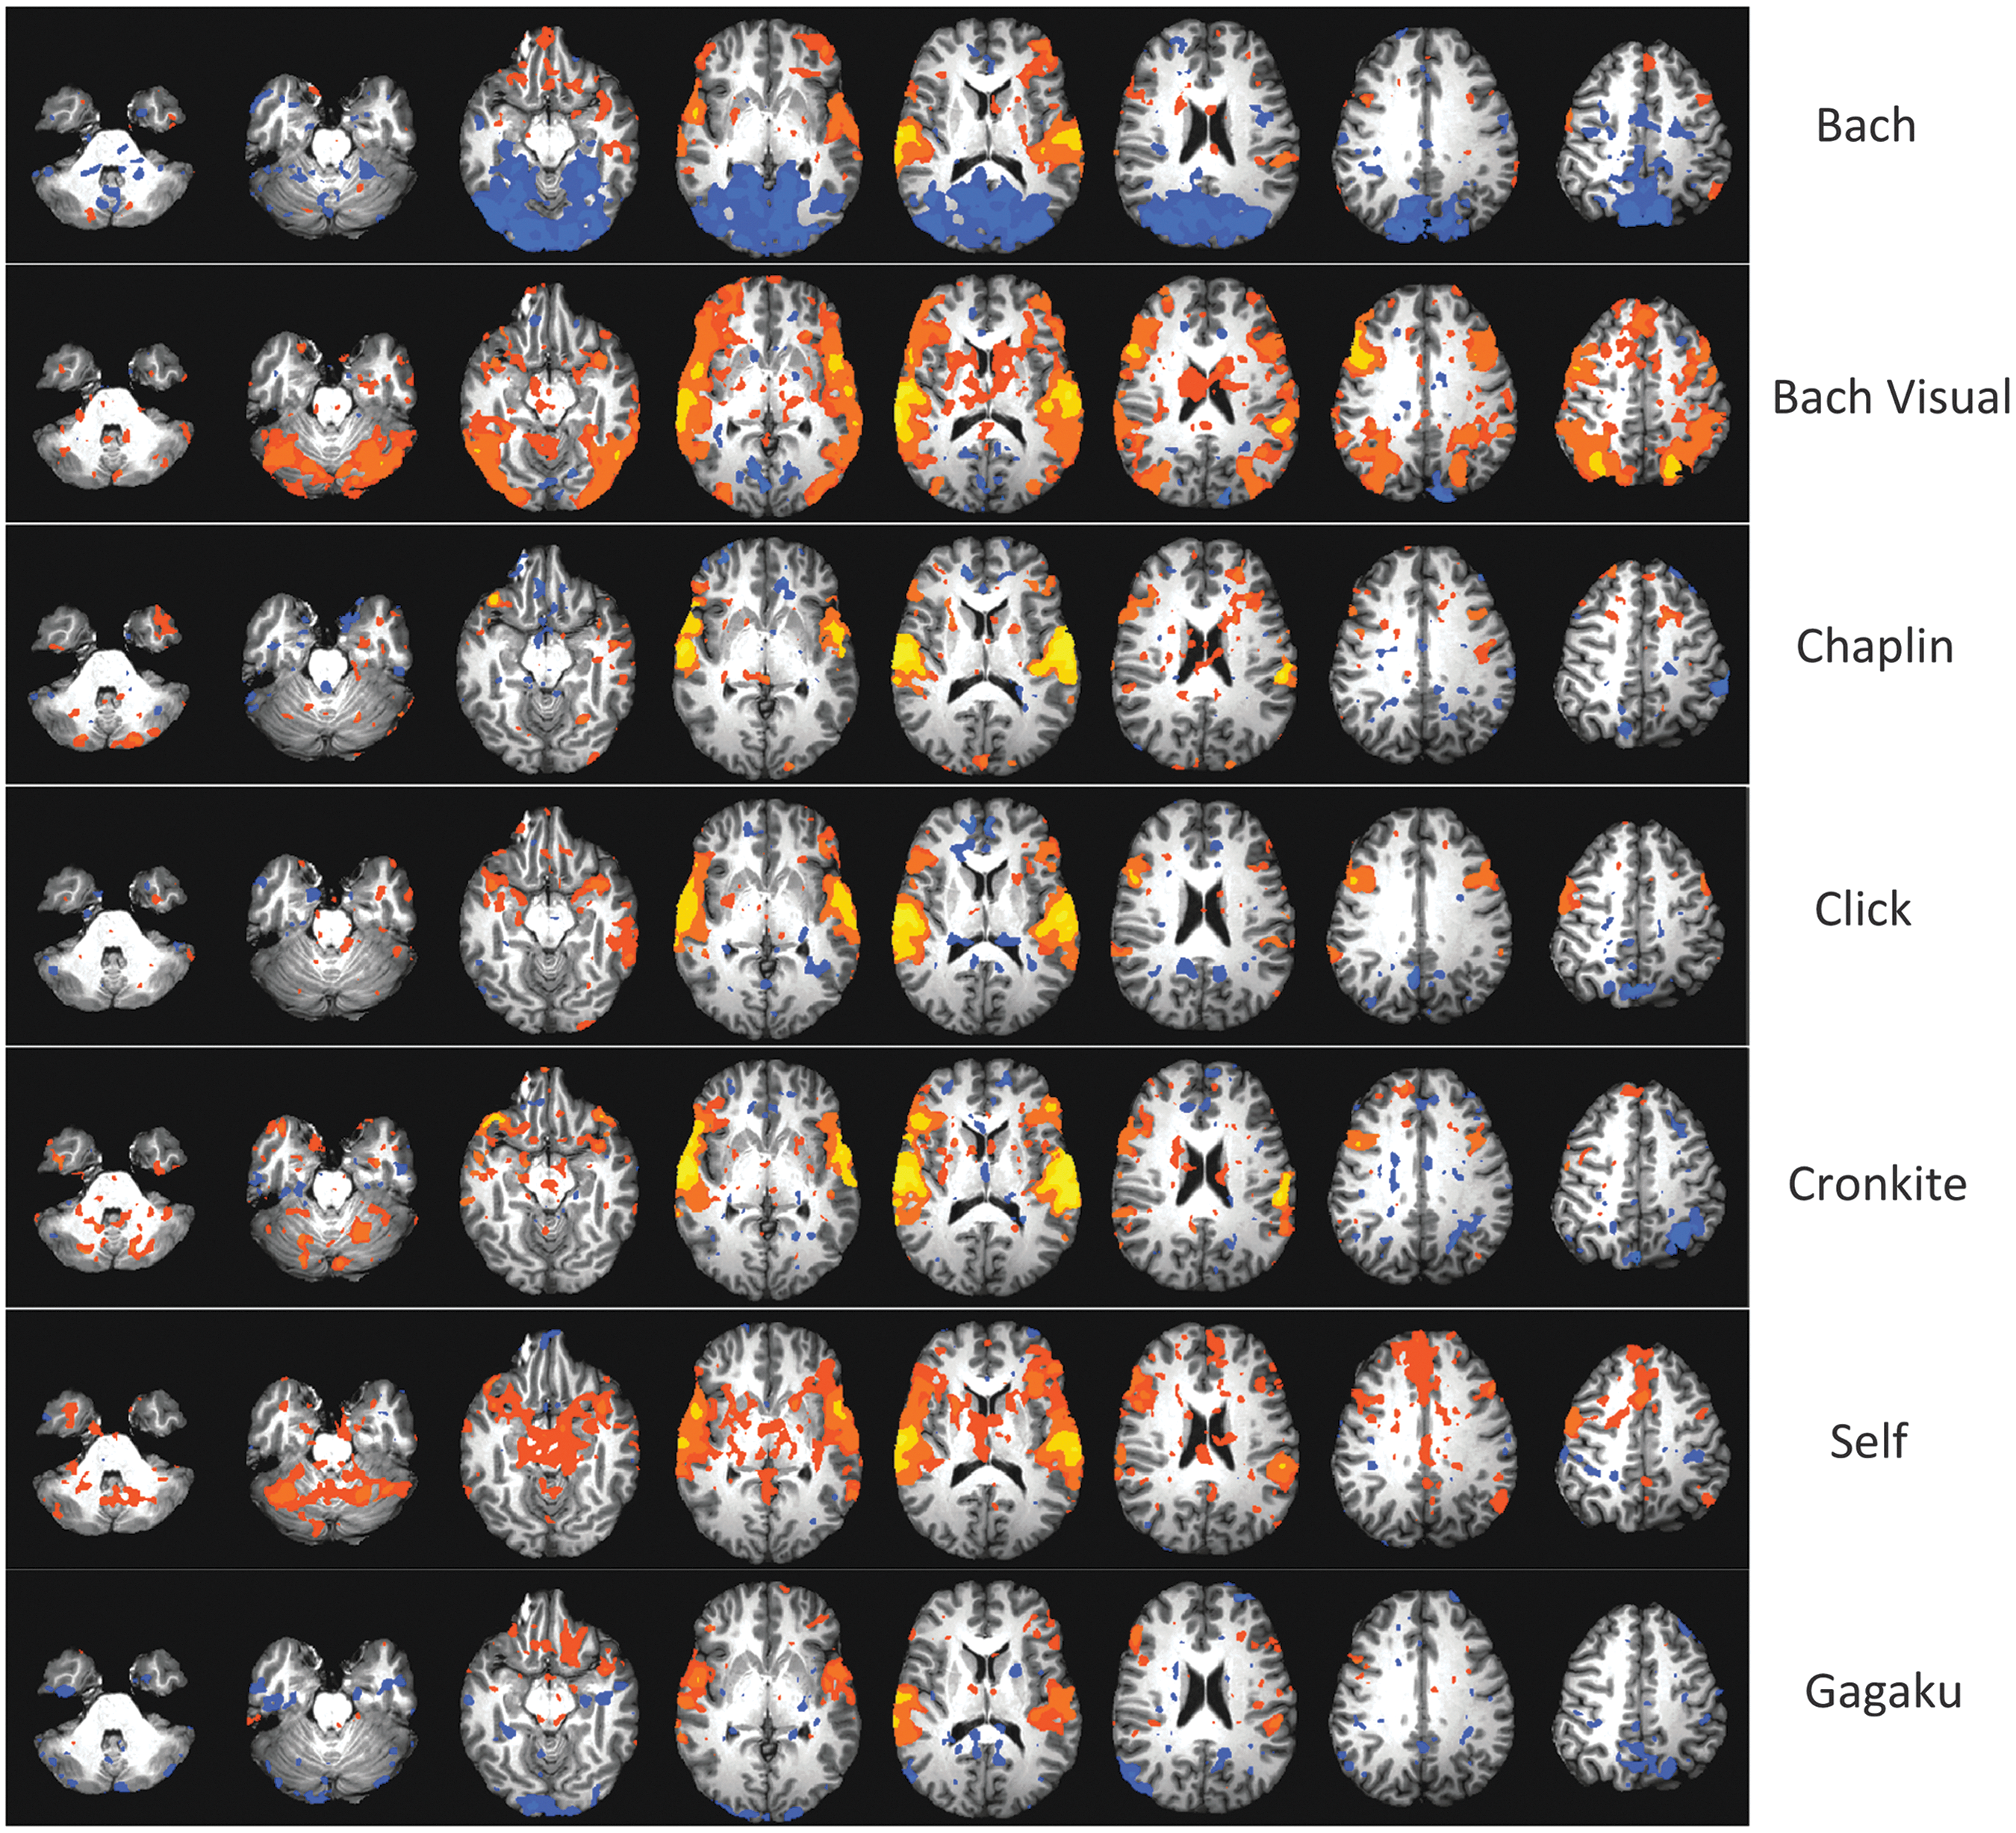
fMRI activation maps averaged over all subjects (p < 0.05) for all auditory pieces. Increase in blood flow during music listening periods is represented by orange-yellow colors and increase in blood flow during silent periods by blue colors. The Bach piece, the visual presentation of the Bach piece, the self-selected piece, and Gagaku showed most widespread activation. Most pronounced latent activation (during quiet periods) occurred for the auditory Bach piece.
First column gives cluster number (ordered large to small), second column provides center of mass of each cluster in MNI coordinates: RL, left-right; AP, anterior-posterior; IS, inferior-superior using RAI coordinates order. Third column shows location of cluster based on larger than 4% volume contribution identified by AFNI's whereami command. Fourth column lists cluster volume. (l), left; (r), right; (b), bilateral; CUN, cuneus; LIG, lingual gyrus; PRC, precuneus; MOG, middle occipital gyrus; STG, superior temporal gyrus; TTG, transverse temporal gyrus; INS, insula; POG, postcentral gyrus; PEG, precentral gyrus; MFG, middle frontal gyrus; IFG, inferior frontal gyrus; SFG, superior frontal gyrus; PCL, paracentral lobule; CIG, cingulate gyrus; MEG, medial frontal gyrus; MTG, middle temporal gyrus; SPL, superior parietal lobule; SOG, subcallosal gyrus; ANC, anterior cingulate; IPL, inferior parietal lobule; CAU, caudate; THA, thalamus; LNN, lentiform nucleus; IOC, inferior occipital gyrus; FUG, fusiform gyrus; TUB, tuber; UVU, uvula; CUL, culmen; DEC, declive; CET, cerebellar tonsil; NOD, nodule; SMG, supramarginal gyrus; PYR, pyramis; ISL, inferior semilunar lobule; ITG, inferior temporal gyrus.
Prominent features of group-averaged BOLD maps
Of all the audio pieces, the self-selected emotional music showed the most pronounced activation (highest values in the BOLD activation maps relative to the silence periods) in regions of the midbrain (periaqueductal gray), as well as in the bilateral thalamus, bilateral caudate, bilateral lentiform nucleus, the bilateral parahippocampal gyrus, the substantia nigra, the anterior cingulate (ACC), and posterior cingulate (ACC). Other areas included the bilateral medial frontal gyrus (including the supplemental motor area [SMA]), the bilateral middle frontal gyrus, and regions in the cerebellum. Areas with increased BOLD activation during resting periods (relative to the music periods) were sparse and included the bilateral postcentral gyrus, the left precentral gyrus, the bilateral inferior parietal lobule, the right insula, and the left middle temporal gyrus.
The unfamiliar auditory Bach piece showed no significant (p < 0.05) activation in most of the basal ganglia (relative to the silence periods), the parahippocampal gyrus, the substantia nigra, or cingulate. Activation in the lentiform nucleus, thalamus, and cerebellum was markedly reduced compared to the self-selected music. During rest periods compared to the music periods, increased BOLD signal was found in the bilateral precuneus, cuneus, and lingual gyrus, as well as in the cingulate, cerebellum, the SMA, and the right postcentral gyrus.
BOLD activation maps for the unfamiliar Gagaku piece (which the participating subjects confirmed was totally unknown to them) displayed increase (relative to rest) in the bilateral middle frontal gyrus; the caudate and thalamus were of similar scarcity as for the Bach piece. Focal midbrain activation existed, but not to the extent as for the self-selected music. Increased BOLD signal during the rest periods (compared to music periods) in the bilateral precuneus, the lingual gyrus, the cingulate, and the bilateral postcentral gyrus was less pronounced than for the Bach piece, but stronger than for the self-selected music.
Processing the auditory and visual input of the Bach visual (directed music listening [DML]) piece resulted in widespread activation in the entire brain in the regions discussed previously. In addition, strong activation was noted in the bilateral caudate, the bilateral occipital gyrus, the middle temporal gyrus, as well as the frontal eye fields (relative to rest periods where no music was playing and the cursor in the score sheet did not advance). Increased BOLD effect during rest was small and limited to regions in the bilateral lingual gyrus and the left cuneus.
The unfamiliar clicking language piece created a band of activation bilaterally along the entire inferior frontal gyrus. Other regions of activation included the bilateral hippocampal gyrus, lentiform nucleus, and the cerebellar tonsil. Increased activation during rest included the bilateral medial cuneus, the ACC, and PCC.
The emotional language Chaplin piece induced activation in the bilateral inferior frontal gyrus, as well as in the lentiform nucleus and thalamus. BOLD increase during rest was present mainly in the ACC. Listening to the unemotional language Cronkite piece resulted in the lowest BOLD activation of all pieces with activation mostly in the bilateral inferior frontal gyrus. Activation during rest included the ACC, the precuneus, and the left inferior frontal lobule.
Correlation analysis of BOLD activation patterns
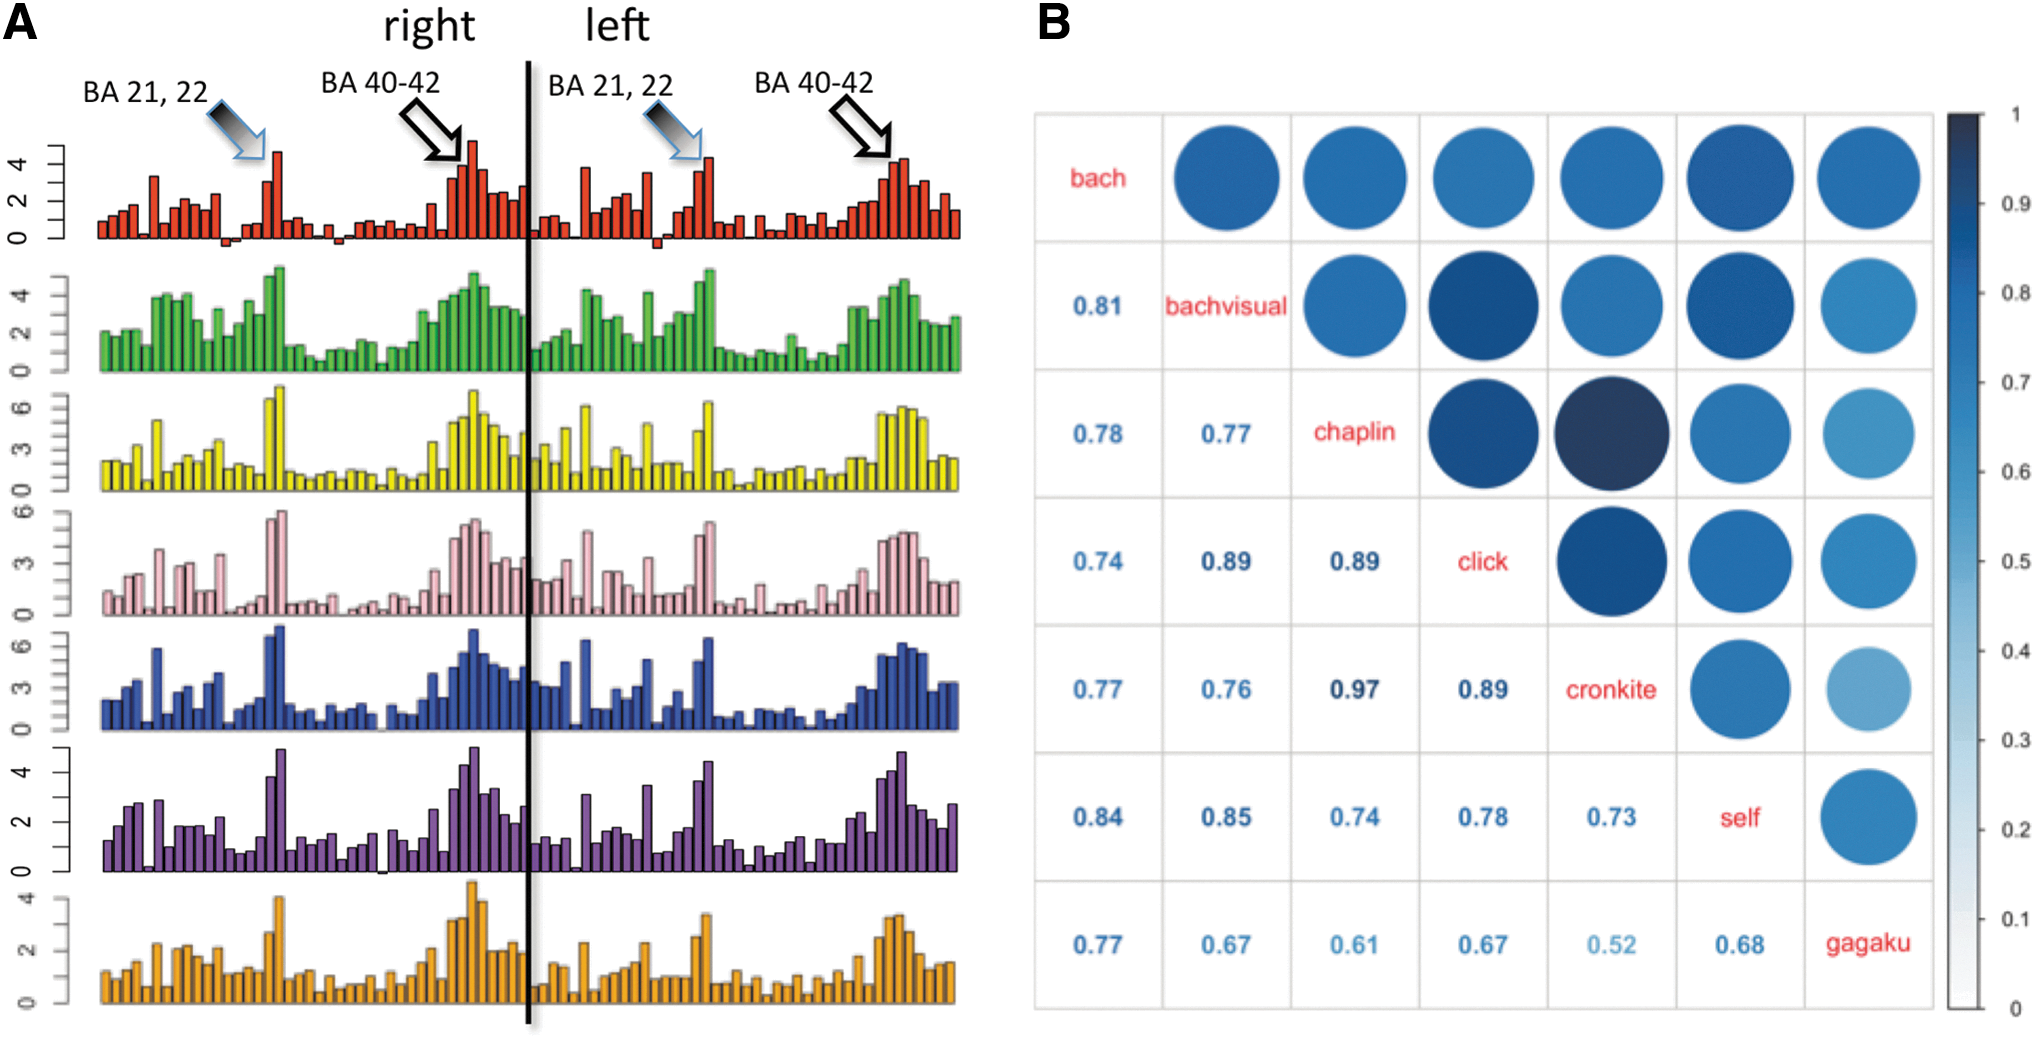
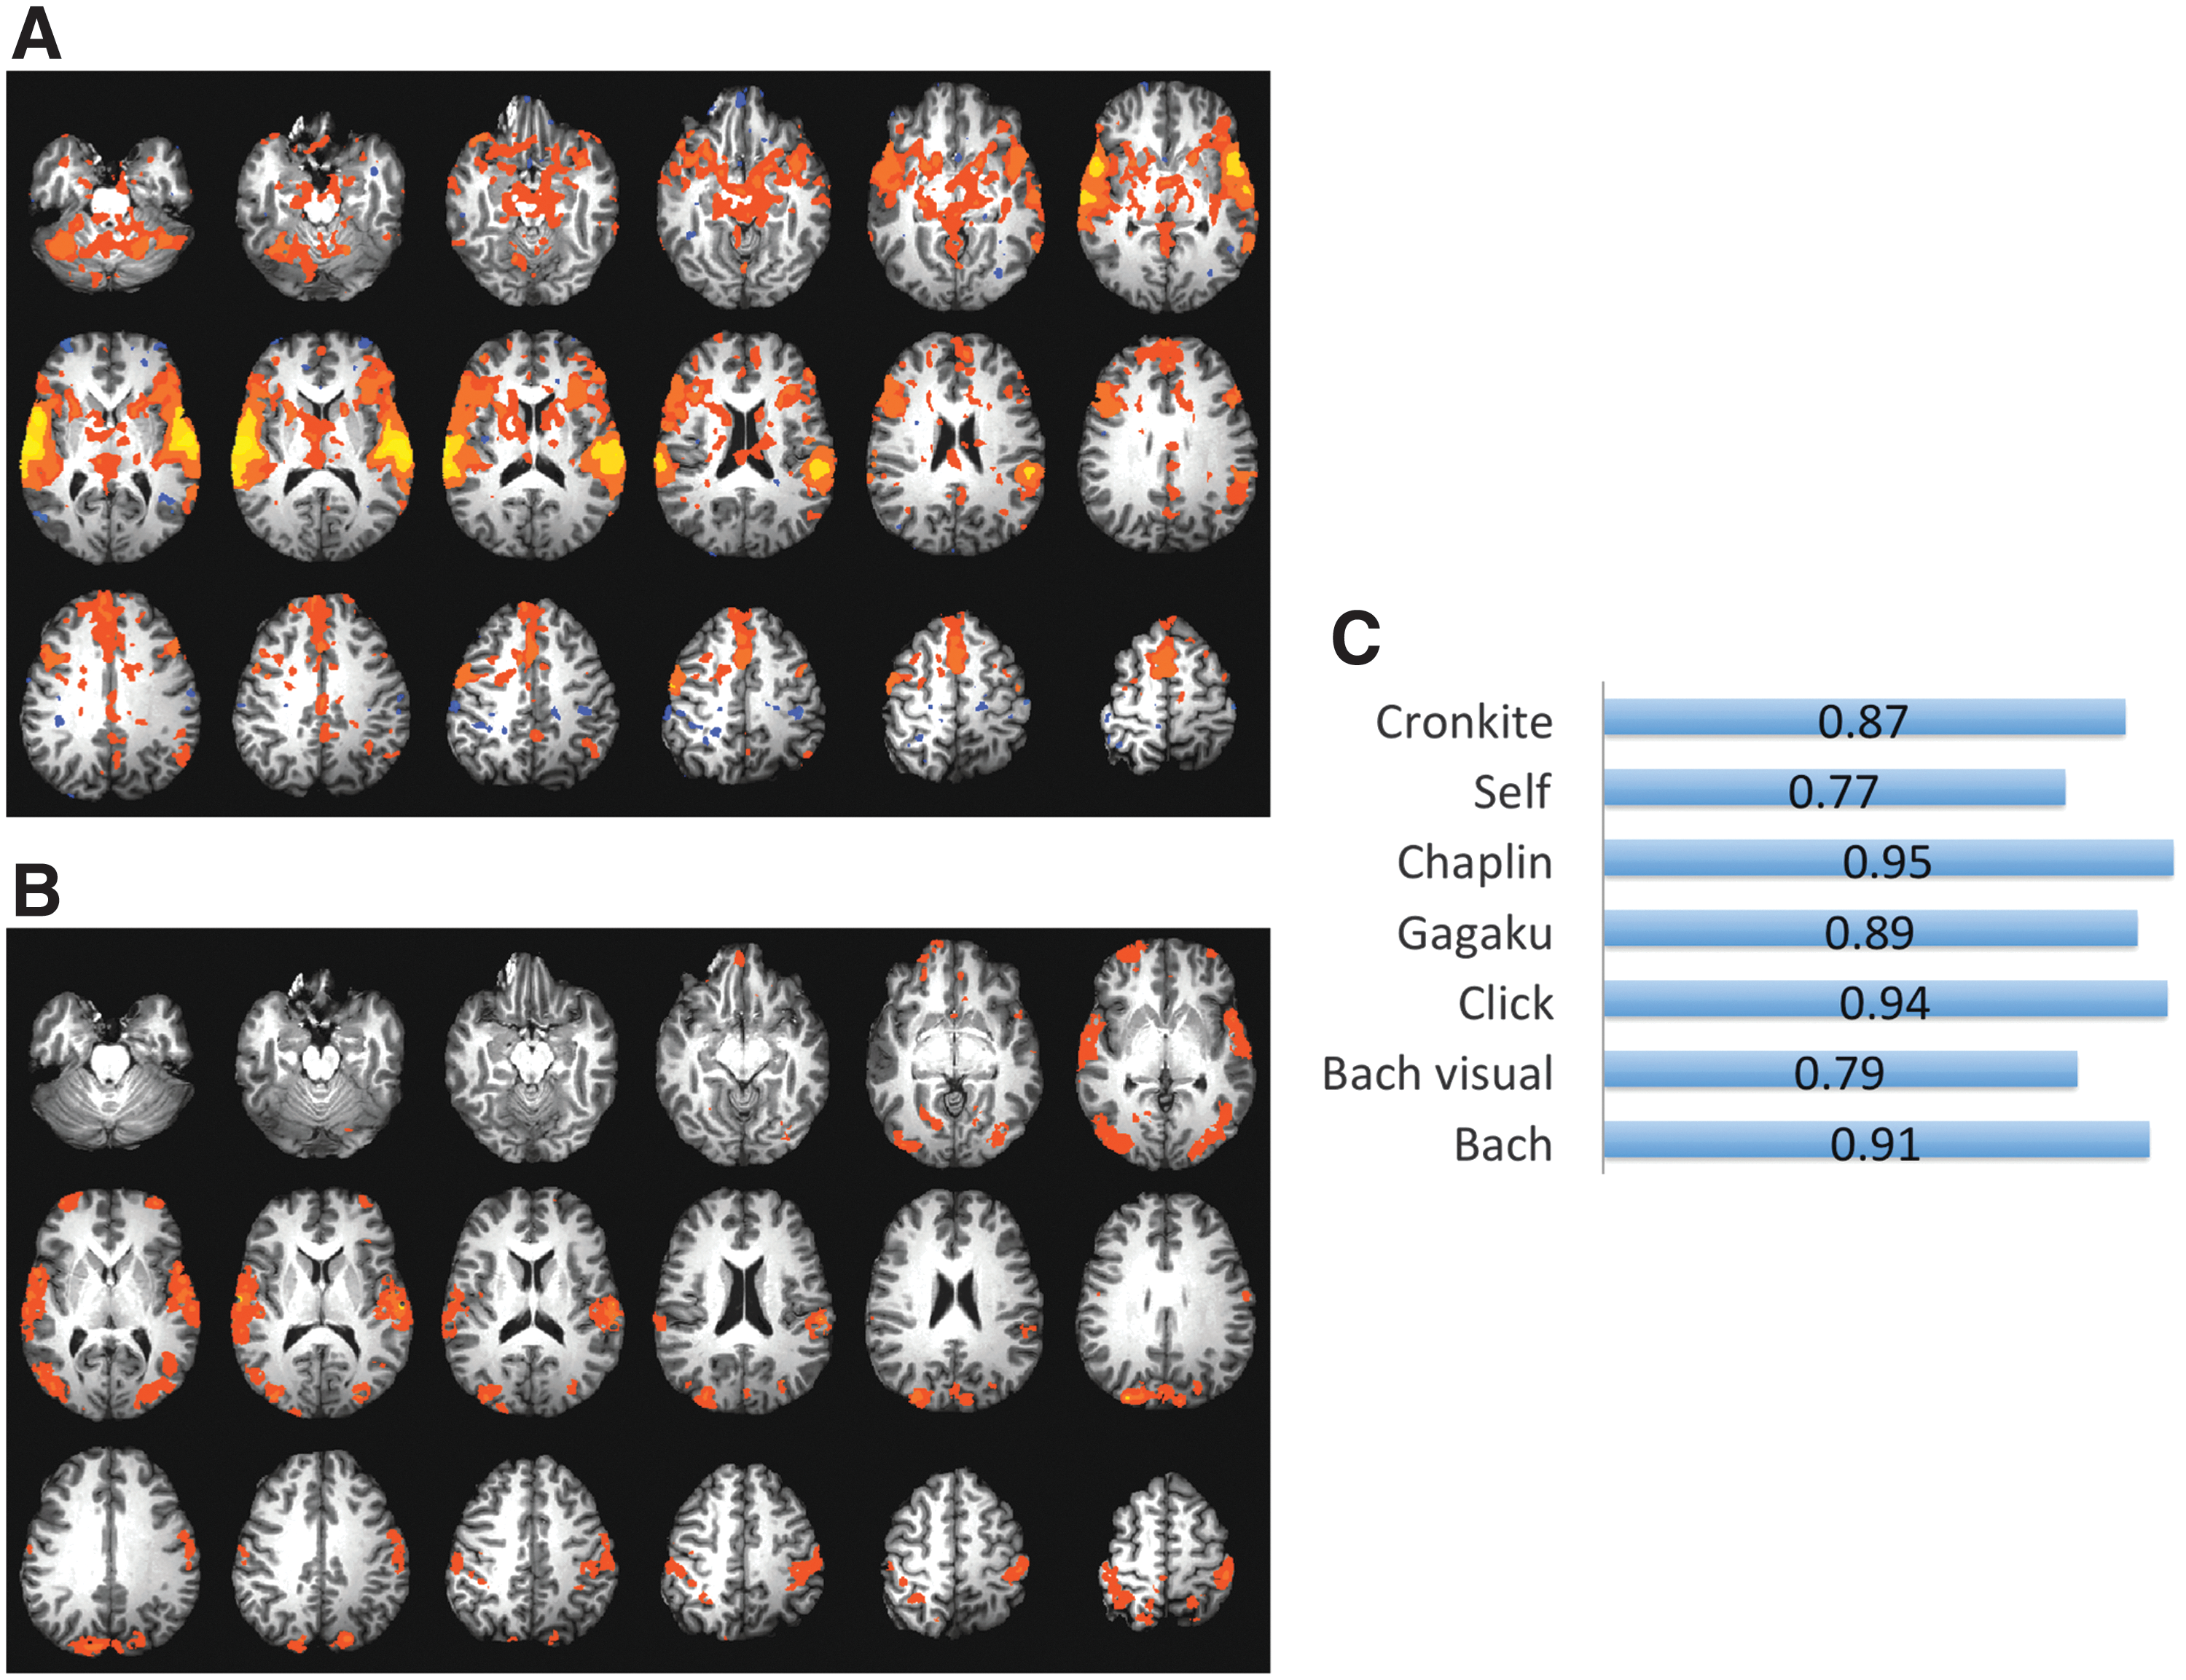
With the value of the Pearson correlation coefficient (CC) varying between 0.52 (Cronkite-Gagaku) and 0.97 (Chaplin-Cronkite), all BOLD activation patterns correlated significantly with a p < 0.05 (Fig. 3). fMRI BOLD activation of the self-selected music was highly correlated to the auditory Bach piece (0.84), but less to the gagaku piece (0.68). The Gagaku pieces exhibited lowest correlations with all other auditory samples among the musical pieces.
Functional connectivity analysis
No significant correlation was found between group-averaged values of the network graph diameter or density, nor the average path length in the graph (Table 2 and Fig. 4). Statistically significant correlation was found for the CC values for the pairs Click-Cronkite and Click-Gagaku, for the largest eigenvalue for the pairs Bach-Chaplin, Chaplin-Click, Cronkite-Self, Bach-Cronkite, and Chaplin-Self, and for the second largest eigenvalue for the pairs Click-Cronkite, Chaplin-Click, Cronkite-Self, Bach-Cronkite, and Cronkite-Gagaku.
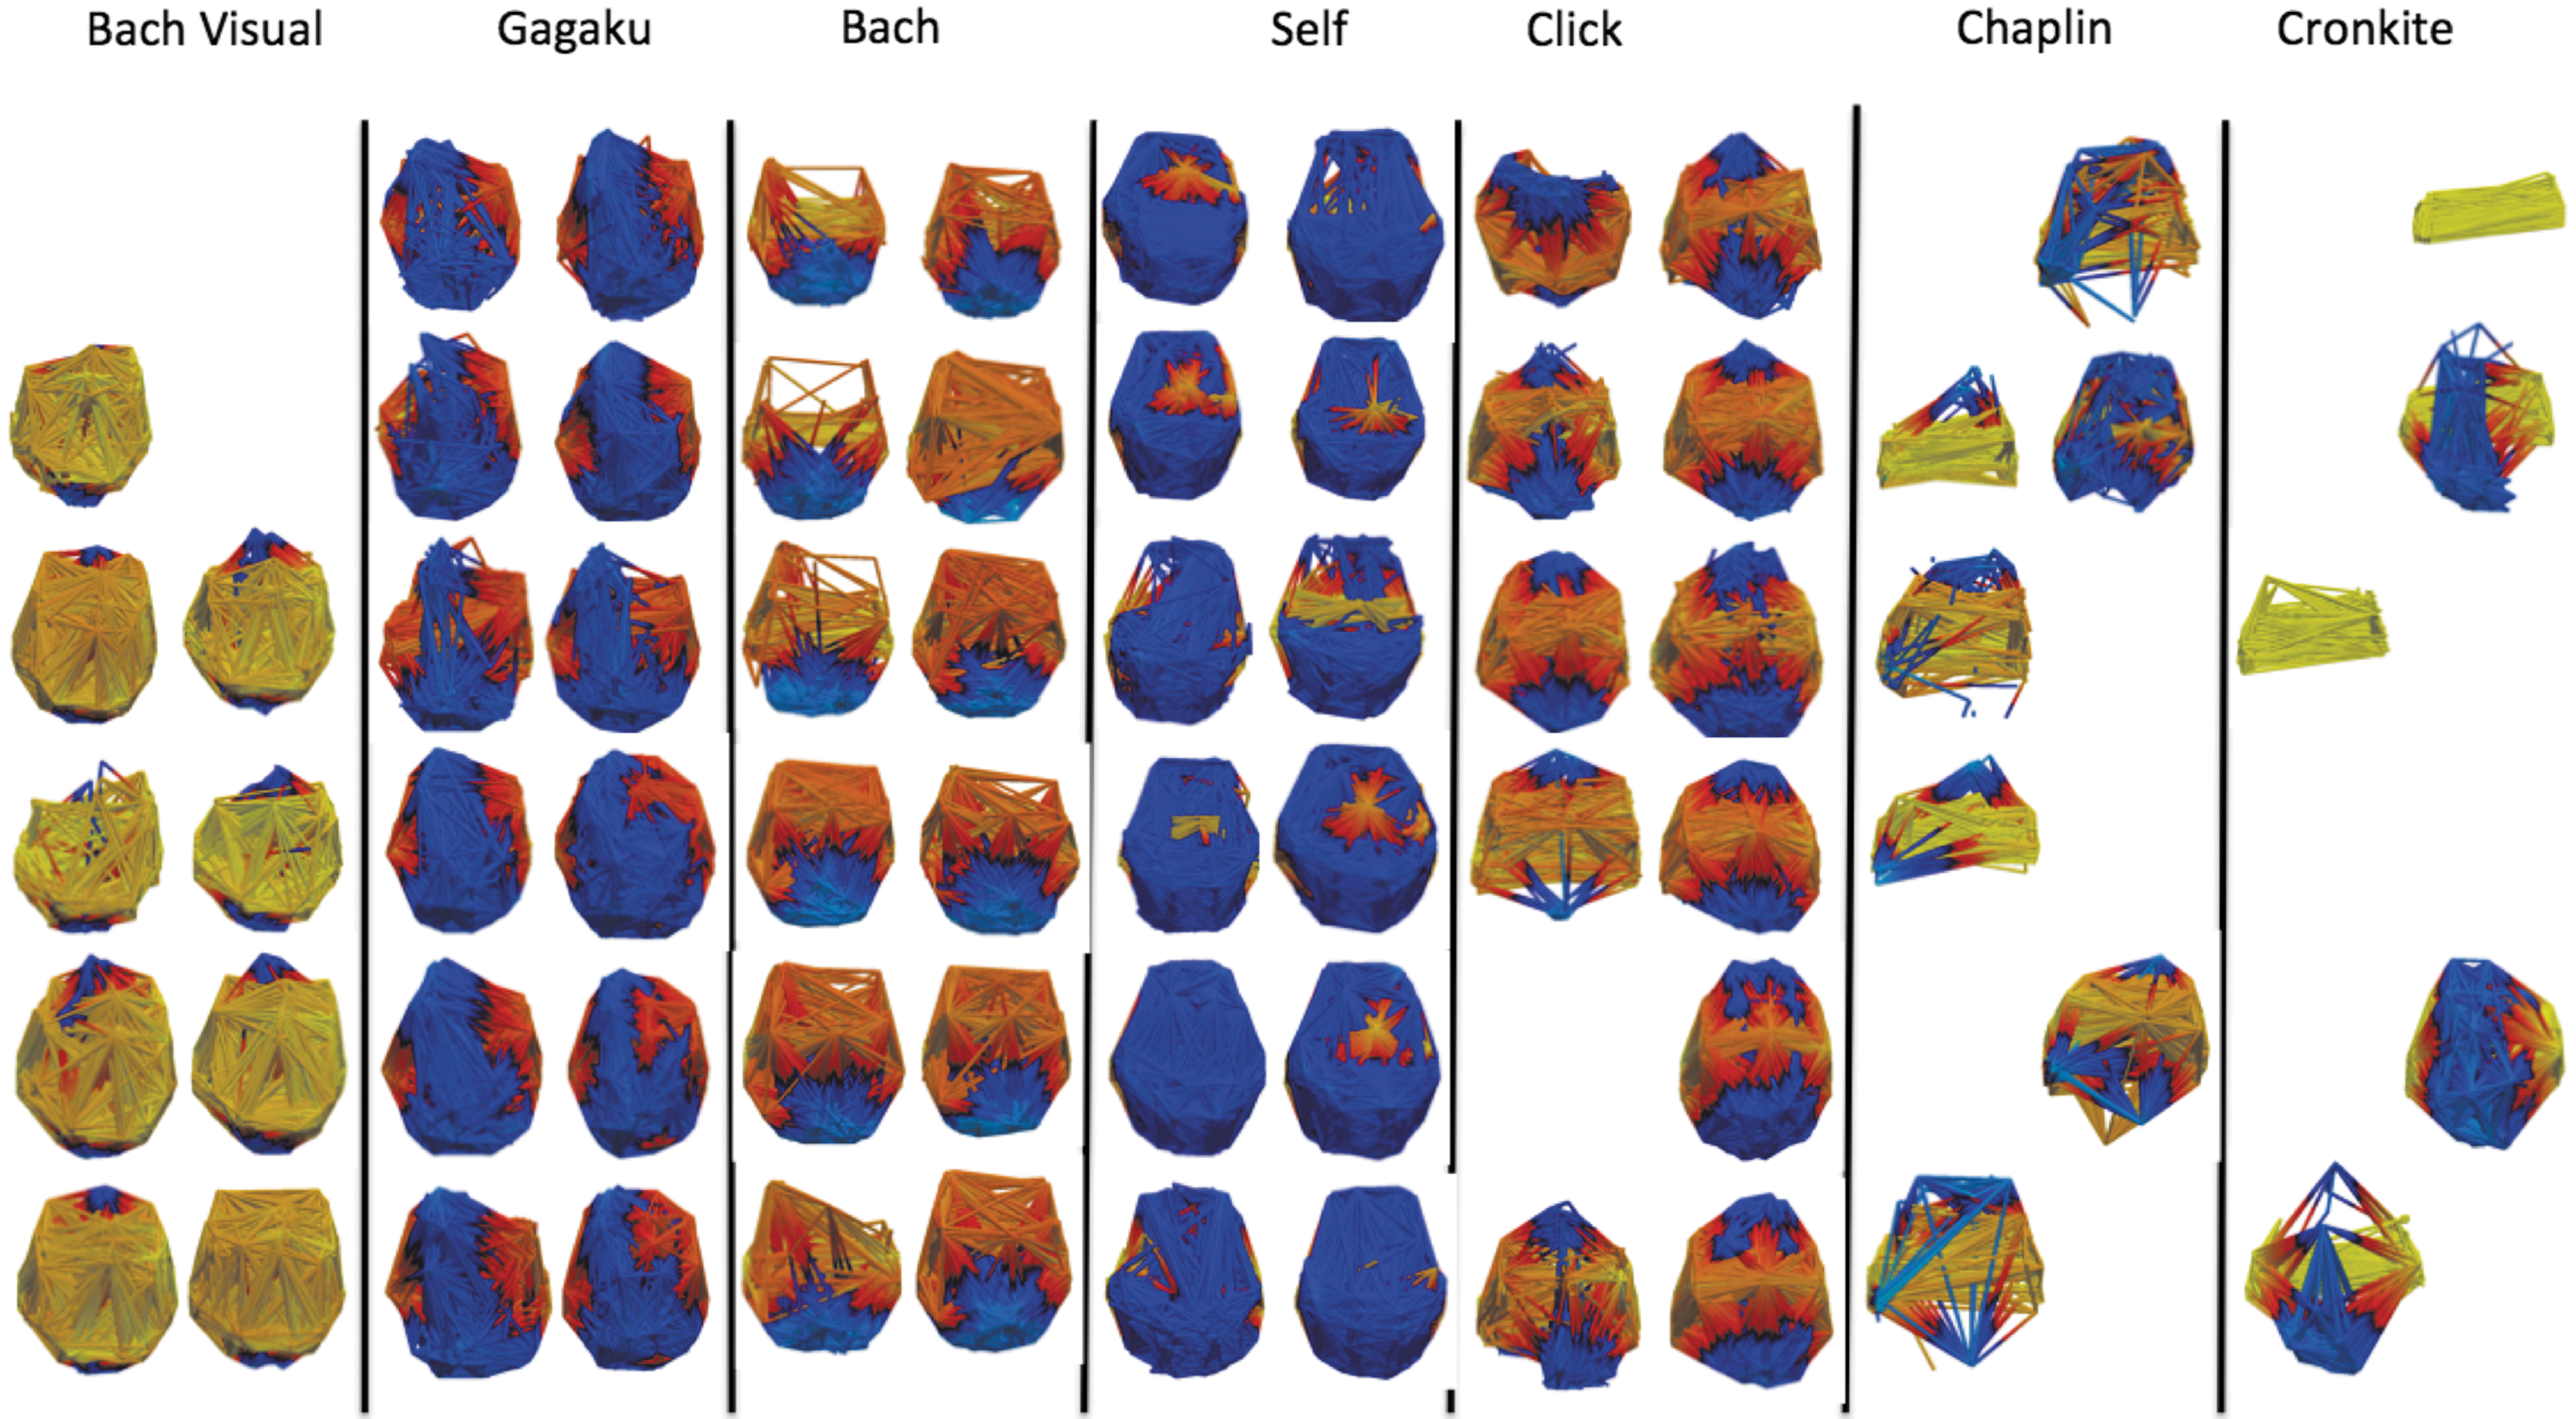
3D graph networks as introduced in the last figure shown in axial orientation for each subject (in consecutive order from upper left to lower right) for all auditory pieces. Gaps indicate subjects that did not listen to the particular piece. Color coding is analogous to fMRI BOLD maps shown in Figure 2. Good agreement for each auditory piece between all subjects can be appreciated, as well as considerable variations between pieces.
Left column for each parameter gives the mean value as an average over all subjects and the right column provides the standard deviation.
3D visualization of the graph networks in the anatomical space for each subject shows distinct differences between each audio piece with striking similarities for each piece among all subjects (Fig. 4). The graphs for the Gagaku piece, the self-selected music, and the visual presentation of the Bach piece seem to comprise the largest extent of the brain, followed by the audio Bach piece and the clicking language piece. The spoken word pieces, both Chaplin and Cronkite, result in relatively small network graphs mainly connecting regions in the STG with wider extent in a few subjects. The result of this visual impression seems to be closest reflected in the values for the graph density parameter (Table 2). Similar to the BOLD activation maps, also the graphs of the functional connectivity express distinct variations between audio pieces and also good consistency among subjects.
Comparison between BOLD and betweenness maps
For all auditory pieces, the absolute maximum BOLD and betweenness (BTW) values for each Brodmann area showed statistically significant correlations (p < 0.05) suggesting a direct correlation between blood flow and information processing (Fig. 5).
(
Discussion
In agreement with other studies on the subject of music listening, we observed widespread activation in BOLD activation using different functional brain networks, including auditory, limbic, and motor regions (Janata et al., 2002). Core structures for processing complex acoustic features of musical pieces from various genres, with and without lyrics, were found to be located in a region of the right STG, which included the planum polare and Heschl's gyrus as previously reported (Alluri et al., 2013). fMRI activation patterns found for our study's familiar emotional music are in agreement with results by Pereira et al. who reported broad emotion-related limbic and paralimbic regions, as well as the reward circuitry being significantly more active for familiar relative to unfamiliar music (Pereira et al., 2011). In this study, we also demonstrated that the maximum BOLD activation in the Brodmann areas correlates significantly with the flow of information in the brain when quantified by graph-theoretical analysis. The former is derived from physiological parameters (i.e., flow of oxygenated blood), while the latter is derived from the synchronicity of this blood flow within the functional connectivity patterns when listening to a particular auditory piece. Of special interest was the observation of regions of increased BOLD effect during resting periods for the unfamiliar music pieces (Bach, Gagaku), the self-selected emotional music piece, and the unfamiliar click language piece. We interpret this effect as latent processing of unfamiliar information (for Bach, Gagaku, and clicking language) and as recalling previous events triggered by the auditory stimulus (for the self-selected emotional music).
While BOLD activation patterns were similar (by statistical comparison investigating maximum BOLD signal in different Brodmann areas), connectivity analysis demonstrated distinct statistically significant different functional connectivity patterns for different musical genres, specifically, self-selected emotional and unfamiliar music. Connectivity analysis in the resting state has been previously studied revealing a correlation between functional connectivity and improvisation training in professional pianists for connections between the bilateral dorsolateral prefrontal cortices, the dorsal premotor cortices, and the presupplementary areas (Pinho et al., 2014). Comparing musicians to nonmusicians, left STG was found to be more strongly connected with several language processing areas (left premotor cortex and bilateral supramarginal gyri). Furthermore, regions in the right inferior frontal gyrus displayed showed enhanced connectivity with the claustrum, thought to play a role in binding sensory and motor information (Fauvel et al., 2014). In this study, functional connectivity patterns were investigated on task-based fMRI BOLD signal time courses. Recently, reproducibility of group mean functional connectivity during task-based fMRI acquisitions (performed twice) from data of the human connectome database was investigated (Shah et al., 2016). Correlation of the group mean connectivity across 23.9 million connections was used as a similarity metric. The range of correlations for most tasks was 0.79–0.91 with a task duration between 3 and 5 min, similar to the duration of the music-listening tasks utilized in this study.
While neural regions underlying music and speech processing have been demonstrated to show significant overlap (Griffiths et al., 1999; Merrill et al., 2012), our results suggest a differentiation based on the nature of the presented speech. With the limited data available in our study, it appears that rhythmic melodic language (represented by the excerpt of the clicking language) created a functional connectivity pattern most similar to the music pieces (Fig. 3), while the English spoken language resulted in reduced functional connectivity more so if the subject of the text was unemotional (the news broadcasts by Walter Cronkite) compared to the emotional speech patterns in the Chaplin piece. With our limited dataset, it appears that music processing areas in the brain encompass language areas. It has been suggested that when spoken language is introduced in early development, children attend to its musical features first (Brandt et al., 2012). The authors there state that “Without the ability to hear musically, it would be impossible to learn to speak.” In addition, a recording of speech, looped over and over again, can begin to sound like singing (Deutsch et al., 2011). The widespread functional connectivity found in our study involving a large number of brain regions also involved in other cognitive processes agrees with observations that musical training leads to advantages in the processing of prosody (Thompson et al., 2004), is associated with better discrimination of subtle timing contrasts in both native and foreign speech (Marques et al., 2007), and helps to better perceive speech-to-noise (Parbery-Clark et al., 2009).
In the context of enhanced recovery after middle cerebral artery stroke as observed by Sarkamo et al. (2008), we propose that enhanced brain activation, increased functional connectivity, and increased flow of information may be a contributing factor to recovery and should be considered when designing an optimized music therapy approach for this patient group. A potential embodiment of this approach might take the form of routine listening sessions throughout the day (4–5, of 10–20 min each, increasing as tolerated) of a combination of self-selected emotional and unfamiliar music, effectively priming or activating compromised brain areas, in preparation and following a traditional physical/occupational therapy or Neurologic Music Therapy regimen. We intend in a consecutive study to implement this type of regimen and report on the findings.
Menon et al. (2005) have reported on the rewards of music listening: in their functional and effective connectivity analyses, they demonstrated that listening to music strongly modulated activity in a network of mesolimbic structures involved in reward processing, including the nucleus accumbens (NAc) and the ventral tegmental area (VTA), as well as the hypothalamus and insula (regulating autonomic and physiological responses to rewarding and emotional stimuli). Responses in the NAc and the VTA were found to be highly correlated pointing to an association between dopamine release and NAc response to music. Responses in the NAc and the hypothalamus were also strongly correlated across subjects, suggesting a mechanism by which listening to pleasant music evokes physiological reactions. Effective connectivity confirmed these findings and showed significant VTA-mediated interaction of the NAc with the hypothalamus, insula, and orbitofrontal cortex. The authors of that study conclude that enhanced functional and effective connectivity between brain regions mediating reward, autonomic, and cognitive processing helps understand why listening to music is one of the most rewarding and pleasurable human experiences (Menon and Levitin, 2005).
Conclusion
Our results indicate that enhanced brain activation, increased functional connectivity, and increased flow of information occur during active music listening to both unfamiliar music and self-selected emotional music. This is in contrast to listening to the emotional, unemotional, and unfamiliar spoken excerpts alone. In the context of enhanced recovery after middle cerebral artery stroke as observed by Sarkamo et al. (2008), we propose that enhanced brain activation, increased functional connectivity, and increased flow of information may be a contributing factor to recovery and should be considered when designing an optimized music therapy approach for this patient group. A potential embodiment of this approach might take the form of routine listening sessions throughout the day (4–5, of 10–20 min each, increasing as tolerated) of a combination of self-selected emotional and unfamiliar music, effectively priming or activating compromised brain areas, in preparation and following a traditional physical/occupational therapy or Neurologic Music Therapy regimen. We intend in a consecutive study to implement this type of regimen and report on the findings.
Footnotes
Acknowledgments
Support by a research grant from the Ting Tsung and Wei Fung Chao Foundation is gratefully acknowledged.
Author Disclosure Statement
No competing financial interests exist.