
Abstract
Functional connectivity (FC) in resting-state functional magnetic resonance imaging (rs-fMRI) is widely used to find coactivating regions in the human brain. Despite its widespread use, the effects of sex and age on resting FC are not well characterized, especially during early adulthood. Here we apply regression and graph theoretical analyses to explore the effects of sex and age on FC between the 116 AAL atlas parcellations (a total of 6670 FC measures). rs-fMRI data of 494 healthy subjects (203 males and 291 females; age range: 22–36 years) from the Human Connectome Project were analyzed. We report the following findings. (1) Males exhibited greater FC than females in 1352 FC measures (1025 survived Bonferroni correction;
Introduction
R
Intrinsic FC can be used as a tool for human connectomics (Van Dijk et al., 2010), and variability of resting-state networks may be useful for characterizing both normal and abnormal brain function. Differences in resting-state FC compared to healthy controls have been found in autism (Muller et al., 2011), attention-deficit/hyperactivity disorder (Uddin et al., 2008), Alzheimer's disease (Li et al., 2013), unipolar depression (Anand et al., 2009), epilepsy (Wurina et al., 2012), and schizophrenia (Jafri et al., 2008; Venkataraman et al., 2012). Although consistent FC group differences have been found between patients with neurodevelopmental/neuropsychiatric disorders and matched controls, classification of patients based on FC measures has proven to be a difficult task (Arbabshirani et al., 2013). This difficulty emphasizes the need for better characterization of FC in healthy populations before extending FC research to atypical populations. In this study, we characterize the effects of sex and age on FC in healthy young adults.
Sex plays an important role in FC, but conclusions regarding sex effects are not well established. Males and females have been shown to differ in various connectivity analyses. Bluhm et al. (2008) examined the default mode network (DMN) and detected stronger FC for females within the posterior cingulate cortex/precuneus and the bilateral medial prefrontal cortex, whereas no brain region exhibited greater FC for males. Another study using independent component analysis (ICA) by Allen et al. (2011) performed a statistical comparison between sexes on frequency composition, spatial map, and functional network connectivity measures. Although sex effects were not found to be as extensive as aging effects, specific ICA components (in auditory, sensorimotor, and attentional networks) did show significant sex differences. Tian et al. (2011) applied graph theoretical analysis on 90 Automatic Anatomical Labeling (Tzourio-Mazoyer et al., 2002) atlas regions and reported that compared to females, males had higher clustering coefficients in the right hemispheric networks but lower clustering coefficients in the left hemispheric networks. Sex-related differences in the developmental trajectories of functional homotopy (Zuo et al., 2010) and lateralization (Liu et al., 2009) have also been examined. Despite these findings, sex effects on rs-fMRI FC remain inconclusive and in some cases contradictory; while Biswal et al. (2010) found consistent sex variations of FC using three distinct methods (seed-based, fractional amplitude of low-frequency fluctuations, and ICA), Weissman-Fogel et al. (2010) found no significant differences between sexes in FC and therefore reported no need to control for sex for rs-fMRI studies. Therefore, further effort is required to derive a clear understanding of sex effects.
Similarly, the effects of age on FC are not well characterized. Previous studies have examined the heterogeneous effects of age-related differences in FC at different developmental stages from the fetus in utero (Thomason et al., 2015) to elderly populations (Bernard et al., 2013; Madden et al., 2010; Seidler et al., 2015). During fetal development, primitive forms of motor, visual, default mode, thalamic, and temporal FC networks were observed. Increased long-range cerebral–cerebellar, cortical–subcortical, and intrahemispheric FC were discovered during gestation at 24–38 weeks (Thomason et al., 2015). Disrupted FC in elderly populations has been reported in the corticocerebellar network (Bernard et al., 2013), in the DMN (Xiao et al., 2015), and in the motor system network (Langan et al., 2010; Seidler et al., 2015). Furthermore, multiple studies have reported that FC in the DMN may be most susceptible to aging effects (Bluhm et al., 2008; Campbell et al., 2013; Damoiseaux et al., 2008; Esposito et al., 2008). Aging effects on FC have been studied using various methods such as ICA, seed-based analyses, region of interest (ROI)-based analyses, and graph analyses (Dennis and Thompson, 2014). However, findings regarding age differences are not well established and many studies are based on small cohorts with less than 100 subjects. In addition, age-related FC variability studies most often compare two distinct age groups (Bernard et al., 2013; Wu et al., 2011) between adolescents and middle-aged adults or elderly populations (Andrews-Hanna et al., 2007; Evers et al., 2012; He et al., 2013; Shaw et al., 2015). Therefore, it is not clear if previously reported age effects of FC emerge in early adulthood. To our knowledge, no previous studies have examined full brain FC in early adulthood using high-quality images on a large number of subjects and this study will attempt to address this knowledge gap.
The primary goal of this article is to examine rs-fMRI FC of the whole brain between ROIs as defined by the AAL atlas using data from the human connectome project (HCP). We aim to test and identify sex and age effects on FC by linear regression. In addition, local and global brain graph properties will be derived to explore differences in brain organization between males and females.
Materials and Methods
Data acquisition and preprocessing
This study includes 494 healthy adults (203 males and 291 females, age: 22–36 years) from the first rs-fMRI run (Session 1, phase encoding in a left-to-right direction) of HCP S500 release (
Cognition scores are age adjusted based on the NIH cognition battery toolbox.
Total household income categories: <$10,000 = 1, 10K–19,999 = 2, 20K–29,999 = 3, 30K–39,999 = 4, 40K–49,999 = 5, 50K–74,999 = 6, 75K–99,999 = 7, ≥100,000 = 8.
Schachter et al. (1987).
Indicates statistical significance for p < 0.05.
SD, standard deviation.
All HCP rs-fMRI data were acquired on a Siemens Skyra 3T scanner housed at Washington University in St. Louis. MR imaging protocols are described in the S500 release manual available at
The preprocessed data we downloaded had undergone standard preprocessing steps (such as motion correction and spatial normalization) and ICA denoising to remove non-neural spatiotemporal components (Griffanti et al., 2014; Salimi-Khorshidi et al., 2014). In addition, the 24 head motion parameter (Satterthwaite et al., 2013) time series were high-pass filtered and were then regressed out of the data. To confirm that head motion did not contribute to FC sex differences, we calculated two-sample t-values of the frame displacement (Power et al., 2012, 2014) between males and females and found no significant differences. Similarly, we calculated the correlation between frame displacement and age and found that there was no significant association.
Linear regression and graph theoretical analyses
The workflow of this study is shown in Figure 1.
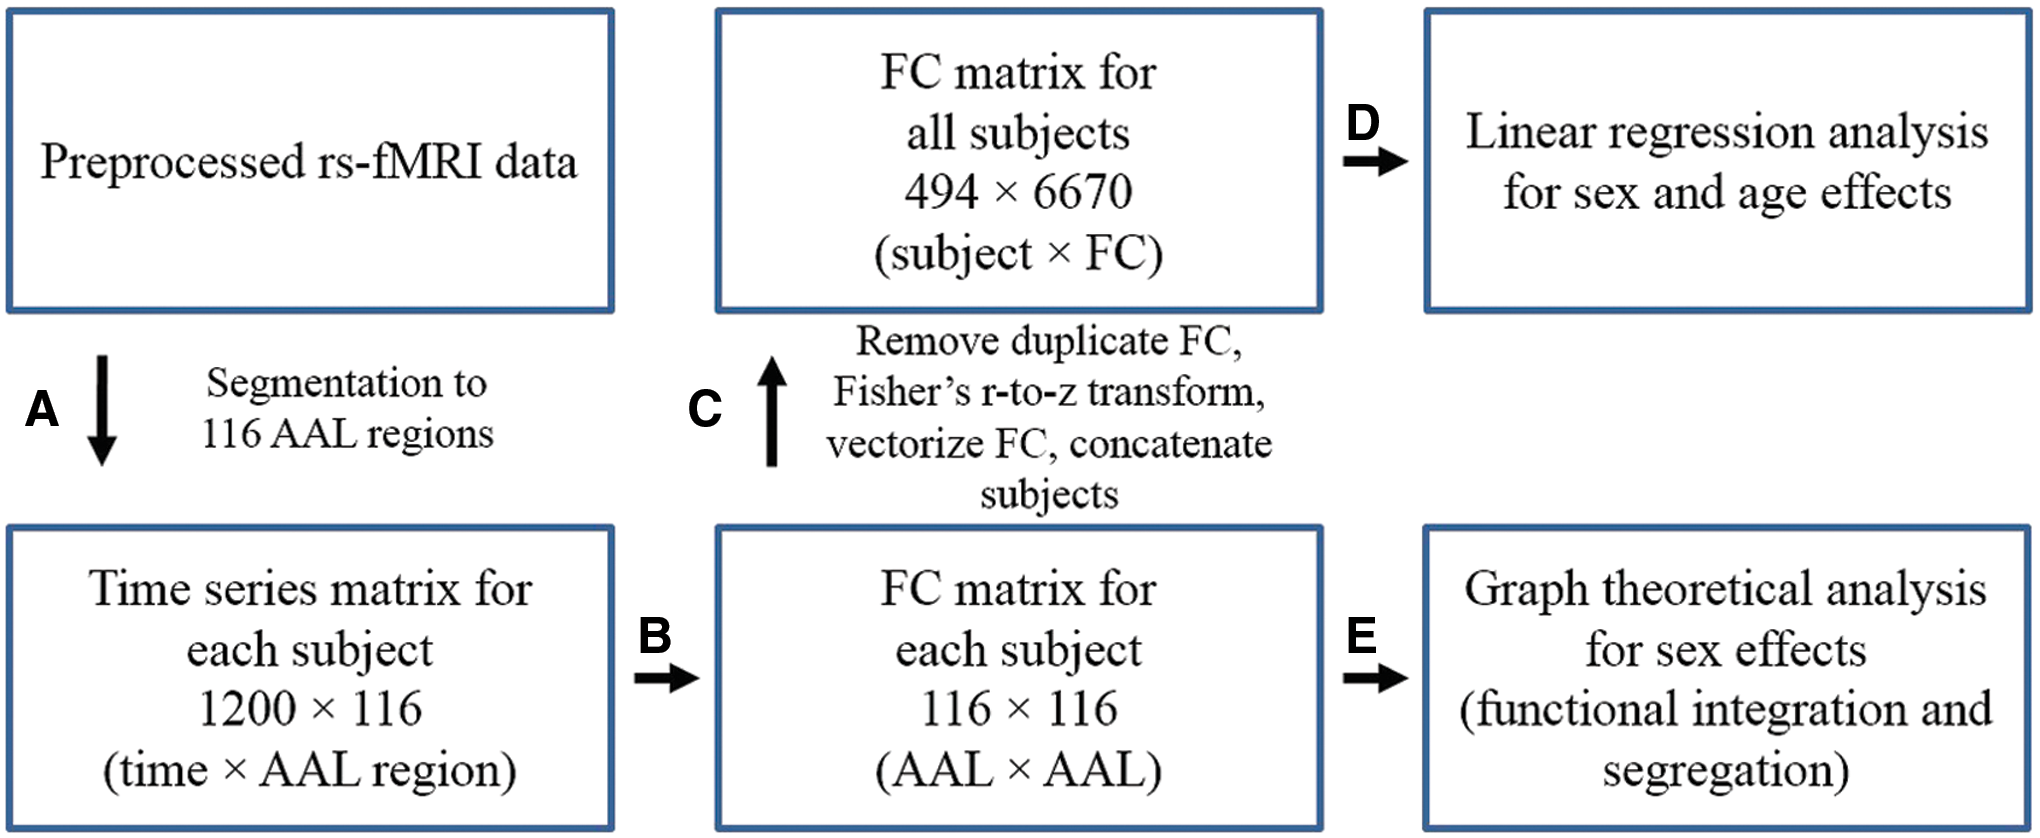
Steps of FC analyses.
Step A: Preprocessed rs-fMRI data were downloaded from the HCP site (
Step B: From the time series matrix of size 1200 × 116 (time points × AAL regions), FC matrices (116 × 116) were derived for each subject by applying Pearson correlation across the whole duration of the time series. For better interpretation, the 116 regions were reordered and grouped into 7 brain lobes according to the hierarchical clustering of AAL brain regions implemented by Salvador et al. (2005).
Step C: The number of FC was reduced from 116 × 116 = 13,456 to 6670 by removing duplicate FC present in the symmetric FC matrix. All FC were then Fisher's z-transformed, rearranged to FC row vectors, and the FC row vectors were stacked across subjects. A 494 × 6670 (subjects × FC) group FC matrix across all subjects was constructed for subsequent regression analysis.
Step D: Regression analysis was applied to each column of the group FC matrix. The initial full model included sex, age, and sex × age interaction as covariates:
where Fi
is the FC vector for a pair of AAL regions across subjects.
The backward stepwise approach (Ronald Christensen, 2001) was applied to select the best model for each FC. We used this scheme since using one model (same set of covariates) for all 6670 FC is not appropriate due to the fact that not every FC measure may incorporate the effects of all the potential covariates. In each round, the backward stepwise approach calculates a significance p-value quantifying the effect of removing each covariate of the current model. It then removes the covariate that had the most insignificant effect in each iteration until any further reduction would exert significant difference in the F-statistic of the model compared to the model at a previous iteration. This approach yields five possible models and they are as follows: M1: no covariates, M2: sex only, M3: age only, M4: sex and age; M5: sex, age, and sex × age. The p-values of regression coefficients in each model were used to identify the significant effects on FC. To explore how the behavioral measures would affect the sex and age effects on FC, in a separate analysis, seven cognitive measures listed in Table 1 were added to the regression models determined by the backward stepwise model selection.
Step E: Each 116 × 116 FC matrix was thresholded and converted to a binary adjacency matrix for graph theoretic analyses. Graph measures are dependent on the total cost of the network, for example, the network clustering coefficient and global efficiency increase monotonically as edges are added to a graph. Therefore, to ensure the most direct mathematical comparability of graph properties across subjects, a proportion threshold (Bassett et al., 2012; Bullmore and Bassett, 2011) based on graph density was applied to each FC matrix, where density threshold ranged from 0.05 to 0.95 at 0.05 intervals. For example, when a density threshold of 0.1 is applied, for each subject, the top 10% of the FC are retained and the FC matrix is converted to a binary adjacency matrix. Different thresholds were applied to compare group differences of graph properties at various graph densities. This thresholding scheme was reported to be more stable compared to absolute (correlation-based) thresholds (Garrison et al., 2015).
Network measures in this study were derived using the Brain Connectivity Toolbox (Rubinov and Sporns, 2010). Nodal clustering coefficient and nodal local efficiency were adopted to examine the regional characteristics of the functional brain network. The clustering coefficient of a node is a measure of the degree to which that node in the graph tends to cluster together with its neighboring nodes. The local efficiency quantifies how well information is exchanged within that neighborhood. For the global network matrices, the network clustering coefficient (C) and the characteristic path length (L) were calculated. These are two key graph parameters that can also characterize the small-world organization of a network. C is the average of the nodal clustering coefficients across the nodes. L is the average of shortest path length between all pairs of nodes and quantifies the number of processing steps for information transfer across the brain. To handle the possible infinite path lengths between disconnected nodes, L was calculated as the harmonic mean of geodesic distances (Latora and Marchiori, 2001). The number of nodes included in the largest connected component was calculated for different proportion thresholds. The small-worldness metric of a network (
Results
Linear regression model
FC measures with significant regression models (F-statistic
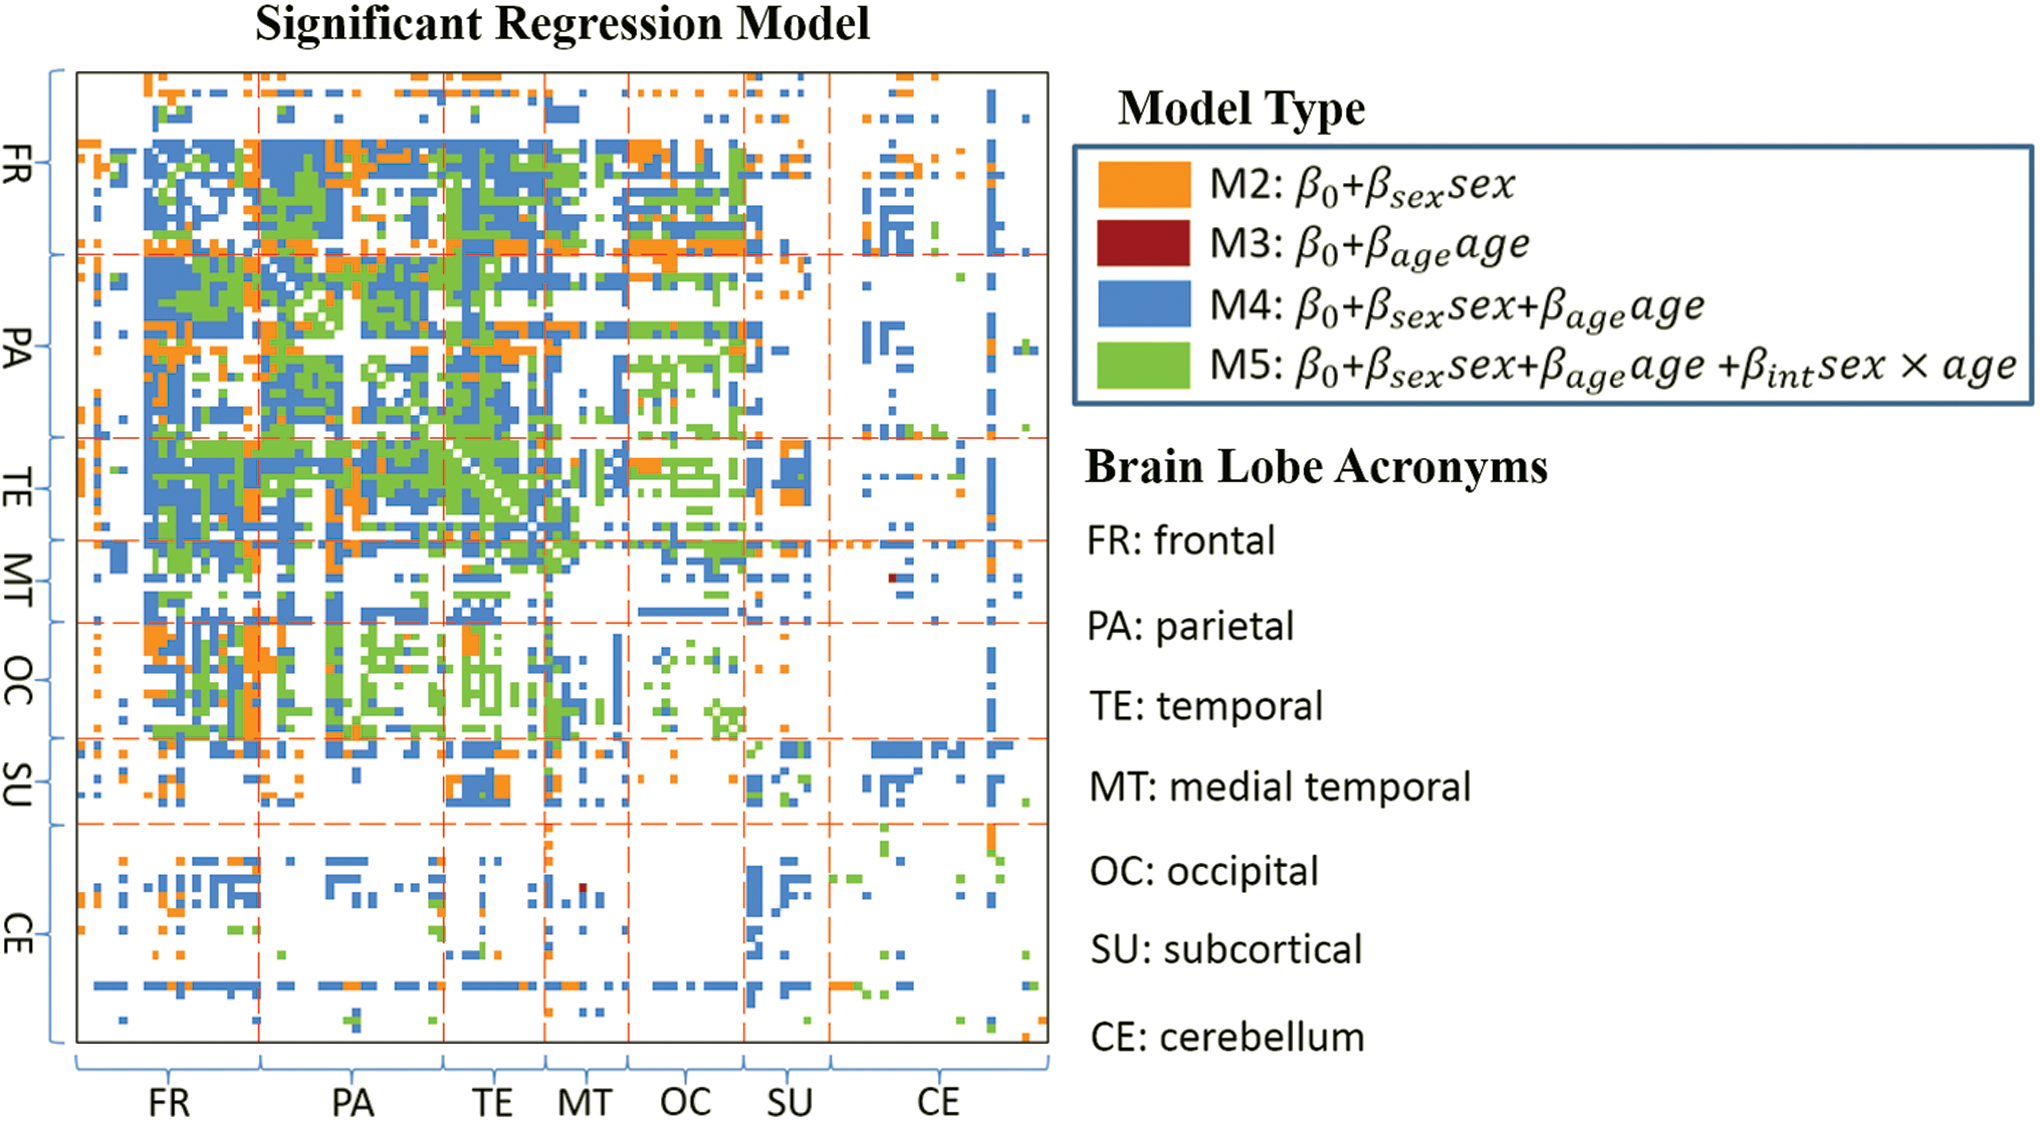
Significant regression models with F-statistic
Sex and age effects of functional connectivity
For FC measures with significant regression models, the significance of sex, age, and sex
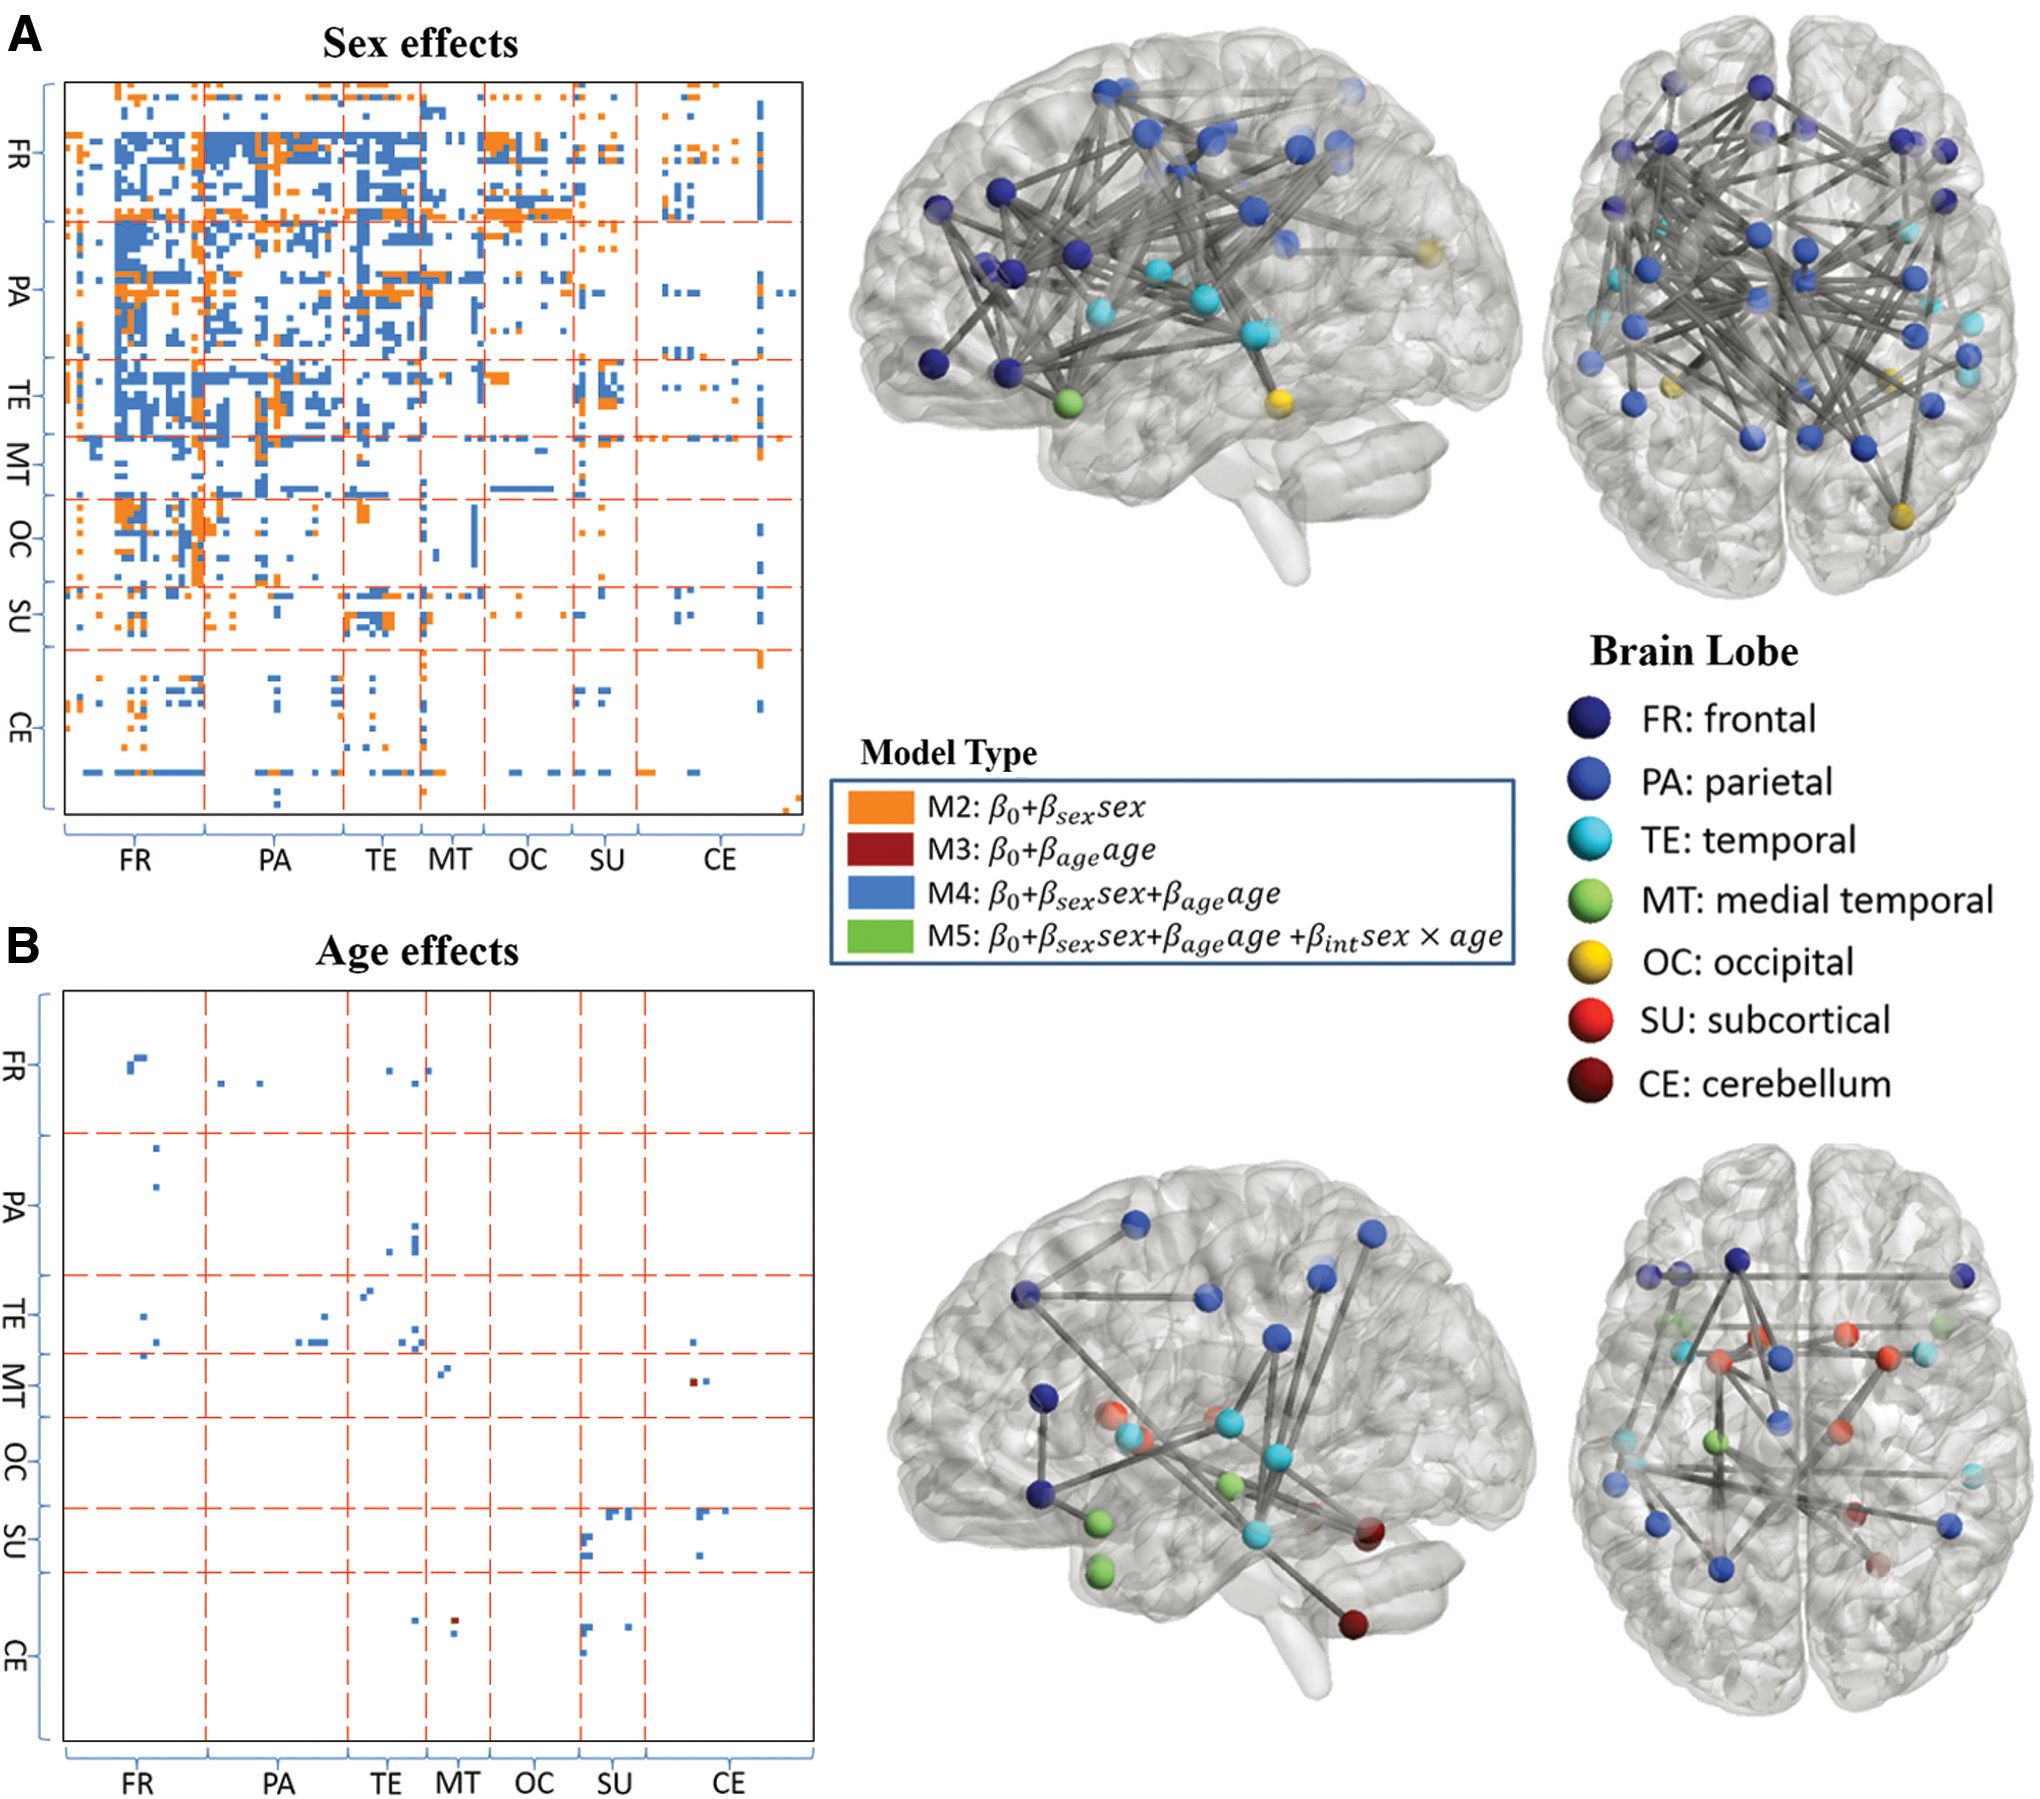
ROI pairs with significant
p represents the significance of p-value of the covariate (sex or age) in the regression analyses.
FC, functional connectivity; ROI, region of interest.
The percentages of intralobe and interlobe FC values having significant sex effects are presented in Supplementary Figure S1. The highest ratio (43%) is located between the frontal and temporal lobes. Frontal–occipital (31%) and temporal-subcortical (28%) also exhibit high interlobe FC ratios for significant sex effects. The percentages of FC values for sex effects in the frontal, parietal, and temporal lobes range from 21% to 43%. In contrast, the percentages in the occipital, subcortical, and cerebellar regions are all less than 4%.
We also noted that the total intracranial volume (Gray matter + White matter + CSF, calculated by FreeSurfer in the HCP MR Structural pipelines) is significantly higher in males (
Effects of sex and age on FC after adding cognitive measures to the regression models are presented in Figure 4. Compared to Figure 3A, 534 out of the 1025 ROI pairs for sex effects survive and three new pairs (AAL4—AAL87, AAL74—AAL103, and AAL86—AAL87) emerge. Regarding age effects, 21 out of the 29 ROI pairs survive and two new pairs (AAL13—AAL81 and AAL13—AAL83) emerge.
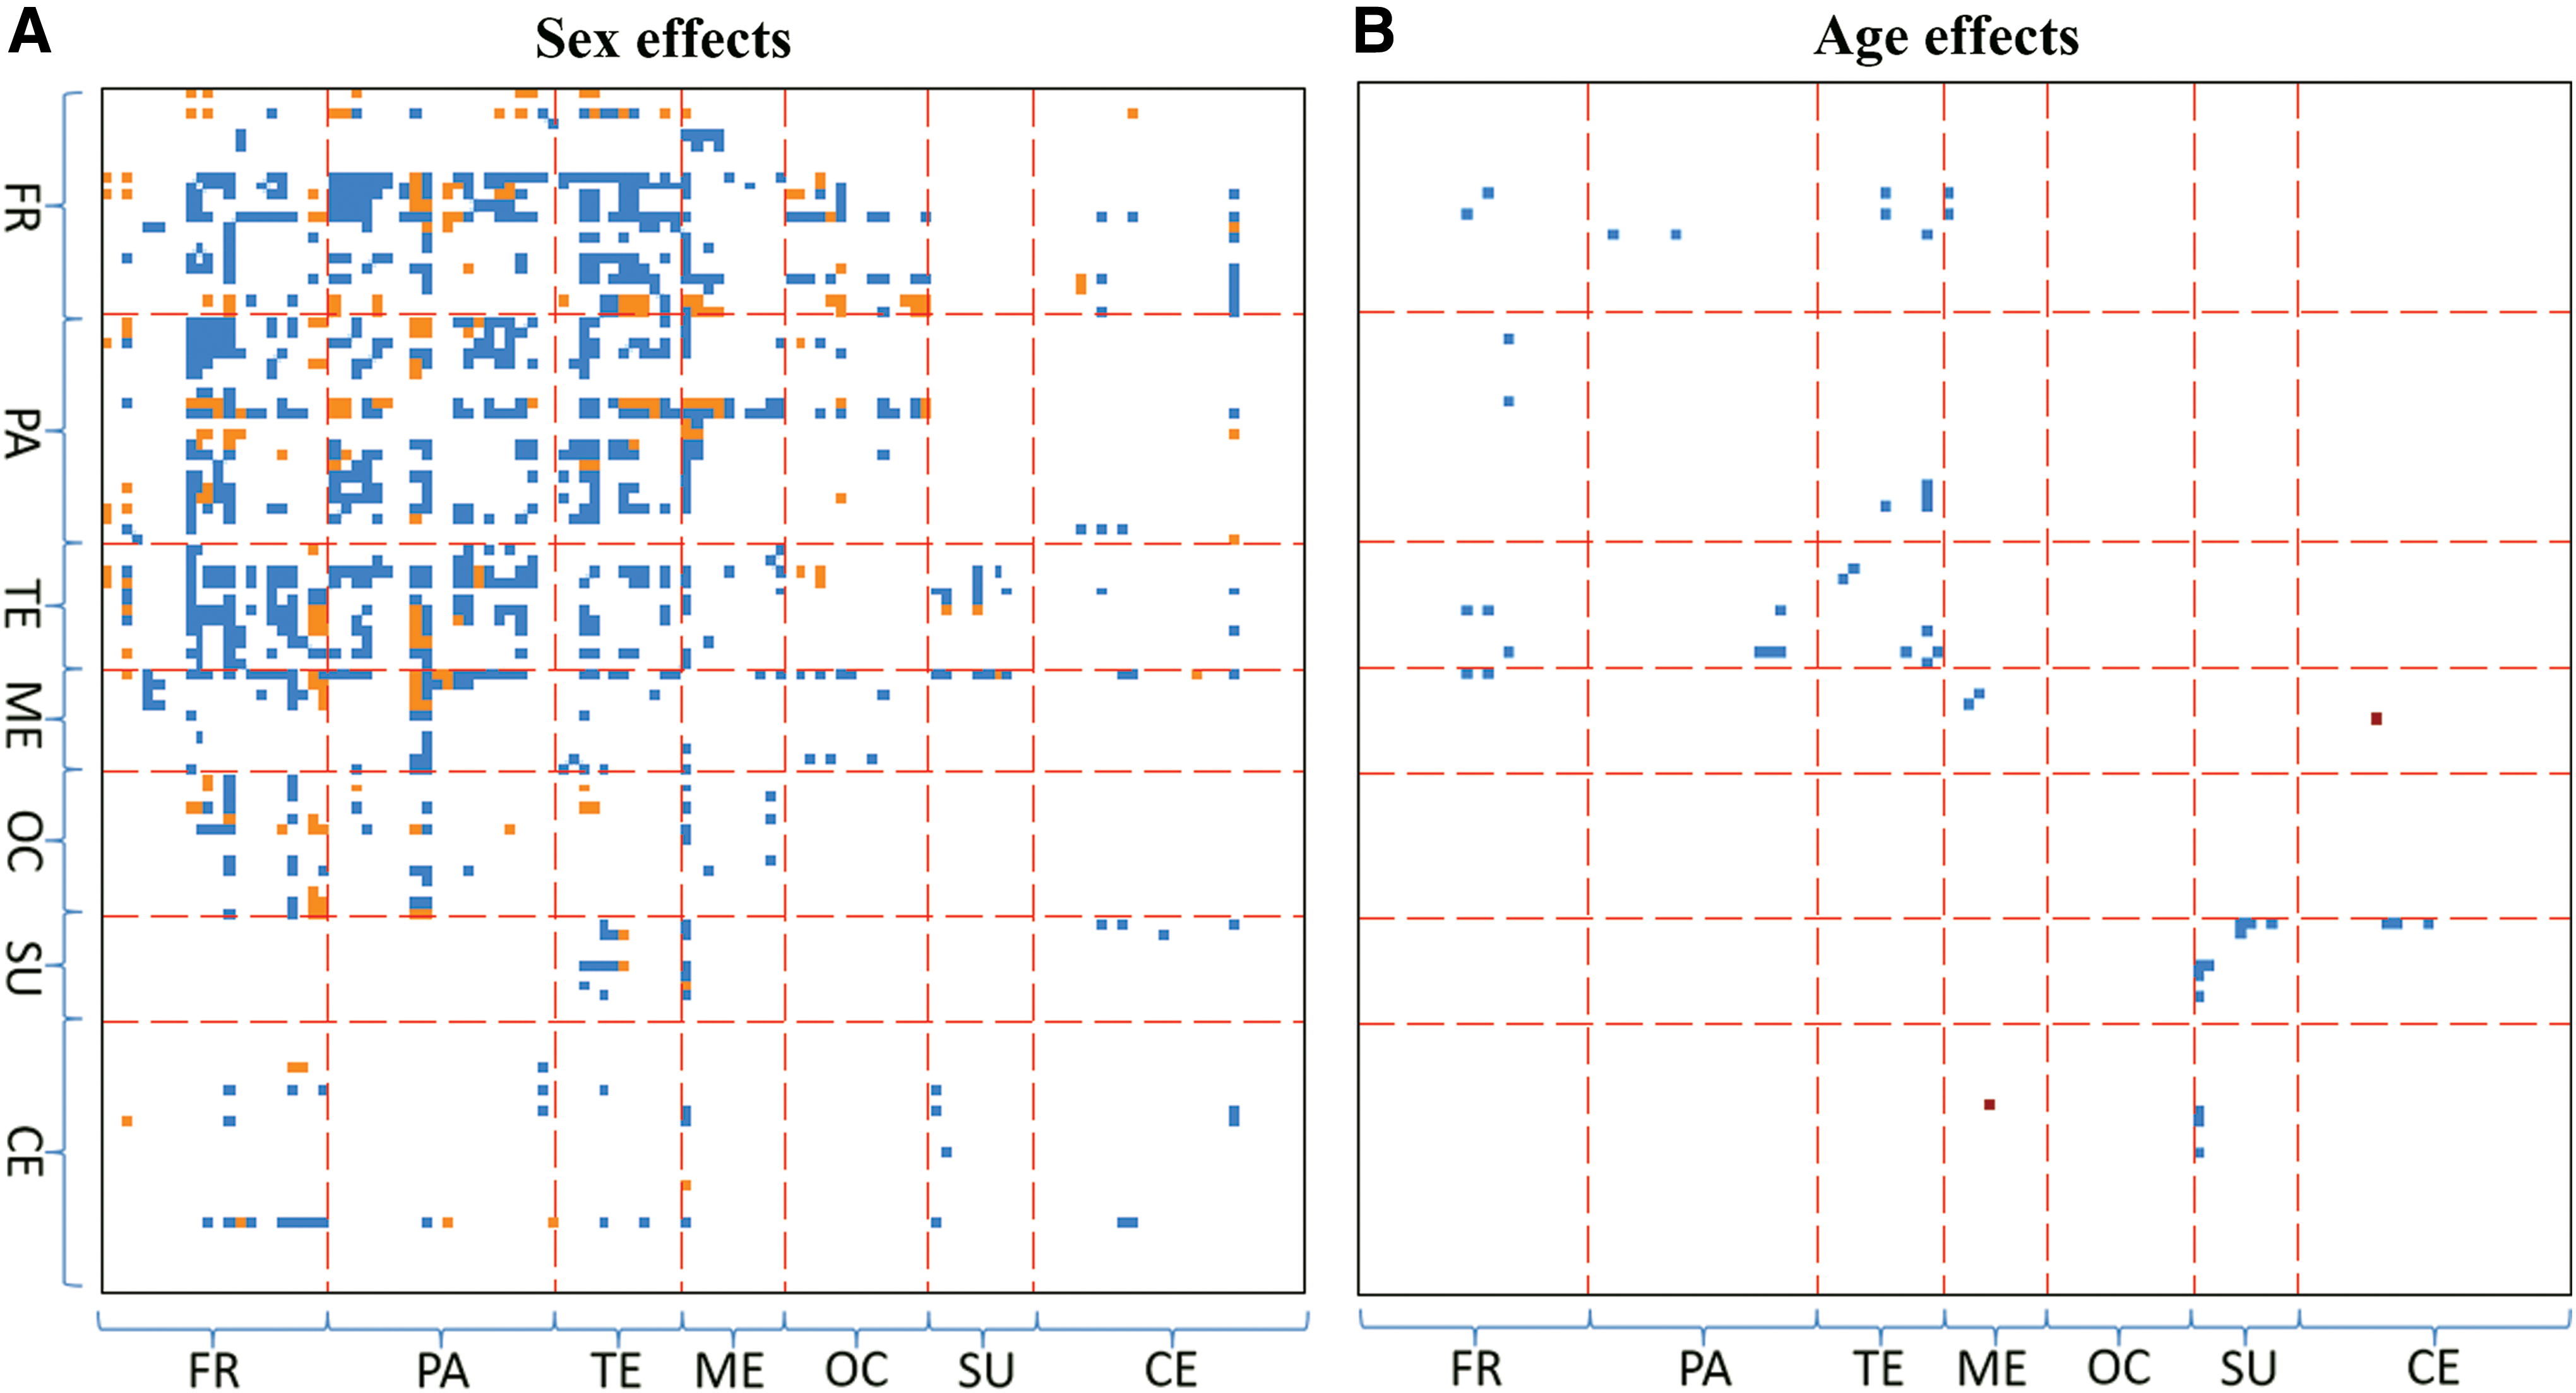
Effect of behavioral measures on sex and age effects on FC. For regression models that included seven cognitive measures as covariates, ROI pairs with significant
In the above regression analysis, no significant covariates for the seven cognitive measures survive Bonferroni correction at
Sex and age interaction effects of functional connectivity
There were no sex
In Figure 5A, B, for two ROI pairs with the most significant age or sex effects on FC in the previous regression analysis, both males and females show negative slopes and the slopes of female regression lines are larger in magnitude than males. Next, the experiment for examining different age regression coefficients between males and females was extended to all FC measures. Results for all 29 FC measures with significant age effects and 30 FC measures with the most significant sex effects in previous analysis are shown in Figure 5C, D, respectively. In Figure 5C, all the slopes are negative and the magnitude is larger for females in 27 out of 29 ROI pairs. In Figure 5D, the female slopes are still negative, while males show positive slopes in four ROI pairs. Except for three pairs in which males show a larger magnitude negative slope, male slopes are above the female slopes in all other ROI pairs: either male and female slopes are both negative or male slopes are positive, while females slopes are negative. For all ROI pairs, 3787 out of 6670 (57%) FC measures demonstrate negative age regression coefficients for both males and females and the magnitude for the female slope is larger compared to the male slope.
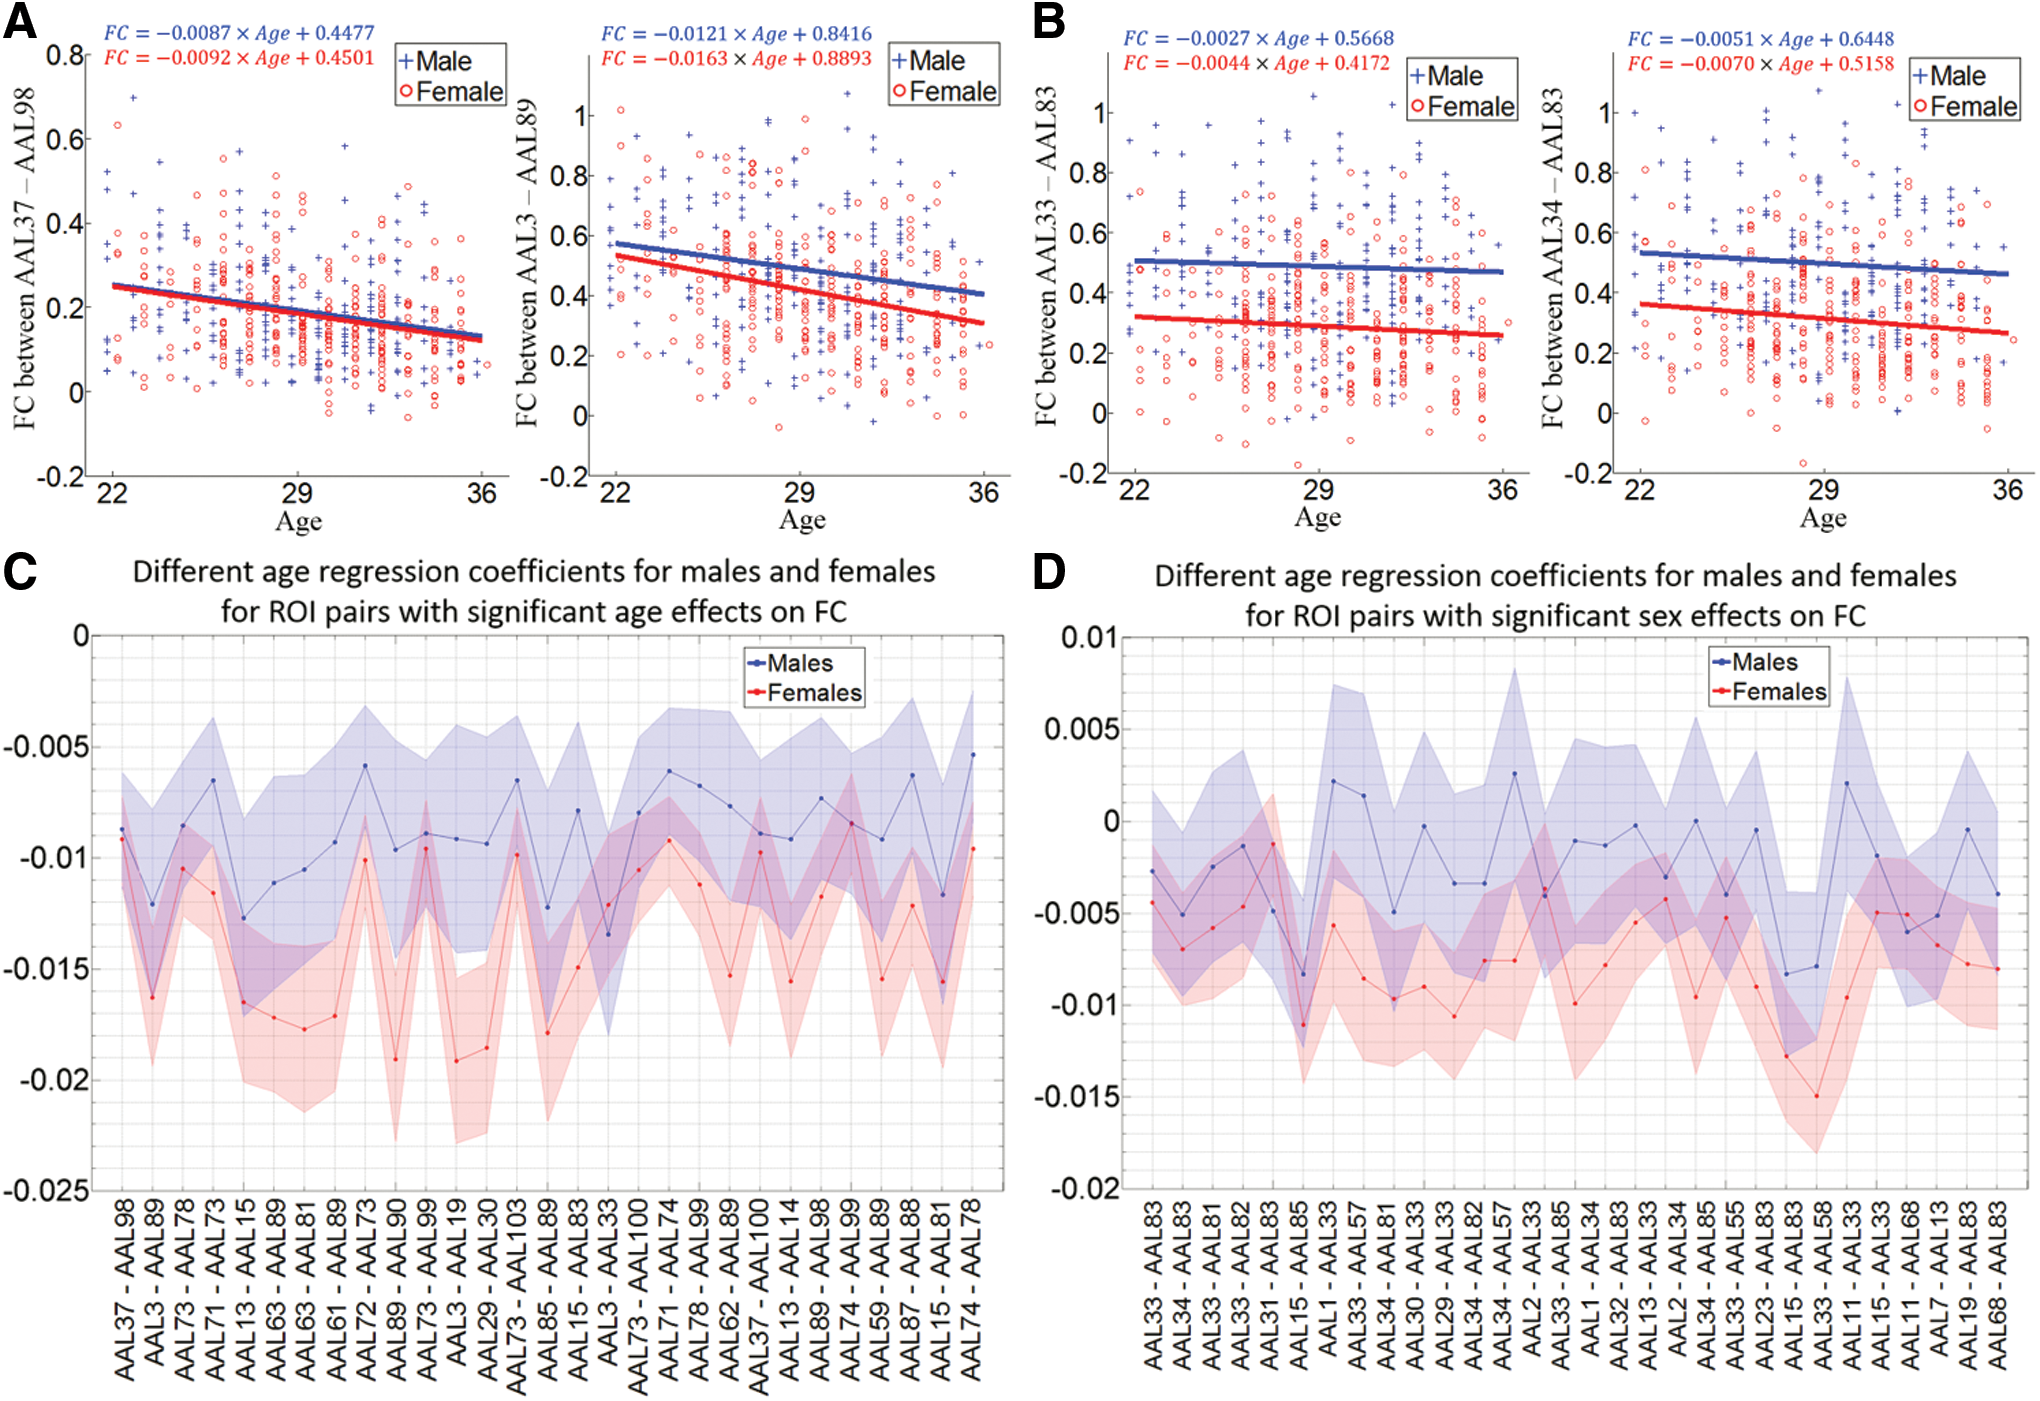
Age effects on FC for males and females separately.
Sex difference of graph properties
As shown in Figure 6A, B, sex differences for the nodal clustering coefficient and the nodal local efficiency are similar. For all lobes but the cerebellum, the stacked sex differences are in the positive side for most AAL regions. A majority of brain nodes in the cerebrum demonstrate stronger clustering coefficient and higher local efficiency in males compared to females and this result is replicated at different graph density thresholds. Sex effects in the medial temporal and the subcortical lobes are relatively weak, with significant sex differences present at only few densities. The only lobe that clearly exhibits stronger clustering coefficient and higher local efficiency in females compared to males is the cerebellum.
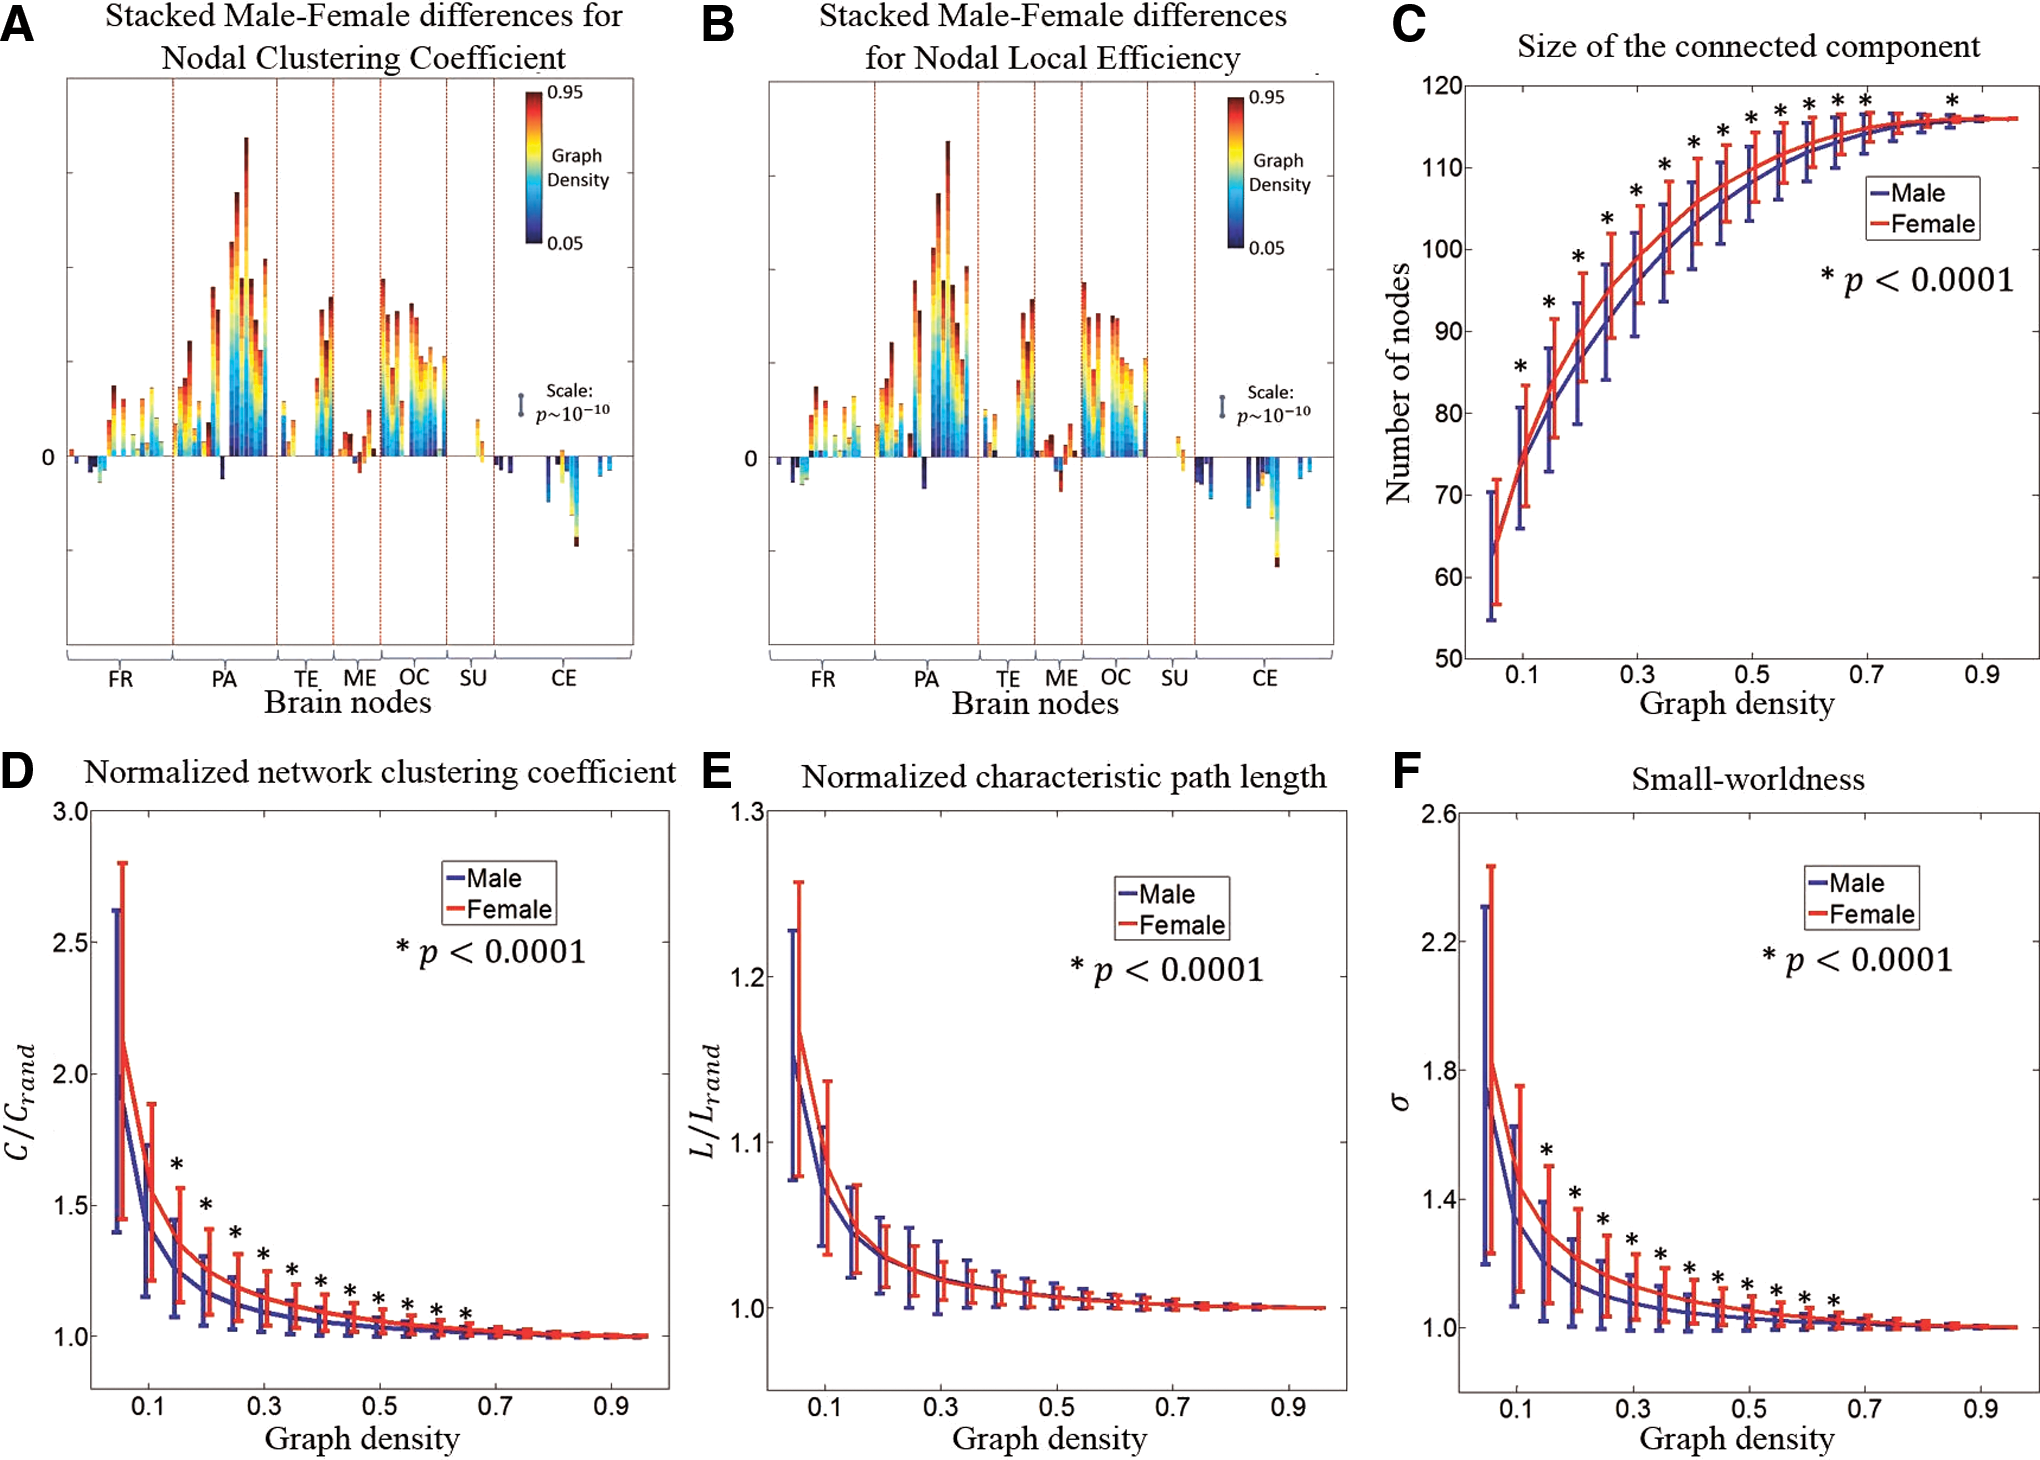
Male versus female differences for graph properties.
Across the range of graph density studied in this article (0.05–0.95), the 116 nodes in the graph may not be fully connected so there may exist isolated nodes from the major component. Therefore, we explored the size of the largest connected component (number of nodes in the component) and checked if it was different between males and females. Figure 6C illustrates that above a graph density threshold of 0.5, more than 90% of the nodes are connected. Except the densest case (0.95), females show a larger size for the connected component in all the other 18 densities, out of which 14 demonstrate a significance of
To confirm that the above two-sample t-test sex differences in graph measures were not influenced by age, we repeated the analysis with a regression model that contained sex and age as covariates. Effects of sex were similar to previous results and effects of age were much weaker and not consistent across graph densities (Supplementary Figs. S3 and S4).
Discussion
Sex effects on functional connectivity and on graph properties
One of the most significant results from our analyses is that there exist extensive sex-related differences of FC in the brain, and all FC measures that show statistically significant sex effects are greater in males than in females. Whereas most studies that note sex differences tend to have a mix of greater connectivity for either males or females (Allen et al., 2011; Filippi et al., 2013). Results of our study show that although FC differences were higher in females for certain pairs of FC measures, none of them survived multiple comparison correction. A previous study that investigated a group of healthy subjects spanning an age range similar to that of our cohort reported higher FC in the parietal and occipital regions for males compared to females (Filippi et al., 2013). This finding is replicated in our study. The increased parietal FC in men mirrors the result of fMRI studies for complex cognitive tasks (Thomsen et al., 2000), where males predominantly exhibited parietal activation. Our findings regarding increased FC in males in occipital regions are supported by Biswal et al. (2010), where FC of occipital regions is higher in males across three different methods (seed-based, fractional amplitude of low-frequency fluctuations, and ICA). Higher FC of both parietal and occipital lobes in males may possibly reflect the increased motor and visuospatial skills in men (Hamilton, 2008; Weiss et al., 2003).
Despite these robust sex differences, it should be noted that there is a large degree of overlap in FC of males and females. To illustrate this overlap, in Figure 7, we present FC histograms for five ROI pairs with the most significant sex effects. Although the average FC values for males and females are significantly different, there is a large overlap of FC values between the two groups. This male/female overlap of FC is also present across all ages, as indicated in Figure 5A, B.
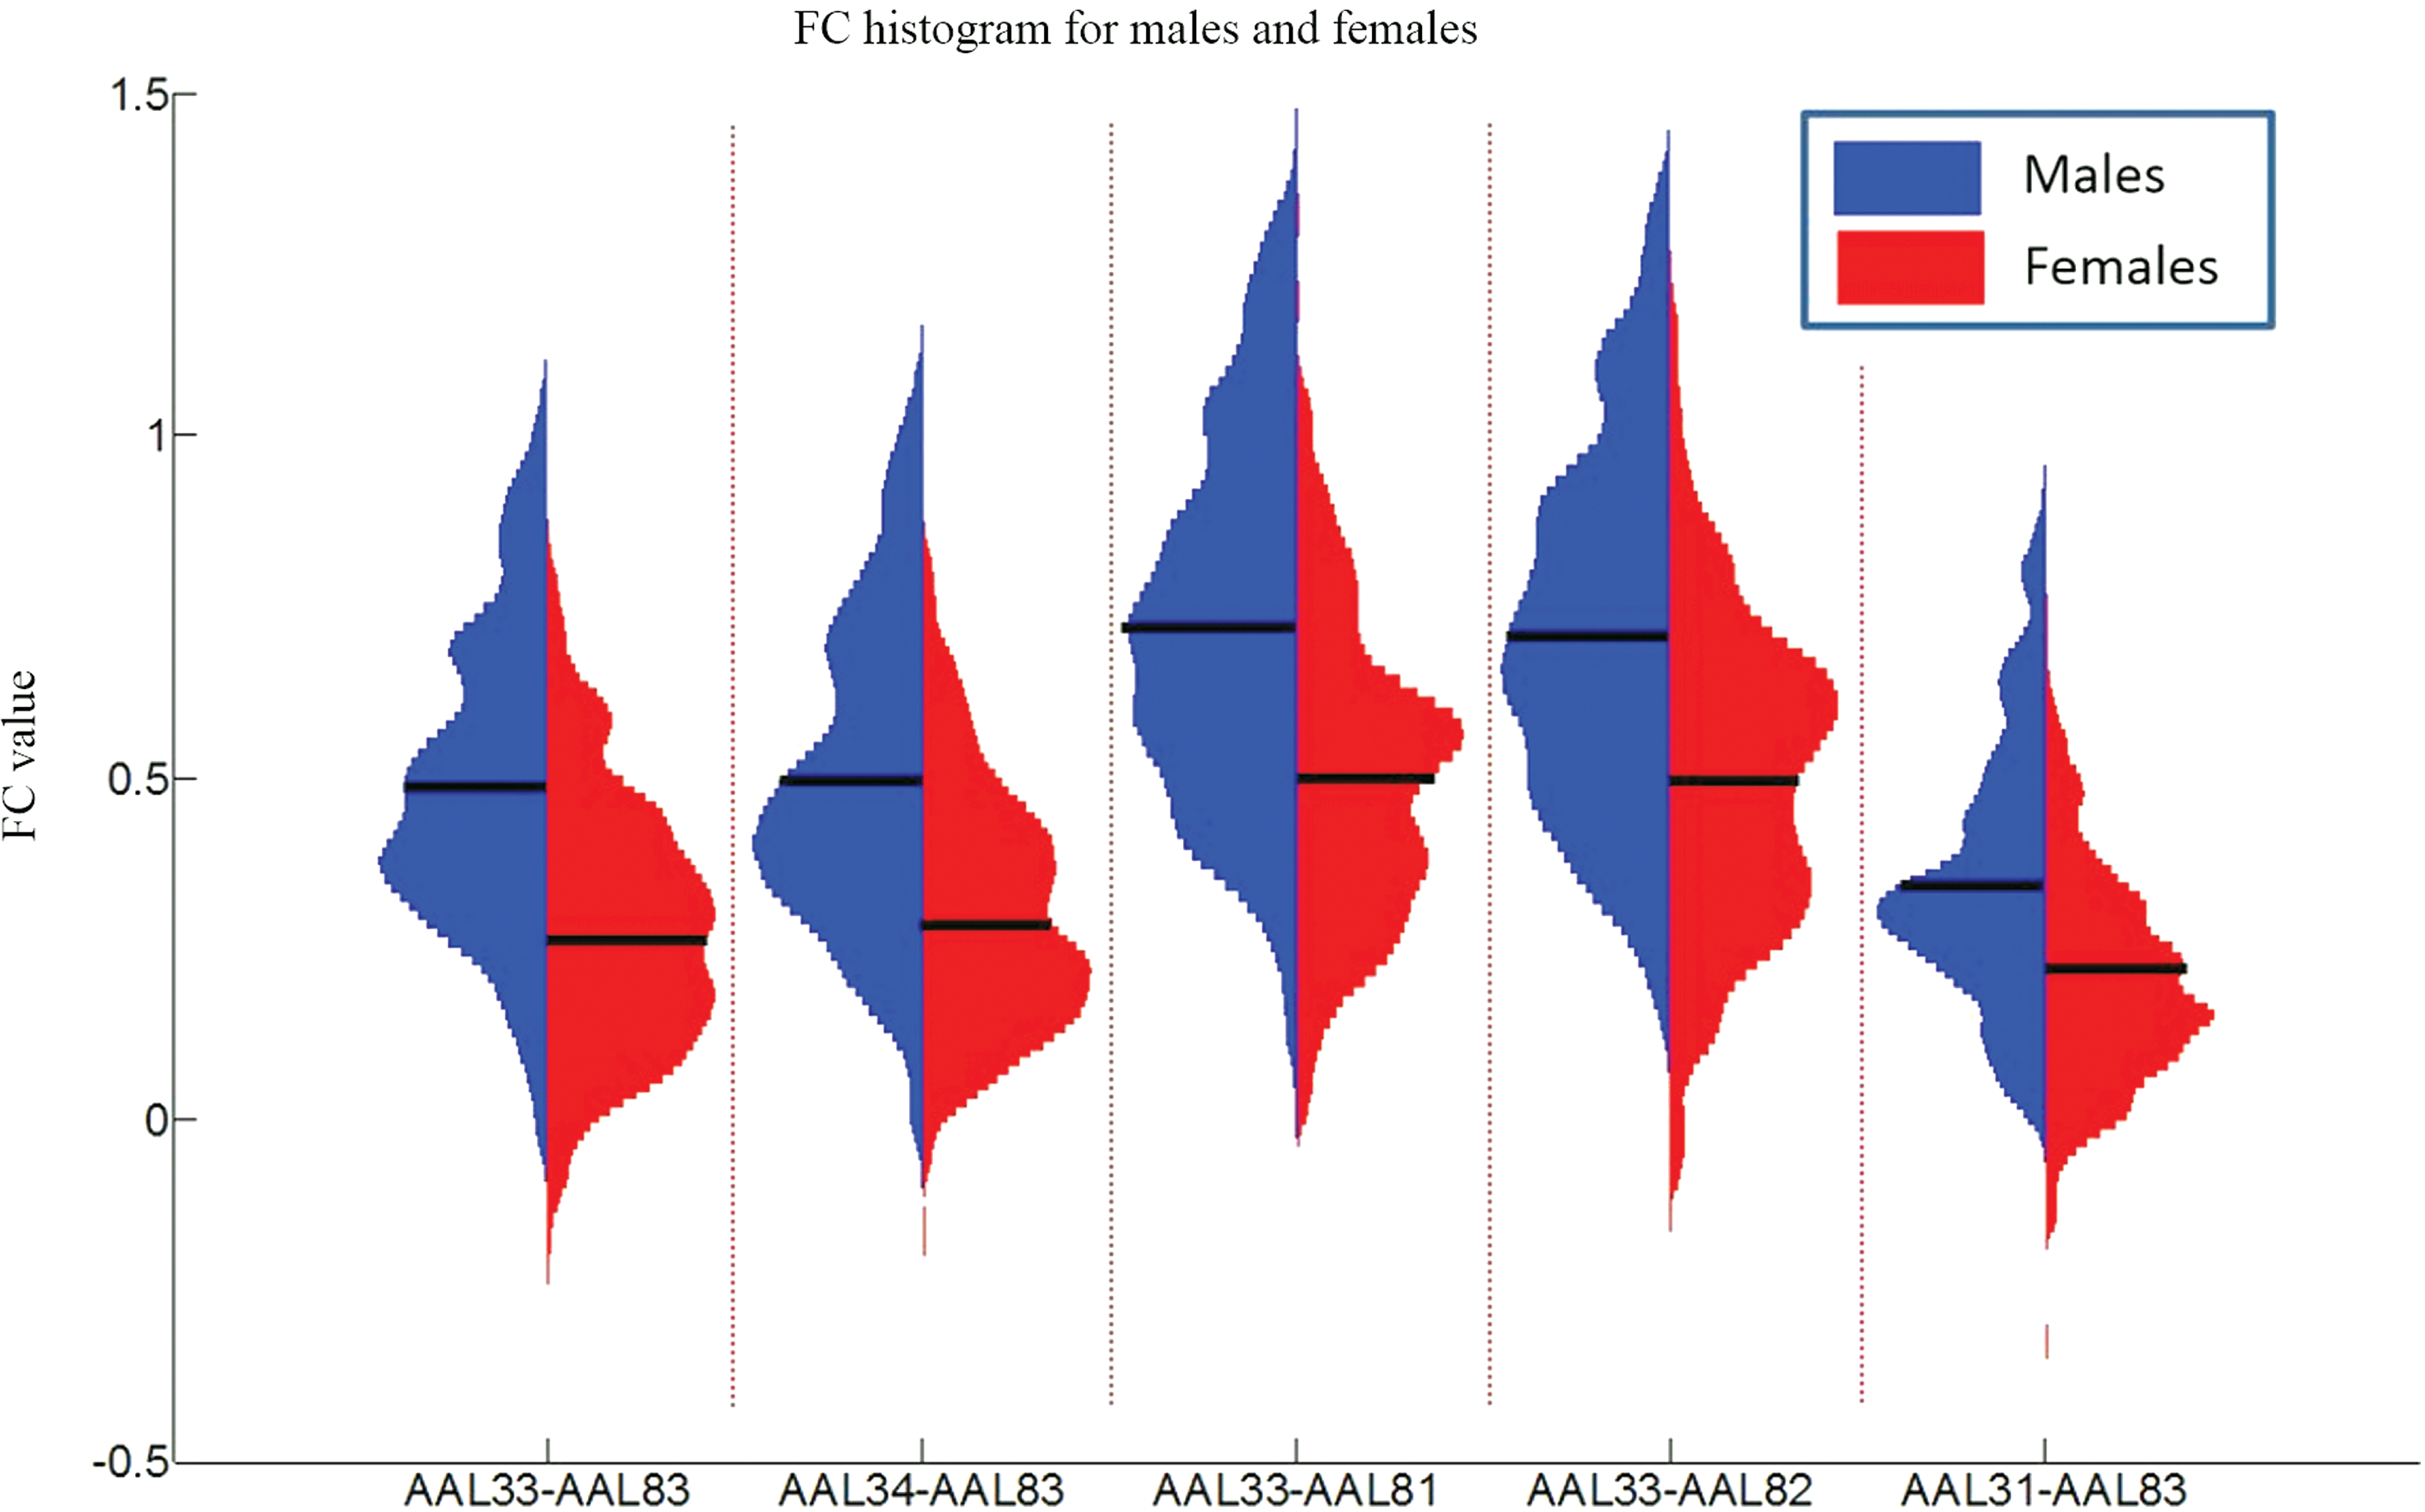
FC histograms for five ROI pairs with the most significant sex effects as listed in Table 2. Male and female FC histograms are shown vertically. The FC is derived by Fisher z-transforming the Pearson correlation coefficient so that the range of it is not restricted between
While some of our results strongly replicate previous findings, several findings do not. For frontal and temporal lobes, Filippi et al. (2013) reported stronger female FC, but we show the opposite trend (male >female). fMRI studies of language processing have indicated that, in comparison to males, females tend to have a higher bilateral activation in the frontal and temporal, when females had higher language performance scores (Baxter et al., 2003; Kansaku et al., 2000). The distinction regarding the directionality of sex differences may be attributed to the fact that in our cohort, two scores related to language processing are significantly higher in males (Table 1), which is unlike previous studies. Furthermore, previous studies did not use whole-brain AAL parcellations to calculate FC and this may be another reason for disparate findings. However, the association between language performance and frontal and temporal FC requires further investigation.
In a separate analysis, we evaluated the effect of cognitive measures on sex differences of FC. After the seven cognitive measures were incorporated into the regression models, the main pattern of the sex effects for the frontal, parietal, and temporal lobes in Figure 3A remained significant (Fig. 4A). This result was true for the age effects as well as we observed little change after adding the cognitive scores to the regression model. Therefore, we conclude that the sex and age effects on FC are robust to the cognitive measures.
With regard to the sex effect of graph measures, we first examined the size of the connected graph (Fig. 6C). Bassett et al. (2012) reported that this metric, defined as the number of nodes in the largest connected component, was significantly correlated with more complex graph measures (e.g., global efficiency or betweenness centrality) in a wide range of graph densities. Therefore, the size of the brain network may be an important indicator of the underlying topology. Our findings that female functional networks have significantly more connected nodes than males suggest an increased network homogeneity in female brains.
For the regional graph properties, we observed that nodes in the cerebellum have higher clustering coefficient and local efficiency for females, while nodes at other lobes show sex difference in the opposite direction. The most significant difference is in the parietal and occipital lobes, which may add credence to sex differences in FC discussed earlier. Results regarding the regional graph properties are in agreement with one diffusion imaging study (Ingalhalikar et al., 2014), in which the cerebellum was the only region that displayed higher participation coefficients in males, while in all other lobes, the cross-module participation dominated in females. Since higher participation coefficients indicate that connections are more uniformly distributed among the lobes, the diffusion study illustrated that in males, for all lobes but the cerebellum, FC is more focused within each module. This adds evidence to our findings of higher clustering coefficient and local efficiency in males, while the female connections are more spread between lobes and the network is less modular. This result and the larger size of the female brain networks jointly support the notion that female brain networks, compared to male networks, are more spatially distributed but at lower correlation strengths.
For the global properties of the graph, the normalized network clustering coefficient and the normalized characteristic path length were derived to calculate the small-world metric. While males and females do not differ in the characteristic path length, the normalized network clustering coefficient for females is significantly higher in a wide range of densities. This is consistent with the results in Yan et al. (2011) and makes the small-world metric to be higher for female networks. While both male and female brains clearly demonstrate small-world characteristics, there exist differences in the trade-off between local segregation and global integration of the network topology. We observed that male brains prevail in functional segregation, while female brains facilitate functional integration. Combining the effect of sex on FC and on graph metrics, we hypothesize that males are more likely better at performing a single task, whereas females are more equipped for performing multiple tasks, as has also been supported in a study using DTI (Ingalhalikar et al., 2014).
Age effects on functional connectivity
Age effects on FC have been explored in various studies. Among the findings, the extensive involvement of the medial temporal regions in age effects has been previously reported (Chou et al., 2013; Jacques, 2009; Li et al., 2014). However, only a few medial temporal regions (temporal pole and hippocampus) are present for age effects in our analysis. Given that the medial temporal lobe plays an important role in human memory (Buckner, 2004), we hypothesize that the medial temporal regions reported in studies involving large age ranges are due to significant memory deficits observed in later life. In our study, correlations between age and episodic/working memories are not significant and this adds evidence to the above hypothesis.
In our analyses, age effects on FC within cortical regions are mostly present in frontal, parietal, and temporal lobes. The effect of age on these three lobes has been reported in previous studies. Steffener et al. (2012) reported decreased FC in older adults between the supplementary motor area and the middle cingulate and between the precuneus and the middle/superior frontal cortex. Campbell et al. (2012) revealed reduced FC within the frontoparietal network in older adults, suggesting decreased activity and coherence within a putative control network. Also, the DMN, for which most components are in frontal or parietal lobes, has been consistently demonstrated to be susceptible to aging (Andrews-Hanna et al., 2007; Damoiseaux et al., 2008; Ferreira and Busatto, 2013; Grady, 2012). Our analyses detect age-related FC reductions in the medial prefrontal cortex, hippocampus, and inferior parietal gyrus, which are components of the DMN. This provides evidence that DMN regions are subject to aging, even in early adulthood. Finally, Campbell et al. report lower FC for older subjects in insula, superior temporal, middle temporal, and inferior temporal regions.
Besides the cortical lobes, our findings of age effects for the subcortical and cerebellar regions are also in line with previous studies. The caudate, putamen, and pallidum (Bollinger et al., 2011), which together constitute the basal ganglia, have been reported to demonstrate age effect on FC. Given that age-related differences in functional activation of the basal ganglia have been consistently reported during cognitive and motor tasks (Rubia et al., 2007; Wu and Hallett, 2005), the presence of reduced FC between putamen and caudate in our results indicates that the basal ganglia can be a robust marker for age effects. The role of the cerebellum in normal aging has been reported, where cerebellum–striatum and cerebellum–medial temporal lobe FC disruptions were noted (Bernard et al., 2013). This matches well with our results where FC between cerebellar regions and putamen/caudate (part of the dorsal striatum) and the hippocampus (part of the medial temporal lobe) is lower for older subjects. Bernard et al. (2013) suggested that the decreased striatal–cerebellar and hippocampus–cerebellar FC may be attributed to reduced dopamine levels and deficits in memory/associative learning in normal aging, respectively.
Application of the AAL atlas as a limitation
Although FC derivations based on anatomical ROIs have been explored extensively using different parcellation schemes (Craddock et al., 2012; de Reus and van den Heuvel, 2013; Marrelec and Fransson, 2011; Poldrack, 2007; Shirer et al., 2012), researchers have become more aware that functional inhomogeneity for anatomical parcellation may induce biases for network construction and graph analyses.
To determine the extent to which the average AAL time-courses were representative of the respective AAL regions, we calculated the number of voxels that were significantly correlated (p < 0.05) with the average time series within each AAL region. Out of 116 AAL regions, we found that 63 regions (54%) had more than 50% of voxels with significant correlations to the average time series. This indicates that using the AAL atlas for functional parcellation is reasonable.
The AAL atlas parcellation helped to locate significant sex and age effects on FC. However, it performed poorly in identifying associations with behavioral measures (see Sex and Age Effects of Functional Connectivity). In future studies, we intend to explore FC and FC associations to behavioral measures using other parcellations.
Conclusion
In this study, we demonstrated significant sex and age effects in early adulthood for healthy subjects using full brain resting-state FC. Our findings indicate widespread sex effects in which males exhibit higher FC than females for all significant measures. For the much less widespread brain regions associated with age effects, the involvement of some systems (e.g., DMN, basal ganglia) match well with findings in previous studies, which spanned larger age ranges, therefore suggesting robust markers for aging. Graph measures using a proportional threshold scheme demonstrate that both male and female brains exhibit small-world characteristics but with subtle significant differences in the organization of the networks. While male brains generally have higher clustering coefficient and higher local efficiency at the nodes of the graph, female brains are more connected at the whole-brain level. These findings illustrate the necessity of including sex and age as covariates in future fMRI studies and provide evidence that brain networks show male/female differences. The sex differences of FC indicate that male brain networks show signs of segregation and that female brain networks show signs of integration.
Footnotes
Author Contributions
Contributions to this work are as follows: A.M.M. is the principal investigator for this study. C.Z. processed the HCP data to derive time series by the AAL atlas. A.M.M. and C.Z. designed the study. N.D.C. and M.R.A. provided advice on statistical analyses and algorithm implementation. C.Z. performed the analyses under the supervision of A.M.M. C.Z. and A.M.M. drafted the manuscript. S.A.B. and T.W. advised with study design, provided intellectual support, and made contributions in drafting the manuscript.
Author Disclosure Statement
The authors have no commercial associations that might create a conflict of interest in connection with this article. This study used data publicly available from the Human Connectome Project. The analysis of this study was approved by the Geisinger Health System Institutional Review Board.
References
Supplementary Material
Please find the following supplemental material available below.
For Open Access articles published under a Creative Commons License, all supplemental material carries the same license as the article it is associated with.
For non-Open Access articles published, all supplemental material carries a non-exclusive license, and permission requests for re-use of supplemental material or any part of supplemental material shall be sent directly to the copyright owner as specified in the copyright notice associated with the article.