




Abstract
The edges of the structural connectome traverse the white matter to connect cortical and subcortical nodes, although the anatomic embedding of these edges is generally overlooked in the literature. Characterization of the geometry of the structural connectome could provide an improved understanding of the relative importance of various white matter regions to the network architecture of the human brain in normal development and aging, as well as in white matter diseases with regionally specific patterns of vulnerability. Edge density imaging (EDI) has previously been used to show that the posterior periventricular white matter contains a disproportionately large number of connectome edges. In this study, the regional distribution of connectome edges within cerebral white matter, including the importance of posterior periventricular white matter, is further investigated and demonstrated to be invariant to different gray matter parcellations and different diffusion MRI acquisition and postprocessing/tractography methods. An examination of the highest k-core edges and a virtual lesion analysis illuminate hemispheric asymmetries (left>right) in the embedding of connectome edges. Therefore, EDI reveals specific areas of vulnerability within the white matter connectivity of the human brain, especially in the periventricular white matter. The idea of a periventricular nexus fits with the known neurobiology of brain development and may result from simple geometrical considerations in minimizing wiring cost in structural brain connectivity.
Introduction
S
In this study, we further probe this periventricular nexus of network connectivity by demonstrating that the edge distribution throughout the white matter is largely invariant to the type or scale of the gray matter parcellation scheme used to define the nodes of the connectome. We also employ a tractography atlas to reconstruct ED images to demonstrate robustness to different data acquisition protocols and fiber tracking methods. To further expand the ED framework, k-core decomposition was performed to examine the embedding of high k-core edges and a virtual lesion analysis of the ED images simulated the effect of injury to the white matter. The findings presented in this article validate the edge density imaging (EDI) concept and expand its application to additional connectomic measures and virtual lesion analyses.
Materials and Methods
MRI acquisition
Siemens healthy volunteer data
Ten healthy adult subjects (five male, five female; mean age 26.7 ± 5.9 years; nine right handed) were scanned twice with an average of 30.4 ± 2.7 days between scans. All study procedures were approved by the institutional review board at the University of California at San Francisco (UCSF) and are in accordance with the ethics standards of the Helsinki Declaration of 1975, as revised in 2008.
MRI was performed on a 3T TIM Trio MR scanner (Siemens, Erlangen, Germany) using a 32-channel head phased-array radiofrequency head coil. High-resolution structural MRI of the brain was performed with an axial 3D magnetization-prepared rapid-acquisition gradient echo (MPRAGE) T1-weighed sequence (echo time [TE] = 1.64 ms, repetition time [TR] = 2530 ms, TI = 1200 ms, flip angle of 7°) with a 256-mm field of view (FOV), and 160 1.0-mm contiguous partitions at a 256 × 256 matrix. Whole-brain diffusion-weighted images were collected at b = 1000 s/mm2 with 30 directions. We used a multislice 2D single-shot twice-refocused spin-echo echo-planar sequence, the iPAT technique for parallel imaging with a reduction factor of 2; NEX = 1; interleaved 2 mm axial sections with no gap; in-plane resolution of 2 × 2 mm with a 128 × 128 matrix; a FOV of 256 mm; and TE/TR = 80/10,000 ms.
Connectome construction
Data preprocessing
After the nonbrain tissue was removed using the Brain Extraction Tool (Smith, 2002), the diffusion-weighed images were corrected for motion and eddy currents using the FMRIB linear-image registration tool (FLIRT) with a 12-parameter linear image registration (Jenkinson et al., 2002) using the b = 0 s/mm2 image as the reference. The fractional anisotropy (FA) image was calculated using FSL's DTIFIT. Using FLIRT, the FA map of every subject and session was registered to the T1 to obtain a diffusion to structural transform and the T1 was registered to the Montreal Neurological Institute (MNI)152 1 mm template brain to obtain a T1 to MNI transform.
Cortical parcellation
Three parcellations were used to define the nodes of the connectome for EDI reconstruction. The T1-weighed MR images were automatically segmented using the Desikan-Killiany (DK) parcellation (Desikan et al., 2006) and the Destrieux (DS) parcellation (Destrieux et al., 2010) from FreeSurfer 5.1.0 (Fischl et al., 2004) with the default settings of recon-all, resulting in 68 cortical regions and 14 subcortical regions for the DK parcellation and in 148 cortical regions and 14 subcortical regions for the DS parcellation. The cortical regions were transformed to the gray–white matter boundary using FreeSurfer. A functional connectivity-based parcellation of the cortex using resting-state fMRI data (Gordon et al., 2016) was used for the third parcellation. The parcellation is freely available for download in MNI space and consists of 333 nodes distributed throughout the cortex; we refer to this parcellation as FXCN. These nodes are more homogenous in their functional connectivity than any previously derived functional connectivity-based parcellation of the brain (Gordon et al., 2016). The regions were back projected from MNI space to the subject's diffusion space using the transforms previously described, and we used the gray-white matter boundary mask from FreeSurfer to thin the FXCN seed regions. We augmented the 333 cortical node in the FXCN parcellation with the 14 subcortical nodes from FreeSurfer, yielding 347 nodes in total.
Fiber estimation and tractography
Bedpostx (Behrens et al., 2007) was run to estimate the fiber orientation at every voxel (with a maximum fiber number of two and other default settings). Probabilistic tractography was performed with probtrackx2 (Behrens et al., 2007), with 1000 streamlines initiated from each seed voxel in the regions defined by the DK, DS, and FXCN parcellations. We generated a consensus connectome across subjects for each parcellation as in Owen et al. (2013). The consensus connectomes had a density of 14% (465 edges) for the DK parcellation, 8.7% (1144 edges) for the DS parcellation, and 4% (2427 edges) for the FXCN parcellation. The calculation of the consensus connectome allowed the identification of the strongest and most reproducible edges. We computed EDI maps for each parcellation using only the edges retained in the consensus connectome, with the distance weighting option to aid the tracking of long-range connections. To extract only the direct connections between each seed and target region, the target volume was used as a waypoint mask and all other regions besides the seed and target volumes were included in an exclusion mask. Due to the large number of tractography runs, the parallel computing grid infrastructure of the California Institute for Quantitative Biosciences (QB3) at UCSF was utilized. The bidirectional tractography results (i.e., from A to B and from B to A) were streamline thresholded, retaining only the top 95% of nonzero voxels. The resulting images were then binarized and the union of the masks was used to identify the voxels connecting each pair of cortical/subcortical regions.
Edge density imaging
Comparing EDI reconstruction techniques
As first defined in Owen et al. (2015), ED is the number of structural connectome edges that pass through a particular voxel in white matter. In our initial publication (Owen et al., 2015), we allowed every possible edge in the connectome to be reconstructed and we did not take the bidirectional tractography into account. In this article, we explore only using the edges from the consensus connectome to calculate ED and using the tractography in both directions to reconstruct the trajectory of each edge. To further establish the robustness of EDI, we used the IIT Human Brain Atlas v4.1.1 (
Rich club connectivity
We segregated the connectome edges based on the connections of the rich club (van den Heuvel and Sporns, 2011) as done in Owen et al. (2015) for the DK parcellation. Following the methods in van den Heuvel and Sporns (2011), we used the maximization of the normalized rich club coefficient to identify the nodes that constitute the rich club for the consensus connectome. The edges between rich club members are termed rich club connections (RC), while edges that connect nonrich club nodes to rich club nodes are termed feeder connections (FC), and the edges that connect nonrich club nodes are referred to as local connections (LC). We computed ED maps of RC, FC, and LC for each scan session and then generated a mean image for each type of connection in the MNI space.
Connectivity within high k-core nodes
Another network decomposition method that identifies regions of high importance is the k-core decomposition. For a binary network, the k-core is the largest subgraph comprising nodes with degree ≥ k. We derived the k-cores by recursively peeling off nodes with degree lower than k until none remained (Hagmann et al., 2010). In this way, each node was assigned a core number, defined as the largest k such that the node is still contained in the k-core; we found the highest k-core to be at k = 8. We performed k-core decomposition on the binary high-resolution connection matrices from the FXCN parcellation as the k-cores were not informative at the lower resolutions. The edges of the connectome were then segregated into edges that communicate between the highest k-core (intra k-core = 8), feeding into the highest k-core (inter k-core = 8), and not connected to the highest k-core (non k-core = 8), and EDI maps were constructed for the three edge types and a mean image was calculated for each type of connection in the MNI space.
Lesion analysis
To understand which regions of the brain are essential for the ability of brain regions to easily communicate with each other, it is necessary to introduce an easily computable metric to characterize the connectivity of a network. While many metrics, such as betweenness centrality, exist to quantify connectivity, these measures assume that two nodes in a network will only communicate along their shortest length path and all other paths connecting the nodes are insignificant (Freeman, 1977). However, in many networks, information will often travel along nonshortest paths (Borgatti, 2005). In this article, we use communicability, a weighted sum of all possible paths connecting two nodes in a network, as defined in Estrada and Hatano (2008) and previously used for lesion analysis of the connectome (de Reus and van den Heuvel, 2014). Each path is weighted by the product of the connectivities (streamline count) associated with each individual edge, resulting in paths with higher streamline counts giving a larger contribution to communicability. We define the mean communicability of a network to be the average of the communicability between all possible pairs of nodes, ignoring self-loops (e.g., the communicability of same node to itself).
To identify vulnerable regions of the brain, we simulated the effect of virtual lesions across the white matter regions of the brain. Lesions were defined as spheres with radii varying between 2 and 5 mm. All network connections that passed through a lesion were weakened proportionally by the volume of the connection that was removed by the lesion compared to the total volume of white matter occupied by the edge. The “importance” of a white matter voxel was defined as the loss in mean communicability after introducing a lesion at the voxel of interest.
Results
In Figure 1, we present the EDI maps derived from using all possible edges and only the edges from the consensus connectome for our tractography data (A&B) and the IIT tractography atlas (C&D), all based on the DK parcellation. When comparing the EDI maps based on all edges (A) and only the consensus connectome edges (B), we observed that the posterior periventricular white matter carries a large number of edges compared to anterior regions. Using all edges, however, produces higher ED measures in the posterior corpus callosum and relatively low ED measures in the anterior white matter compared to using only the consensus edges. Quantitatively, the EDI maps in A and B are strikingly similar, with a Spearman's ρ = 0.94 (Table 1). Using the IIT atlas (C&D) yields ED images similar to those obtained with our own tractography methods (A&B), although the images in C&D are less smooth as they have not been averaged over 20 scans. Both images using all edges demonstrate a strong posterior bias and have a Spearman's ρ = 0.65 (Table 1). Using only the most probable edges of the connectome in both cases demonstrates a less pronounced posterior bias, but still a relatively large number of edges in posterior periventricular white matter; the images in B and D have a Spearman's ρ = 0.62 (Table 1).
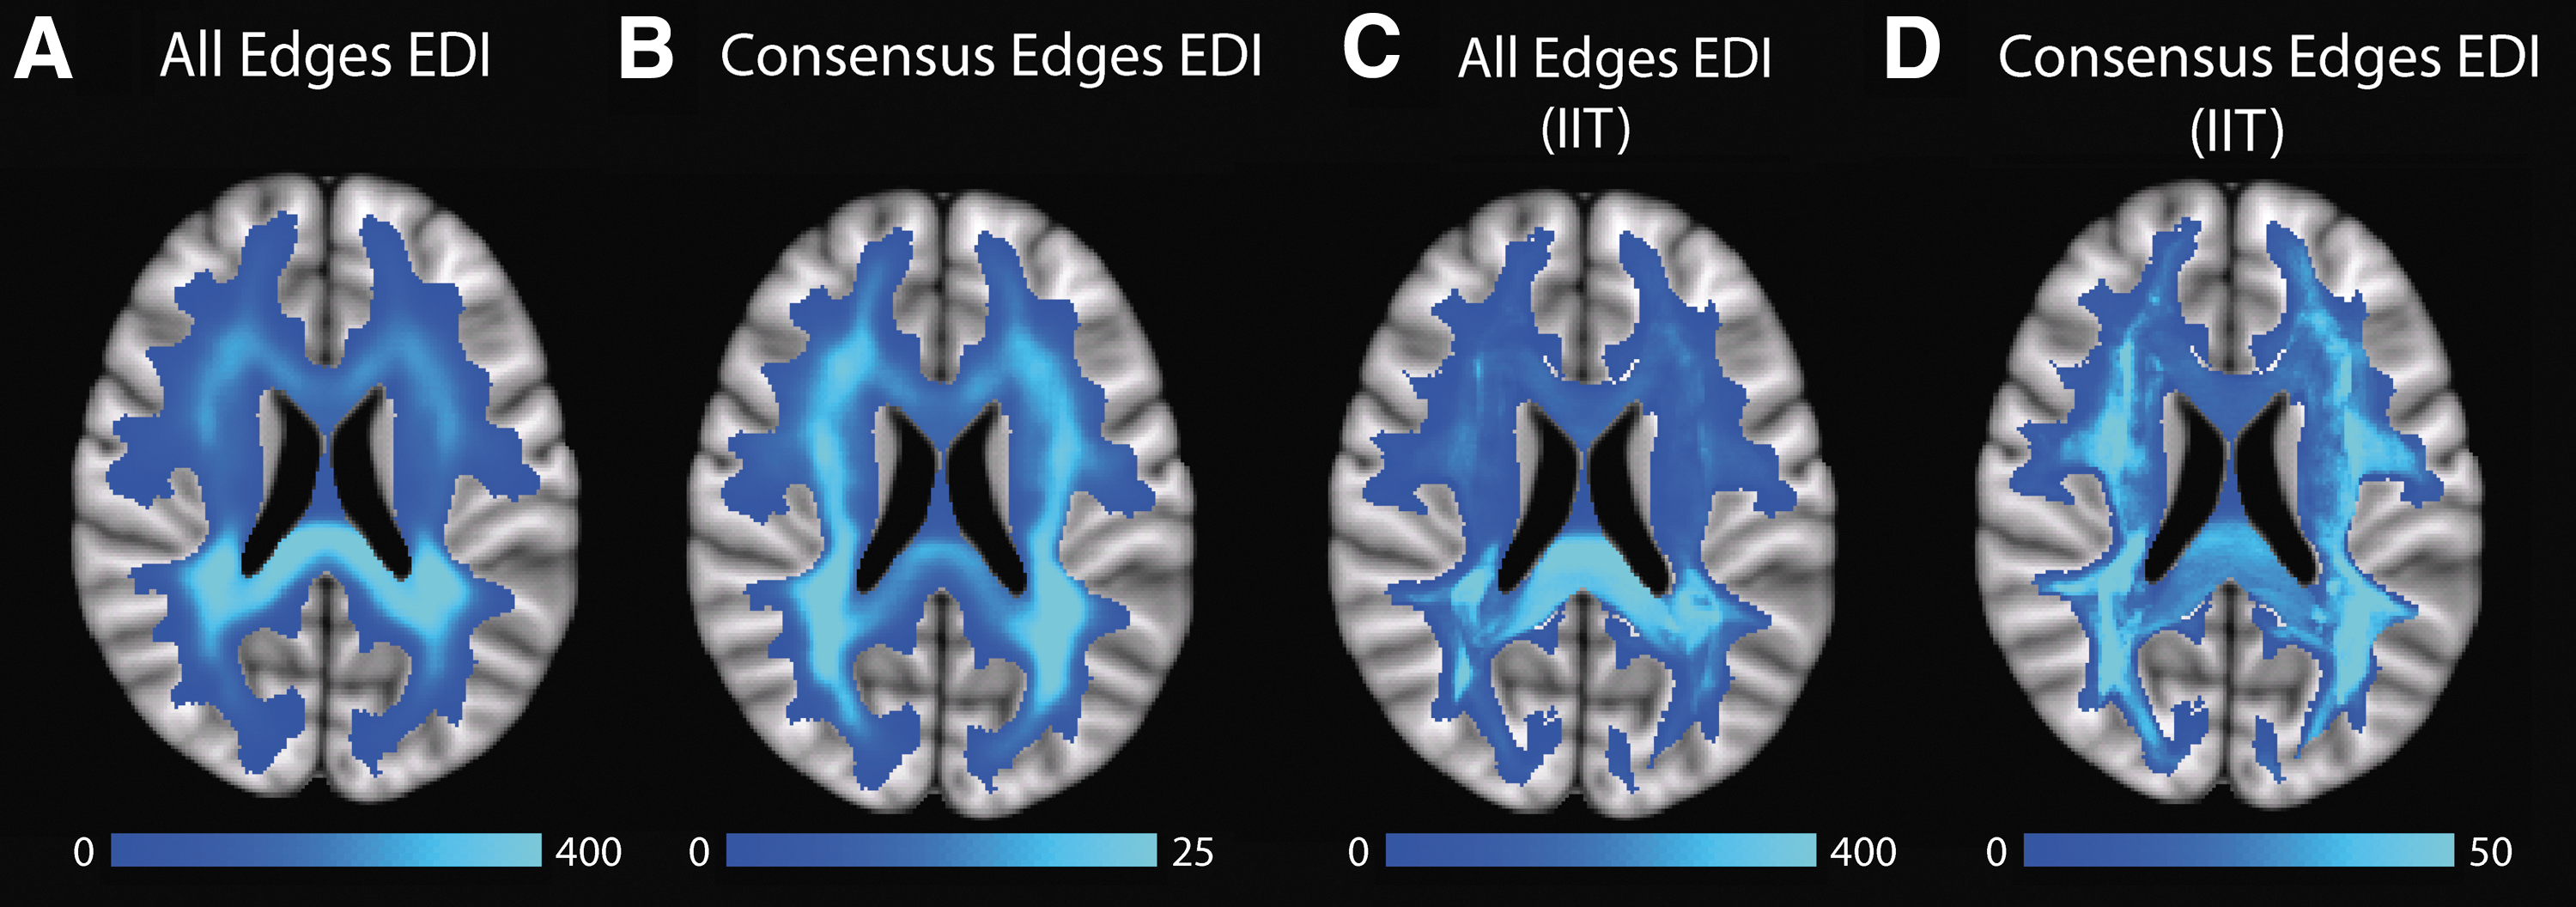
An axial slice through ED images constructed using the following:
EDI, edge density imaging.
The consensus connectomes across the three parcellations are displayed in Figure 2; consistent across all three parcellations is the large number of highly connected (high degree) nodes in posterior and temporal brain regions and the relative lack of highly connected nodes in anterior (frontal) brain regions. The anatomic embedding of these edges is presented in Figure 3. In the sagittal images through the corpus callosum, one can observe that there are more edges crossing in the splenium and posterior body than in the genu or anterior body. The convergence of edges in the posterior periventricular white matter is also apparent across all three parcellations. The test–retest reliability for the ED measures is comparable across the three maps (Table 2). The mean ICC is in the good to excellent range (0.6–1.0) for all three parcellations, indicating robustness of EDI, however, the mean CoVs (0.14–0.21) are relatively high, indicating that a large effect size would be necessary to detect statistically significant group differences in regional ED. As demonstrated in Table 3, the DK and DS EDI maps are the most quantitatively similar (ρ = 0.97), but all three parcellations yield similar ED maps.
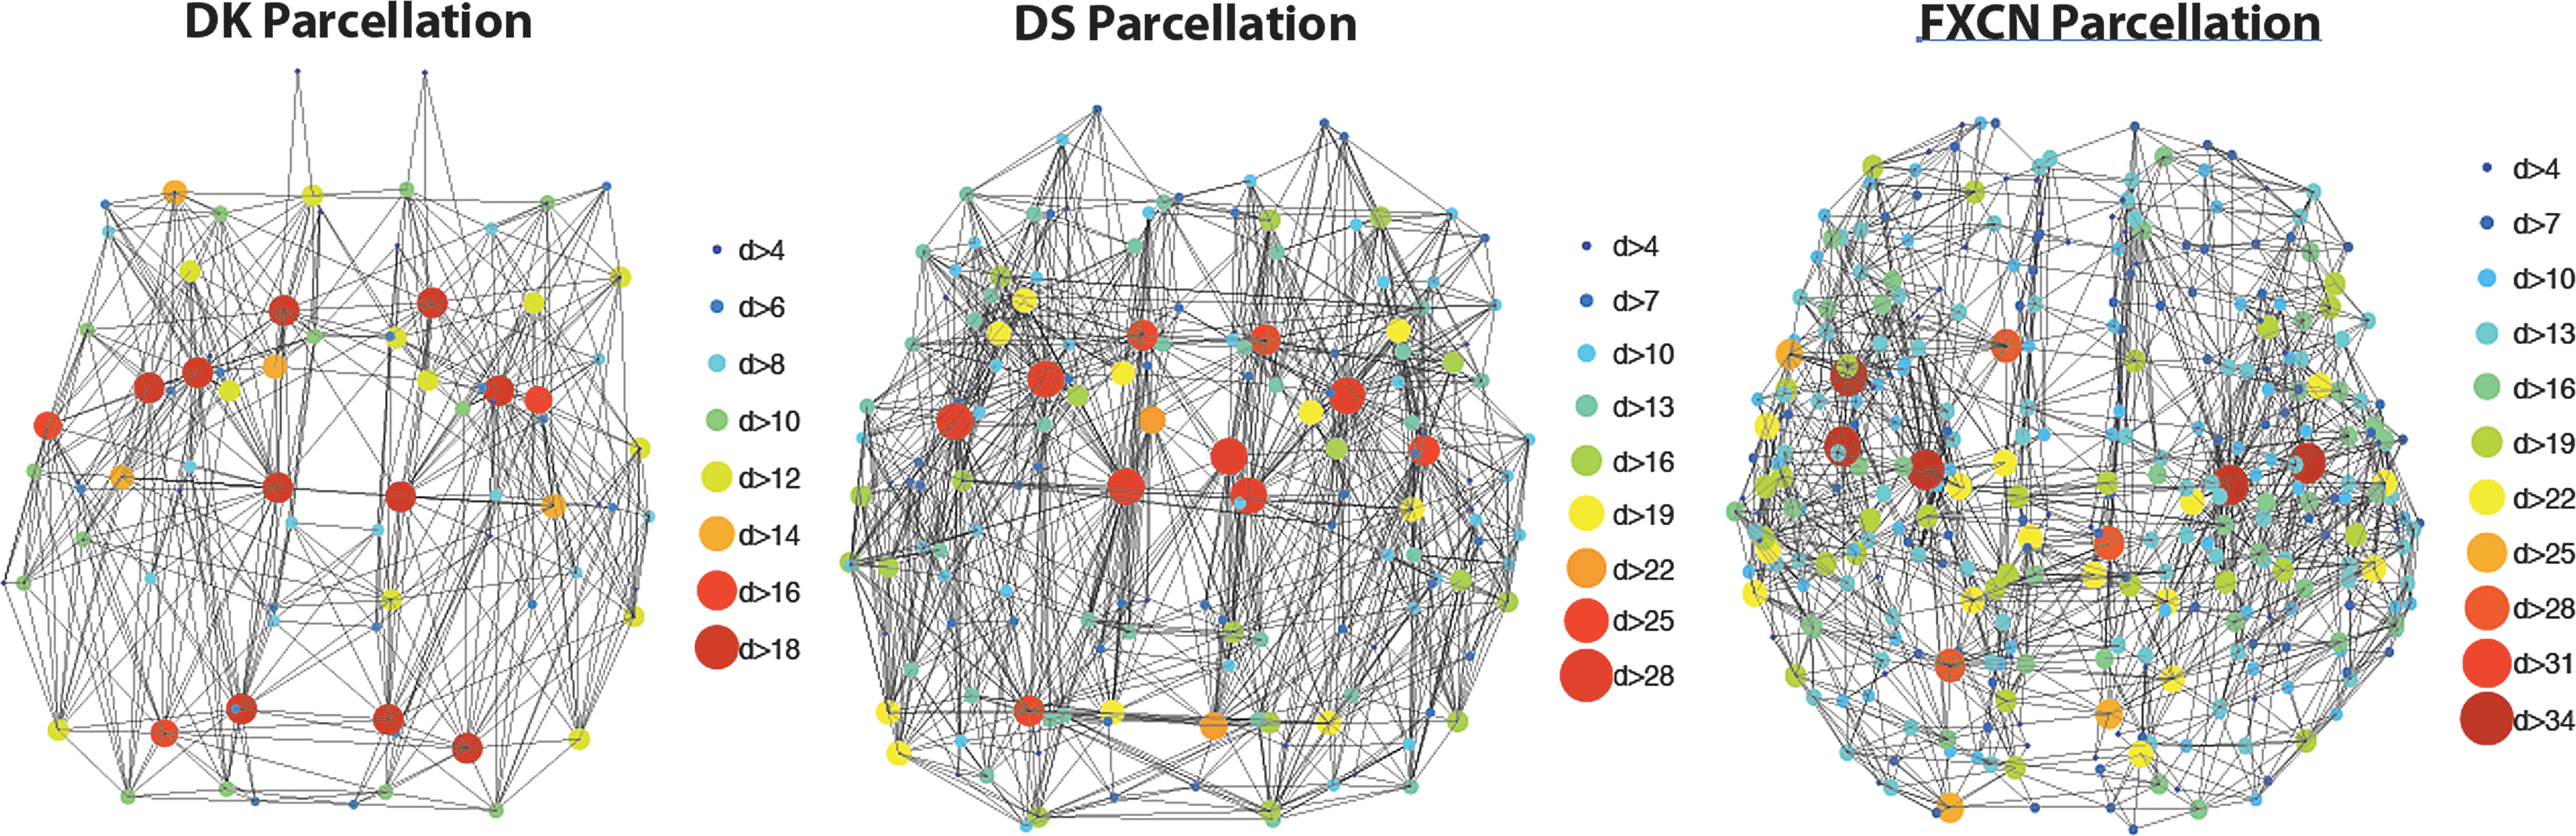
Consensus connectome diagrams (in axial orientation) for the gray matter parcellations: DK, DS, and functional connectivity (FXCN). The nodes are shown with circles, colored and scaled based on the node degree (d). The edges of the consensus connectome are shown as connecting nodes. These diagrams are shown in neurological convention, right side of the brain on the right side of the image. DK, Desikan-Killiany; DS, Destrieux.
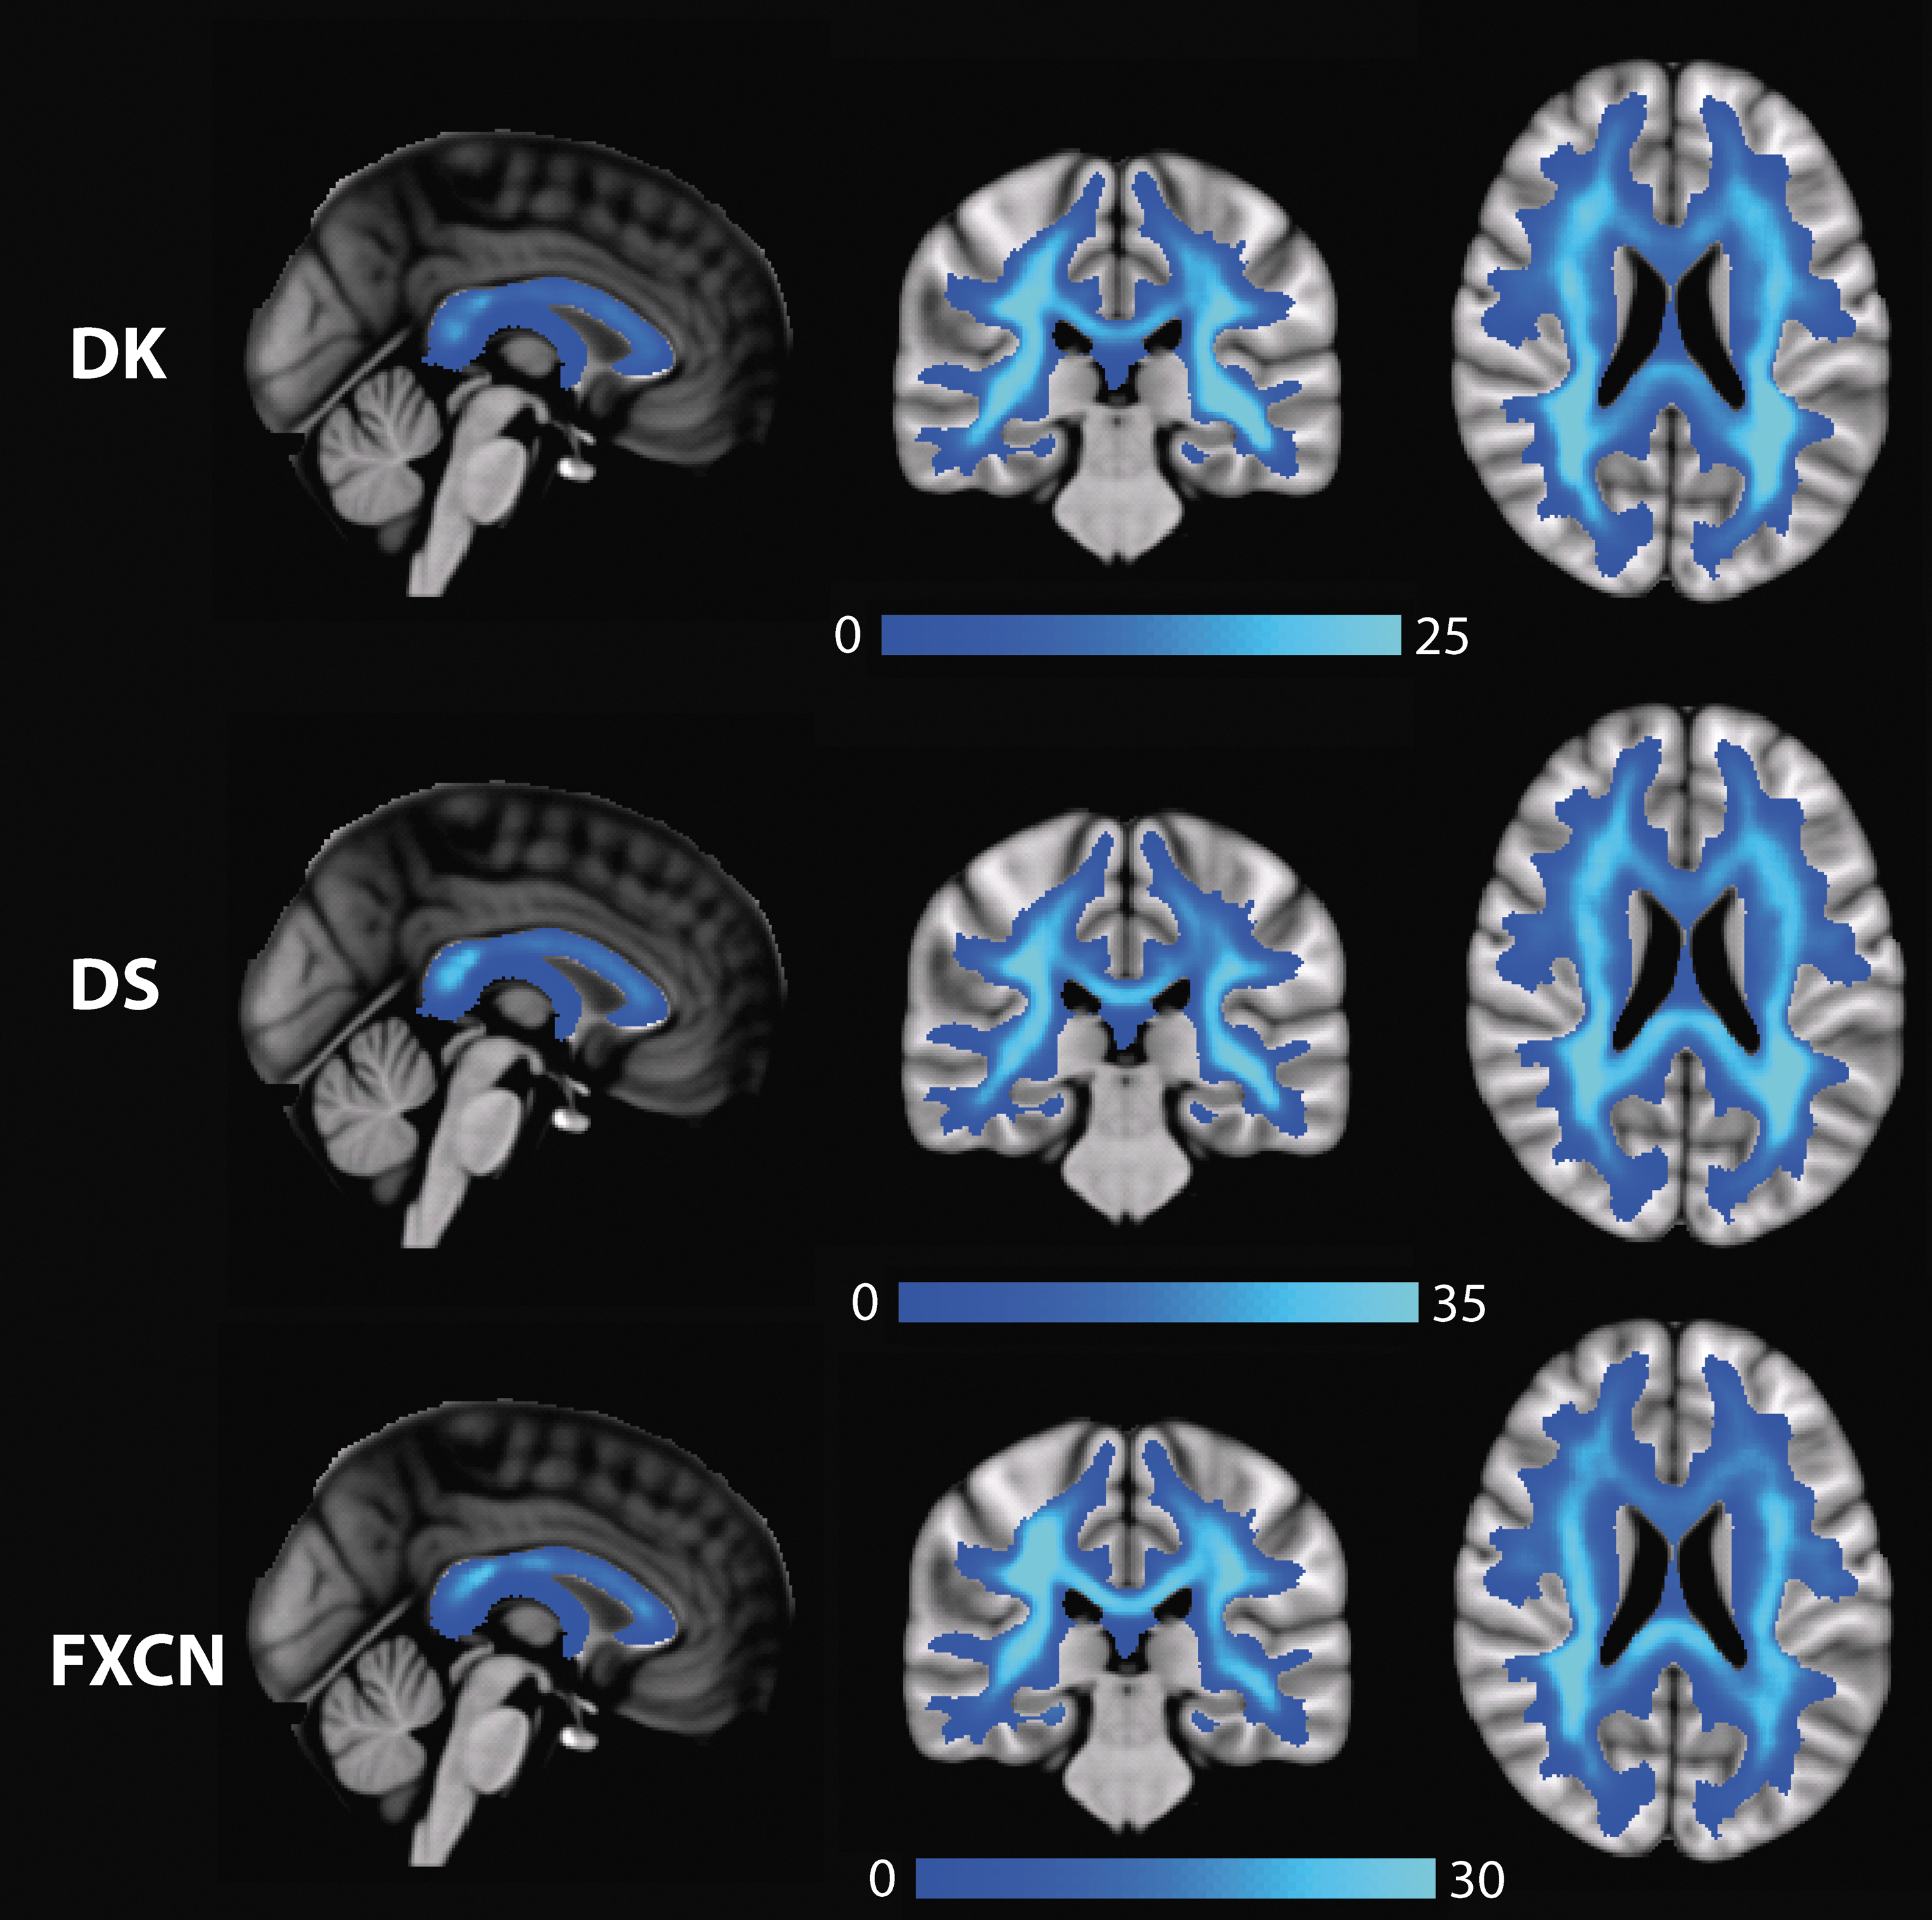
Mean EDI maps in MNI space across gray matter parcellations: DK, DS and functional connectivity (FXCN). All maps are shown in radiological convention, left side of the brain on the right side of the image. EDI, edge density imaging.
The range, mean, and standard deviation are provided for ICC and CoV across 31 JHU white matter ROIs (all supratentorial).
CoV, coefficient of variation; ICC, intraclass correlation coefficient.
The rich club nodes and rich club, feeder, and LC across parcellations are displayed in Figure 4. The locations of rich club nodes for all parcellations were similar, with rich club nodes in posterior and temporal brain regions. The rich club nodes for the FXCN parcellation have the most bias toward posterior regions. The white matter trajectories of the rich club (red), feeder (blue), and local (green) connections are depicted in Figure 5 and the correlation coefficients for the images are provided in Table 3. For the DK and DS parcellations, the RC are more evenly distributed anterior and posterior, including the corpus callosum and the periventricular white matter, and the edges are biased to medial white matter as reported in Owen et al. (2015). The RC, however, for the FXCN parcellation are restricted to the mid-region of the centrum semiovale and posterior body of the corpus callosum. The correlation of the RC for the DK and DS parcellations is relatively high (ρ = 0.79), whereas the correlations of the FXCN with the DK and DS parcellations are not nearly as strong (ρ < 0.37).
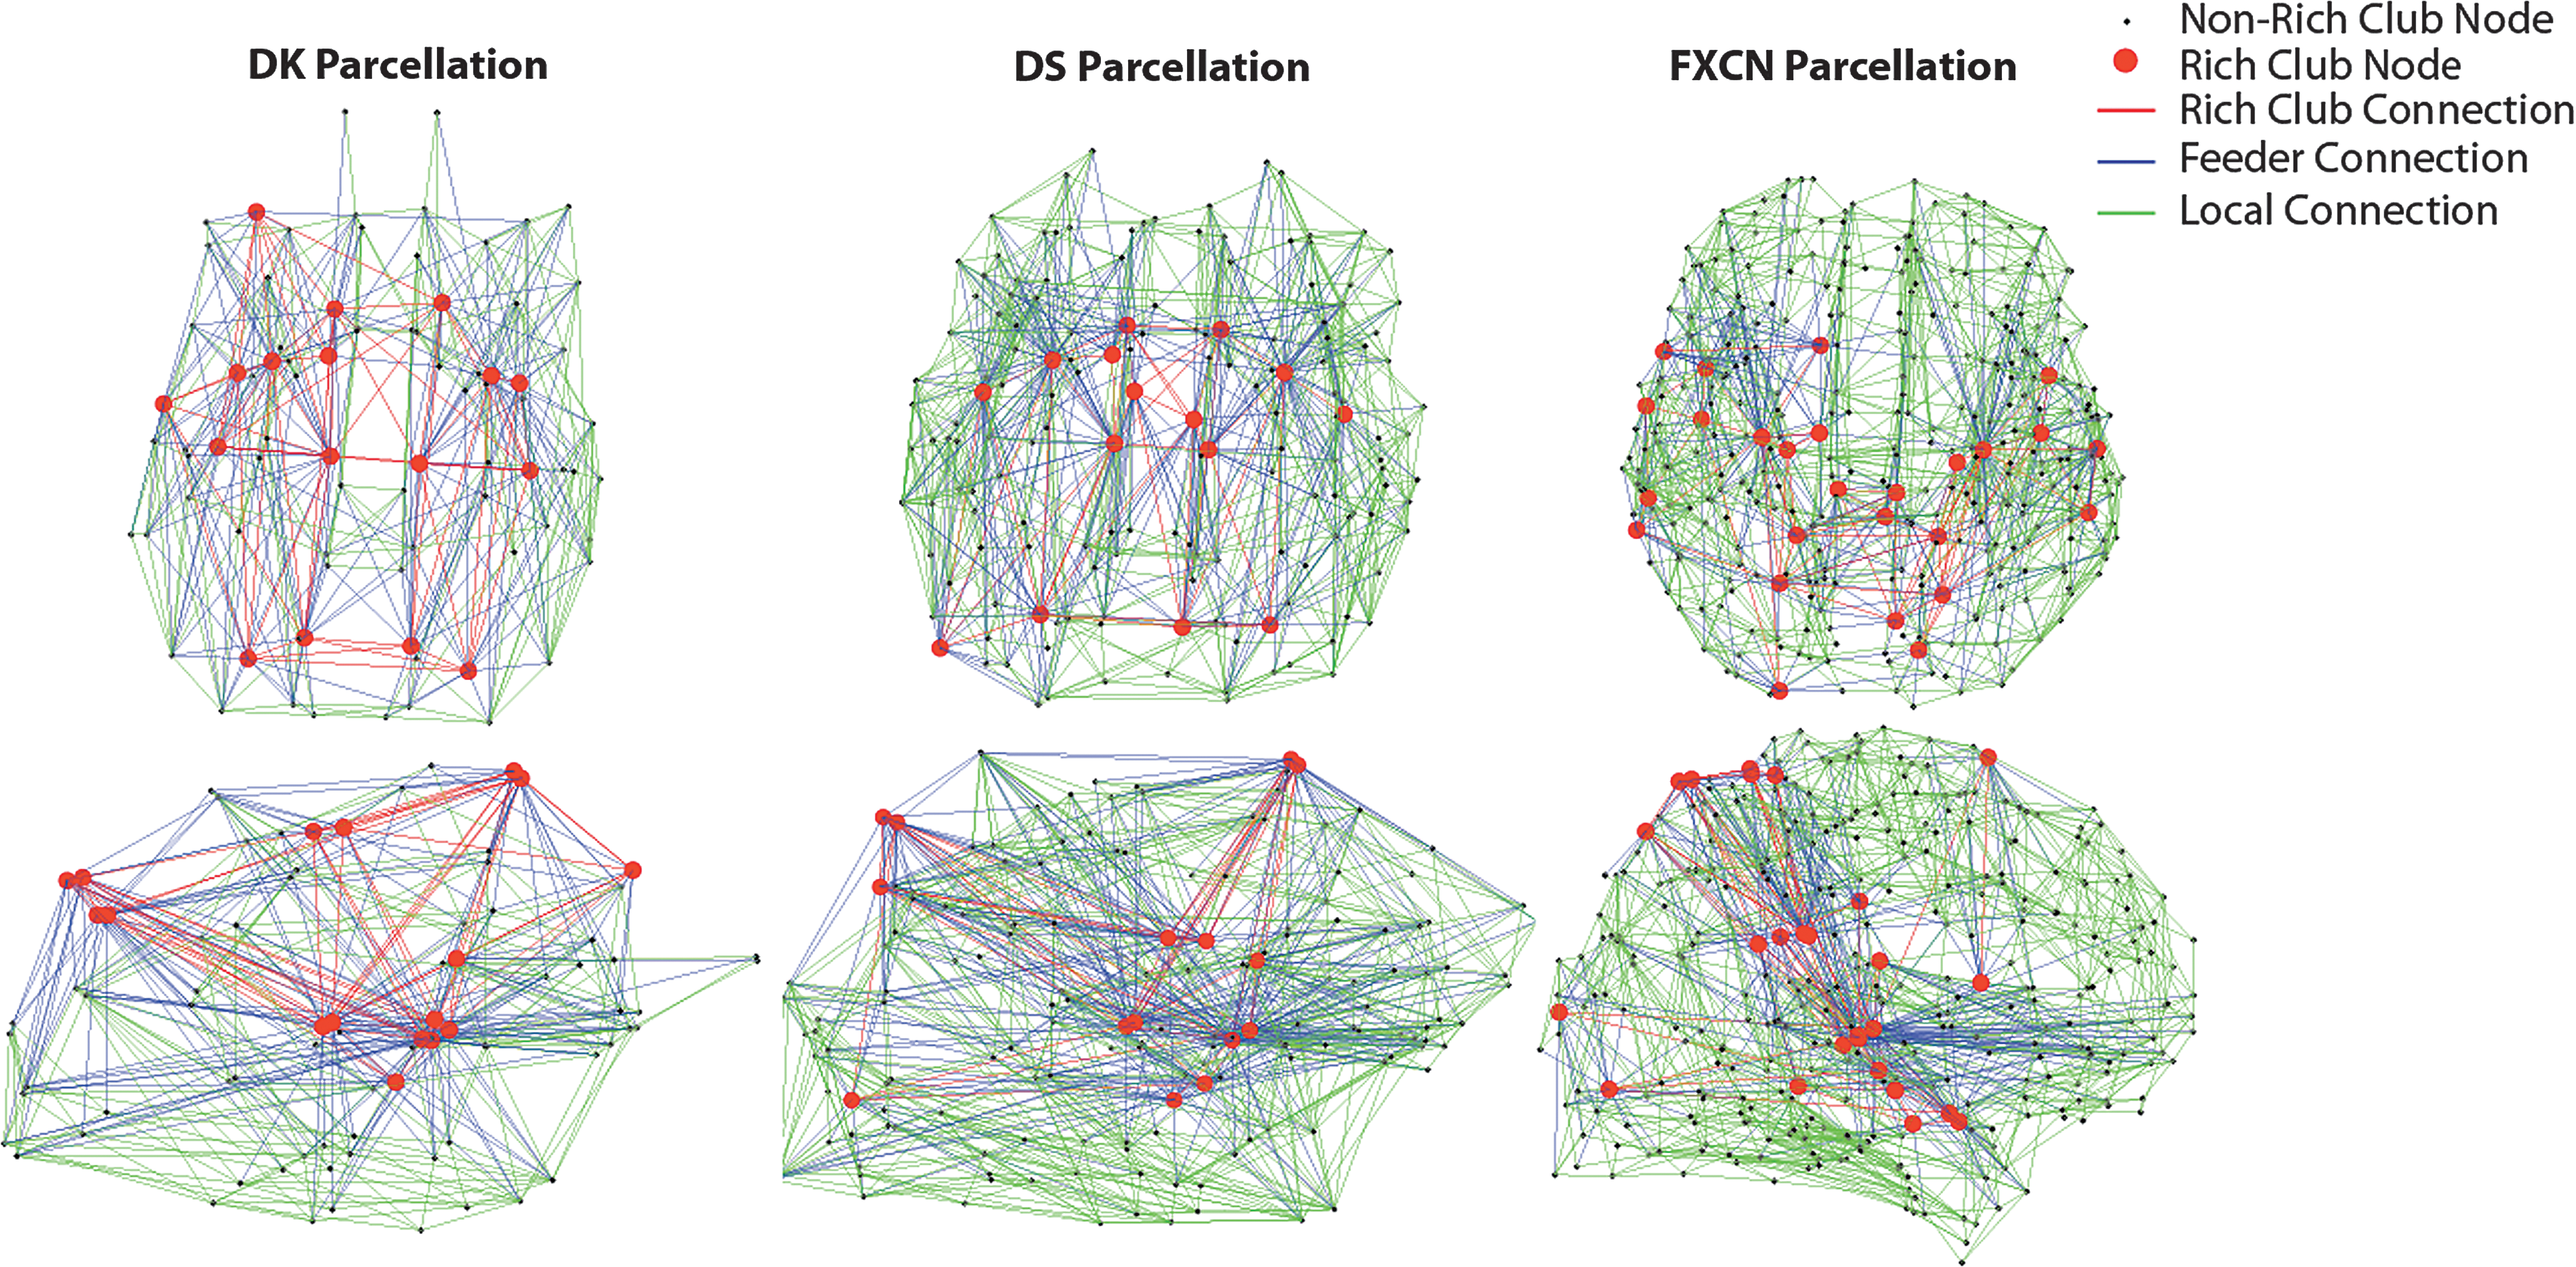
Rich-club organization connectome diagrams (in axial and sagittal orientation) for the gray matter parcellations. The rich-club nodes are shown with red circles and the edges of the consensus connectome are designated as rich-club edges (red), feeder connections (blue), and local connections (green). These diagrams are shown in neurological convention, right side of the brain on the right side of the image.
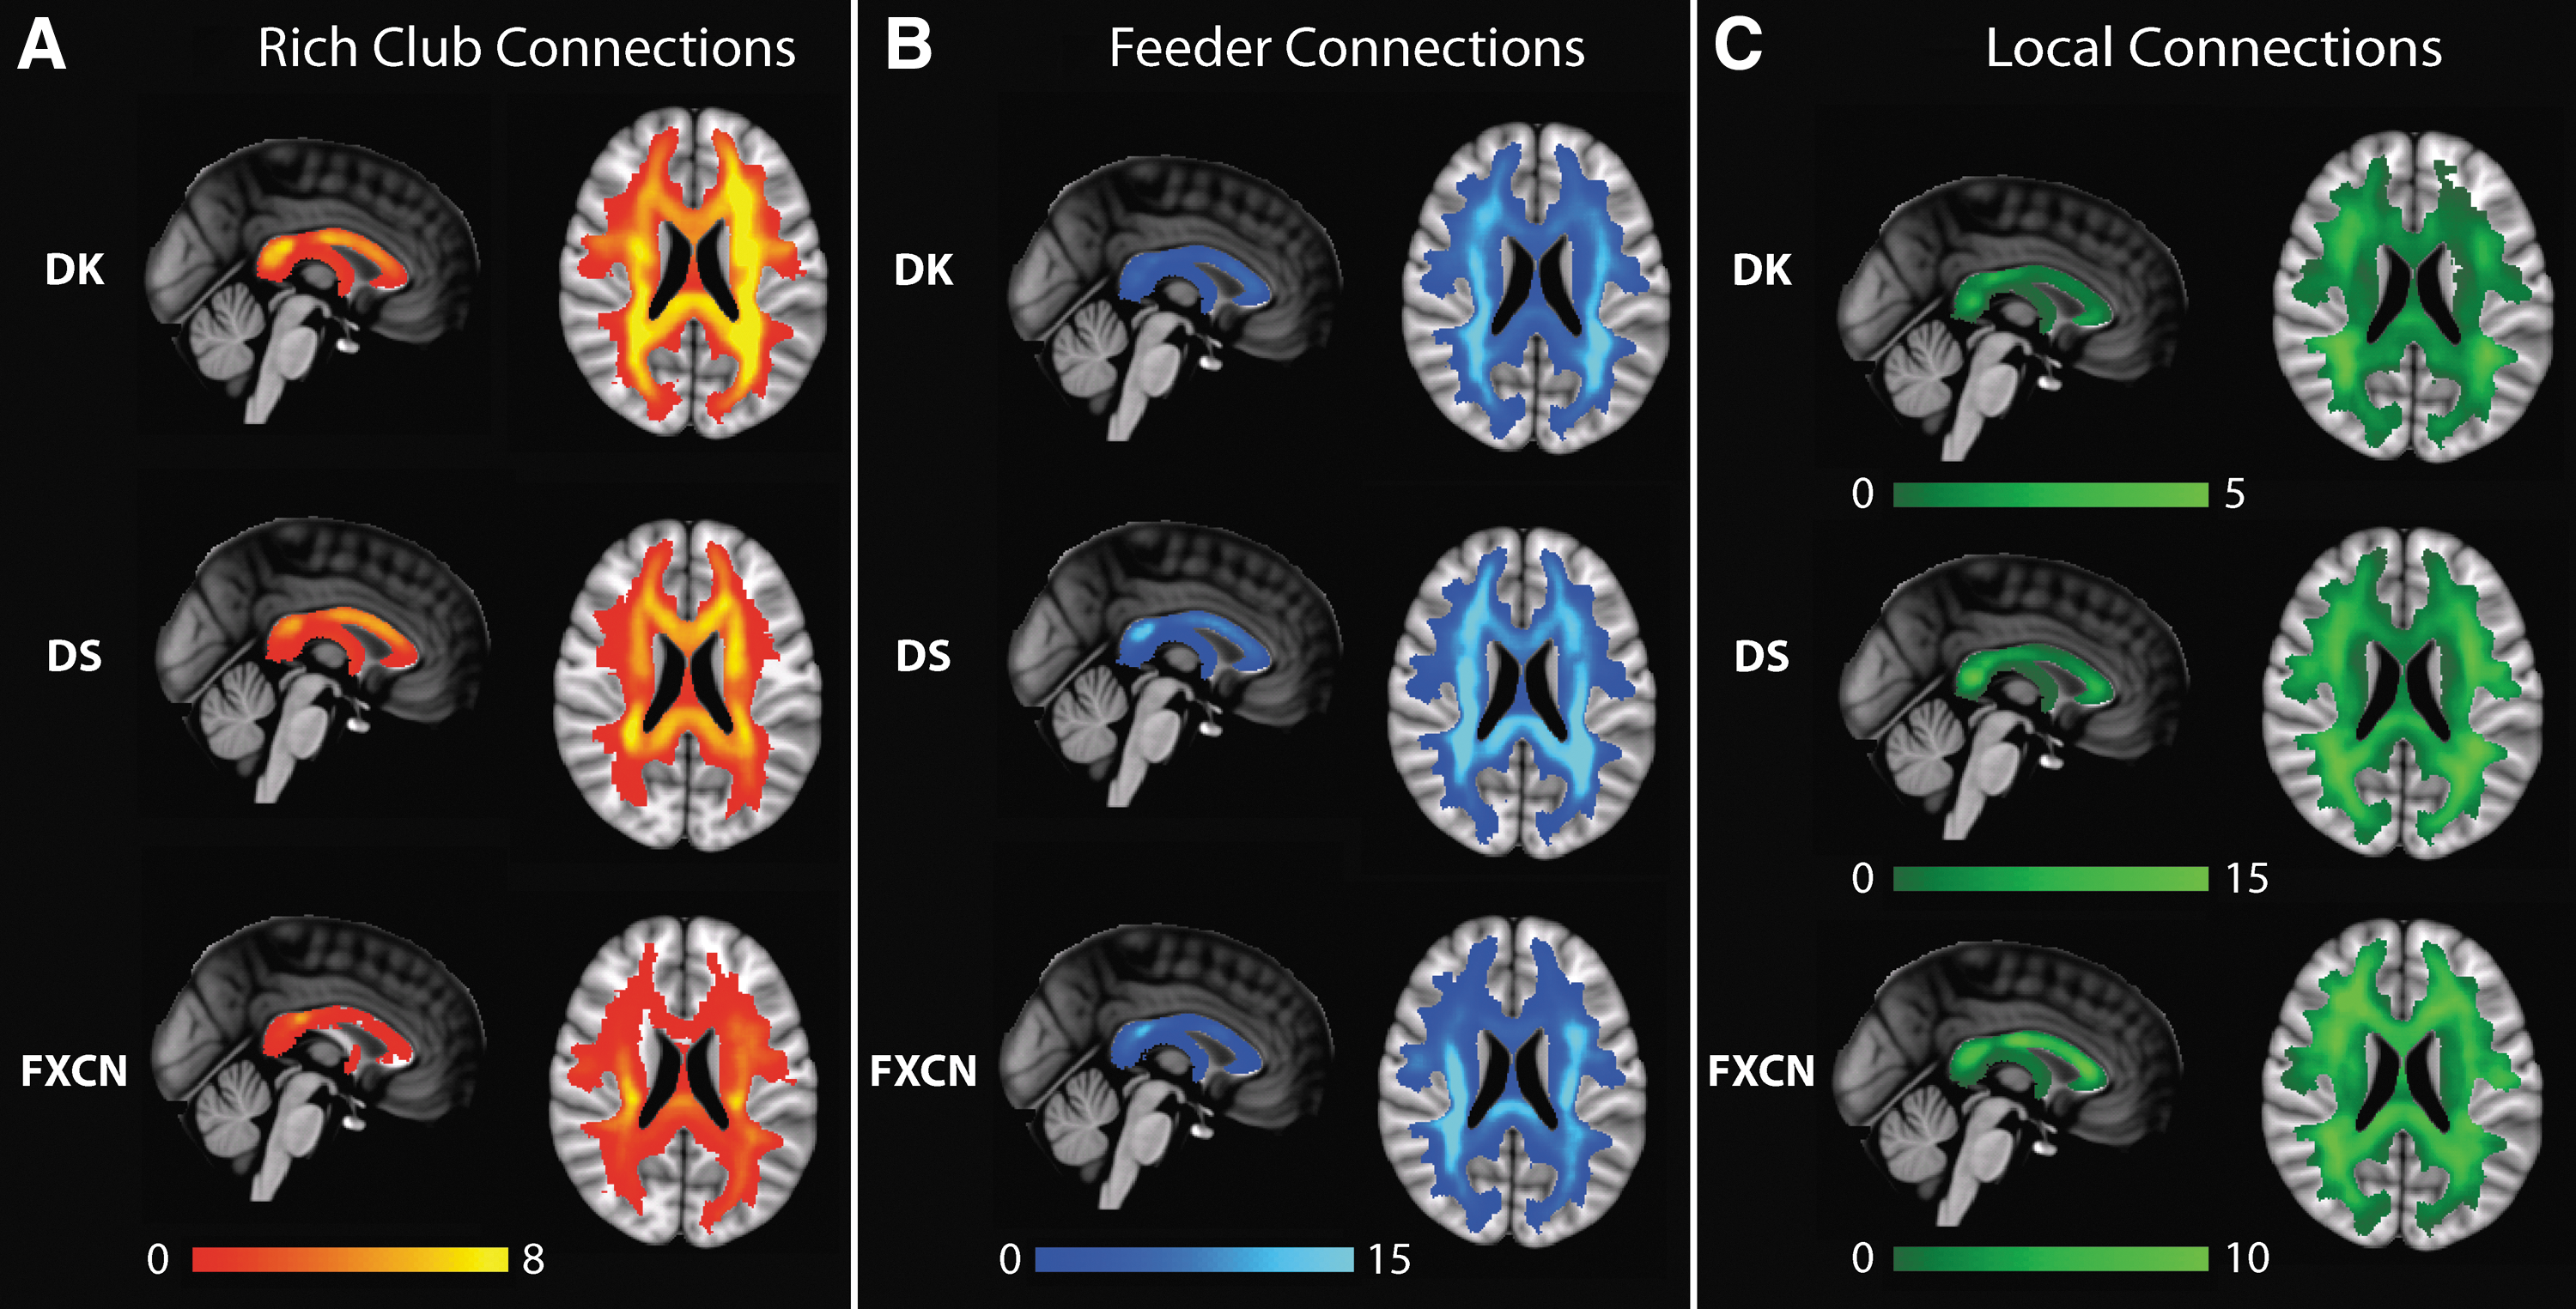
Mean EDI maps in MNI space for rich club, feeder, and local connections across gray matter parcellations. All maps are shown in radiological convention, left side of the brain on the right side of the image.
The FC demonstrate a clear posterior bias across all three parcellations, most notably in the corpus callosum and periventricular white matter. There is better quantitative correspondence between the ED images based on the FC for all parcellations (ρ > 0.67) compared to the rich club and LC. The LC for the DK and DS parcellations are biased toward lateral white matter as reported in Owen et al. (2015) and have good quantitative overlap (ρ = 0.66). For the FXCN parcellation, the LC are evenly distributed throughout the white matter with some minimal bias toward lateral regions and, like the RC, the embedding of the LC is not as similar for the FXCN parcellation compared to the two FreeSurfer parcellations (ρ < 0.58).
The locations of the highest k-core nodes (k = 8) for the FXCN connectome are shown in Figure 6. These k = 8 nodes are located primarily in the posterior cingulate cortex, superior parietal cortex, temporal cortex, and the inferior frontal gyrus. There are more high k-core nodes in the left temporal and inferior frontal gyrus than on the right, while the distribution in cingulate and parietal cortex is more bilaterally symmetric. The location of the highest k-core nodes reported in this study are similar to those reported in Hagmann et al. (2010), who found the high k-core nodes to be clustered in superior parietal and posterior cingulate cortex, as well as in occipital cortex and temporal cortex with a leftward bias, as also indicated in our data. The high k-core nodes have spatial overlap with the rich club nodes for the FXCN atlas shown in Figure 4.
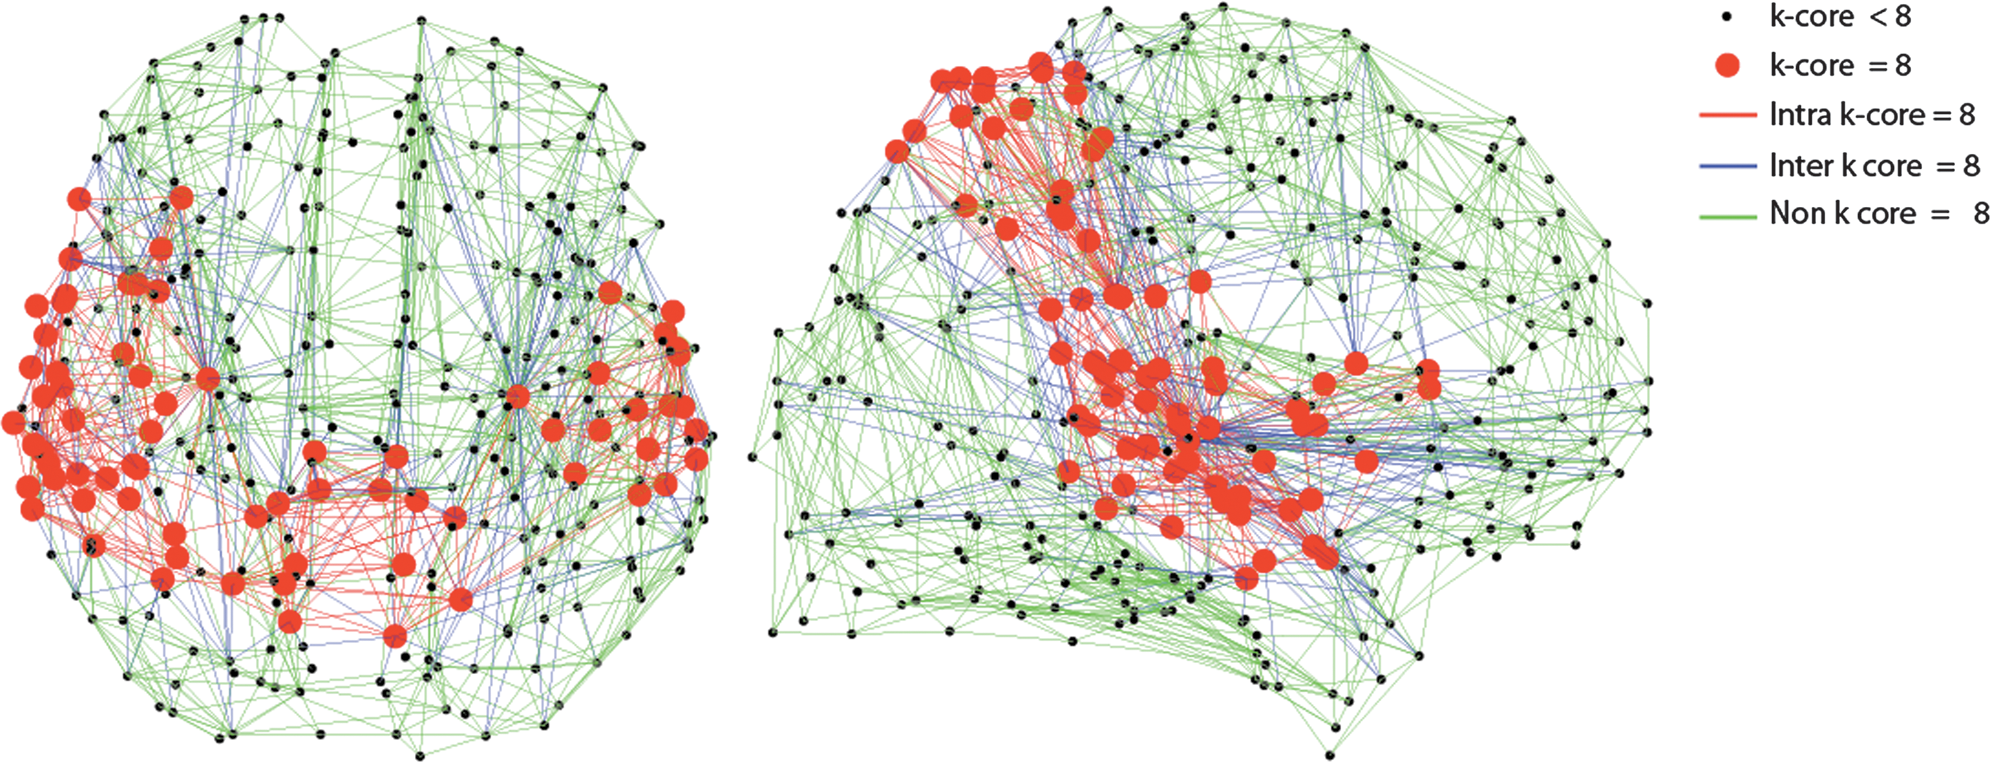
K-core organization diagrams (in axial and sagittal orientation) for the functional connectivity (FXCN) parcellation. The k = 8 nodes are shown with red circles and the edges of the consensus connectome are designated as intra k-core = 8 edges (red), inter k-core = 8 (blue), and non k-core = 8 (green). These diagrams are shown in neurological convention, right side of the brain on the right side of the image.
In Figure 7, the embedding of the highest k-core (k = 8) edges are shown. Most notable is the posterior bias of the intra k-core (k = 8) edges in the splenium of the corpus callosum and the posterior periventricular white matter as seen in the top row of Figure 7.
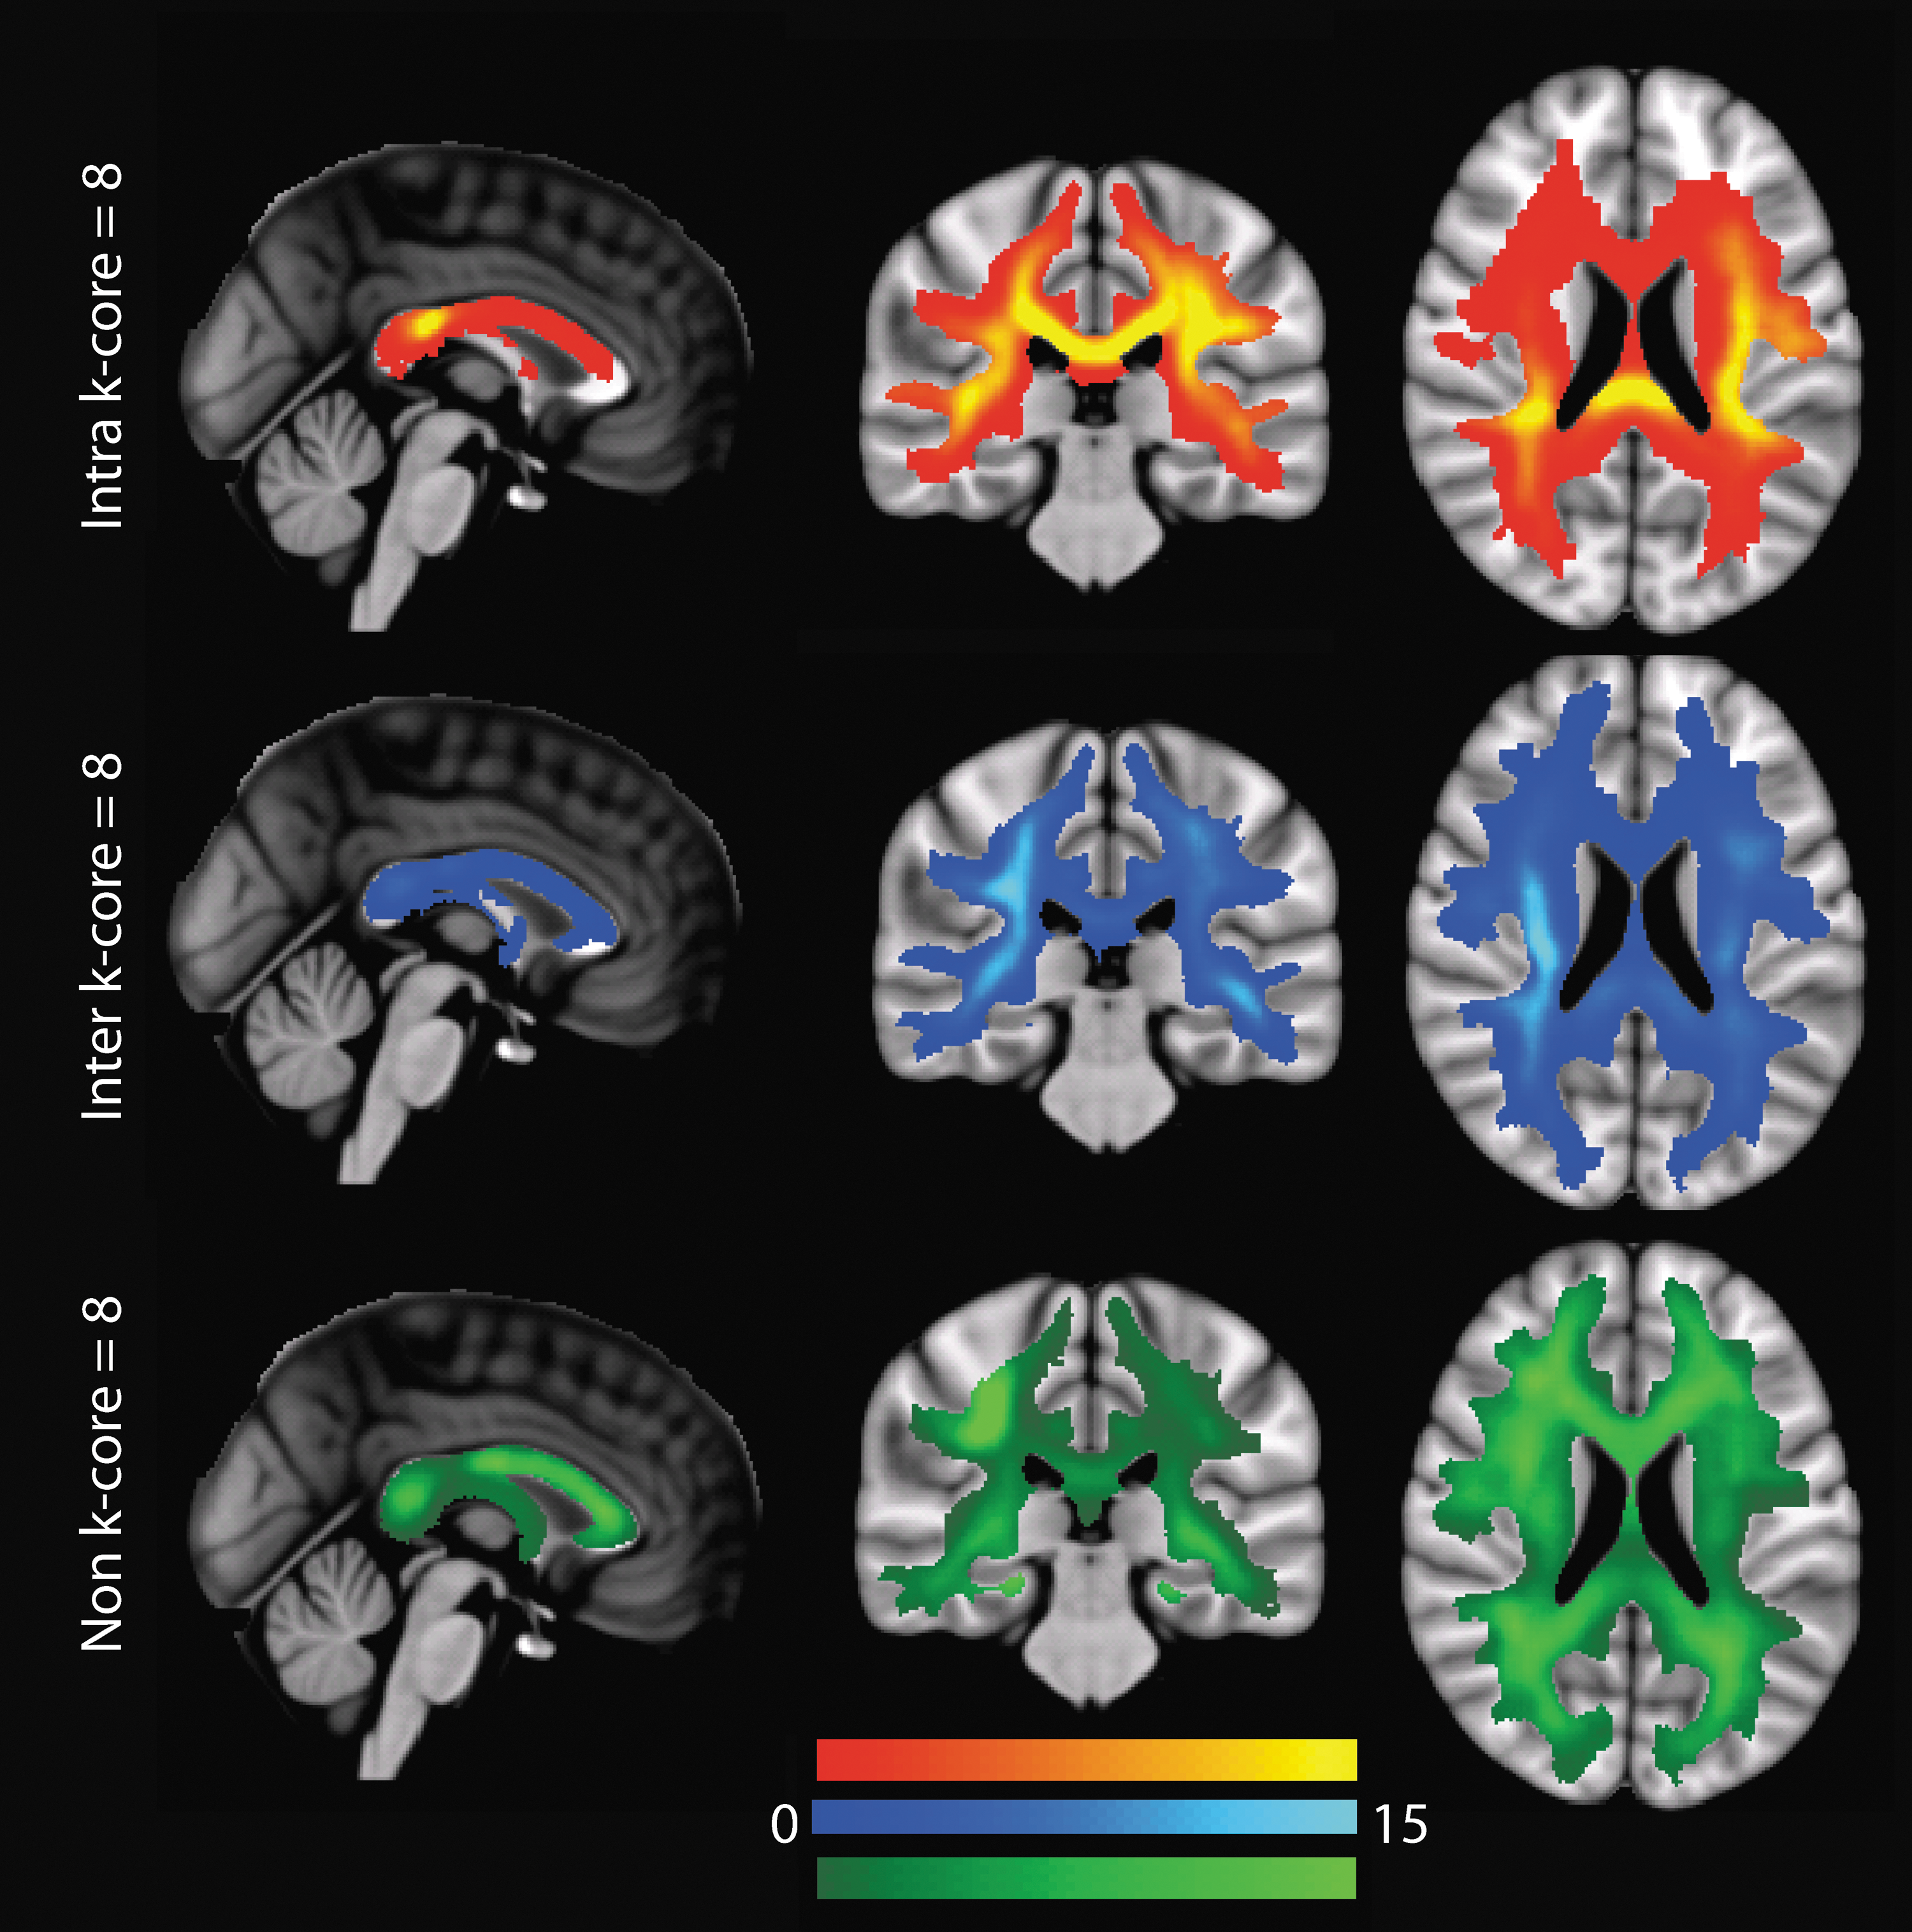
Mean EDI maps in MNI space for the intra k-core = 8 edges, inter k-core = 8 edges, and non k-core = 8 edges. All maps are shown in radiological convention, left side of the brain on the right side of the image.
Figure 8 illustrates the mean importance maps based on the loss in mean communicability in the MNI space, calculated from the DK parcellation, with a 3 mm radius for the lesion size (all lesion sizes yielded similar EDI results). We find several significant trends, such as a leftward bias in importance and higher importance weighting in deep white matter tracts. In general, we find that the corpus callosum is de-emphasized. This is possibly due to the ability of communicability to account for paths outside the shortest length connection. Consider the case of two nodes on opposite hemispheres where the shortest length path between the two nodes is weakened by a lesion. Since each lesion is small compared to the total area of the corpus callosum, there are still many connections between the two hemispheres that are unperturbed. Furthermore, due to the comparatively higher number of intrahemispherical edges compared to interhemispherical edges, reaching these undamaged connections can be often done in a single additional step, allowing the two nodes to easily communicate with each other across undamaged pathways.
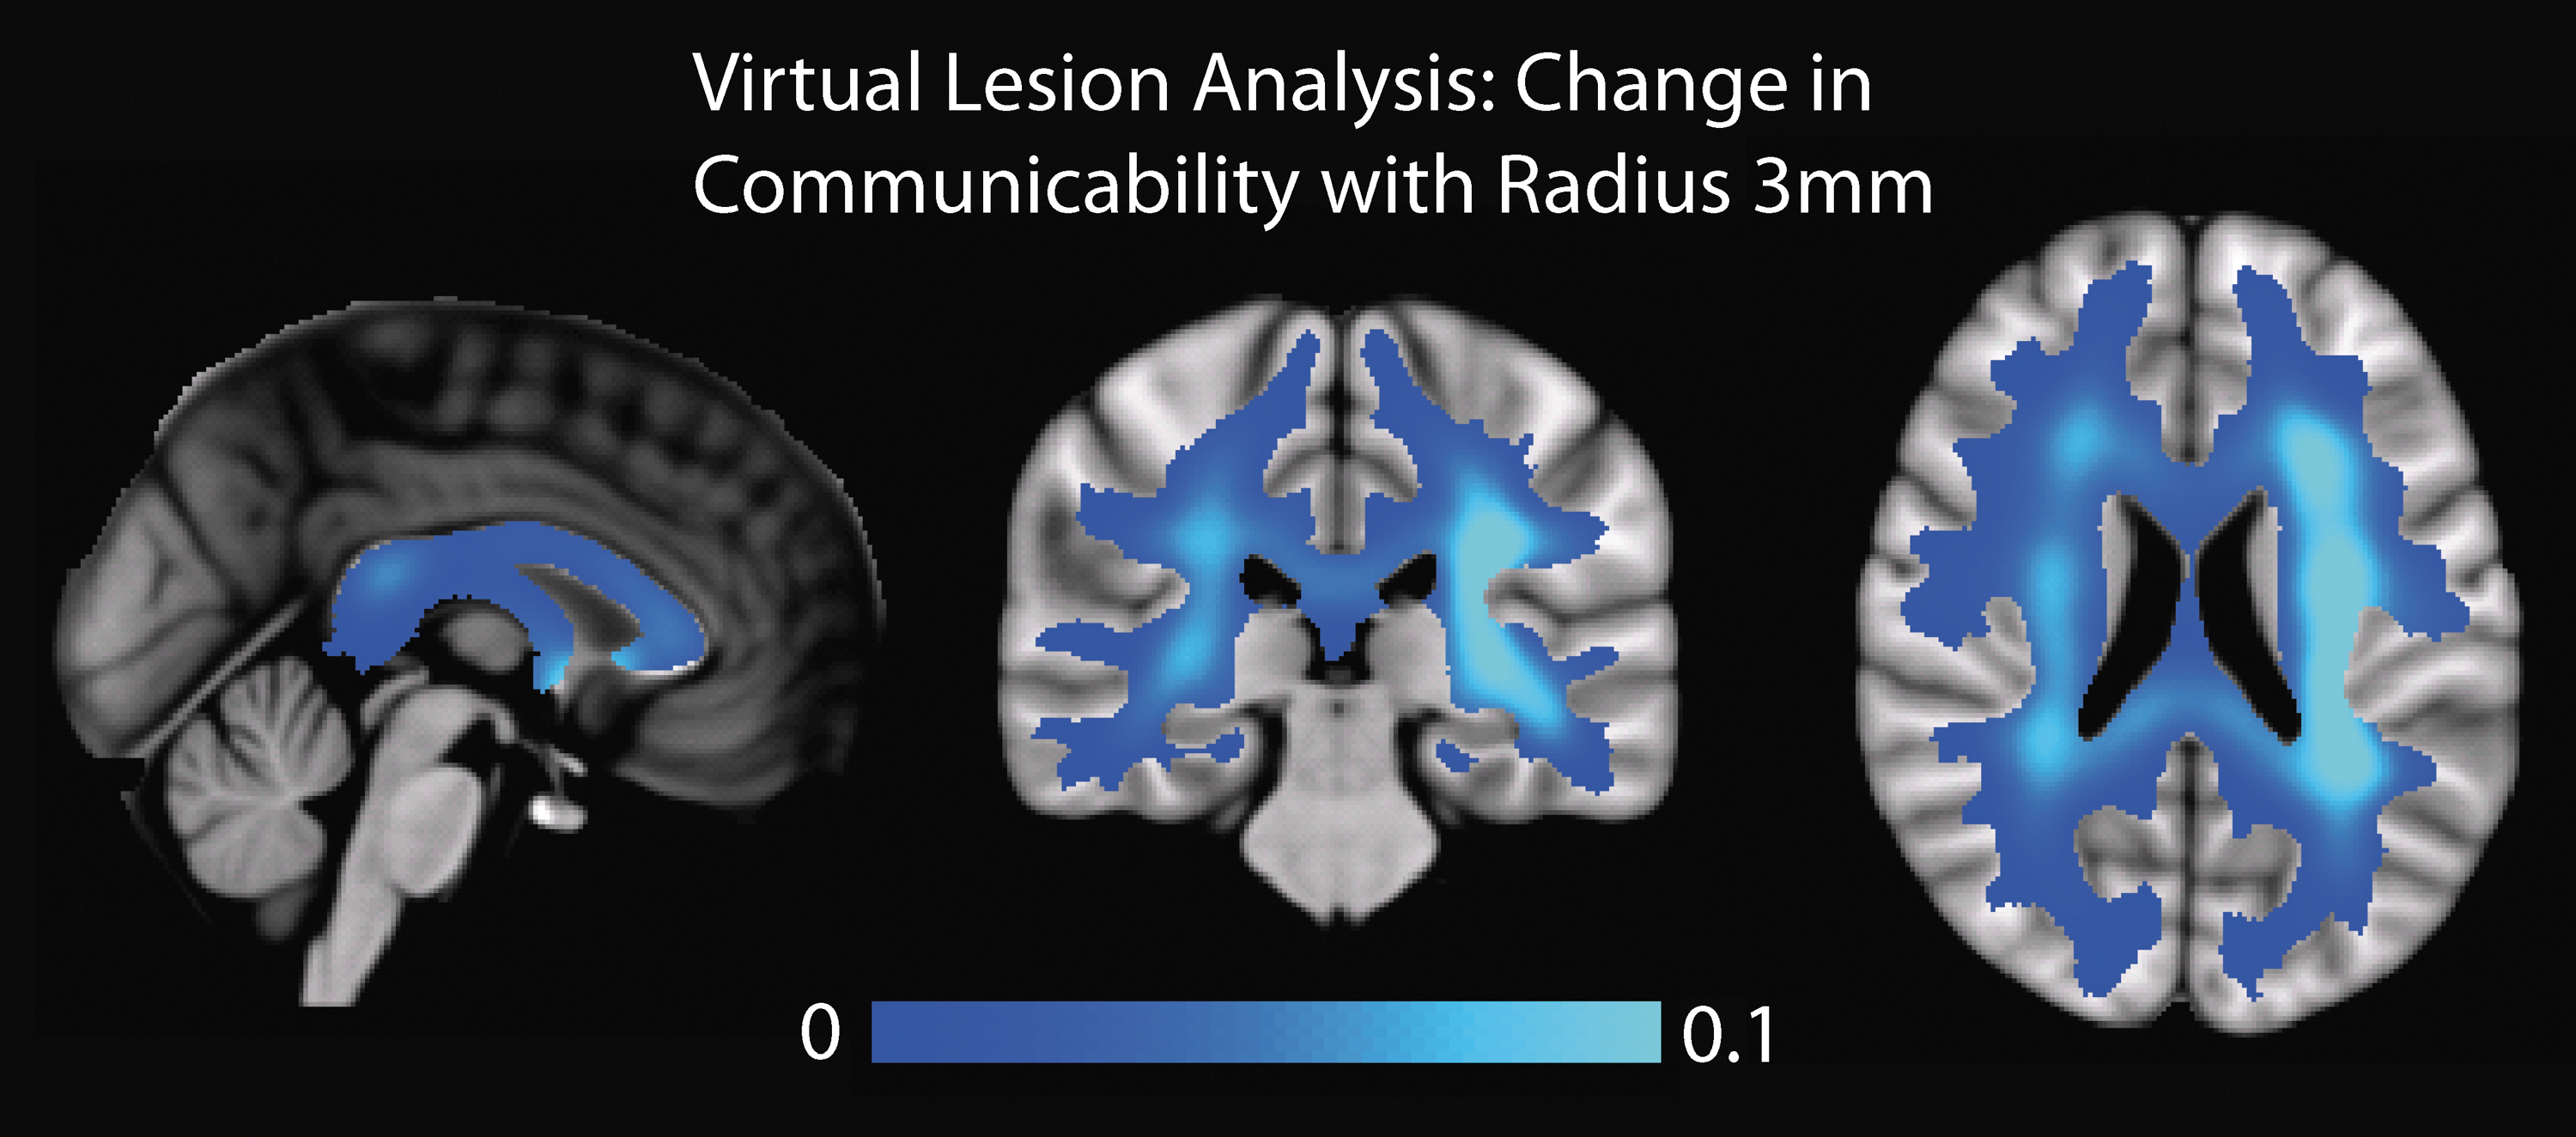
Results from the virtual lesion analysis (radius = 3 mm). The voxel values represent a change in mean communicability after a lesion was applied at the center of that voxel. All maps are shown in radiological convention, left side of the brain on the right side of the image.
Discussion
In this article, we have demonstrated that the EDI method is robust to reconstruction methods, including data acquisition and tractography methods, as assessed by comparison to the IIT atlas, and to the cortical parcellation used to define the nodes of the connectome. In comparison to the EDI maps produced using all possible connectome edges in Owen et al. (2015), these new EDI maps computed with only the edges of the consensus connectome prune weaker and potentially spurious streamlines and edges from the EDI images, yielding lower overall edge counts and a de-emphasis of the corpus callosum. Even with these changes to the EDI reconstruction, the key features of the EDI maps discussed in Owen et al. (2015), such as the preponderance of connectome edges in the posterior periventricular white matter and the splenium of the corpus callosum are still readily observed. We have compared the embedding of rich club, feeder, and LC across parcellations, observing good correspondence between the two FreeSurfer gray matter parcellations (DK and DS), while the FXCN parcellation diverges in the location of the rich club and LC. This divergence is likely due to the rich club nodes for the FXCN parcellation being more biased to posterior and temporal regions than the DK and DS parcellations.
We have identified the periventricular white matter, especially posteriorly, as the major salient feature of the ED images. Major periventricular fiber systems have been described, including their crossroads, immunocytochemical properties, and developmental transformation in the cerebrum of the preterm infant (Judas et al., 2005). These periventricular regions of white matter are uniquely vulnerable to injury in premature birth, commonly described as “periventricular leukomalacia” on MRI, and result in motor, sensory, and cognitive deficits (Govaert and De Vries, 1997; Hoon et al., 2002; Volpe, 2001). Periventricular white matter is known to contain a complex grid of projection (afferent and efferent), commissural (callosal), and major associative corticocortical fibers (Meyer et al., 1999; Yakovlev and Lecours, 1967). In older adults, MRI signal abnormalities in periventricular white matter are associated with vascular dementia (Almkvist et al., 1992). In development, the posterior white matter myelinates before anterior (prefrontal) white matter and comparative anatomy studies of humans and other primates reveal that posterior cerebral regions are evolutionarily older than prefrontal regions (Schoenemann et al., 2005). Hence, our results in the posterior periventricular white matter agree with current knowledge about the importance and vulnerability of this particular region of the human brain.
A universal scaling law between white and gray matter volume has been shown to be supralinear across mammalian species, specifically, a power law with an exponent of 4/3 (Zhang and Sejnowski, 2000). Therefore, in the comparatively very large human brain, neocortical gray matter and the adjacent white matter account for ∼80% of the total brain volume. The organization of the brain, including the arrangement of the gray matter on the periphery and the white matter internal to gray matter, can be explained by the minimization of wiring distance (Raj and Chen, 2011). Perhaps this geometric perspective on the spatial organization of the brain can also explain why deep white matter, including the periventricular white matter, is disproportionately utilized for network connectivity. Deep white matter, compared with superficial cortical U-fibers, has larger and more myelinated axons, as well as denser axonal packing within fiber bundles, allowing for faster and higher volume information transmission along these deep fibers.
The increased importance of the white matter connections in the left hemisphere is another feature of the ED images that we observed. We found more nodes in the left hemisphere that were in the highest k-core (k = 8), particularly the left temporal and inferior frontal regions, areas known to be involved in speech and language processing. There were also more edges connecting the nodes of the highest k-core in the left-sided white matter, which directly follows from the leftward bias of these nodes. The virtual lesion analysis revealed that reducing the weights of the edges in the left hemisphere has a more deleterious effect on average communicability of the entire network. The left hemisphere is associated with language functions central to human communication in the majority of individuals, and therefore, our asymmetric EDI findings could be indicative of the importance of the left hemisphere's connections to human cognition.
A fundamental limitation of this study is that it is limited to the macroscopic connectome, that is, connectivity between large-scale regions. We have made an effort to explore different scales by incorporating parcellations spanning a fourfold range. However, current diffusion MRI technology and tractography methods may overemphasize longer range connectivity and underemphasize short-range connectivity such as cortical U-fibers (Reveley et al., 2015). Even within deep white matter, our results show that the distribution of connectome edges remains highly uneven. As diffusion MRI acquisition and tractography methodology continue to improve and provide a fuller picture of the macroconnectome, the power of EDI to distinguish the regional variation of network connectivity across white matter tracts should also progress. Another related limitation is the relative low angular resolution of the Siemens data (30 diffusion directions). However, we have found that the high angular resolution data from the IIT Atlas and our previous findings presented in Owen et al. (2015) with 55 diffusion directions have yielded similar maps to our lower angular resolution data, indicating that the distribution of edges is largely invariant to acquisition parameters. In this article, we do not explore the similarity of EDI to related methods, such as track density imaging (TDI), which rely on streamline or fiber densities (Calamante et al., 2010). We have previously shown that EDI and TDI are distinct methods both in theory and practice (Owen et al., 2015).
Future directions of this work include applying EDI to clinical populations to uncover clinically relevant insights into white matter degeneration or injury. Our test–retest reliability results indicate that EDI might not be a method used to detect group differences in a voxel-wise or tract-wise manner as FA is used. Rather, EDI could be used to identify white matter biomarkers (in the form of lesions to high ED regions) that could then be investigated with respect to cognitive and behavioral performance in clinical populations.
Conclusion
We present evidence from EDI, a new analytic framework that examines the spatial embedding of the structural connectome within white matter, that periventricular regions form a nexus for the network connectivity of the human brain. The high density of network edges observed in periventricular white matter was conserved across different types and scales of gray matter parcellations, as well as different diffusion MRI acquisition schemes and fiber tracking techniques. The idea of a periventricular nexus fits with known neurobiology of brain development and may result from simple geometrical considerations in minimizing wiring cost in structural brain connectivity. These results validate EDI as a useful tool for studying the organization of the human connectome and advance its potential as a biomarker for neurological and psychiatric disorders thought to result from network dysconnectivity.
Footnotes
Acknowledgments
This work was supported by a grant from the Simons Foundation (SFARI A118077). M.B.W. was supported through funding from the Amgen Foundation through the Amgen Scholars Program at UCSF.
Author Disclosure Statement
No competing financial interests exist.