
Abstract
Recently, cerebral structural covariance networks (SCNs) have been shown to partially overlap with functional networks. However, although for some of these SCNs a strong association with age is reported, less is known about the association of individual SCNs with separate cognition domains and the potential mediation effect in this of cerebral small vessel disease (SVD). In 219 participants (aged 75–96 years) with mild cognitive deficits, 8 SCNs were defined based on structural covariance of gray matter intensity with independent component analysis on 3DT1-weighted magnetic resonance imaging (MRI). Features of SVD included volume of white matter hyperintensities (WMH), lacunar infarcts, and microbleeds. Associations with SCNs were examined with multiple linear regression analyses, adjusted for age and/or gender. In addition to higher age, which was associated with decreased expression of subcortical, premotor, temporal, and occipital–precuneus networks, the presence of SVD and especially higher WMH volume was associated with a decreased expression in the occipital, cerebellar, subcortical, and anterior cingulate network. The temporal network was associated with memory (p = 0.005), whereas the cerebellar–occipital and occipital–precuneus networks were associated with psychomotor speed (p = 0.002 and p < 0.001). Our data show that a decreased expression of specific networks, including the temporal and occipital lobe and cerebellum, was related to decreased cognitive functioning, independently of age and SVD. This indicates the potential of SCNs in substantiating cognitive functioning in older persons.
Introduction
I
The expression of some SCNs is strongly associated with age, whereas the expression of other SCNs seems unaffected by age (Bergfield et al., 2010; Hafkemeijer et al., 2014; Li et al., 2013; Montembeault et al., 2012; Segall et al., 2012). With increasing age, features of cerebral small vessel disease (SVD), common magnetic resonance imaging (MRI) findings, are more frequently observed (Wardlaw et al., 2013). These SVD features have been associated with gray matter reductions (Lambert et al., 2015; Wen et al., 2006) and play a role in the pathogenesis of brain atrophy and therefore a decrease in cognitive abilities (Light, 1991; Raz, et al., 1998). The association between aging and SCNs (Bergfield et al., 2010; Hafkemeijer et al., 2014; Li et al., 2013; Montembeault et al., 2012; Segall et al., 2012) and the relationship between the covariation of gray matter volume and cognitive decline in healthy aging (Oh et al., 2011; Tijms et al., 2016) and in persons with different stages of dementia are well described (Hafkemeijer et al., 2016; Spreng and Turner, 2013; Yao et al., 2010). However, the mediating effects of other common features that come along with aging, such as an increased level of manifest vascular changes on the association between SCNs and cognition, are unknown.
The working hypothesis of the present study is that in older persons, the presence of manifest SVD has an independent effect on SCN expression. Since both atrophy and SVD are related to worse cognitive functioning, we expect that in a population of older persons with mild cognitive deficits, the association between SCN expression and cognitive domains (memory function, executive function, and psychomotor speed) is influenced by both age and the presence of manifest SVD.
Methods
Participants
Data for this study were obtained from the MRI substudy of the Discontinuation of Antihypertensive Treatment in the Elderly (DANTE) trial; a randomized trial evaluating the effect of discontinuation of antihypertensive therapy in older persons with mild cognitive deficits on neuropsychological functioning (Moonen et al., 2015). A detailed description of the design of the DANTE Study Leiden is described elsewhere (Foster-Dingley et al., 2015b; Moonen et al., 2015).
In short, participants were included when they were aged 75 years and older, using antihypertensive medication, and with a Mini–Mental State Examination (MMSE) score of 21–27. In total, 220 of the DANTE participants underwent MRI scans. One participant was excluded due to movement artifacts, leaving a total of 219 participants for the current study.
The Medical Ethics committee of the Leiden University Medical Center approved the DANTE Study Leiden and all participants provided written informed consent.
Brain imaging
Whole-brain, 3DT1-weighted (repetition time [TR]/echo time [TE] = 9.7/4.6, flip angle [FA] = 8°, voxel size = 1.17 × 1.17 × 1.40 mm) images were acquired on a 3T MRI scanner (Philips Medical Systems, Best, the Netherlands). With increasing age, concomitant signs of beginning or more overt forms of SVD are frequently observed on brain MRI (Wardlaw et al., 2013). These signs include cerebral white matter hyperintensities (WMH) (Debette and Markus, 2010), lacunar infarcts (Vermeer et al., 2007), and cerebral microbleeds (Cordonnier et al., 2007). For the evaluation of SVD-related pathologies, fluid attenuated inversion recovery (FLAIR) images (TR/TE = 11 000/125 msec, FA = 90°, field of view [FOV] = 220 × 176 × 137 mm, matrix size = 320 × 240, 25 transverse slices, 5 mm thick), T2*-weighted images (TR/TE = 45/31 msec, FA = 13°, FOV = 250 × 175 × 112 mm), and T2-weighted images (TR/TE = 4200/80 msec, FA = 90°) were acquired.
Cerebral SVD
To assess the presence of SVD, the volume of WMH was quantified, and the presence of lacunar infarcts and cerebral microbleeds was assessed. Oxford Centre for Functional MRI of the Brain (FMRIB) Software Version 5.0.1. Library (FSL;
Lacunar infarcts, assessed on FLAIR and T2- and 3DT1-weighted images, were defined as parenchymal defects (signal intensity identical to cerebrospinal fluid on all sequences) of at least 3 mm in diameter, surrounded by a zone of parenchyma with increased signal intensity on T2-weighted and FLAIR images. Cerebral microbleeds were defined as focal areas of signal void (on T2 images), which increased in size on T2*-weighted images (blooming effect) (Greenberg et al., 2009). Symmetric hypointensities in the basal ganglia, likely to represent calcifications or nonhemorrhagic iron deposits, were disregarded. Lacunar infracts and cerebral microbleeds were scored by a single rater (J.C.F.-D.) who was blinded to clinical data, and who was supervised by a second rater (J.V.D.G.), having more than 15 years of neuroradiological experience.
Structural covariance networks
SCNs were assessed with FSL (
The modulated and smoothed individual gray matter images in MNI152 space were used as four-dimensional data set on which ICA was performed (Beckmann et al., 2005). ICA was applied using the multivariate exploratory linear optimized decomposition into independent components tool (Beckmann et al., 2005); this statistical technique decomposes a set of signals into spatial component maps of maximal statistical independence (Beckmann and Smith, 2004). When applied on gray matter images of different participants, this method defines spatial components based on the intercorrelation or structural covariance of gray matter density among participants (i.e., SCNs) (Hafkemeijer et al., 2014), without a priori selected regions of interest.
SCNs and functional resting state networks are generally studied using 8–10 components (Beckmann et al., 2005; Damoiseaux et al., 2006; Li et al., 2013; Segall et al., 2012). Therefore, we restricted the ICA output to eight components.
Individual SCN expression was calculated using the four-dimensional data set of gray matter images in a spatial regression against the eight SCN probability maps (general linear model approach integrated in FSL) (Filippini et al., 2009). This procedure provides for the 219 participants an index reflecting the degree to which each participant expresses the identified network pattern (i.e., SCN expression, the beta weights of the regression analysis). A higher score indicates a stronger expression of the identified SCN. With the use of a mixture model, significance was assigned to different voxels within the spatial map, and a standard threshold level of 0.5 was used (Beckmann and Smith, 2004). Within each SCN, the topographical structures and MNI coordinates of these were defined with the FSL cluster and using the Harvard-Oxford cortical and subcortical structural atlas integrated in FSL.
Cognitive functioning
Trained research staff administered a battery of six cognitive tests. In detail, global cognitive functioning was assessed with the MMSE (Folstein et al., 1975). To measure memory function, the immediate (three trials) and delayed recall on the 15-Word Verbal Learning Test (15-WVLT) and the Visual Association Test (VAT) were used (Lezak et al., 2004). Executive function was assessed with the interference score of the abbreviated Stroop Color Word Test (Houx et al., 1993) and the difference between the time to complete the Trail Making Test part A and B (TMT delta) (Arbuthnott and Frank, 2000). Psychomotor speed was evaluated with the Letter-Digit Substitution Test (LDST) (Van der Elst et al., 2006). For analysis, first the individual test scores (of the Stroop interference score and the TMT delta score) were inversed; consequently, higher scores indicate better performance on all tests. The psychomotor speed score and compound cognitive scores for memory and executive function were computed by converting the crude scores of each test to standardized z scores ([test score – mean]/standard deviation [SD]) and calculating the mean z score across the tests in each compound.
Demographic and clinical characteristics
Demographic and clinical characteristics were obtained by research staff using a standardized interview. Information about medication and medical history was obtained from the general practitioners of the participants with the aid of structured questionnaires.
Statistical analyses
Characteristics of participants are presented as mean (SD), median (interquartile range [IQR]), or as number (percentage) where appropriate. WMH volume was log transformed to ensure normal distribution.
All variables, including age, WMH volume, lacunar infarcts, cerebral microbleeds, and the eight SCNs, were standardized. Standardization of variables allowed effect sizes to be comparable throughout. Using a multivariate linear regression model, we assessed whether age and the presence of SVD, including WMH volume, the presence of lacunar infarcts, and cerebral microbleeds (independent variables), were associated with expression of SCNs (dependent variable). The analyses for the association between age and expression of SCNs were adjusted for gender. It has been suggested that the relationship between gray matter networks and age might be nonlinear (Fjell et al., 2013; Sowell et al., 2003; Tijms et al., 2016). Therefore, we assessed whether the associations found between age and SNCs were nonlinear by separately adding quadratic and log terms of age to the model. For the analyses of the association between WMH volume, the presence of lacunar infarcts, cerebral microbleeds, and expression of SCN, we adjusted for age and gender.
The associations between expression of SCNs and cognitive functioning were also analyzed using multivariate linear regression analyses. In these analyses, expressions of SCNs were the independent variables and standardized cognition scores (memory and executive function, and psychomotor speed) the dependent variables. We adjusted for age, gender, and SVD (including WMH volume, the presence of lacunar infarcts, and cerebral microbleeds). As the MMSE is a global and readily available cognitive assessment tool, we additionally assessed the association between expression of SCNs and MMSE.
To correct for multiple testing, the statistical threshold was set at (0.05/8; based on eight networks) p ≤ 0.006.
Results
The characteristics of the study population are shown in Table 1. Included were 219 participants with a mean age of 80.7 years and of whom 42.9% were male. Participants had mild cognitive deficits as reflected by the median MMSE score of 26 (IQR 25–27) points. Median WMH volume was 22.0 (IQR 9.0–56.1) ml. Lacunar infarcts and cerebral microbleeds were present in 26.9% and 24.7% of the participants, respectively.
Data are presented as mean (standard deviation), median (interquartile range), or as number (percentage) where appropriate. TMT delta denotes difference between TMT-B and TMT-A.
Includes myocardial infarction or coronary intervention procedure ≥3 years ago, or peripheral arterial disease.
Higher scores indicate worse functioning.
Missing for n = 3 participants.
Missing for n = 1 participant.
Missing for n = 6 participants.
15-WVLT, 15-Word Verbal Learning Test; LDST, Letter Digit Substitution Test; MMSE, Mini–Mental State Examination; TMT, Trail Making Test.
Figure 1 shows eight SCNs, these networks included a cerebellar–occipital network (SCN a), lateral occipital network (SCN b), cerebellar network (SCN c), subcortical network (SCN d), a premotor network (SCN e), temporal network (SCN f), occipital–precuneus network (SCN g), and an anterior cingulate network (SCN h). Details of the topographical brain regions within each of the SCNs were identified with the Harvard Oxford atlas (Table 2).
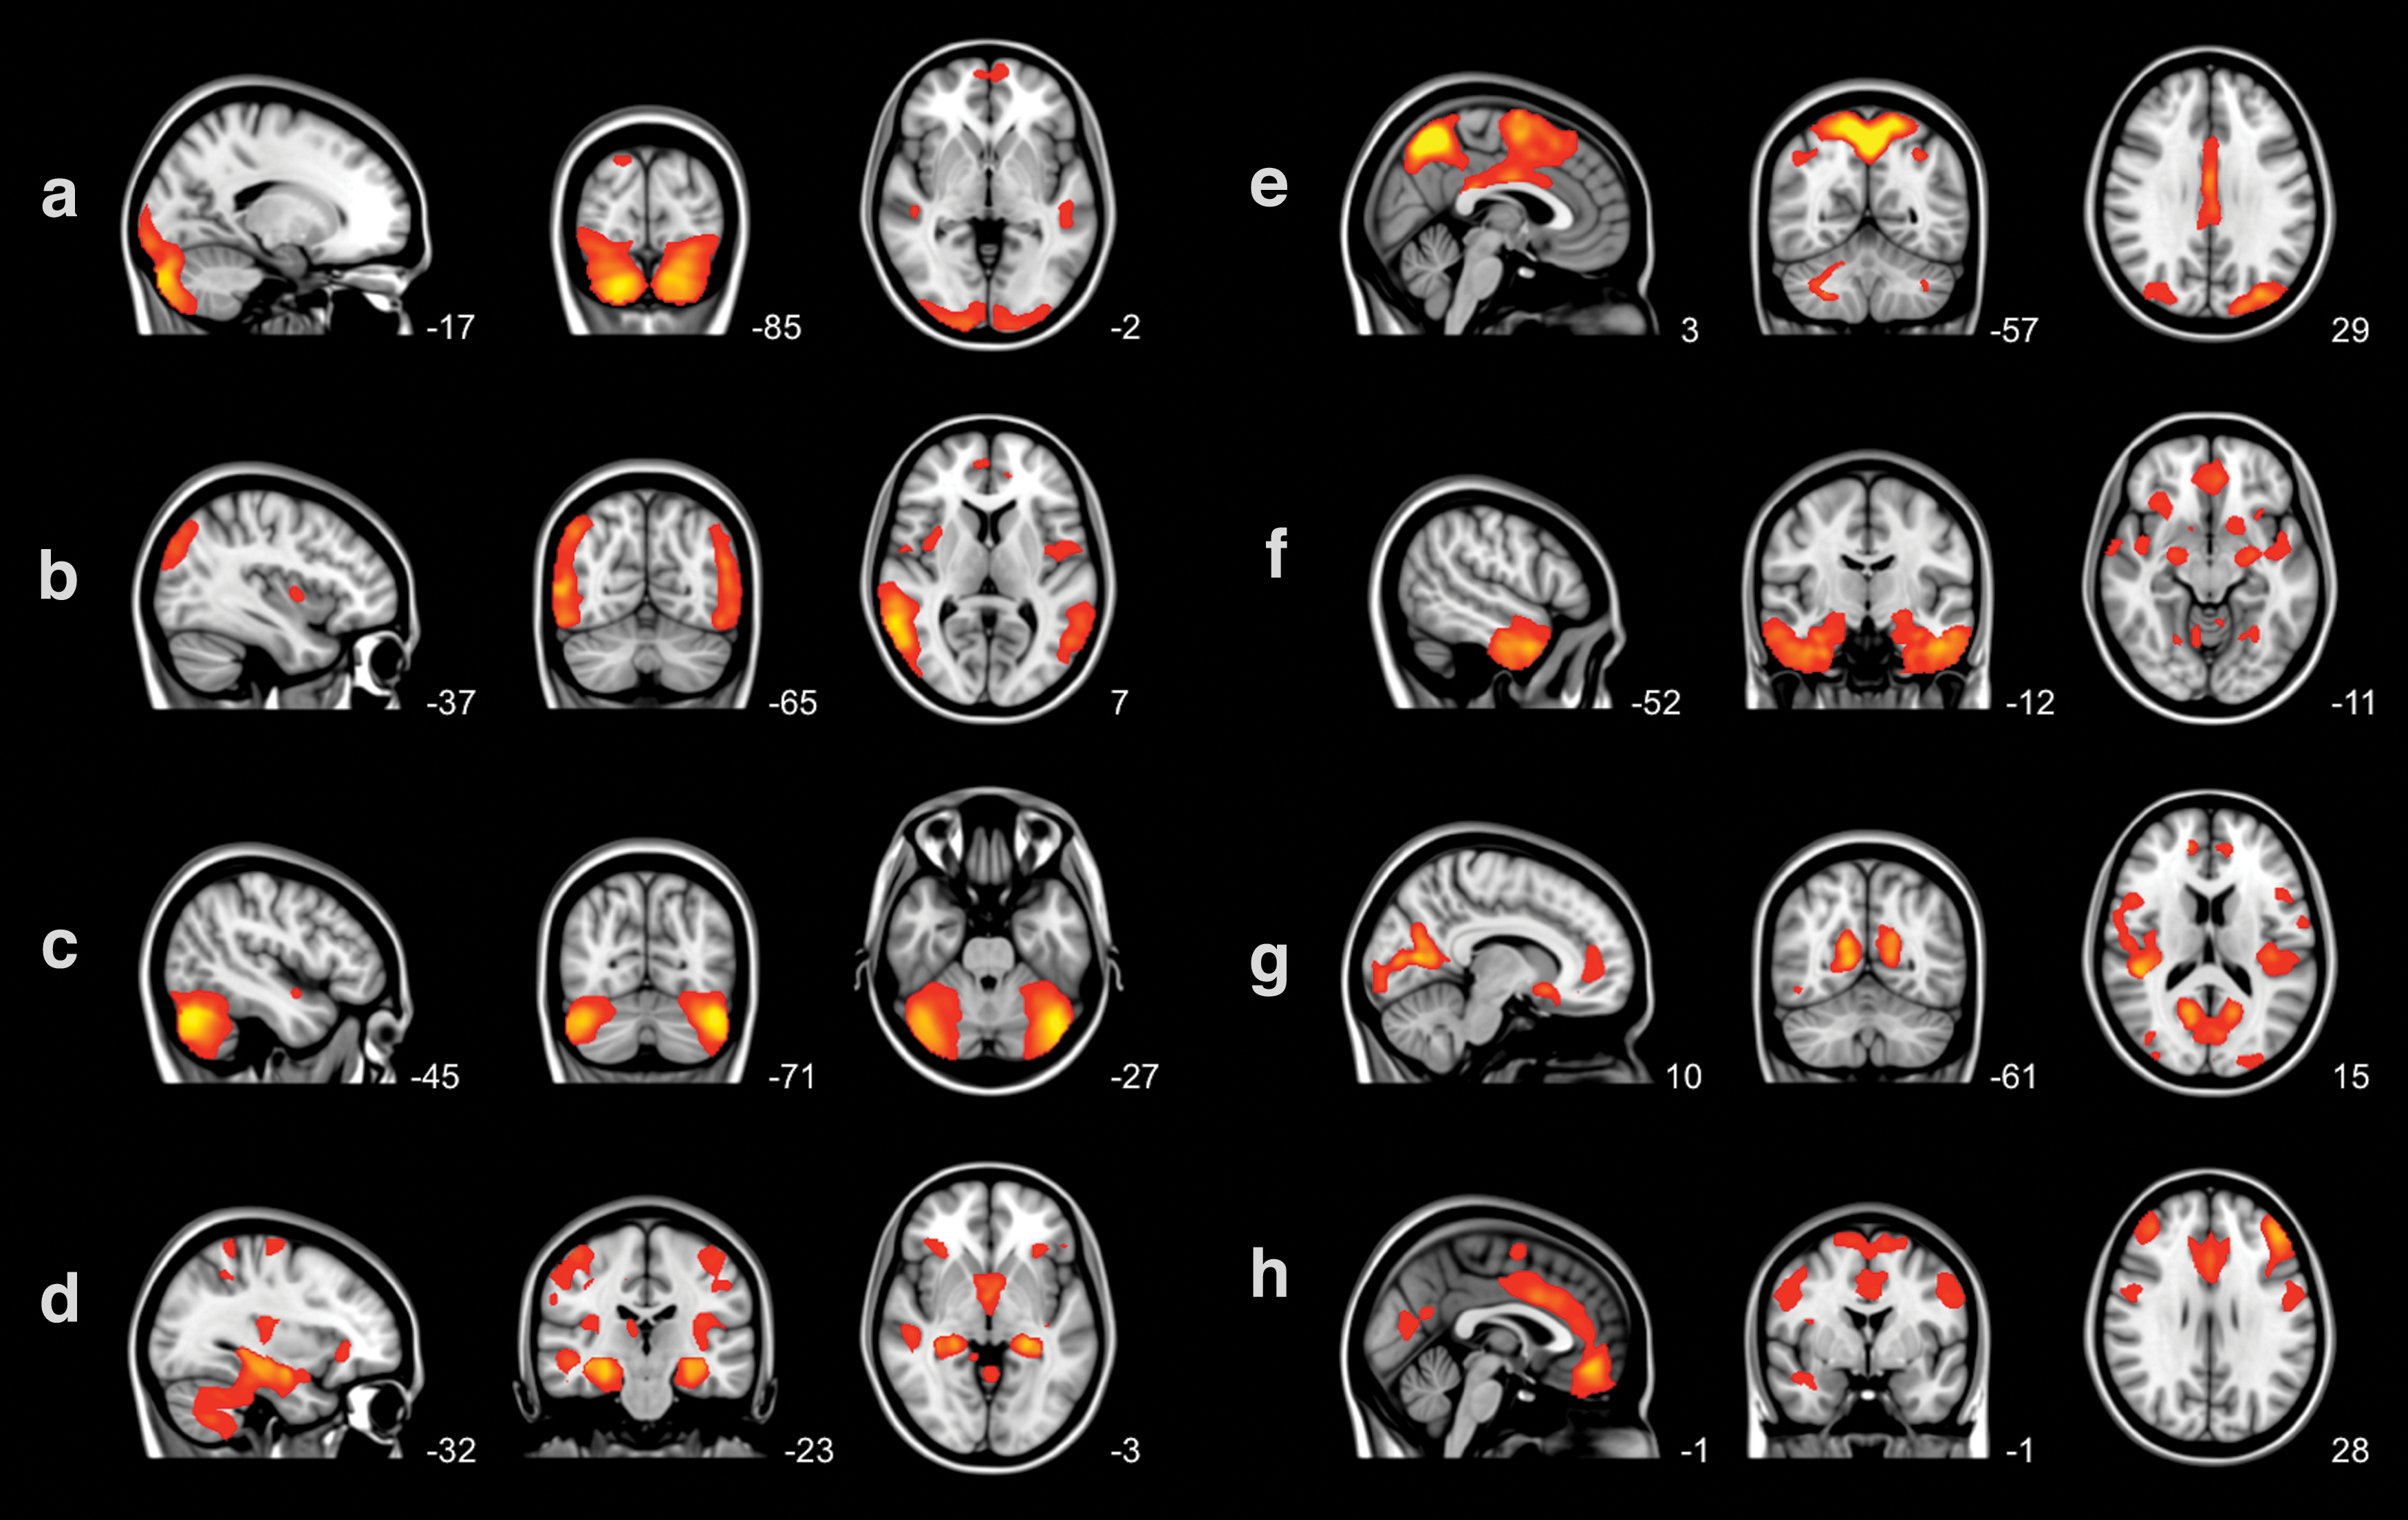
Eight structural covariance networks overlaid on the three most informative orthogonal slices of the Montreal Neurological Institute 152 standard space template image. Networks
Each SCN is divided in brain clusters using the cluster tool integrated in FSL. MNI x-, y-, and z-coordinates of each cluster are given. Brain structures are anatomically identified using the Harvard-Oxford atlas integrated in FSL. Figure 1 shows the most informative sagittal, coronal, and transverse slices. Structures in parentheses in the table are not visible in Figure 1.
FMRIB, Oxford Centre for Functional MRI of the Brain; FSL, FMRIB Software Version 5.0.1. Library; MNI, Montreal Neurological Institute 152 standard space image; SCN, structural covariance network.
Table 3 shows that a higher age was significantly associated with a lower expression of four SCNs: subcortical (SCN d), the premotor (SCN e), temporal (SCN f), and occipital–precuneus (SCN g) networks independent of gender (B = −0.18, p = 0.006; B = −0.25, p < 0.001; B = −0.26, p < 0.001; and B = −0.34, p < 0.001; respectively). To test whether associations were nonlinear, quadratic and log age terms were added. These analyses did not yield any significant results.
B (95% CI) represents mean change in SCN expression per standard deviation increase in WMH volume, lacunar infarcts, or microbleeds.
Analyses were adjusted for gender. Unless depicted otherwise all analyses were adjusted for gender and age.
Indicates statistical significance after correction for multiple testing, p ≤ 0.006.
CI, confidence interval; WMH, white matter hyperintensities.
As shown in Table 3, a higher WMH volume was associated with lower structural connectivity of four of eight networks independent of age and gender, including the lateral occipital (SCN b), cerebellar (SCN c), subcortical (SCN d), and the anterior cingulate network (SCN h), (all p ≤ 0.002). The presence of lacunar infarcts was associated with a lower expression of the subcortical network (B = −0.21, p = 0.001), and cerebral microbleeds with lower expression of the anterior cingulate network (B = −0.20, p = 0.003).
When combining these data, (1) age was predominantly associated with the premotor and temporal networks (SCN e and f; both p < 0.001), (2) age and the presence of SVD were both associated with the subcortical network (SCN d; all p ≤ 0.006), whereas (3) independently of age, WMH volume was predominantly associated with the lateral occipital and the anterior cingulate networks (SCN b and h; B = −0.30, p < 0.001 and B = −0.21, p = 0.002, respectively).
Table 4 shows the association between SCNs and cognitive functioning. After adjusting for the presence of SVD (i.e., WMH volume and the presence of lacunar infarcts and microbleeds), a lower expression of three SCNs was associated with worse memory or psychomotor speed. The temporal network (SCN f) was associated with memory function (B = 0.20, p = 0.005), whereas the cerebellar–occipital network (SCN a) and occipital–precuneus network (SCN g) were associated with psychomotor speed (B = 0.22, p = 0.002 and B = 0.27, p < 0.001, respectively). Furthermore, the additional analyses for the association between the eight SCNs and MMSE score showed no significant associations.
B (95% CI) represents mean change in cognitive z-scores per standard deviation increase in SCN expression. For memory, executive function, psychomotor speed, and overall cognitive function, a lower score indicates worse performance.
All analyses were adjusted for gender, age, white matter hyperintensity volume, the presence of lacunar infarcts, and microbleeds.
Indicates statistical significance after correction for multiple testing, p ≤ 0.006.
Discussion
In this population of older persons with mild cognitive deficits, a higher age and features of SVD are associated with a decrease in expression of several SCNs. Of the SVD features, predominantly a higher WMH volume was associated with a lower expression of four SCNs. A lower expression of SCNs is related to worse cognitive functioning, in particular, cognitive domains (memory function or psychomotor speed) independently of SVD.
ICA identified SCNs that were similar to functionally correlated brain regions described previously (Beckmann et al., 2005; Damoiseaux et al., 2006; Smith et al., 2009). In populations with younger persons who were cognitively healthy, studies show that when dividing the participants into groups according to age, the “older” age group had a lower expression of SCNs (Bergfield et al., 2010; Hafkemeijer et al., 2014; Li et al., 2013; Montembeault et al., 2012; Oh et al., 2011; Segall et al., 2012; Tijms et al., 2016). Similar to studies in younger healthy populations, our results showed that increased age was associated with lower expression of the temporal networks (Bergfield et al., 2010; Li et al., 2013) Overall, in line with findings of previous studies, we found that in our sample of older persons with mild cognitive deficits, a higher age was associated with reduced SCN expression.
In the present study population of older persons with a mean age of 80.7 years, the prevalence of SVD was relatively high compared with other populations of older persons, as discussed previously (Foster-Dingley et al., 2015a). Our data show that signs of SVD, predominantly WMH volume, were associated with reduced network expression of four SCNs independent of gender and age. As a reduced SCN expression reflects specific gray matter patterns (gray matter volume, thickness and surface area), our results enhance previous volumetric studies showing that WMH load (Du et al., 2005; Kloppenborg et al., 2012; Lambert et al., 2015; Seo et al., 2012; Smith et al., 2008; Taki et al., 2011; Wen et al., 2006), the presence of lacunar infarcts (Appelman et al., 2010; Grau-Olivares et al., 2010), and cerebral microbleeds (Lee et al., 2004) are associated with a reduction in total gray matter. Moreover, it has been shown that WMH is associated with volumetric gray matter loss around the supramarginal gyrus and occipital–parietal junction (Lambert et al., 2015). This is in line with our results which showed that WMH volume was associated with reduced expression of the lateral occipital network, which contained these structures.
Our data show that independent of SVD, a lower expression of the temporal network that included the parahippocampal gyrus was associated with worse memory function. This is in line with MRI studies showing an association of hippocampal (Apostolova et al., 2010; Kramer et al., 2007; Mungas et al., 2002; Risacher et al., 2010; Van Petten et al., 2004) and (temporal lobe) parahippocampal atrophy (Kohler et al., 1998; Ward et al., 2014) with memory function. Furthermore, as psychomotor speed tests include a visual component, it is of interest that a lower expression of a network, including the occipital lobe (cerebellar–occipital network and occipital–precuneus network), was associated with lower psychomotor speed scores. A study assessed whether SCNs were associated with processing speed (Eckert et al., 2010). In contrast to our results, this study in healthy persons (aged 19–79 years) showed that slower processing speed corresponded to changes in a gray matter network composed of anterior cingulate cortex and dorsolateral prefrontal cortex (Eckert et al., 2010). However, whereas we included older persons with mild cognitive deficits, the latter population had an MMSE score of ≥27 and with no history of neurologic or psychiatric events. Therefore, these contrasting results may be attributable to differences in the health and age of the study populations. In addition, our results showed that expression of none of the SCNs was associated with the global measure of cognition. A reason for this might be that the MMSE is a global and therefore less sensitive tool than the compound scores for memory function, executive function, and psychomotor speed.
The association between SVD, specifically WMH, and SCNs may be attributable to deafferentation of the connections between cortical cells and their subcortical targets. Compared with WMH, lacunar infarcts and cerebral microbleeds are less likely to interrupt the cortical–subcortical connections in the subcortical white matter, as these are frequently located in the subcortical gray matter structures. Although strong associations were found between SVD and SCNs, and SVD has been associated with cognitive impairment (Light, 1991; Raz et al., 1998), the associations between SCNs and cognitive functioning remained even after adjusting for SVD. This may indicate that SCNs play a role in cognitive functioning. The expression of SCNs could be a reflection of specific gray matter patterns, as a result of disrupted subcortical–cortical connections that affect cognitive functioning.
Some limitations of the present study need to be addressed. First, our results suggest that SVD and cognitive functioning are related to reduced network expression in old age; however, due to the cross-sectional design it is not possible to determine a temporal or causal relationship. Also, because we used an exploratory approach, no correction was made for multiple testing. Our population was a selection of older persons who had mild cognitive deficits but no history of serious cardiovascular disease. Due to the exclusion of persons with serious cardiovascular disease, brain MRIs were useful for the current study; however, the current findings cannot be extrapolated to the general population. Furthermore, for the present study, whole-brain gray matter networks were based on structural covariance of gray matter density, using a voxel-based morphometry ICA (Beckmann and Smith, 2004) approach to identify naturally clustering, maximally independent SCNs. However, other methods can be used for defining SCNs (Alexander-Bloch et al., 2013; Bassett et al., 2008; Lerch et al., 2006). As the voxel-based morphometry ICA method was used in the current study, expression of SCNs relies on a group average, and consequently, we can only speculate on the value of individual diagnostic evaluation. Moreover, future research should delineate whether SCNs defined at the participant level, which have been related to cognition (Tijms et al., 2012, 2014; van Duinkerken et al., 2016), are spatially comparable with SCNs defined with the voxel-based morphometry ICA method.
Conclusion
This study shows that in older persons, in addition to age, the SVD features (predominantly a higher white matter hyperintensity volume) are associated with a decreased expression of SCNs. A lower temporal network expression is associated with worse memory function and a decreased cerebellar–occipital and occipital–precuneus network expression with lower psychomotor speed independently of age and SVD. This indicates that the determination of SCNs may be important in substantiating cognitive functioning in older persons.
Footnotes
Acknowledgments
The authors thank all the coinvestigators of the DANTE Study Leiden. This study was supported by a grant from the Netherlands Organisation for Health Research and Development (ZonMW), Program Priority Medicines for the Elderly (No. 40-41600-98-9014). S.A.R.B.R. is supported by VICI Grant No. 016.130.677 of the Netherlands Organisation for Scientific Research (NWO).
Author Disclosure Statement
No competing financial interests exist.