




Abstract
The pain matrix is comprised of an extensive network of brain structures involved in sensory and/or affective information processing. The thalamus is a key structure constituting the pain matrix. The thalamus serves as a relay center receiving information from multiple ascending pathways and relating information to and from multiple cortical areas. However, it is unknown how thalamocortical networks specific to sensory-affective information processing are functionally integrated. Here, in a proof-of-concept study in healthy humans, we aimed to understand this connectivity using transcranial direct current stimulation (tDCS) targeting primary motor (M1) or dorsolateral prefrontal cortices (DLPFC). We compared changes in functional connectivity (FC) with DLPFC tDCS to changes in FC with M1 tDCS. FC changes were also compared to further investigate its relation with individual's baseline experience of pain. We hypothesized that resting-state FC would change based on tDCS location and would represent known thalamocortical networks. Ten right-handed individuals received a single application of anodal tDCS (1 mA, 20 min) to right M1 and DLPFC in a single-blind, sham-controlled crossover study. FC changes were studied between ventroposterolateral (VPL), the sensory nucleus of thalamus, and cortical areas involved in sensory information processing and between medial dorsal (MD), the affective nucleus, and cortical areas involved in affective information processing. Individual's perception of pain at baseline was assessed using cutaneous heat pain stimuli. We found that anodal M1 tDCS and anodal DLPFC tDCS both increased FC between VPL and sensorimotor cortices, although FC effects were greater with M1 tDCS. Similarly, anodal M1 tDCS and anodal DLPFC tDCS both increased FC between MD and motor cortices, but only DLPFC tDCS modulated FC between MD and affective cortices, like DLPFC. Our findings suggest that M1 stimulation primarily modulates FC of sensory networks, whereas DLPFC stimulation modulates FC of both sensory and affective networks. Our findings when replicated in a larger group of individuals could provide useful evidence that may inform future studies on pain to differentiate between effects of M1 and DLPFC stimulation. Notably, our finding that individuals with high baseline pain thresholds experience greater FC changes with DLPFC tDCS implies the role of DLPFC in pain modulation, particularly pain tolerance.
Introduction
P
Several studies have used functional neuroimaging to identify structures that are activated in the experience of pain (Garcia-Larrea et al., 2003; Ingvar, 1999; Porro et al., 2003; Rainville, 2002; Tracey, 2005; Treede et al., 1999). These pain processing structures include parts of the thalamus, somatosensory, insular, cingulate, frontal, and parietal cortices. The thalamus is a key structure, as it is believed to serve as a relay center, receiving information from multiple ascending pathways and relating information to and from multiple cortical areas (Andersson et al., 1997; Herrero et al., 2002; Kenshalo and Isensee, 1983; Royce and Mourey, 1985). The primary motor (M1) and dorsolateral prefrontal cortices (DLPFCs) represent other key structures (Plow et al., 2012; Zaghi et al., 2009). Although information regarding the direct involvement of M1 in pain processing is scarce, experimental evidence from animal studies and collective evidence from clinical studies have established its place in the pain circuitry (Nguyen et al., 2011). The involvement of DLPFC in the pain circuitry is more direct and relatively recent. Besides being commonly activated during painful experiences in humans (Lorenz et al., 2002), the structural connections of DLPFC with periaqueductal gray and its interactions with basal ganglia, amygdala, anterior cingulate cortex, and thalamus allude to its control over the emotional-affective percept of pain (Apkarian et al., 2009; Hadjipavlou et al., 2006; Lorenz et al., 2003).
Stimulating the brain, using transcranial approaches, is a popular means to modulate the experience of pain (Plow et al., 2012; Zaghi et al., 2009). Transcranial direct current stimulation (tDCS) and repetitive transcranial magnetic stimulation (TMS) are two common approaches. M1 is commonly targeted because stimulating M1 is believed to modulate lateral thalamic hyperactivity associated with sensory-discriminative information processing (Boggio et al., 2008; Lefaucheur et al., 2006; Tsubokawa et al., 1991a,b, 1993; Yamashiro et al., 1994). Stimulation of other sensorimotor structures, such as the primary somatosensory cortex (S1), premotor, and supplementary motor area have failed to produce similar effects as M1 (Hirayama et al., 2006; Koyama et al., 1993). Although M1 is commonly targeted, benefits of M1 stimulation remain modest and variable (Lefaucheur et al., 2014), suggesting that networks other than the known sensory-discriminative components may be involved (Machado et al., 2013). Indeed, recent studies have suggested that targeting structures, such as the DLPFC, associated with emotional-affective information processing may be more effective in modulating the overall experience of pain (Brighina et al., 2011; Graff-Guerrero et al., 2005; Plow et al., 2012). The DLPFC is believed to specifically modulate activity within the midbrain-medial thalamic pathway (Apkarian et al., 2009; Lorenz et al., 2003; Stagg et al., 2013; Zubieta et al., 2001). For instance, stimulation of DLPFC significantly decreases ratings of unpleasantness and discomfort associated with emotional-affective information processing (Lorenz et al., 2003), suggesting its influence in modulating cortico-cortical and cortico-subcortical networks (Boggio et al., 2009; Stagg et al., 2013).
Although M1 and DLPFC have been widely targeted in the cortical modulation of pain, it remains unknown how stimulation of these structures affect other constituent areas involved in sensory-affective information processing. Furthermore, it remains unknown how M1 and DLPFC, and their thalamic relays, are functionally integrated. Do these thalamocortical structures share an inherent connectivity that could serve as a substrate to modulate with interventions, such as brain stimulation? Here, in a proof-of-concept study in healthy humans, we aimed to investigate such effects. Our study seeks to build off of previous work done by Stagg et al., (2013) who demonstrated that DLPFC tDCS reduces functional connectivity (FC) between DLPFC and bilateral thalami in healthy humans. In a single-blind, sham-controlled crossover study, healthy participants received anodal tDCS to DLPFC and M1. We chose to compare changes in FC with DLPFC tDCS to changes in FC with M1 tDCS, the most typical tDCS approach used in the experimental management of pain. We used resting-state functional magnetic resonance imaging (rs-fMRI) to study immediate changes in FC following tDCS (Biswal et al., 1995). We hypothesized that anodal tDCS to M1 would modulate FC of sensory networks, while anodal tDCS to DLPFC would modulate FC of affective networks. Furthermore, we anticipated that the FC changes would relate to an individual's experience of pain. To this end, we investigated whether the FC changes following anodal tDCS to M1 versus DLPFC were associated with an individual's baseline perception of pain.
While our study is not the first to investigate FC effects of anodal tDCS paired with rs-fMRI (Keeser et al., 2011; Polania et al., 2012a), it is nonetheless the first to directly compare such effects following stimulation of two cortical targets. Importantly, studying resting-state FC changes across thalamocortical networks specific to sensory-affective information processing is novel. Overall, we anticipated that our findings could provide useful evidence to help future studies differentiate between effects of M1 and DLPFC stimulation in the management of pain.
Materials and Methods
Participants
Ten young (mean age ± SD; 27 ± 6 years, 6 females) healthy participants were enrolled with approval from the Institutional Review Board of the Cleveland Clinic. All participants provided written informed consent and were right-handed according to the Edinburgh handedness inventory (Oldfield, 1971). Sample size was determined based on previous studies that adopted a similar repeated measure, randomized sham-controlled design for study of changes in FC following stimulation with tDCS (Keeser et al., 2011; Polania et al., 2012a,b). Exclusion criteria pertained to safety contraindications to tDCS (Nitsche et al., 2008), TMS (Rossi et al., 2009), and MRI. Briefly, these included cardiac pacemakers, intracranial metal implants, history of seizures, history of medication-resistant epilepsy in a first degree relative, pregnancy, implanted intrathecal pumps, shunts, or neurostimulators, neurologic injury affecting sensorimotor systems (such as brain tumor, dementia, substance abuse, or stroke), chronic neuropathic pain, or damaged skin on scalp.
Design
Our study adopted a single-blind, sham-controlled crossover design. All participants underwent three sessions of stimulation in a randomized order, one where M1 was targeted; another where DLPFC was targeted; and a third where participants received sham. Stimulation was applied using tDCS while subjects remained at rest. Participants were blinded to the stimulation conditions. We confirmed the integrity of blinding by asking questions that probed participants' best guess at the end of each visit. Visits were separated by at least 1 week to allow for washout of effects of tDCS. Resting-state scans were acquired before (baseline rs-fMRI) and immediately after tDCS (post rs-fMRI) (Fig. 1), but no later than 5 min after tDCS, similar to the design of previous studies (Keeser et al., 2011; Polania et al., 2012a,b).
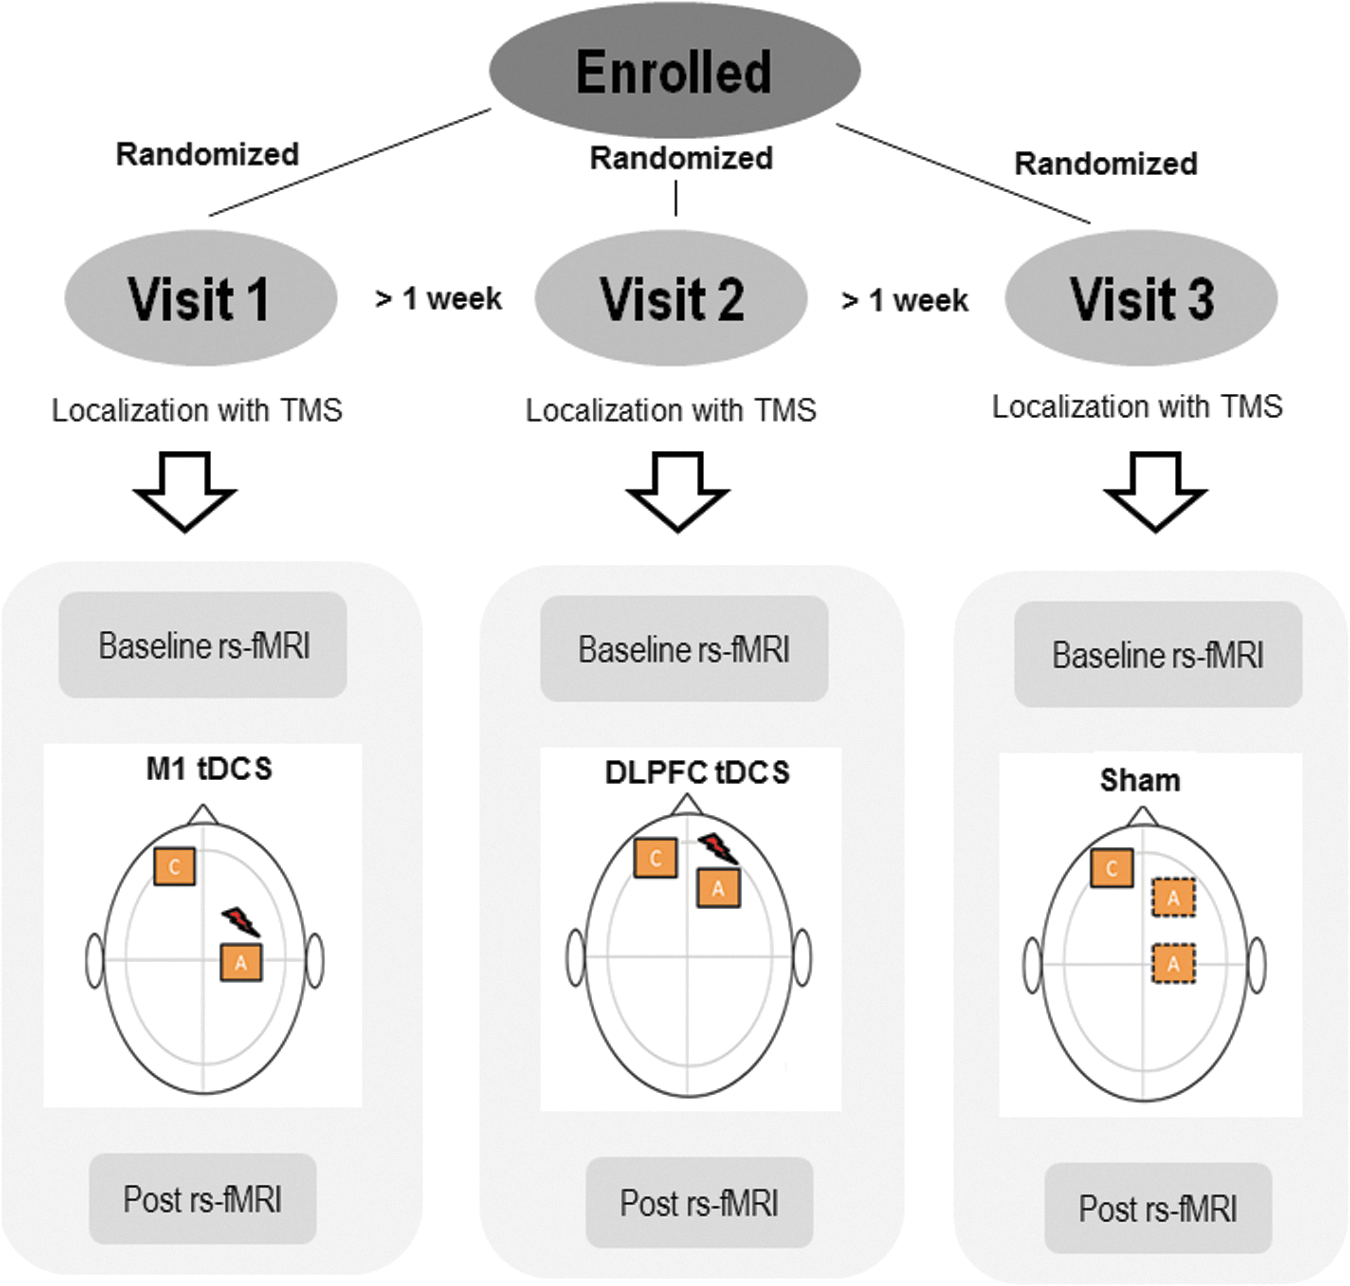
Design: In a repeated measures crossover design all subjects received tDCS to M1, DLPFC, and sham in a random order on three visits separated by at least 1 week. For sham, the anode was placed either on the right M1 or the right DLPFC. Stereotactic TMS session was conducted at the start of each visit to localize the placement of tDCS electrodes (see M1 localization, below). Then, a 6-min baseline rs-fMRI scan was acquired. tDCS was then applied for 20 min at 1 mA intensity, while no MRI scans were conducted (offline). Immediately after tDCS, another 6-min post rs-fMRI scan was acquired. DLPFC, dorsolateral prefrontal cortex; tDCS, transcranial direct current stimulation; rs-fMRI, resting-state functional magnetic resonance imaging; TMS, transcranial magnetic stimulation.
Procedures
Transcranial direct current stimulation
Anodal tDCS was administered using a direct current stimulator (NeuroConn, Germany). We used anodal excitatory tDCS as it is common in the therapeutic modulation of pain (Fregni et al., 2006; Roizenblatt et al., 2007). A pair of carbon–graphite–silicon electrodes (area = 5 × 7 cm2) was covered thoroughly with electroencephalogram (EEG) conductive paste to ensure a flush and comfortable fit on the scalp. Electrodes were secured to the head using elastic wrap bandages and elastic caps to ensure they were stable during and after MRI. We applied standard tDCS electrodes owing to its prevalent use in imaging and/or pain studies (Antal and Paulus, 2011; Boggio et al., 2008, 2009). We used MRI-guided stereotaxy to apply tDCS electrodes to ensure accurate placement. For M1 tDCS, the center of the anodal electrode was placed over the motor hotspot in right M1 (Fig. 2A). The coordinates of the motor hotspot were identified by applying stereotactic TMS (Brainsight Rogue Research, Inc., Montreal, Canada) to the right M1 using a figure-of-eight coil (MCF-B65, diameter 70 mm) connected to a monophasic stimulator (2002; Magstim Co., Ltd., Dyfed, United Kingdom). Localizing M1 based on stereotactic TMS, as opposed to commonly used “10–20” EEG system, allows one to identify the region most dedicated to movement of the contralateral limb and minimizes investigator-related errors. While subjects rested their hands, we used visual confirmation of contraction of the left first dorsal interosseous muscle to finalize our motor hotspot in right M1. Similarly, for DLPFC tDCS, center of the anodal electrode was placed over the right DLPFC, localized to a point 5 cm anterior to the coordinates of the motor hotspot in right M1, as outlined in previous studies (Brighina et al., 2011; Graff-Guerrero et al., 2005; Pascual-Leone et al., 1996) (Fig. 2A). Subsequent offline analysis [using Brainsight and AFNI (Analyses of Functional Images,

Stimulation paradigm:
Functional neuroimaging tDCS setup
We delivered tDCS using a device and setup that was manufactured to be compatible with the MRI-scanning environment (NeuroConn, Germany) (Fig. 3). During MRI, tDCS equipment was removed from the scanning environment; only electrodes that were MRI-compatible remained affixed to the scalp. During tDCS, however, the equipment was restored; the subject table was pulled out of the scanner while the participant lay supine and electrodes were reconnected to the tDCS device. Active tDCS was delivered for 20 min at 1 mA intensity with ramp-up/ramp-down periods of 10 sec, as described in earlier studies (Bachtiar et al., 2015; Stagg et al., 2013). For sham, the stimulator provides stimulation at the beginning and at the end to mimic the somatosensory artifact of active tDCS. After active tDCS and sham, electrodes were disconnected from the device; device was removed from the MRI scanning environment; and the patient table was returned to isocenter for posttest MRI scanning.
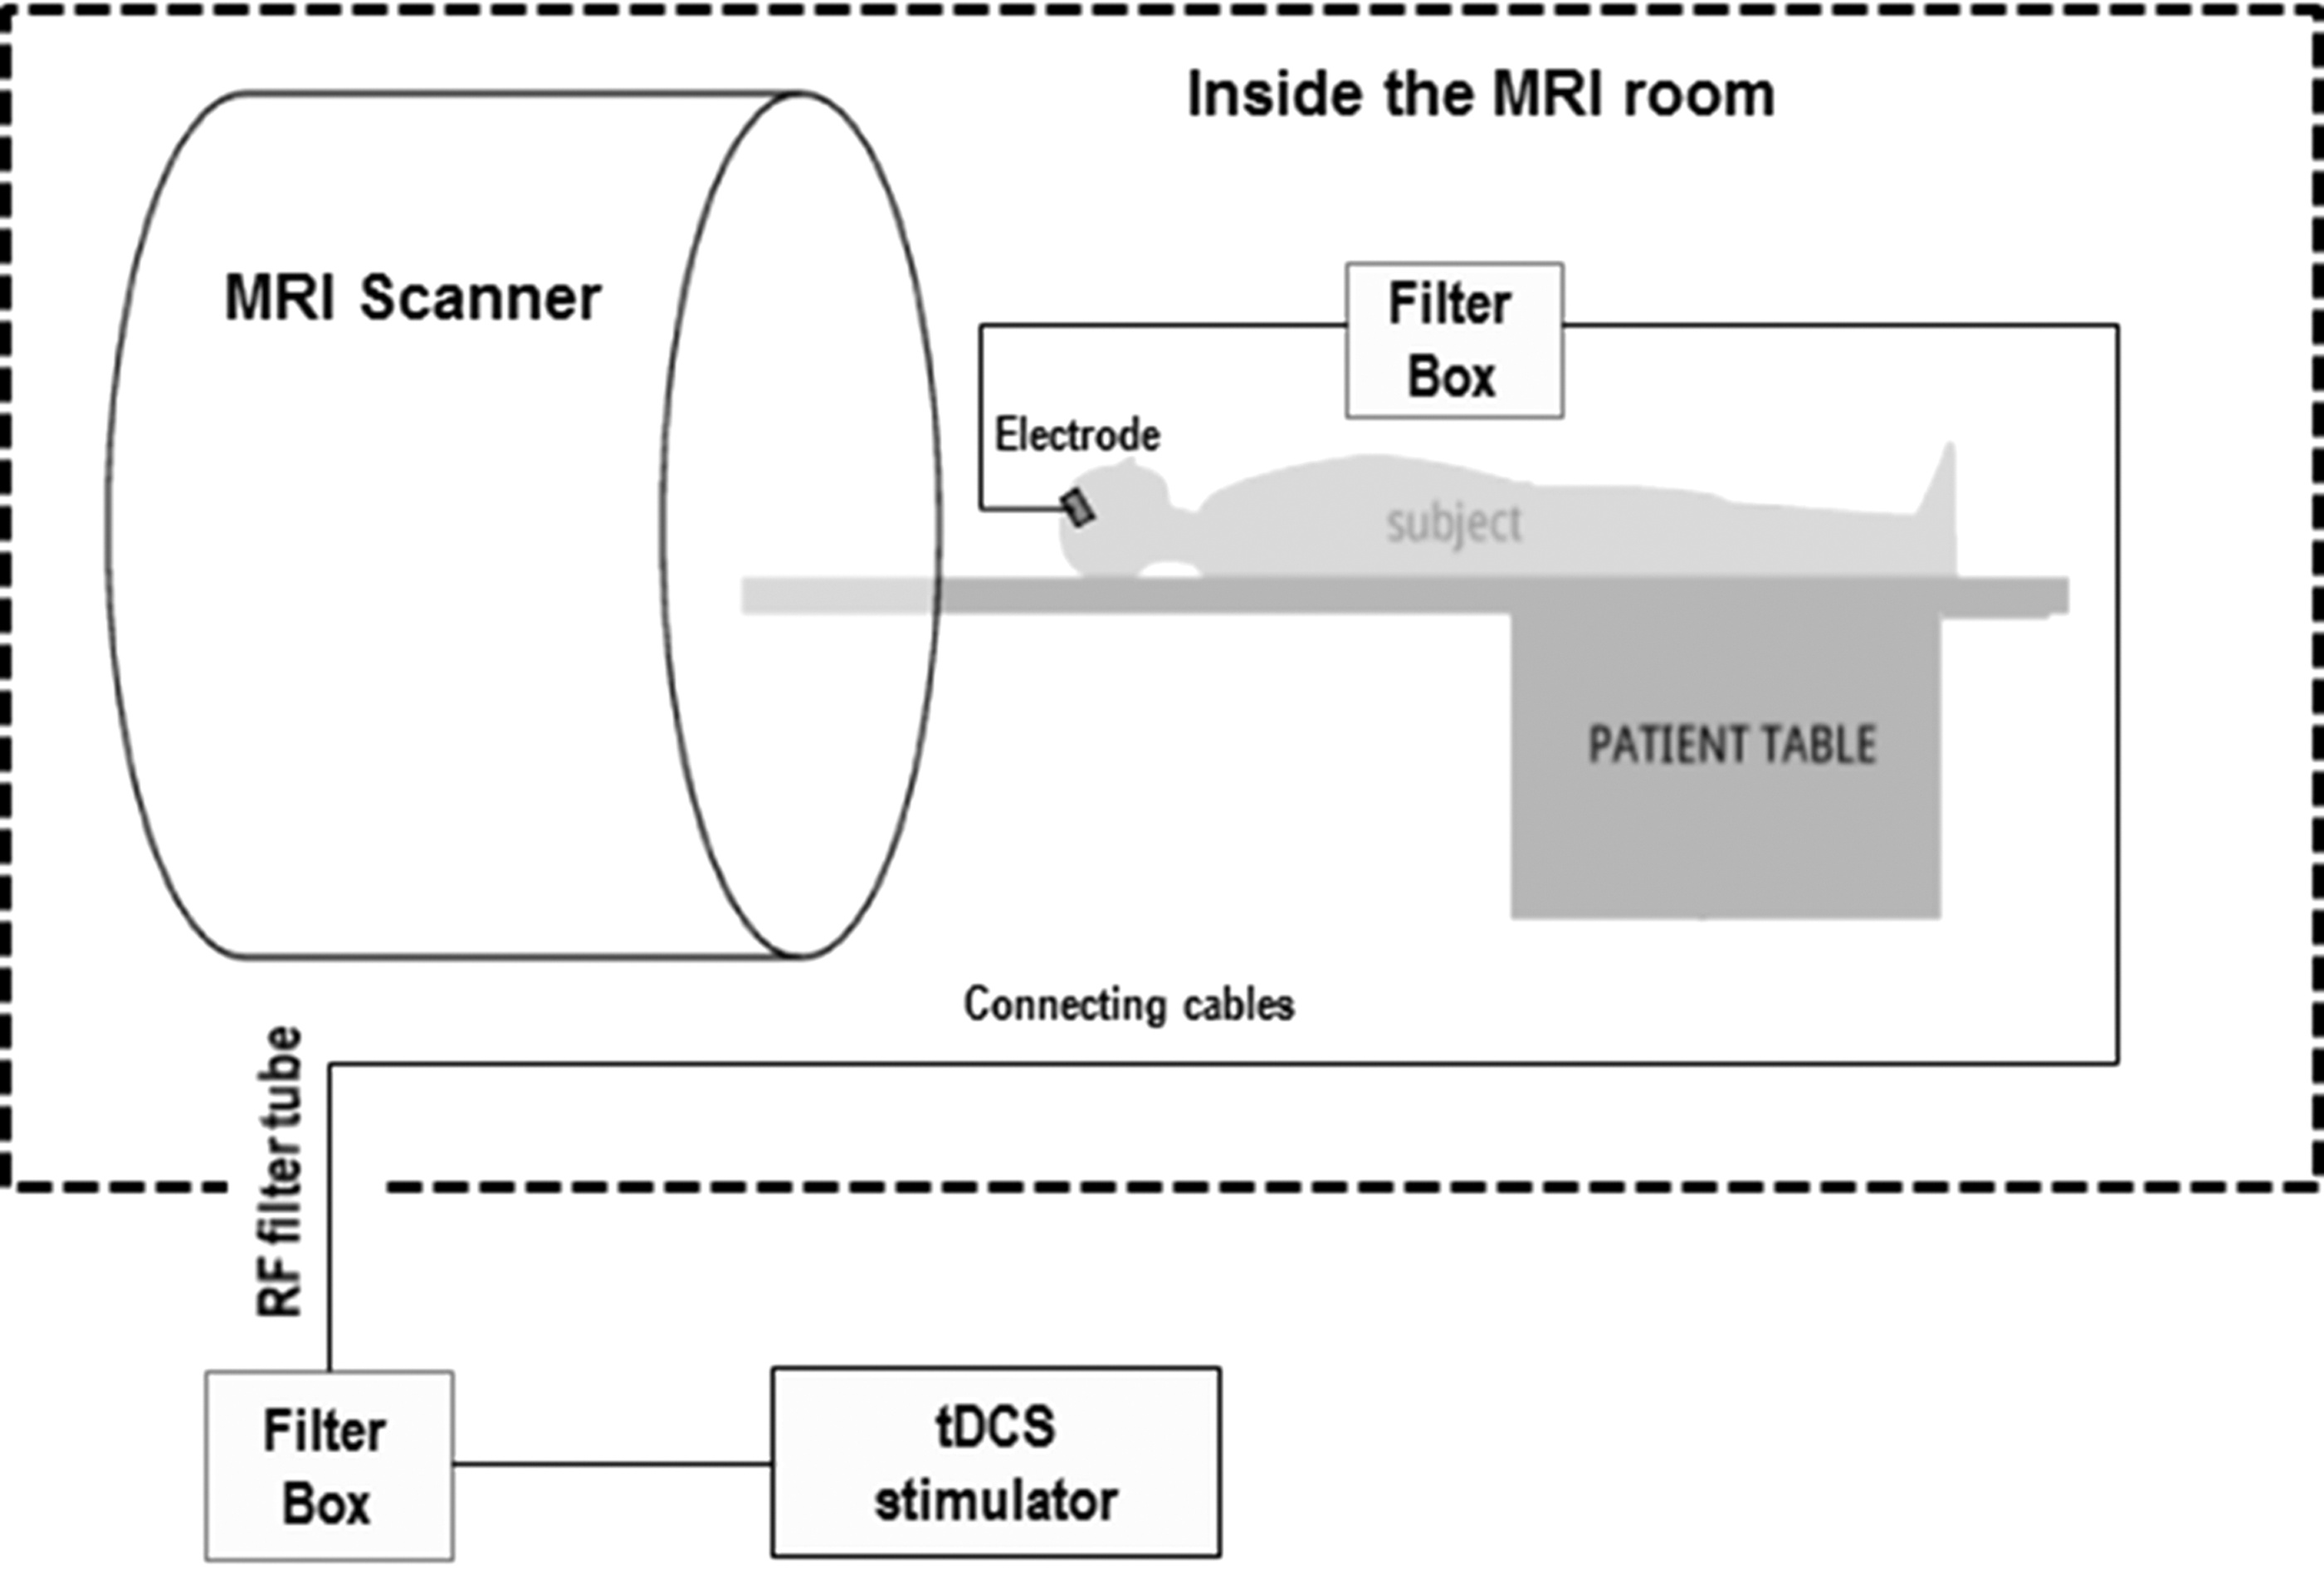
Functional neuroimaging-tDCS setup: tDCS was provided through a pair of identical carbon–graphite–silicon electrodes manufactured to be compatible with the MRI-scanning environment (only the anodal electrode positioned on the right is shown-the cathodal/reference electrode was positioned above the left supraorbital region). The wires for each electrode were equipped with 5.6 kΩ resistors that help avoid sudden temperature increases due to induction voltages from radio frequency pulses. All wires were passed through a cable running through a radio frequency filter tube in the cabin wall and connected to a battery-driven tDCS stimulator (NeuroConn GmbH, Ilmenau, Germany) located outside the MRI room. To further suppress the radio frequency impulse energy, two filter boxes were placed between the stimulator and the electrodes. The characteristic bandwidths of the filters on the DC current path were chosen to have an approximate attenuation of 60 dB within a frequency range of 20–200 MHz to suppress the RF impulse energy. It should be noted that these safety precautions were not strictly necessary for this study because no scanning was performed during lead connection.
rs-fMRI data acquisition
Resting-state scans were acquired using a 12-channel receive-only head array on a Siemens Trio 3T scanner (Siemens Medical Solutions, Erlangen, Germany). All participants were fitted for a bite bar to restrict head motion during scanning (Lowe et al., 2008). Physiologic signals were acquired with a pulse oximeter on the index finger of the hand and with respiratory bellows around the chest. Physiologic timing files were synchronized to scanner data acquisition as previously described by our group (Beall and Lowe, 2007). The initial MRI scan included acquisition of anatomic three-dimensional (3D) whole-brain T1 images: T1-weighted inversion recovery turboflash (MPRAGE); 176 axial slices; thickness, 1 mm; field of view (FOV), 256 × 256 mm; inversion time (TI)/echo time (TE)/repetition time (TR)/flip angle (FA), 1900 msec/1.71 msec/900 msec/8°. After the initial T1 dataset acquisition, resting-state scans were conducted twice in each visit, once before and another immediately after tDCS. Whole-brain low-frequency blood oxygenation level dependent (BOLD) fluctuation resting-state scans included 132 repetitions of 31-4-mm thick axial slices; TE/TR, 29 msec/2800 msec; matrix, 128 × 128; FOV, 256 × 256 mm; and receive bandwidth, 250 kHz. Participants were instructed to close their eyes, lie still, and think of nothing during the scan. At the end of data acquisition, all participants confirmed that they remained awake during the whole scanning period.
Baseline pain threshold assessment
Individual pain thresholds of all participants were collected at baseline using a noninvasive pain task. Nociceptive cutaneous heat stimuli were applied using a TSA-II Neurosensory Analyzer (Medoc, Durham, NC) using a 3 × 3 cm thermode on the volar aspect of distal left forearm. The apparatus is MRI compatible and is frequently used in several pain studies and is seldom associated with adverse events (Borckardt et al., 2009). For thresholding, the participants' skin was permitted to adapt to a temperature of 32°C for some time. The thermode was heated at the rate of 1°C/s till the participant reported that the sensation was painful. At this point the participant pushed the button and the stimulus cooled off immediately. Average over three trials were computed, to determine the individual baseline pain thresholds.
The context within which nociceptive stimuli are presented is important (Legrain et al., 2011). Therefore, we chose to deliver cutaneous heat stimuli as nociceptive stimuli because they are commonly used in experiments involving pain (Arendt-Nielsen and Chen, 2003; Kenshalo and Bergen, 1975). Their use is likely prevalent because temporal and spatial presentation of these stimuli is easy to vary. In addition, application of heat stimuli through thermodes reduces nonpain sensations typically elicited with application of electrical stimulation (Angst et al., 2009; Reddy et al., 2012). Onset and termination of heat stimuli using a conductive thermode is also easier to control than radiant heat that takes time to terminate (Arendt-Nielsen and Bjerring, 1988; Mor and Carmon, 1975). Finally, the distal forearm was chosen for stimulus application because it is contralateral to the right hemisphere—the site of anodal tDCS. It is also important to note that due to design limitations of our combined functional neuroimaging-tDCS setup, it was difficult to incorporate immediate post-tDCS pain measurements.
Data analysis
Preprocessing
Preprocessing procedures were performed using AFNI and MATLAB to measure and remove unwanted variability in the rs-fMRI data. The first four volumes of the fMRI data were discarded due to T1 saturation effects and then corrected for volumetric head motion using 3dvolreg from AFNI (Cox, 1996). Adaptive physiologic noise sources were minimized using the monitored physiologic data and PESTICA (Physiological Estimation by Temporal ICA) for AFNI (Beall, 2010; Beall and Lowe, 2007). In addition, data were corrected for voxel-by-voxel (Bullmore et al., 1999) and intravolume second-order motion effects. Intravolume or slicewise motion was detected with SLice-Oriented MOtion COrrection (SLOMOCO) (Beall and Lowe, 2014). SLOMOCO is a rigid-body slicewise motion parameter detection and subsequent correction through regression of these parameters in a model designed to account for out-of-plane motion artifact (Beall and Lowe, 2014). Corrected data were then spatially filtered using a 3D Gaussian filter of 3–4 mm full-width at half-maximum with 3dmerge. Subsequently, temporal band pass filtering (0.01–0.1 Hz) was applied. Both spatial and temporal filtering was used to improve functional resolution, reduce apparent noise, and increase the validity of comparison across subjects. Once fMRI data were coregistered with the participant's high-resolution T1 images, data were transformed into standard Talairach space using AFNI (Talairach and Tournoux, 1988). Transformation was performed in two stages as follows: (1) alignment to anterior commissure (AC)-posterior commissure (PC) coordinates, in which coordinates for AC and PC were manually localized and checked for alignment and (2) scaling to Talairach coordinates (Cox, 1996).
Seed-based correlation analysis
Seeds of interest were anatomically localized by an expert neurologist (A.G.M.) in the topography of the thalamus. An objective template in AFNI was used, in which the inferior edge of the PC was chosen as the preferred anatomical landmark. Specific distances from the PC were used to precisely guide localization of the ventroposterolateral (VPL) and medial dorsal (MD) nuclei of the thalamus on the right. The VPL and MD nuclei of the thalamus were particularly chosen as our seeds to study FC changes across lateral and medial pathways involved in sensory-discriminative and emotional-affective information processing, respectively. Seed locations were defined as voxels (3 × 3 mm size), and resting-state correlation maps between the defined seed and all other corresponding voxel's time series in the image were generated using the AFNI InstaCorr (Instantaneous Correlation) tool. To allow assessment of interrater reliability, a second blinded rater (D.A.C.) additionally localized the VPL and MD seeds.
We used a double disassociation approach to study influence of stimulating each locus, namely M1 and DLPFC, on the changes in FC observed across lateral and medial pathways. The FC changes across the lateral pathway were evaluated by measuring FC between VPL and cortical regions involved in sensory-discriminative information processing, such as S1 and M1 (Treede et al., 1999). Similarly, the FC changes across the medial pathway were evaluated by measuring FC between MD and cortical regions involved in emotional-affective information processing, such as insula, and DLPFC (Treede et al., 1999).
First-level analysis was performed to characterize changes in FC across brain regions following M1 tDCS, DLPFC tDCS, and sham. Subject level maps were generated using InstaCorr showing areas of positive and negative changes in FC with VPL and MD. For the purpose of z-score normalization, all the obtained correlation maps were converted to t-statistical maps (Lowe et al., 2008). The t-statistical maps were then corrected for global effects in an empirical z-transform by normalizing the distribution of connectivity values to have a mean of 0 and a standard deviation of 1 (Beall and Lowe, 2014). The result is a whole-brain z-score connectivity map that indicates the strength of FC of VPL and MD with other brain regions. The normalized connectivity maps for each subject were then used to study changes in FC with stimulation, as shown in Equations (1) to (3).
First-level analysis:
Since nonspecific temporal drifts in FC that occur within a session can confound changes in FC witnessed with M1 tDCS and DLPFC tDCS, we subtracted changes in FC occurring with sham from changes witnessed with M1 tDCS to M1 and DLPFC tDCS. To this end, we conducted a second-level analysis to subtract the z-score connectivity maps related to sham [Equation (3)] from M1 tDCS [Equation (1)] and DLPFC tDCS [Equation (2)]. Hence,
Second-level analysis:
All 10 statistical maps from the second-level analysis [Equations (4) and (5)] were entered into a third-level analysis to identify individual effects of active M1 tDCS and active DLPFC tDCS on known sensory and affective networks. Finally, z-score connectivity maps of active M1 tDCS and active DLPFC tDCS were contrasted to identify differential effects of M1 versus DLPFC [Equations (6) and (7)].
Third-level analysis:
As an additional control, we tested whether effects of tDCS were specific to thalamocortical networks connected to targeted regions—M1 and DLPFC, or if the effects diffusely influenced most thalamocortical circuits. To this end, we studied FC between lateral geniculate nucleus (LGN) of the thalamus and occipital cortices. In this study again, z-score connectivity maps of active M1 tDCS and active DLPFC tDCS were contrasted to identify differential effects of M1 versus DLPFC [Equations (6) and (7)].
Statistical analysis
Statistical analysis was performed using SPSS (v18, SPSS, Inc., Chicago, IL). Kappa measure of agreement (κ) was used to test whether participants correctly judged the stimulation condition more frequently than that would be expected by chance. Cutoffs for characterizing the level of agreement were <0.2 slight, 0.21–0.4 fair, 0.41–0.6 moderate, 0.61–0.8 substantial, and 0.81–1 very good (Landis and Koch, 1977). Reliability was analyzed between raters using intraclass coefficients (ICC). An ICC value >0.75 was regarded as good reliability (Portney, 2009).
Cluster-based thresholding was performed using AlphaSim correction in AFNI (
Results
All participants confirmed that they remained awake during the whole scanning period. Overall, most participants reported slight itching from all tDCS paradigms, which disappeared after few seconds of stimulation. These transient effects are common after tDCS application (Nitsche et al., 2008). No relevant discomfort or pain was observed during the experiment, and tDCS was well tolerated. Overall, 36% of the participants correctly judged the stimulation condition (κ = 0.285) they received, indicating effective participant blinding. Excellent agreement was demonstrated across raters regarding localization of seed (ICC = 0.94 for VPL and ICC = 0.86 for MD).
FC changes across sensory networks
We studied FC changes between VPL, the sensory nucleus of the thalamus, and cortical regions. We found that sham stimulation elicited no significant changes in FC between VPL and any cortical region (Fig. 4A—right, 4B—right). But active M1 tDCS led to significant increases in FC between VPL and contralateral S1, ipsilateral M1, and bilateral insula (Fig. 4A, left and Table 1). Furthermore, active M1 tDCS also resulted in decreases in FC between VPL and contralateral thalamus and middle occipital gyri (MOG) (Fig. 4A, left and Table 1). Active DLPFC tDCS elicited no significant changes in FC between VPL and S1 and insula, but led to significant increases in FC between VPL and ipsilateral M1 (Fig. 4B, left and Table 1). Differences between active M1 tDCS and active DLPFC tDCS did not yield statistically significant results.

Resting-state FC maps between VPL and cortical regions: Seed region in the right VPL is shown in green. Left: Statistical z-score maps showing significantly correlated voxels between right VPL and cortical regions after
Bold represents hemispheres and regions that showed significant increases in FC after active M1 tDCS and active DLPFC tDCS. Minimum cluster size as determined by AlphaSim to significantly correct for multiple comparisons at p < 0.05 was 80 voxels.
(S1)1, (S1)2, (S1)3, primary somatosensory cortices, cluster 1, 2, and 3, respectively; (Ins)1, (Ins)2, insula, cluster 1 and 2, respectively; (MOG)1, (
FC changes across affective networks
We studied FC changes between MD, the affective nucleus of the thalamus, and cortical regions. We found that sham stimulation elicited no significant changes in FC between MD and any cortical region (Fig. 5A—right, 5B—right). But active M1 tDCS led to significant increases in FC between MD and ipsilateral M1 and decreases in FC between MD and MOG, superior temporal gyri (STG), insula, and cingulate gyrus (Fig. 5A, left and Table 2). Active DLPFC tDCS increased FC between MD, ipsilateral M1, and ipsilateral DLPFC and decreases in FC among MD, MOG, STG, and cingulate gyrus (Fig. 5B, left and Table 2). Differences between active M1 tDCS and active DLPFC tDCS did not yield statistically significant results.
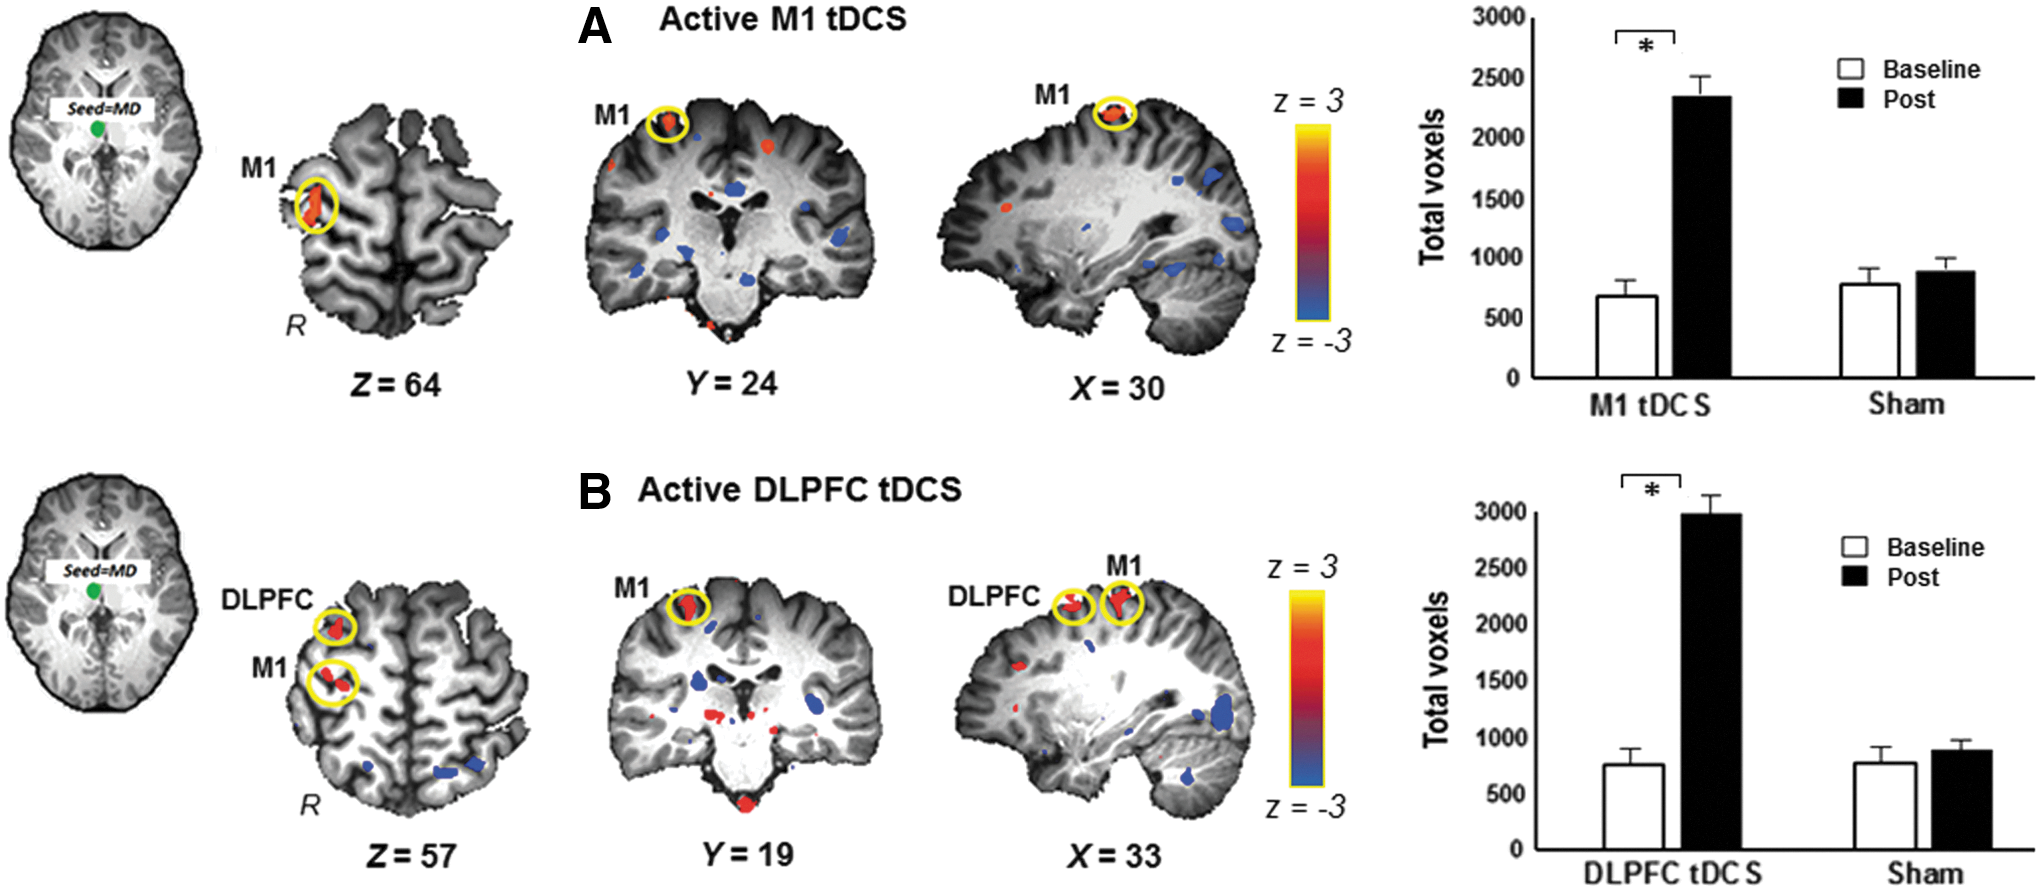
Resting-state FC maps between MD and cortical regions: Seed region in the right MD is shown in green. Left: Statistical z-score maps showing significantly correlated voxels between right MD and cortical regions after
Bold represents hemispheres and regions that showed significant increases in FC after active M1 tDCS and active DLPFC tDCS. Minimum cluster size as determined by AlphaSim to significantly correct for multiple comparisons at p < 0.05 was 80 voxels.
(CG), cingulate gyrus; (STG)1, (STG)2, superior temporal gyrus, cluster 1 and 2, respectively; MD, medial dorsal; STG, superior temporal gyrus.
Correlation of FC changes to individual baseline pain thresholds
All participants exhibited heat pain thresholds in the range of 46°C to 51°C, with an average baseline threshold of 49.31°C ± 0.56°C (mean ± SEM). Baseline FC across sensory and affective networks did not correlate with individual baseline pain thresholds. However, changes in FC across sensory and affective networks correlated with baseline pain thresholds. Given the exploratory nature of our analyses, we present correlation results in this study with an uncorrected p-value. Changes in FC elicited by active DLPFC tDCS correlated positively with baseline pain thresholds. Individuals who demonstrated greater changes in FC, following active DLPFC tDCS, had higher baseline pain thresholds. The greatest correlations were observed across affective networks of the medial pathway, particularly between MD and DLPFC (r = 0.74, p = 0.02) (Fig. 6D). Changes in FC observed across sensory networks of the lateral pathway, especially between VPL and M1, also correlated with baseline pain thresholds, but values showed only a trend toward significance (r = 0.71, p = 0.08) (Fig. 6C). Changes in FC elicited by active M1 tDCS did not correlate with individual baseline pain thresholds (Fig. 6A, B).
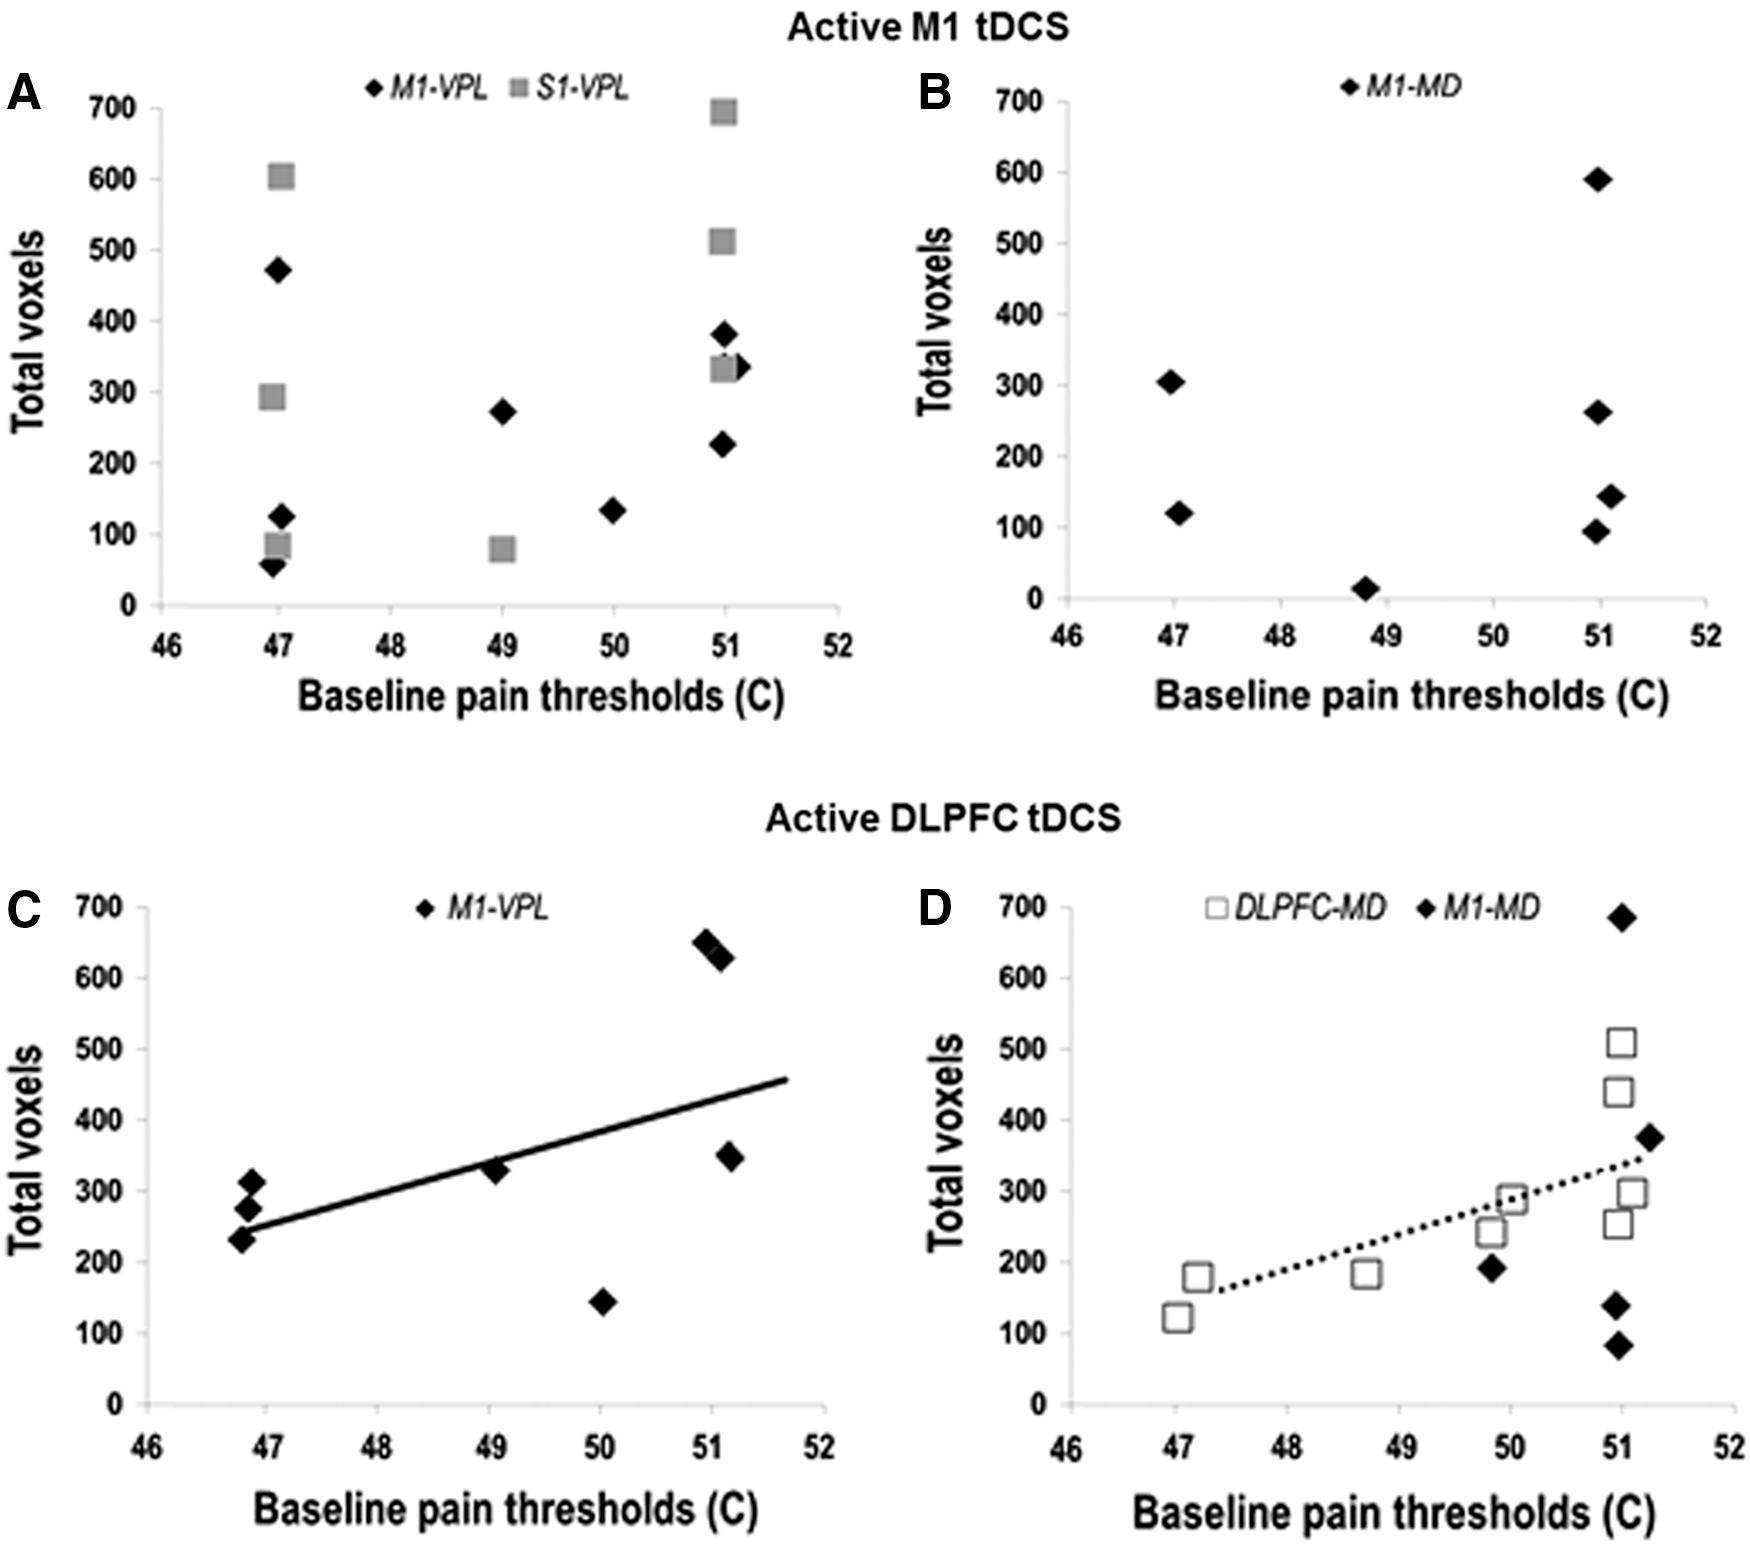
Correlation of FC changes to individual baseline pain thresholds: FC changes following active M1 tDCS are represented as total number of correlated voxels between (
Control network analysis
Neither active M1 tDCS nor active DLPFC tDCS increased FC between LGN and primary visual cortices, although decreases in FC between LGN and temporo-occipital cortices were witnessed (Fig. 7A, B). Differences between active M1 tDCS and active DLPFC tDCS did not yield statistically significant results.
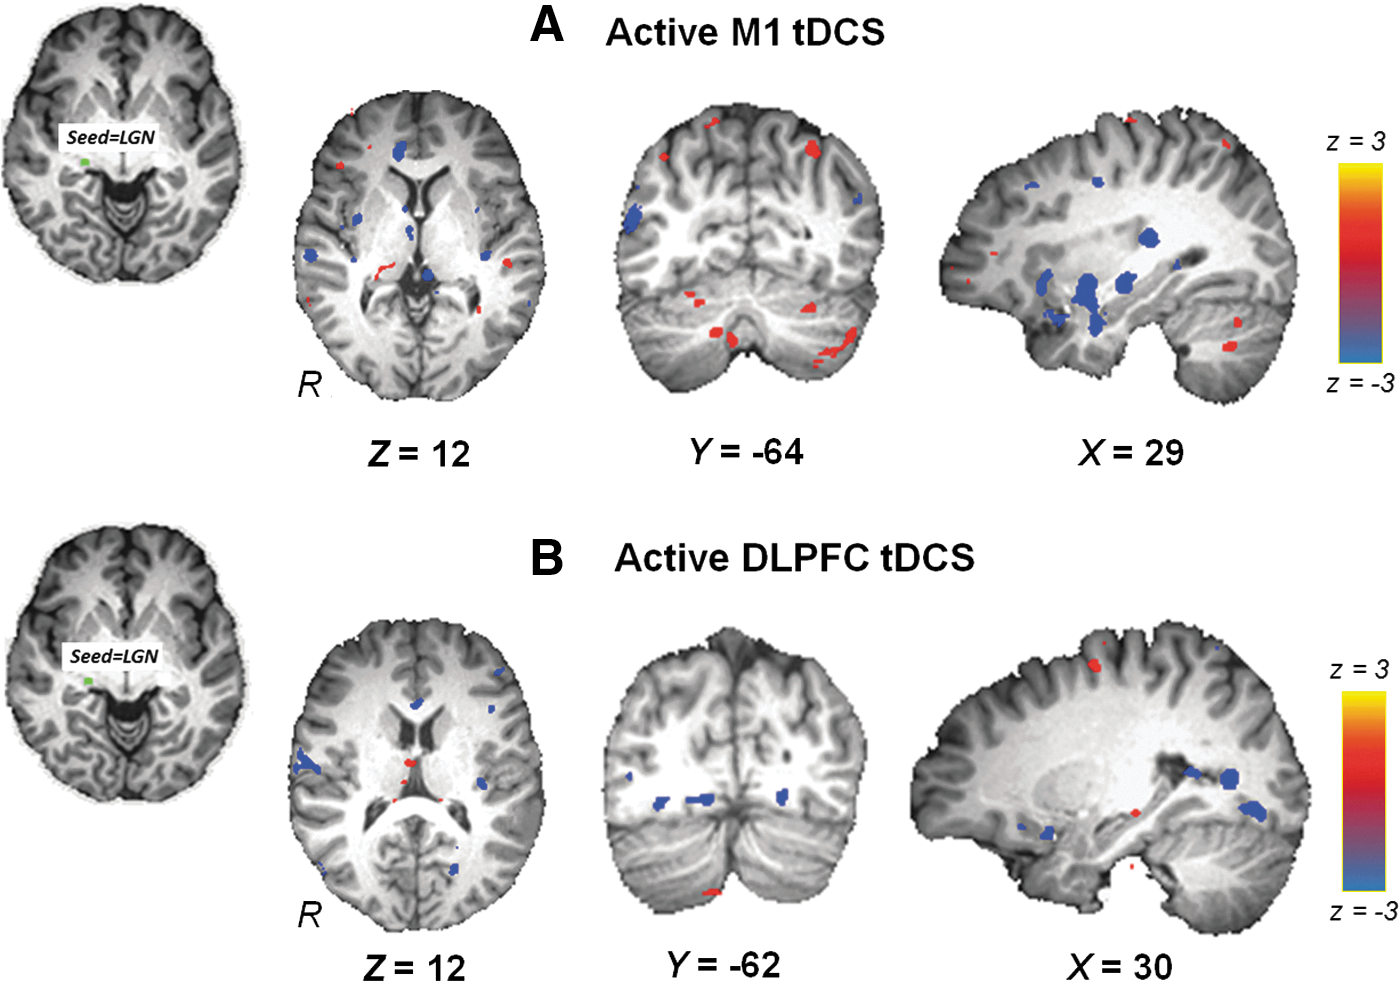
Resting-state FC maps between LGN and cortical regions: Seed region in the right LGN is shown in green. Statistical z-score maps showing voxels that are significantly correlated between right LGN and cortical regions after
Discussion
Our results suggest that active M1 tDCS mainly increases FC between VPL and sensory networks, while active DLPFC tDCS increases FC between VPL and sensory networks and FC between MD and affective networks. However, no significant differences were found between FC changes elicited with active M1 tDCS and active DLPFC tDCS. We also demonstrate that the FC changes following active DLPFC tDCS correlate with individual baseline pain thresholds. Individuals with high-baseline pain thresholds, that is, high pain tolerance, demonstrate greater changes in FC with DLPFC tDCS suggesting that DLPFC is involved in regulating their pain tolerance. These findings highlight the role of DLPFC in pain modulation, particularly pain tolerance. Our findings, when replicated in a larger group of individuals, could provide useful evidence that may inform future studies to differentiate between effects of M1 and DLPFC stimulation in the management of pain. Such evidence could potentially help tailor targets for pain relief in clinical populations.
FC changes across sensory networks
Our results suggest that active M1 tDCS elicits robust increases in FC between the VPL nucleus of the thalamus and contralateral S1, ipsilateral M1, and bilateral insula. Our findings align with previous experimental and brain imaging studies that argue that stimulating M1 mainly influences lateral thalamic projections that process sensory-discriminative information (Antal et al., 2010; Fregni et al., 2007; Mori et al., 2010). Anatomically, the lateral pathway constitutes lateral thalamic structures, like VPL, that primarily connect to cerebral cortical areas, such as S1 and M1, to convey somatosensory information (Andersson et al., 1997; Dado et al., 1994; Katter et al., 1996). The middle and posterior parts of the insular cortex also constitute the lateral pathway and receive information directly from the thalamus and from S1 (Hua et al., 2008). Therefore, anatomical substrates help explain the increased FC between VPL and ipsilateral M1 and bilateral insula. However, the increase in FC between VPL and contralateral S1 is a surprising, yet interesting finding. Although there are minimal direct structural projections between the VPL and contralateral S1, we speculate that these two areas are functionally connected through the ipsilateral M1 (Hlushchuk and Hari, 2006; Yumiya and Ghez, 1984). Future studies adopting either resting-state or task-based (with a pain stimulus) approaches should test for the presence of interhemispheric FC between bilateral sensorimotor cortices, especially between M1 and S1.
A key finding of this study is that the FC changes between VPL and sensorimotor cortices are modulated differently by active DLPFC, than with active M1 tDCS. While active M1 tDCS increased FC between VPL and S1, active DLPFC tDCS had no such effect. Instead, active DLPFC tDCS increased FC between VPL and M1. Our findings, in part, challenge a classical notion that suggests that DLPFC is a region primarily involved in processing emotional-affective information (Brighina et al., 2011; Garcia-Larrea et al., 2003; Lorenz et al., 2003). Here instead, we highlight that stimulation of DLPFC can modulate FC between VPL and M1. Previous studies have reported somewhat similar findings. While one study reported increases in FC between left DLPFC and bilateral primary sensorimotor cortices after tDCS (Stagg et al., 2013), another study reported significant increases in M1 corticospinal excitability (Vaseghi et al., 2015).
Overall, our results demonstrate that both active M1 tDCS and active DLPFC tDCS modulate FC across sensory networks, although the influence of M1 tDCS appears to be more robust. Importantly, the validity of our findings is significant since FC effects of VPL were only modulated with active M1 and DLPFC tDCS, but not with sham. Future studies will be needed to validate current findings and the strength of sensory-discriminative effects associated with stimulation of M1 versus DLPFC.
FC changes across affective networks
We have found that active DLPFC tDCS elicits robust increases in FC between the MD nucleus of the thalamus and ipsilateral M1 and DLPFC. Medial thalamic structures, like MD, share reciprocal connections with cortical structures such as M1, DLPFC, and limbic areas to process emotional-affective information (Goldman-Rakic and Porrino, 1985; Kievit and Kuypers, 1977), which provides a clear direct anatomical substrate to explain the present findings. Furthermore, the present data corroborates the primary role of DLPFC in modulating the medial pathway (Lorenz et al., 2003) and emotional-affective information processing (Apkarian et al., 2009; Godinho et al., 2006; Zubieta et al., 2001). A surprising result to note though is the lack of any FC changes across insula or any other limbic cortices, believed to be key components of the medial pathway. We speculate that although insula and the limbic cortices might have been modulated after stimulation of DLPFC, we failed to capture the effects since we studied FC changes only from MD.
The lack of FC changes between MD and DLPFC after active M1 tDCS is also an important finding. Even though M1 is anatomically connected to DLPFC, stimulation over this cortical area does not have effects that reciprocate the results of active DLPFC tDCS. These differential effects suggest that while both M1 and DLPFC have corticothalamic projections to MD, projections between MD and DLPFC show a more robust influence, at least in healthy humans.
Overall, our results demonstrate that active DLPFC tDCS has a stronger influence on FC effects across affective networks, than active M1 tDCS. Importantly, the validity of our findings is significant since FC effects of MD were modulated only with active M1 and DLPFC tDCS, but not with sham.
Correlation of FC changes to individual baseline pain thresholds
Our exploratory analyses suggests that individuals with high-baseline pain thresholds, that is, high pain tolerance, show greater changes in FC with DLPFC tDCS. This suggests that DLPFC is involved in regulating their pain tolerance. In fact, other neuromodulation studies have also claimed that DLPFC is involved in modulating emotional-affective experience of pain, which represents individual's tolerance to pain (Graff-Guerrero et al., 2005; Mylius et al., 2009). A recent fMRI study demonstrated that greater connectivity between bilateral DLPFCs was associated with higher heat pain thresholds (Sevel et al., 2016). These findings taken together highlight the role of DLPFC in pain modulation, particularly pain tolerance. Our finding that individuals with low pain thresholds demonstrate less changes in FC with DLPFC tDCS could suggest that these individuals do not rely on affective-emotional influence of DLPFC, which may partially explain their low tolerance to pain. However, future studies with larger sample sizes are needed to validate the significance of this finding.
FC changes across control networks
We chose to study FC from LGN as an additional control, as it represents a well-understood thalamic nucleus with a highly distinct connectivity profile in comparison to the VPL and the MD nuclei. The LGN projects mainly to the primary visual cortex (Berman and Wurtz, 2008), providing a test for specificity of tDCS effects. We found that neither M1 tDCS nor DLPFC tDCS increased FC between LGN and primary visual cortices; however, decreases in FC between LGN and temporo-occipital cortices were witnessed. We speculate that the decreased FC possibly reflects modulation of the inferior temporal cortex, a region that resides beyond the temporo-occipital junction. The inferior temporal cortex is a key visual-processing structure (Sary et al., 1993), but is also believed to be a target of top–down modulation from prefrontal cortices (Malach et al., 2002; Miyashita, 1993). It is thus likely that application of tDCS to M1 or DLPFC regions had a top–down effect upon connectivity of LGN and temporo-occipital cortices. However, future studies are needed to establish the significance of this finding.
Active M1 tDCS versus active DLPFC tDCS
We adopted the approach of double disassociation to identify differential effects of M1 versus DLPFC stimulation. The approach helped us confirm the existence of known functional connections between M1-to-sensory and DLPFC-to-affective network domains. Active M1 tDCS modulated changes in FC between VPL and M1 and S1 (Fig. 8A), whereas active DLPFC tDCS modulated changes in FC between MD and DLPFC (Fig. 8B), validating previous findings (Boggio et al., 2008, 2009). The approach also helped us predict the existence of possible functional connections beyond the known M1-to-sensory and DLPFC-to-affective network domains. For instance, active DLPFC tDCS modulated changes in FC between VPL and M1 (Fig. 8B) and active M1 tDCS affected changes in FC between VPL and insula (Fig. 8A), demonstrating that stimulation of M1 and DLPFC share overlaps in influencing sensory and affective networks. Finally, the approach helped us determine network-specific distinctions of stimulation. Active M1 tDCS could not elicit any FC changes between MD and DLPFC and between MD and insula (Fig. 8A) suggesting its weak ability to modulate affective networks.
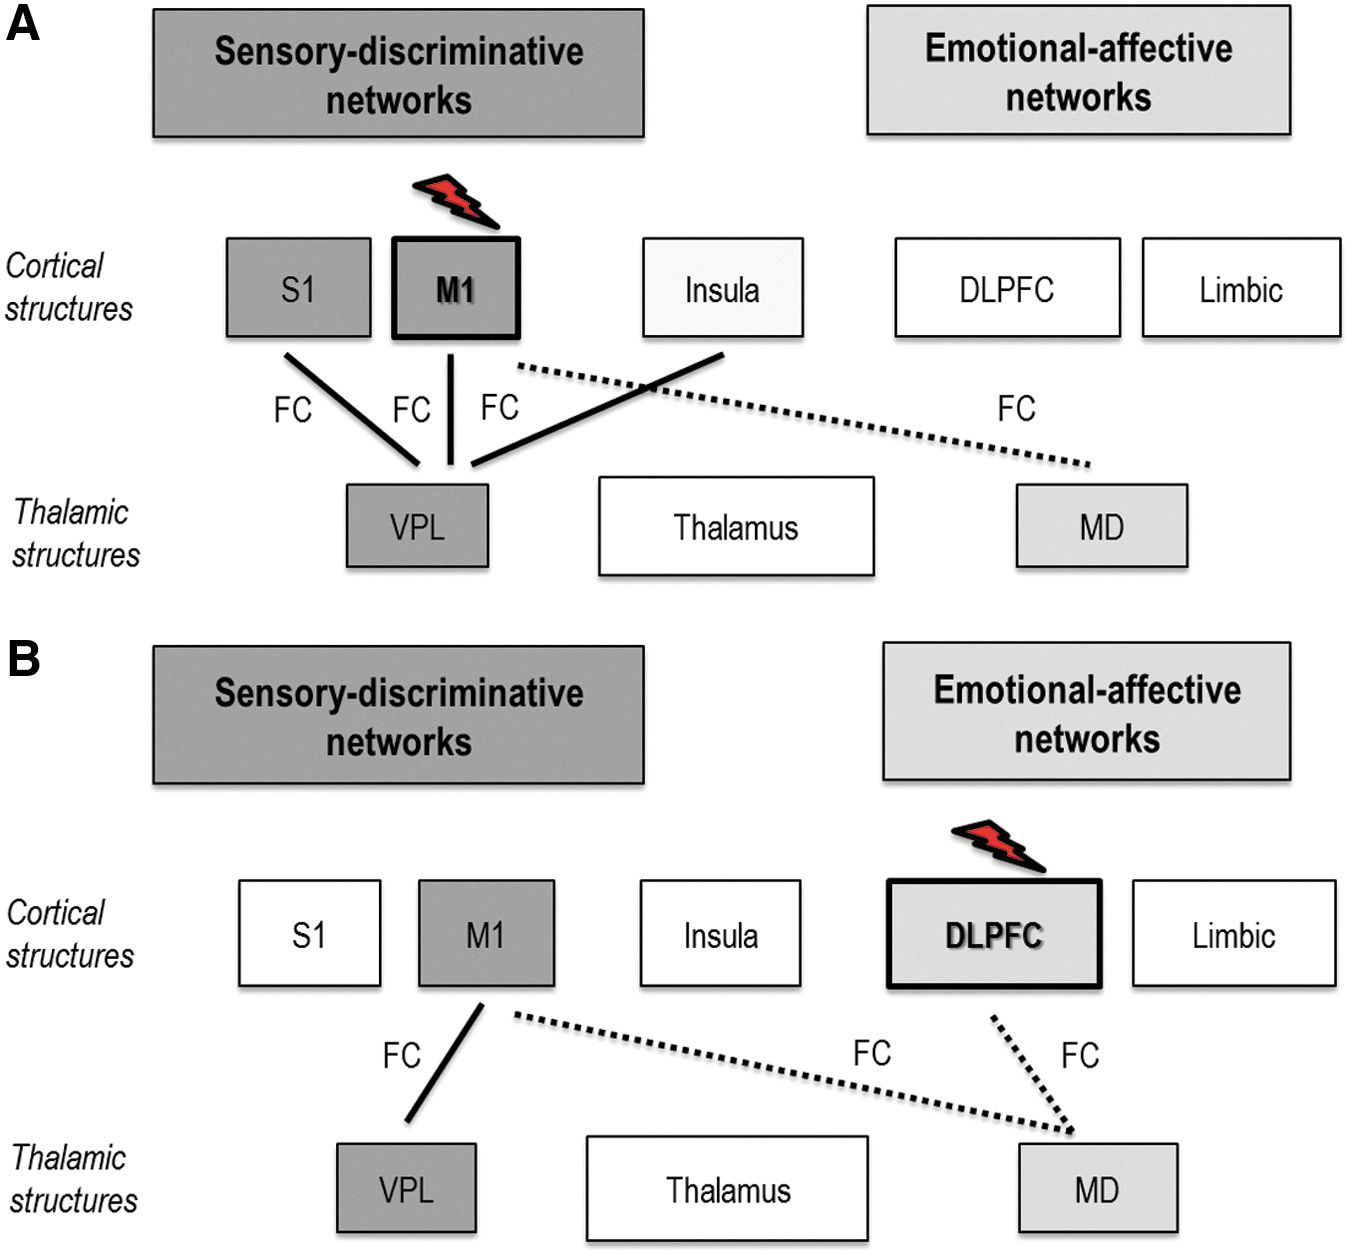
Differential effects of active M1 tDCS versus active DLPFC tDCS: Effects of
Although active M1 tDCS showed a robust influence across sensory networks, and active DLPFC tDCS showed a widespread influence across both sensory and affective networks, their differential effects were not statistically significant. The lack of significance is a weakness of this study and could be related to lack of adequate statistical power required for multiple tiers of analyses (tDCSPost-tDCSBaseline, active tDCS vs. sham, active M1 tDCS vs. active DLPFC tDCS). Lack of significance could also be related to the fact that analyses were restricted to thalamocortical networks rather than whole brain analyses, potentially limiting comparative analysis between M1 tDCS and DLPFC tDCS to a narrow spectrum of regions. Nonfocal effects of standard tDCS electrodes could also likely be responsible for lack of significant differences between M1 and DLPFC stimulation, although we took necessary steps to ensure that there was no anatomic overlap between the regions (refer subsection Procedures in Materials and Methods). Briefly, we used TMS to guide application of M1 electrode, stereotaxy to ensure accuracy in application of TMS, and accuracy in the repeated placement of M1 and DLPFC tDCS electrodes. We acknowledge, however, that electrodes over M1 and DLPFC were close to one another. Future studies could use high-definition tDCS (Datta et al., 2009) or adopt functional localization of DLPFC rather than follow the “5 cm” or “10–20” method to improve validity of comparisons between M1 and DLPFC (Bradfield et al., 2012; Kim et al., 2014).
Some methodological caveats should also be discussed. First, analyses were performed using a static approach to evaluate correlated activity between a single seed region and another connected region, restricting directionality of effect. However, our study is the first to investigate effects of tDCS upon resting-state FC changes across thalamocortical regions specific to sensory-affective information processing. Therefore, our design and analyses offers a template that can be modified in future studies to evaluate directionality and causal influences specific to the pain matrix, such as with Granger causality, effective connectivity analysis, or other approaches. Second, thalamic seeds are less commonly used than cortical seeds. Nonetheless, by localizing our thalamic seeds using anatomical landmarks, we ensured that the reliability of our measurements was not compromised. Studies that adopt functional MRI-based seeding approaches, as opposed to anatomical approaches, may choose to use thalamic seeds to improve localization. Third, due to design restrictions of the functional neuroimaging tDCS setup, pain measurements could not be collected immediately after tDCS. Since we were investigating for the first time, modulatory effects of tDCS on thalamocortical network connectivity specific to sensory-affective information processing, it was essential to acquire rs-fMRI scan immediately after tDCS to capture changes in FC. Given that this experimental model has been set up in the present study, we are now better prepared to collect behavioral, as well as neuroimaging, measurements in future to provide a more comprehensive view of effects of different applications of tDCS on pain and pain circuitry. Finally, the exploratory nature of our correlational analyses that suggests that individuals with high-baseline pain thresholds, that is, high pain tolerance, show greater changes in FC with DLPFC tDCS warrants validation in a larger cohort of individuals.
Conclusions
Our proof-of-concept study provides early neuroscientific evidence that suggests that M1 stimulation modulates FC of thalamocortical networks differently than DLPFC stimulation. While stimulating M1 mainly modulated FC of sensory networks, stimulation of DLPFC modulated FC of both sensory and affective networks. Notably, FC changes following stimulation of DLPFC correlated with individual pain thresholds, highlighting the role of DLPFC in pain modulation, particularly pain tolerance. Our findings when replicated in larger studies could provide useful evidence that may help differentiate between effects of M1 and DLPFC stimulation on pain experience.
Footnotes
Acknowledgment
This work was supported by the National Institutes of Health (1K01HD069504) awarded to E.B.P.
Author Disclosure Statement
A.G.M. has the following conflict of interests to disclose: consultant of functional neuromodulation at St. Jude; having distribution rights at Enspire, ATI, and Cardionomics; and having fellowship support from Medtronic.