
Abstract
Functional connectivity studies play a huge role in understanding the relationship between the network connections and the behavioral phenotype of patients with pervasive developmental disorders (PDD). Some patients with PDD may not be able to tolerate the imaging procedure while they are awake, and, hence, they often need general anesthesia. General anesthesia is a confounding factor in functional imaging studies due to its effect on the functional connectivity. The objective of this study is to look at the resting-state functional connectivity (RS-FC) under sevoflurane anesthesia in patients with PDDs. Thirteen adults with PDD scheduled for magnetic resonance imaging (MRI) of the brain under general anesthesia were recruited for the study. Resting-state functional MRI (fMRI) scans were acquired at 1 minimum alveolar concentration (MAC) of sevoflurane. Spontaneous blood oxygenation level-dependent fluctuations were measured, and a seed-voxel analysis was done to identify the resting-state networks. Subjects' data were compared with data from 16 nonanesthetized healthy controls. Six networks (default mode network [DMN], executive control network [ECN], salience network [SN], auditory, visual, and sensorimotor) were investigated. At 1 MAC sevoflurane anesthesia, RS-FC was preserved in all the networks. Secondary analysis of connectivity showed a decrease in connectivity within the thalamus and an increase in DMN-ECN and DMN-SN cross-network connectivity in the anesthetized patient group compared to healthy controls. Previous reports suggested that even mild levels of anesthesia could reduce overall fluctuation levels in the major brain. However, our results provide strong evidence that most networks can sustain detectable levels of activity in patients with PDDs even under deep levels of anesthesia.
Introduction
F
Pervasive developmental disorders (PDDs) refer to a group of disorders characterized by delays in the development of socialization and communication skills (Rutter and Schopler, 1992). Autism is the most characteristic and best studied PDD. Other types of PDD include Asperger's syndrome, childhood disintegrative disorder (CDD), and Rett's syndrome. They often have heterogeneous sets of symptoms and RS-FC studies play a huge role in understanding the relationship between the network connections and the behavioral phenotype of the disorder. Studies have shown both increased and decreased connectivity within resting-state networks in nonanesthetized patients with Autism (Abbott et al., 2016; Cerliani et al., 2015). Some patients with PDD need general anesthesia (GA) for MRI as they often have more severe behavioral problems. GA is a confounding factor during functional imaging studies due to its effect on functional connectivity (Boveroux et al., 2010) and to the best of our knowledge, RS-FC under anesthesia is not studied in patients with PDD. At the same time, changes in RS-FC with anesthesia is difficult to study, as obtaining MRI in the wakeful state may not be possible in these patients.
Anesthetic agents dependably and reversibly abolish conscious perception, an event for which the ultimate mechanism remains elusive (Bonhomme et al., 2012). In general, connectivity within the various networks is preserved under anesthesia. However, many studies have shown both decrease and increase in functional connectivity under anesthesia compared with a wakeful state (Boveroux et al., 2010; Jordan et al., 2013; Kiviniemi et al., 2005; Lu et al., 2007; Martuzzi et al., 2010; Peltier et al., 2005; Stamatakis et al., 2010). These results are, however, difficult to compare because of the differences in dosage, type of anesthetic agents used, and the brain networks investigated. In addition, other limitations in these studies include the use of healthy volunteers who were breathing spontaneously causing movement artifacts as well as the possibility of a nonsteady state of changing concentrations of anesthetic agents. Although many studies have taken appropriate measures to minimize these artifacts, they are still potential confounding variables that can have an effect on the cerebral blood flow and in turn the BOLD signals (Palanca et al., 2015).
The objective of this study was to look at RS-FC within the default mode, executive control, salience, and major sensory networks at 1 minimum alveolar concentration (MAC) of sevoflurane anesthesia in patients with PDDs. We hypothesized that similar to healthy volunteers, the RS-FC within the resting-state networks would be preserved in patients with PDD at 1 MAC of sevoflurane anesthesia.
Materials and Methods
Subjects
Our Institutional Research Ethics Board approved the study protocol (UHN-REB No. 12-0509-BE). The entire study protocol was reviewed with each subject and/or substitute decision-maker before informed consent was obtained. Thirteen adults (age >18 years) with PDD who were scheduled to undergo MRI of the brain under GA were included in the study. Our exclusion criteria included patients with structural loss of brain tissue (previous neurosurgical procedures, traumatic brain injury, and ischemic or hemorrhagic stroke). Data from a previous resting-state fMRI study of 16 nonanesthetized healthy control subjects (8 male; 40.6 ± 13.4 years old) with no history of neurological or psychiatric disorder were also included for comparison purposes.
Anesthesia management
All patients were seen in the preoperative anesthesia consult clinic before the procedure. Routine standard preparation of the patient for GA for MRI was carried out as per our institutional standards. Benzodiazepines and other sedative premedications were avoided. Patients had either an intravenous induction of anesthesia [propofol (2–4 mg/kg), fentanyl (1–2 mcg/kg), and rocuronium (0.6 mg/kg)] or inhalational induction [sevoflurane (8%) in oxygen followed by fentanyl (1–2 mcg/kg) and rocuronium (0.6 mg/kg)] depending on their level of cooperation. The patient's airway was intubated with an appropriately sized endotracheal tube and anesthesia was maintained with oxygen, air, and sevoflurane. All patients had standard monitoring [electrocardiography, noninvasive blood pressure, oxygen saturation, end-tidal carbon dioxide (ETCO2), and end-tidal concentration of sevoflurane] during the MRI.
After the anatomical scans were obtained, ∼1 h after induction of anesthesia, RS-fMRI scans were acquired in all patients at an end-tidal sevoflurane concentration of 2.1% (1 MAC). During the study period, ETCO2 was maintained between 36 and 40 mmHg and the blood pressure within 20% of the baseline value (as recorded in the anesthesia consult clinic). After the study, anesthesia was terminated and the patients were allowed to wake up and their tracheas were extubated. Once they were awake, they were transferred to the recovery room.
Functional data acquisition
fMRI scans were acquired on a 3 Tesla scanner (Signa HDxt; GE Healthcare, Milwaukee, WI) with an eight channel array head coil. RS-fMRI data were acquired using a T2*-weighted echo planar sequence with ASSET parallel imaging with the following imaging parameters: repetition time = 2 sec, echo time = 30 msec, flip angle = 85, field of view = 20 cm; 64 × 64 matrix with 3.125 × 3.125 mm2 in plane resolution; 28 trans-axial slices with 4 mm thickness; number of volumes = 154; and scan time 5:08 min. A high-resolution T1-weighted image was also acquired in each subject at the end of the whole experiment to enable transformation into standard Montreal Neurological Institute (MNI) space.
Seed-based RS-FC analysis
Most of the data analyses were performed using Analysis of Functional Neuroimages software package (Cox, 1996). The first three frames of the functional data were discarded to remove the transient approach to steady-state signal due to T1 effects. Frame-to-frame spatial linear registration was then used to correct for head motion and to generate six standard motion time courses (translations and rotations in the three orthogonal directions). Statistical Parametric Mapping software version 5 (SPM5) was used to segment the T1-weighted images into gray matter, white matter, and cerebrospinal fluid (CSF) partitions. The white matter and CSF masks were eroded at the spatial resolution of the functional data to reduce partial volume effects, and the collection of functional time courses from the voxels labeled by the resulting masks were imported into MATLAB, where principal component analysis was performed separately on the white matter and CSF data. Following the aCompCor method (Behzadi et al., 2007), for each of the white matter and CSF datasets, the time courses of the five components that together explained the most variance in the data were used in combination with the six head motion time-courses to regress out as many nonneuronal sources of BOLD signal modulation as possible, to minimize contamination on the final voxel-to-voxel correlations. The residual time courses were then filtered to retain only frequencies within a 0.01–0.1 Hz band.
Six networks were investigated, the default mode network (DMN), executive control network (ECN), salience network (SN), as well as the auditory, visual, and sensorimotor networks. Seed time courses were taken from spheres (radius 8 mm) centered on the following MNI coordinates: posterior cingulate cortex (PCC) (0 −42 39), medial prefrontal cortex (MPFC) (0 53 −3), left dorsolateral prefrontal cortex (DLPFC) (−42 33 21), right DLPFC (42 32 21), left parietal cortex (−52 −48 46), right parietal cortex (52 −48 46), anterior cingulate cortex (ACC) (2 18 40), left insula (−34 20 −2), right insula (34 20 −2), left thalamus (−12 −20 8), right thalamus (12 −20 8), primary auditory cortex (−40 −22 8), primary visual cortex (0 −84 8), and primary motor cortex (−34 −18 51).
For each seed taken separately, Pearson's correlation r-values were calculated between the seed time course and the time courses at each gray matter voxel. The r-values were transformed into Fisher z values, which are scaled by the Analysis of Functional NeuroImages analysis program to be approximately normally distributed with unity standard deviation, that is z = 0.5 ln ((1+r)/(1−r)) √(n−3), where n corresponds to the 147 frames used in the analysis. SPM5 was used to nonlinearly warp each subject's T1-weighted anatomic scan and, hence, each Fisher z map into standard MNI space.
For the DMN, ECN, and SN, we performed the secondary regions of interest (ROIs) analysis of within and between the networks using 8 mm sphere ROIs centered on all the main nodes for each network, plus left and right thalamus. ROI–ROI pairwise correlations were compared between the anesthetized patient group and the nonanesthetized healthy control group.
Statistical analysis
For each seed analysis, the Fisher z maps were averaged over the subjects, and a standard t-test was used to assess statistical significance. The resulting t statistic map was thresholded at t = 4.32 (p < 0.0005 uncorrected) to form spatial clusters. False positives were stringently controlled for multiple comparisons over the whole brain by displaying only clusters that exceeded a spatial extent threshold for pFWE < 0.05. Since these were large clusters that often contained a number of local peak values in Fisher z values, we tabulated the MNI coordinates of those peaks in Fisher z values that were >3 and were the largest values within their 10 mm neighborhood.
For the secondary analysis, the Fisher z values corresponding to ROI–ROI correlations within and between each network were averaged and then compared between the anesthetized patient group and the nonanesthetized healthy control group. The p-values correspond to the two-group t-test results for this difference in connectivity between anesthetic group and control group.
Results
A total of 21 patients were recruited in the study, and data from 8 patients were excluded due to structural brain abnormalities (2), changes in anesthetic concentration (2), incomplete scan (2), and loss of data (2). The data from 13 patients were included in the final analysis (8 men and 5 women, mean age 23 years). Autism was the most common presentation (8/13) followed by Rett syndrome (3) and CDD (2). Most of the patients (10/13) in our cohort suffered from seizure disorder. Demographic and anesthesia data are shown in Table 1.
ETCO2, end-tidal carbon dioxide; F, female; GA, general anesthesia; iv, intravenous; M, male; N, number; SD, standard deviation.
All six brain networks remained remarkably intact in subjects at 1 MAC anesthesia as measured using connectivity to a standard seed region (Figs. 1 and 2). Except for the DMN and SN, the functional connectivity of all other networks were analyzed using seed regions that were lateralized to the left hemisphere, yet, in all of these networks, robust connectivity in the expected regions of the right hemisphere was observed. We also performed equivalent analyses using homologous seed regions from the right hemisphere. These produced very similar results and are therefore not included for clarity of presentation.
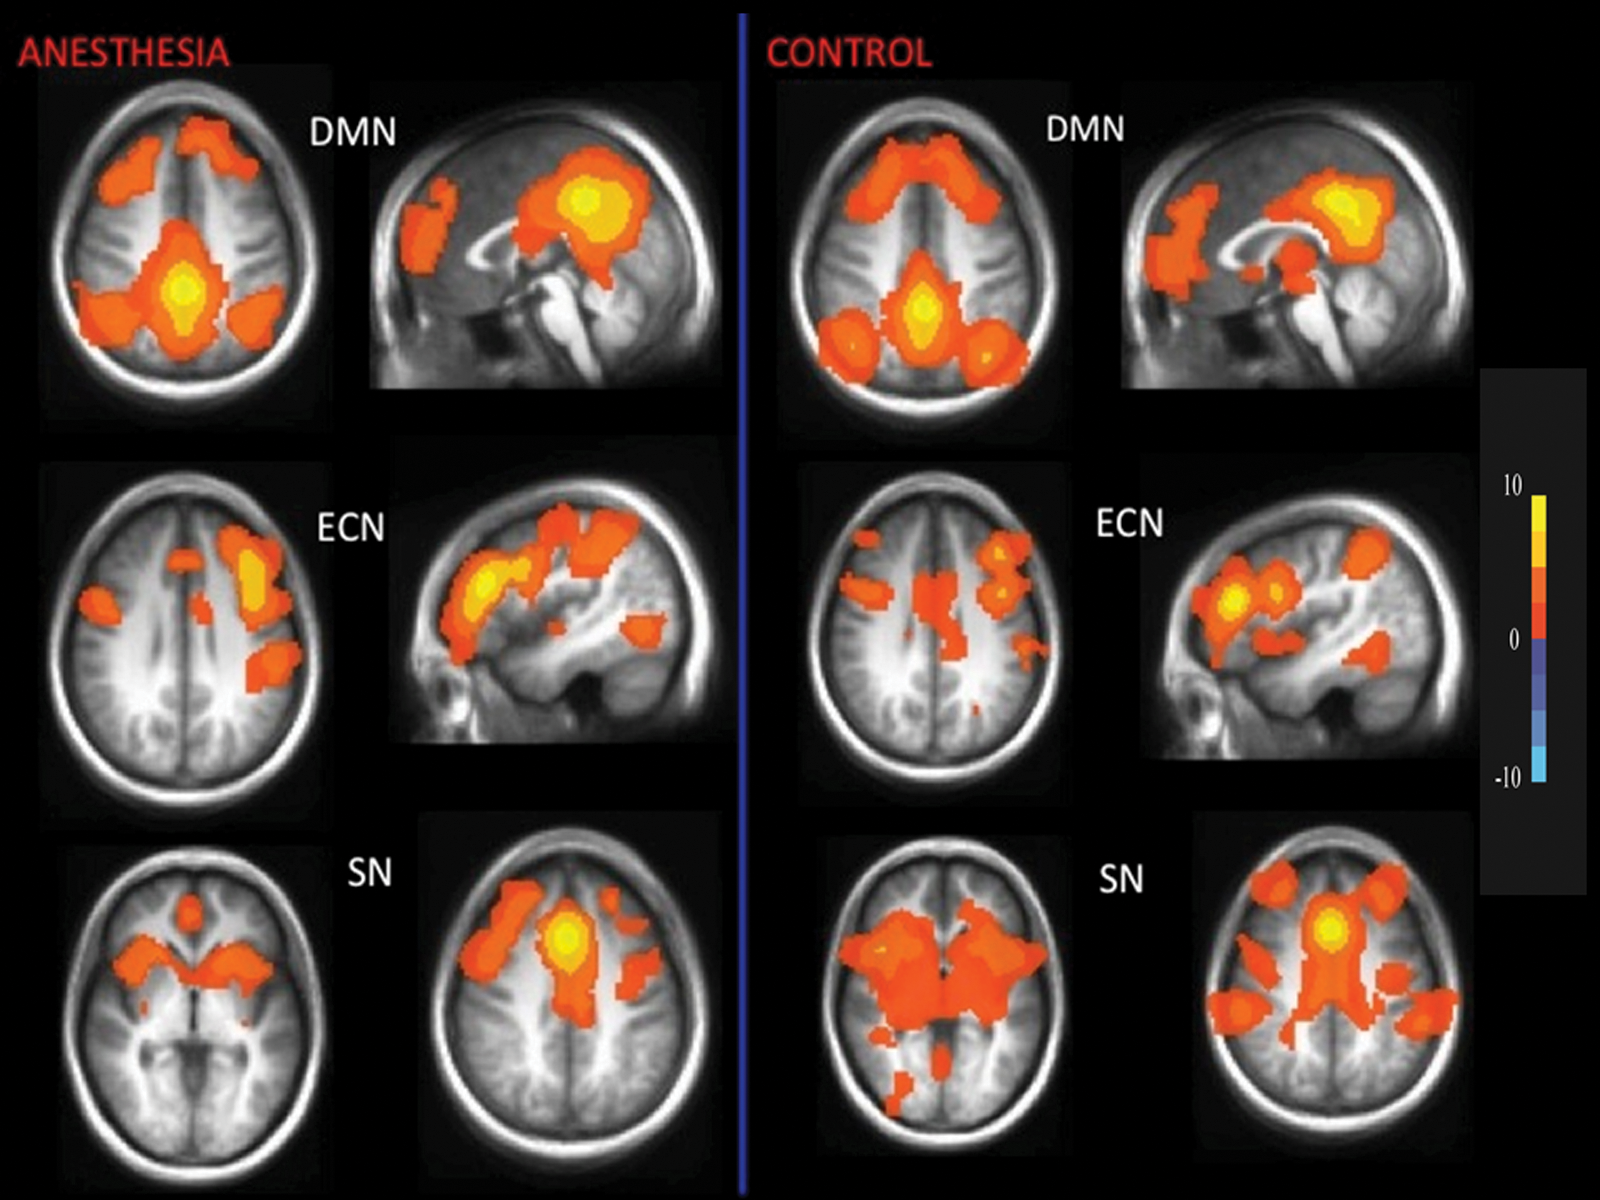
Robust resting-state networks exhibited by a group of subjects under 1 MAC sevoflurane anesthesia (left). Corresponding maps of healthy nonanesthetized controls are on the right. Each map represents the pattern of resting-state functional brain activity, averaged over subjects, that is correlated to a seed region representative of each network; DMN, ECN, and SN. Fisher z correlation values are color-coded according to the color bar. DMN, default mode network; ECN, executive control network; MAC, minimum alveolar concentration; SN, salience network.

Robust resting-state networks exhibited by a group of subjects under 1 MAC sevoflurane anesthesia (left). Corresponding maps of healthy nonanesthetized controls are on the right. Each map represents the pattern of resting-state functional brain activity, averaged over subjects, that is correlated to a seed region representative of each network; auditory, visual, and motor networks. Fisher z correlation values are color coded according to the color bar.
For the DMN, we identified connectivity in the PCC/precuneus, MPFC, middle temporal, and parahippocampal gyrus (Table 2). For the ECN, middle frontal and lateral parietal cortex showed high connectivity with the DLPFC seed (Table 3). For the SN, insula, medial, superior, middle prefrontal cortex, and supplementary motor area showed connectivity with the ACC seed. For the auditory and visual networks, insula and cuneus showed connectivity, respectively (Table 4). Precentral gyrus and medial frontal lobe areas showed significant correlations for the motor network.
ACC, anterior cingulate cortex; L, left; MNI, Montréal Neurological Institute; MPFC, medial prefrontal cortex; PCC, posterior cingulate cortex; PHC, parahippocampal cortex; R, right.
DLPFC, dorsolateral prefrontal cortex; SMA, supplementary motor area; SN, salience network.
The results of the secondary analysis of within and between network connectivity in the anesthetized patient group and the nonanesthetized healthy control group are shown in Tables 5 and 6. Over the 10 network-to-network comparisons, three showed a statistical significance, namely a reduction in connectivity within the thalamus (i.e., between the right and left thalamus ROIs) for the anesthetized patient group, and an increase in DMN-ECN and DMN-SN cross-network connectivity in this group compared with the healthy nonanesthetized control group.
Data represent mean Fisher z scores.
Statistically significant values are highlighted in bold font.
Two sided p-values.
DMN, default mode network; ECN, executive control network.
Data represent mean Fisher z scores for all node pairs, for example, all DMN-ECN node pair. Values are presented as anesthesia, control (two-sided p-values).
Statistically significant values are highlighted in bold font.
Discussion
To our knowledge this is the first study that has looked at functional connectivity changes within the major resting-state networks in patients with PDDs under full surgical anesthesia. Our study provides strong evidence that these networks can sustain detectable levels of activity under deep levels of anesthesia. GA is a confounding factor during functional imaging studies due to its effect on the functional connectivity (Boveroux et al., 2010). In general, functional connectivity in low-level sensory cortical networks is preserved under anesthesia, while many studies have shown a decrease in functional connectivity in higher order brain networks namely DMN, ECN, and recently the SNs (Bonhomme et al., 2012; Boveroux et al., 2010; Guldenmund et al., 2013; Uhrig et al., 2014). In our study, both the low-level sensory networks and the higher order networks (DMN, ECN, and SN) clearly remained remarkably robust under deep levels of anesthesia.
Previous studies have shown that patients with autism spectrum disorders (ASD) have an atypical network organization (Abbott et al., 2016). Functional connectivity studies in patients with ASD have shown conflicting results. While the majority of studies have shown a decrease in cortico-cortical connectivity across many networks (Doyle-Thomas et al., 2015; Washington et al., 2014; Weng et al., 2010), a recent study has shown an increased connectivity between subcortical and cortical resting networks, including DMN and ECN networks (Cerliani et al., 2015). In addition, it has been suggested that there is a link between the connectivity pattern and the behavior and the symptoms of the patient (Cerliani et al., 2015). However, Nomi and Uddin (2015) have recently looked at developmental changes in large-scale network connectivity in autism. They found that children (<11 years) with ASD exhibit hyperconnectivity, while adolescents and adults with ASD show no within or between network differences in functional network connectivity compared with normal age matched individuals (Nomi and Uddin, 2015). This might explain the results of this study that resting-state networks are still robust under full surgical plane of anesthesia in adolescent and adults with PDD.
The difference between our study finding and that of the previous studies may be explained on the basis of the differences in the depth of anesthesia and the patient population studied. In this study, we looked at the resting-state connectivity at a level of surgical anesthesia (1 MAC or alveolar concentration of 2%), which is generally defined as loss of ability to respond to rousing shakes or painful stimuli (Brown et al., 2010). In addition, all patients received neuromuscular blocking agents for mechanical ventilation and the values of both PaCO2 (partial pressure of CO2 in the arterial blood) and the blood pressure were also maintained at baseline levels (Wise et al., 2004). Furthermore, fMRI data were acquired at the end of clinical MRI data acquisition after a steady state of anesthesia was achieved.
In a recent study, Ranft et al. (2016) looked at neural correlates of sevoflurane induced unconsciousness in healthy volunteers using simultaneous fMRI and electroencephalography. Similar to previous studies, they also found a decrease in frontal and thalamocortical connectivity with sevoflurane at alveolar concentration of 2% and 3%. However, other networks namely parietal, posterior default mode, sensory, and primary auditory networks showed a significant decrease in connectivity only at supra-MAC (≥3%) of sevoflurane. This is in agreement with our study, where most of the networks can sustain detectable levels of activity under level of surgical anesthesia.
Recently, Palanca et al. (2015) have shown that motion artifact is a common confounding variable in fMRI studies involving anesthetic agents, and this leads to spurious results if not addressed. They showed that sevoflurane (1.2%) causes a reduction in intracortical and thalamocortical FC with preserved connectivity between PCC and lateral parietal regions. In addition, without motion censoring sevoflurane effects on FC were obscured. In this study, we used motion covariates and the aCompCor technique to regress out as many nonneuronal sources of correlations as possible from the raw data (Behzadi et al., 2007). In addition, the use of neuromuscular blocking agents in this study has not only minimized movement artifacts but also decreased the proprioceptive afferentation to the brain. This might further reduce the neuronal sources of BOLD fluctuations, which could in principle artificially boost the network correlations observed under anesthesia. Furthermore, compared with previous studies, the vasodilation produced by the higher concentrations (2.1%) of sevoflurane used in this study could also have influenced the cerebral blood flow and the BOLD signal. Thus, the differences in our results compared with previous studies can be due to the above mentioned differences in the study population and the anesthetic techniques. In any case, the brain networks clearly remained remarkably robust under deep levels of anesthesia even in comparison with healthy nonanesthetized controls.
In healthy nonanesthetized controls, we found that the DMN and ECN were uncorrelated. Boveroux et al. (2010) applied a global signal covariate in their analysis, which has since been demonstrated to result in the observation of increased anticorrelated behavior. With propofol anesthesia, they noted a decrease in these anticorrelations observed between the DMN and ECN in the awaken state. Starting from the uncorrelated DMN-ECN behavior in our controls, we observe a very significant positive correlation in our anesthetized patient group, somewhat analogous in direction to the results of Boveroux et al. (2010). We also observe a DMN-SN cross-network connectivity in the anaesthetized patient group that does not exist in the control group, whereas a modest ECN-SN connectivity is observed equally in both groups.
Despite the widespread use of FC-fMRI to investigate the connections across brain regions, the origin of these phase-locked BOLD low-frequency oscillations remains unclear (Wang et al., 2012). In particular, the question as to whether FC-fMRI reflects a specific intrinsic (i.e., unrelated to consciousness) property of brain organization or is more related to the conscious state remains unanswered. The hypothesis that FC-fMRI is a characteristic of brain organization that goes beyond consciousness is supported by the finding that coherent DMN connectivity has been observed in patients in a vegetative state and in unresponsive wakefulness syndrome (Boly et al., 2009). A previous study in nonhuman primates showed that functional connectivity remains preserved even at deep levels of anesthesia (Vincent et al., 2007). This suggests that the DMN may not be a strict reflection of conscious mental activity, and there are indications that the role of the DMN in consciousness is highly complex (Liu et al., 2014).
Limitations
Our study has limitations. Since the patients required deep levels of anesthesia to undergo a clinical MRI scan, the study design did not allow for the availability of a control state (awake). However, we compared the data from study subjects with a nonanesthetized healthy control group. First, we did perform the voxelwise comparison but did not find any significant difference in seed-to-voxel maps between anesthetized patients and healthy controls. This might be due to smaller sample size. Hence, we performed the more ROI-ROI analysis and reported the differences in global connectivity within a network. Second, we looked at the resting networks at only one anesthetic concentration (1 MAC), and hence, this static picture may not actually reflect the dynamic changes in the connectivity with changing anesthetic concentration. Hence, one needs to exercise caution in interpreting these results. Third, our study population was quite heterogeneous with a majority of patients suffering from autism and even in these patients the clinical presentations were not uniform. Finally, the use of other drugs, namely the induction dose of propofol, opioids, and the muscle relaxants, might have influenced the results. However, our study data were obtained at the end of the clinical MRI scanning, ∼1 h after the induction of anesthesia. Hence, the effect of these drugs on the connectivity pattern was probably minimal. We could have avoided this by performing the whole procedure with sevoflurane alone, that is, inhalational induction followed by maintenance with sevoflurane using a laryngeal mask airway. However, the nature of the study population dictated different anesthetic techniques, including the need for intubation.
Conclusion
Initial reports have suggested that even mild levels of anesthesia can reduce overall BOLD signal fluctuation levels in major brain networks such as the DMN and ECN. However, our results provide strong evidence that these networks can sustain detectable levels of activity in patients with PDDs even under deep levels of anesthesia. Further studies are needed to confirm these early findings.
Footnotes
Acknowledgment
The authors thank the magnetic resonance imaging technologists at Toronto Western Hospital for their contribution to the data acquisition.
Authors' Contributions
L.V.: study design, protocol development, data collection, analysis, and writing up the article; V.W.: study design, protocol development, data collection, and article preparation; S.B.: data analysis and article preparation; A.P.C.: study design, study analysis, writing up the article; A.T.: patient recruitment, data collection; M.J.: data collection and data analysis; and D.J.M.: study design, development of methodology, and article preparation.
Author Disclosure Statement
No competing financial interests exist.