
Abstract
Healthy aging has been associated with a global reduction in white matter integrity, which is thought to reflect cognitive decline. The present study aimed to investigate this reduction over a broad range of the life span, using diffusion tensor imaging analyzed with conditional inference random forest modeling (CForest). This approach is sensitive to subtle and potentially nonlinear effects over the age continuum and was used to characterize the progression of decline in greater detail than has been possible in the past. Data were collected from 45 healthy individuals ranging in age from 19 to 67 years. Fractional anisotropy (FA) was estimated using probabilistic tractography for a number of major tracts across the brain. Age coincided with a nonlinear decrease in FA, with onset beginning at ∼30 years of age and the steepest declines occurring later in life. However, several tracts showed a transient increase before this decline. The progression of decline varied by tract, with steeper but later decline occurring in more anterior tracts. Finally, strongly right-handed individuals demonstrated relatively preserved FA until more than a decade following the onset of decline of others. These results demonstrate that using a novel, nonparametric analysis approach, previously reported reductions in FA with healthy aging were confirmed, while at the same time, new insight was provided into the onset and progression of decline, with evidence suggesting increases in integrity continuing into adulthood.
Introduction
In recent years, the number of diffusion tensor imaging (DTI) studies investigating white matter integrity decline in healthy aging has been growing steadily. This is underpinned, among other things, by the fact that seniors are now the fastest growing age group around the world, and concomitantly many countries are experiencing a reversal of their population pyramid. Gaining a better understanding of how white matter integrity changes over time will be beneficial in terms of contributing to the mitigation of the healthcare challenges associated with such a reversal.
Indeed, the cost of healthcare is projected to increase by over 80% between 2005 and 2020, while the workforce is expected to decrease by 10% in the same time frame (Certified General Accountants Association of Canada, 2005). The goal of the present work was to gain a better understanding of age-related white matter decline in healthy adults aged across a broad range of life span, from 19 to over 65, using a novel approach to data analysis.
Healthy aging has been strongly associated with (among other things) a global reduction in the integrity of white matter tracts in the brain (Bennett et al., 2010; Nusbaum et al., 2001; Salat et al., 2005; Sexton et al., 2014; Sullivan et al., 2001). This process is thought to be related to demyelination of white matter tracts and may reflect cognitive decline (Song et al., 2002). DTI allows for in vivo evaluation of restrictions on water molecule displacement imposed by microstructure (i.e., cell membranes, myelin sheaths, and microtubules) (Jones et al., 2012), which is commonly interpreted as a proxy for tract integrity (Kraus et al., 2007; Madden et al., 2011).
The most common DTI summary measure is fractional anisotropy (FA), which reflects the extent to which diffusion within a local area (i.e., voxel) occurs preferentially in one direction (anisotropic diffusion), rather than equally in all directions (isotropic diffusion) (Pfefferbaum et al., 2000). FA is associated with tract integrity because myelinated axons channel water diffusion parallel with the direction of the axons, while demyelination will allow greater diffusion in other directions.
FA has been shown to decline with age in numerous tracts, including the corpus callosum, internal and external capsules, dorsal cingulum, and frontal, parietal, and occipital white matter regions (Bennett et al., 2010; Burzynska et al., 2010). While numerous studies suggest that FA declines with age across the brain, its progression has not been clearly defined. Beyond knowing that FA declines with age, whether this is a steady, linear decrease, or whether nonlinearities exist, is of interest. The present study investigated FA decline in healthy adults, adults across a wide age range, and across nine tracts (seven bilaterally); also included in this study was whether sex and/or handedness modulated any decline.
Decline in white matter tract integrity is well established: older individuals show reduced FA globally in comparison with younger ones. Decline was first noted in periventricular and frontal white matter regions, as well as the genu and splenium of the corpus callosum (Nusbaum et al., 2001), although it was later found to vary across brain regions. In particular, decline was found to be strongest in frontal white matter, while remaining relatively preserved, but still showing a reduction in more posterior tracts (Raz, 2000; Salat et al., 2005).
This gradient is also evident along the anterior–posterior axis of the corpus callosum (Bennett et al., 2010). The finding of a gradient of susceptibility to FA decline has since been replicated and linked to reductions in processing speed and recall accuracies (Bennett et al., 2010). Furthermore, decline does not appear to be consistent, with older adults showing steeper FA decline at a 1-year follow-up examination than younger ones (Sexton et al., 2014).
Studies of white matter changes with aging commonly dichotomize participants into predefined age groups (Bennett et al., 2010; Davis et al., 2009, 2012; Hsu et al., 2010; Rathee et al., 2016; Salat et al., 2005). For example, Bennett and colleagues (2010) compared young participants aged 18–20 years to older adults aged 63–72 years. The advantage of this is increasing within-group homogeneity, allowing estimation of the variance across individuals within a relatively narrow age range while reducing the overall number of participants required in the study.
Although such dichotomization may have advantages, it is important to recognize that such a practice can lead to a substantial loss of information. Clearly, picking two groups widely separated in age can identify the existence of a difference, but provides no information as to how such changes progress. Furthermore, dichotomization can be subject to bias (e.g., determining what age span each bin covers) and can, in principle, increase the probability of finding spurious associations if the split points do not align with the actual distribution of values in the population (Cohen, 1983; MacCallum et al., 2002).
Applied to DTI studies of aging, dichotomization is unable to identify the nature of the pattern of change in FA with age—whether it is a steady, linear decline or a nonlinear shape (such as relative stability for a period of time followed by more rapid decline). One approach to this question is correlation (linear regression). However, assuming linearity when it does not hold may further lead one to overlook important structure in the data, to erroneously conclude that there is no relationship between two variables, and to underestimate the strength of the relationship between a dependent and an independent variable (Sahai and Ageel, 1997; Tremblay and Newman, 2015). Given the importance of properly characterizing age-related decline in white matter integrity, as stressed by Sexton and associates (2014), a statistical model that is sensitive to different possible patterns of change with age is needed.
The alternative to dichotomization is to model age as a continuous variable, without assuming that it exhibits a linear relationship with FA. A general linear model (GLM) allows for the specification of age as a continuous variable, and extensions to the GLM can model nonlinear relationships between continuous variables (Tremblay and Newman, 2015) (e.g., nonlinear regression or generalized additive mixed modeling) (Wood, 2006).
One characterization of age-related decline used locally weighted polynomial regression to fit FA decline using quadratic functions (Westlye et al., 2009). Notably, this method allows for variation in fit across tracts and flexible characterization of FA changes with age. However, even nonlinear regression approaches can be affected by non-normally distributed model residuals, and DTI is known to systematically produce non-normally distributed data (Jones et al., 2005; Marenco et al., 2006). Furthermore, much of what is known regarding age-related FA decline comes from studies that have used these types of parametric modeling techniques, despite potential concerns (Davis et al., 2009, 2012; Salat et al., 2005; Sasson et al., 2013). In light of this, it will be important to corroborate these findings using nonparametric modeling techniques.
Given the aforementioned requirements and limitations, conditional inference random forest modeling was used (CForest) (Breiman, 1996, 2001; Hothorn et al., 2006; Strobl et al., 2009) to characterize the time course of age-related changes in DTI measures. The CForest approach has several notable benefits. These include the capability to adequately model data exhibiting a non-normal (i.e., nonparametric) distribution, improved robustness to noise, protection against over-fitting, attenuation of random effects, and better detection of small but significant effects (Grandvalet, 2004; Strobl et al., 2009). The CForest approach encompasses the notions of conditional inference regression trees (CTree) (Hothorn et al., 2006), bagging (Breiman, 1996, 2001; Strobl et al., 2009), and variable preselection (Strobl et al., 2009).
Briefly, conditional inference regression trees are nonparametric models that recursively partition data into nodes and branches by way of hypothesis testing. The steps include taking a random subset of the data (bagging) and determining which partitioning of the data (i.e., splitting along one of the independent variables) explains the most (and a statistically significant amount of the) variance in the data. This same process is then applied to each subset of the data defined by the first split, growing a “tree” of bifurcations of the data until no further splits yield significant differences.
A distribution of model-predicted values is created by iterating this process over a large number of trees with randomized subsets of data. Detection of small but significant effects is aided using variable preselection, through which the variables whose association with the data is tested are randomly selected for each partition. These steps are explained in greater detail in the Materials and Methods section as well as in the citations provided above.
The present study quantified white matter tract integrity using probabilistic tractography. While nonprobabilistic tractography uses the eigenvectors of diffusion to find connections between disparate regions of interest, probabilistic tractography builds on this approach by adjusting known tract positions to individual diffusion vectors. This method allows for detection of crossing fibers and individual differences in tract location or orientation (Behrens et al., 2007; Parker et al., 2003). FA values were calculated in this manner for modeling using CForest.
The present study aimed to demonstrate the applicability of CForest analysis to DTI data in the context of characterizing patterns of age-related decline in FA within a set of clearly defined white matter pathways. It was hypothesized that age would be negatively associated, in a nonlinear manner, with FA in all tracts. More specifically, FA values would decline with increasing magnitude as age increased, and that the rates of decline would vary by tract. As noted above, an anterior–posterior gradient of susceptibility has been demonstrated previously; this gradient was predicted to be evident in the genu and splenium of the corpus callosum due to their clear segregation on the anterior–posterior gradient, in accordance with previous findings (Bennett et al., 2010). This was hypothesized to manifest as a greater magnitude of decline in the genu than the splenium.
In addition to age, sex and handedness were included as predictors in the models. These readily obtainable variables have been shown to affect FA (Büchel et al., 2004; Pal et al., 2011). Consistent with prior studies, males were expected to show higher FA than females for frontal and occipital tracts (in our selection, this included the inferior longitudinal fasciculus, uncinate fasciculus, arcuate fasciculus, anterior thalamic radiations [ATR], and the genu) (Pal et al., 2011) as well as the cingulum (Menzler et al., 2011; Westerhausen et al., 2003, 2004).
It was further predicted that if age interacted with sex and/or handedness, this would take the form of more rapid rates of decline in tracts that were larger in younger adults. In other words, sex- and handedness-related differences would be attenuated with increasing age. In addition to the fact that including these variables was expected to increase the proportion of variance explained in the models, our motivation for including them was to demonstrate how combinations of continuous and inherently dichotomous variables are handled in a CForest analysis of DTI data.
Materials and Methods
Participants
Data were collected from 45 healthy individuals (23 male). This included 31 strongly right-handed (15 male) participants, and a single left-handed male, using a laterality quotient threshold of ±80% with the Edinburgh Handedness Inventory (Oldfield, 1971). Participants on average had 16.9 years of education (SD = 4.1). All participants had no self-reported history of traumatic brain injury, epilepsy, alcohol/substance abuse, or neurological problems. Participants ranged in age from 19 to 67 years (mean: 40, SD: 13). The participant age distribution is shown in Table 1. Each participant was given a complete description of the study and provided written informed consent. Study procedures were reviewed and approved by the Capital District Health Authority Research Ethics Board (Halifax, NS).
Distribution of Participants by Sex and Age
Data acquisition
Data were acquired using a GE 1.5T MRI scanner using a gradient-echo, echo planar pulse sequence. Diffusion-weighted images were collected using the following parameters: 60, 3 mm thick axial slices; TR = 8.5 sec; TE = 80–90 msec; flip angle = 90°; 54 noncollinear diffusion weighting directions with a b-factor of 1000 sec/mm2; one acquisition with a b-factor ∼0 sec/mm2; 128 × 128 acquisition matrix; 260 mm FOV, producing a voxel size of 2.03 × 2.03 mm in-plane. A T1-weighted structural scan was acquired from each participant using an SPGR pulse sequence with a 256 × 256 matrix, with 162 slices at a 1 mm isotropic resolution, TR = 11.3 sec; TE = 4.2 msec; flip angle = 20°.
Probabilistic tractography
Preprocessing and probabilistic tractography were completed using TractoR version 2.6.2 (Clayden et al., 2011), within R version 3.1.3 (R Core Team, 2013). The volume with minimal diffusion weighting (b = 0) was identified and used as an anatomical reference. Diffusion-weighted volumes were coregistered, nonbrain tissue was removed, and eddy current-induced distortions were corrected using FSL software (Andersson and Sotiropoulos, 2016; Jenkinson et al., 2002; Smith, 2002). Visual inspection was used to confirm data quality and to ensure that no gross structural defects were evident in either the diffusion or T1-weighted anatomical images. No data sets had head motion outside of accepted ranges (2 mm).
FA values were calculated at each voxel that was estimated to fall within each given tract. Diffusion tensors were fit allowing two fibers per voxel (Behrens et al., 2007). Model-based segmentation of various white matter tracts was completed (Clayden et al., 2007), with model fitting and tract identification occurring within the same diffusion-weighted image (Clayden et al., 2009). Tracts investigated included the genu and splenium fibers of the corpus callosum, and in each hemisphere the arcuate fasciculi, dorsal cingulum, ventral cingulum, ATR, corticospinal tracts (CST), inferior longitudinal fasciculi (ILF), and uncinate fasciculi. FA values were calculated at each voxel within these tracts using TractoR.
Conditional inference random forest analysis
Conditional inference regression trees
Conditional inference regression trees are nonparametric models that recursively partition data into nodes and branches by way of hypothesis testing. The CTree algorithm implements the following steps (Hothorn et al., 2006).
(1) Global Null Hypothesis (Stop Criterion). Determine whether a partition should be split by testing the global null hypothesis of independence between observations in that partition and all predictor variables. If the null hypothesis cannot be rejected, the partition is not divided further. Statistical tests are performed using the permutation testing framework developed by Strasser and Weber (1999).
(2) Variable Selection. If the null hypothesis is rejected, select the predictor variable with the strongest association (i.e., the smallest p value).
(3) Best Split Point. Compute the absolute value of the test statistic for every possible split, and partition the data at the split point with the largest statistic.
(4) Repeat. Repeat steps 1–3 on the two newly created data partitions until the global null hypothesis cannot be rejected.
For an in-depth discussion of these steps, Hothorn and associates (2006) should be read, as well as Strasser and Weber (1999) for a discussion of the permutation testing framework used. The model results in a series of split points, which segregate piecewise-constant data segments along a variable of interest, as shown, for example, in Figure 1. Using this method, the model tract × age × sex × handedness was fitted to the unaveraged, voxelwise FA values derived from probabilistic tractography. The criterion to reject the null hypothesis at each node was set to α = 0.05, where probability values were Bonferroni corrected for multiple tests.
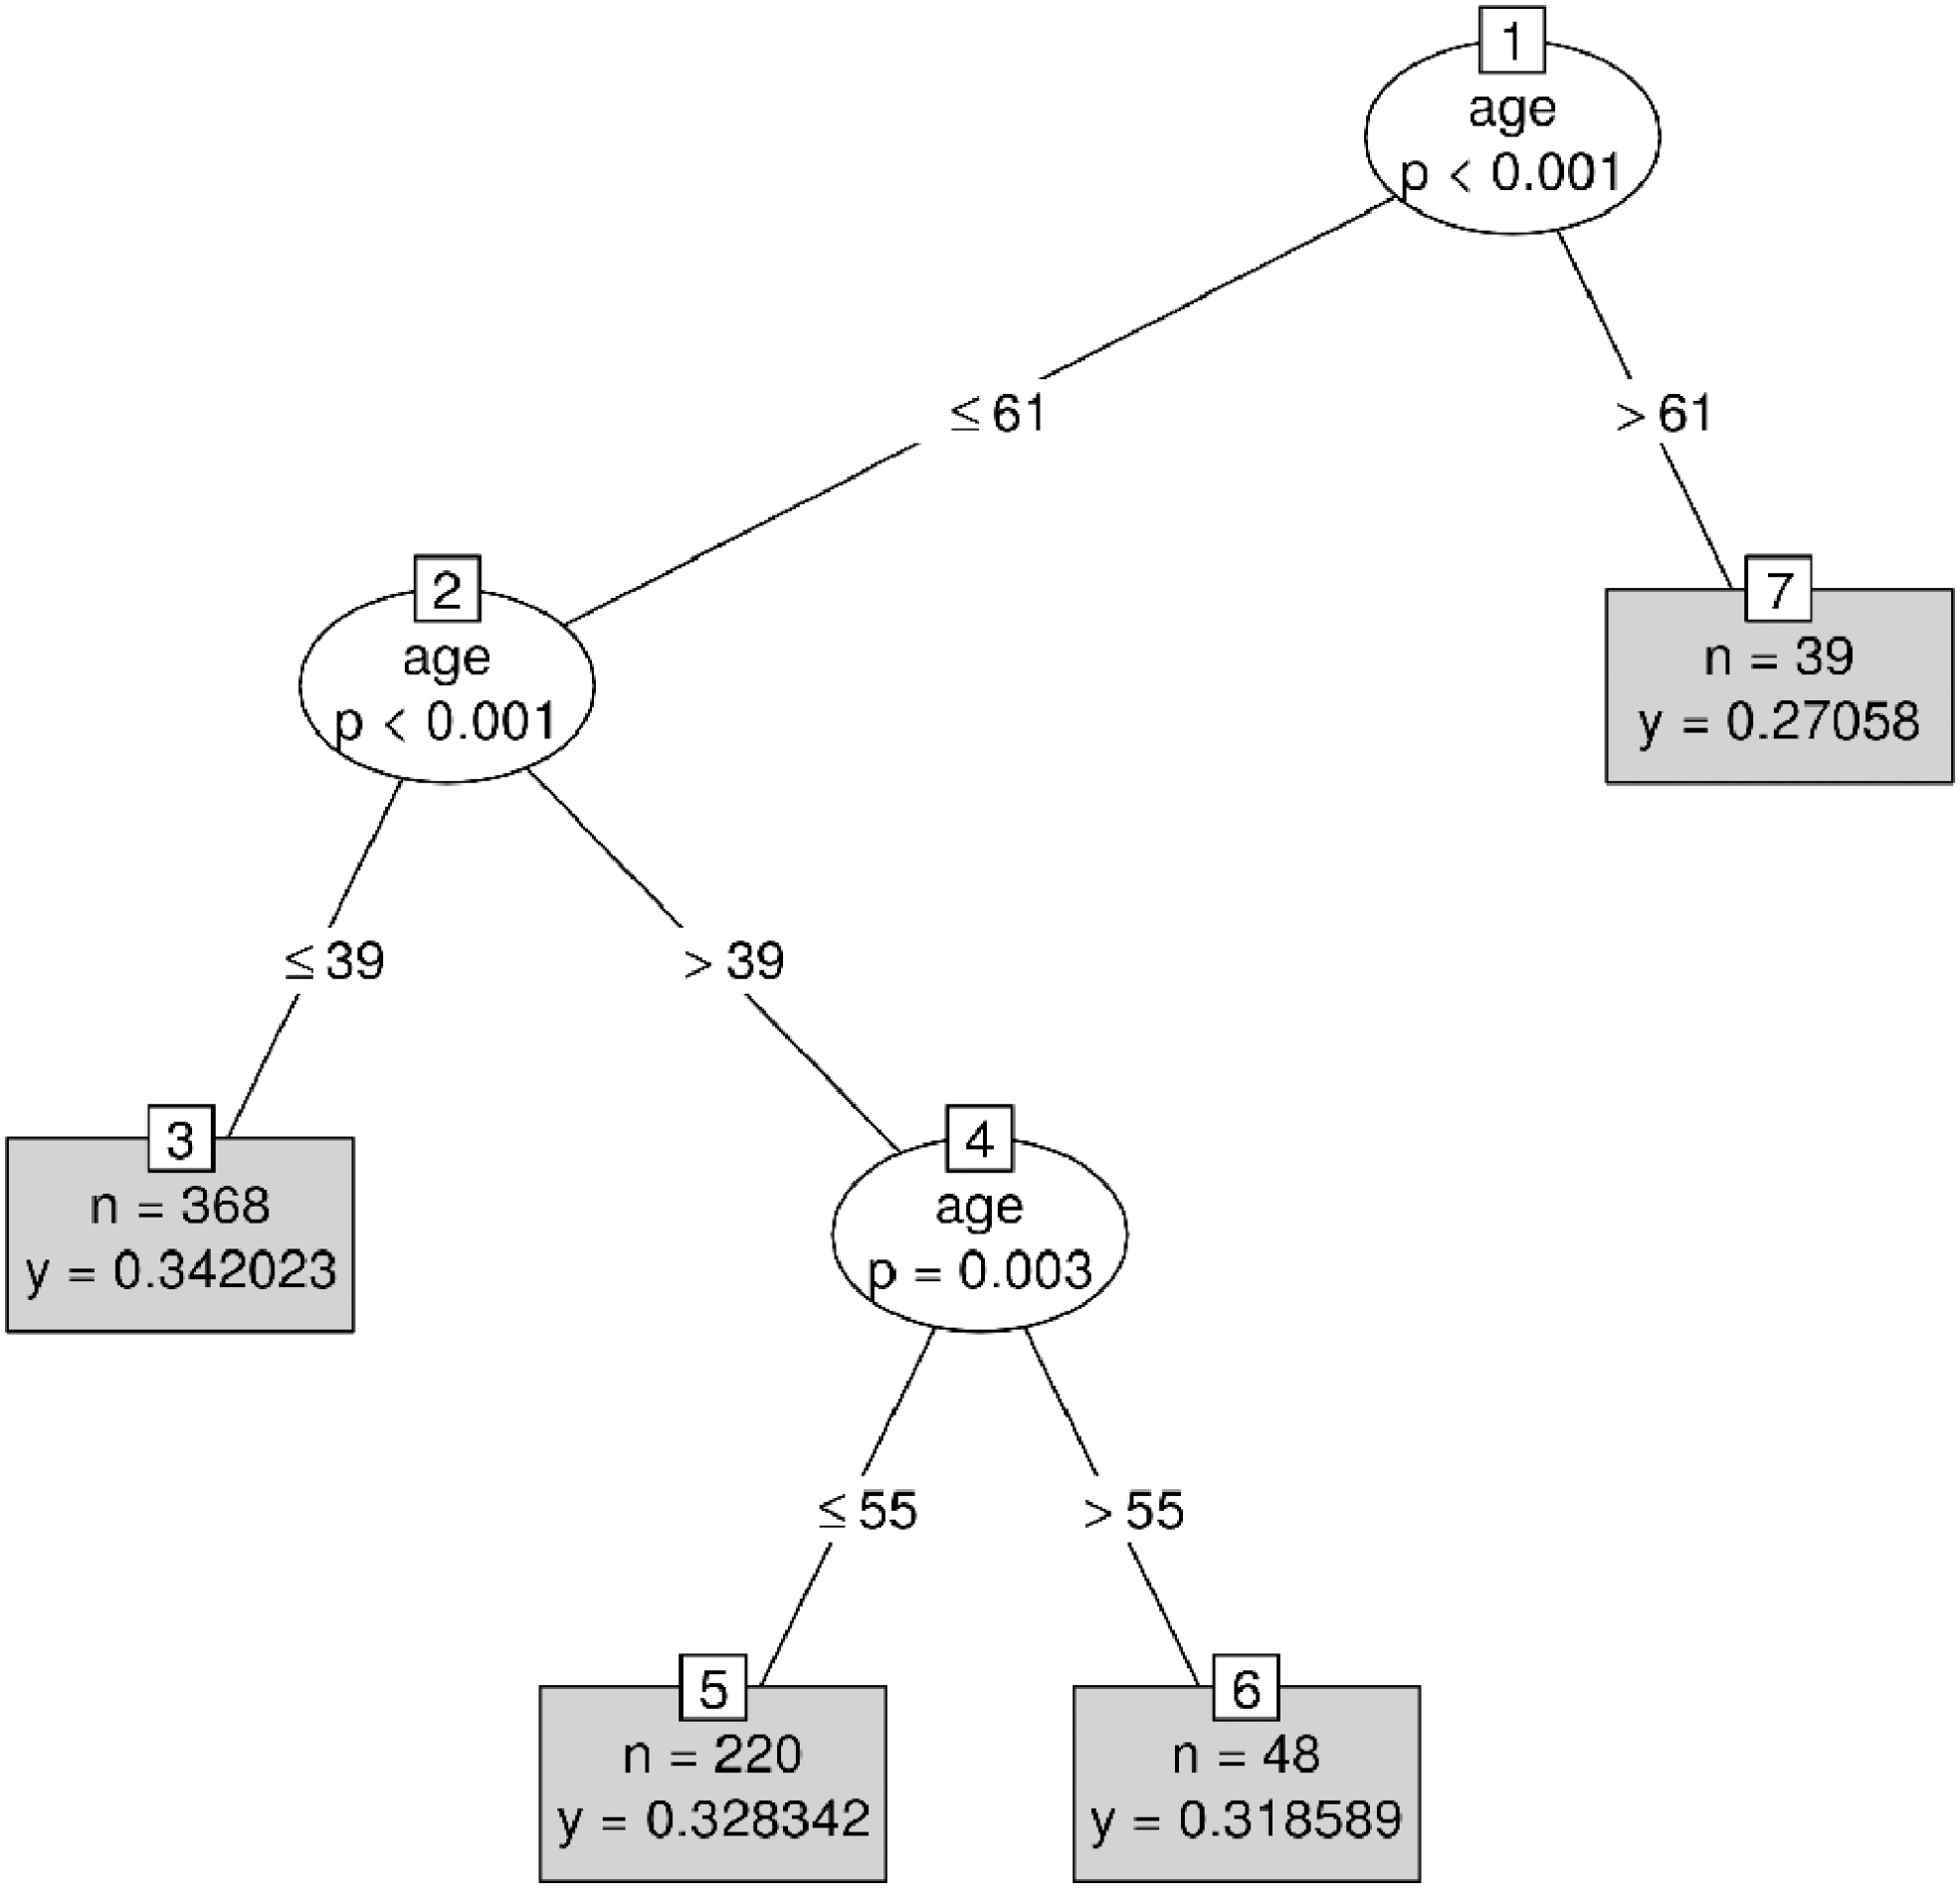
A tree representation of the model-derived FA values as a function of age. Ovals represent tree nodes, where node numbers are indicated within squares. The variable that had the most significant association with its partition, as well as the probability (p value) for this association, appears inside the tree nodes. Nodes that could not be further split are shown in gray, alongside the number of observations (n) and the average FA value (y). Tree nodes are organized from most significant (top) to least (bottom) for each respective data subset. FA, fractional anisotropy.
Bagging
A major drawback of recursive partitioning models such as CTree is their instability to small variations (noise) in the data (Strobl et al., 2009). This drawback may have serious implications for the reliability, generalizability, and interpretability of the results. One means to circumvent this problem is to combine CTree modeling with bagging. Bagging is a method by which a number of random subsets are drawn from the original data set. These subsets are also known as learning sets. A CTree model is fit to each learning set thus creating an ensemble of trees, which are subsequently averaged. Bagging has the added advantage of attenuating random effects such as, for example, those incurred by repeated measurements, and testing site effects (Grandvalet, 2004). For the present study, 10,000 trees were grown on random subsets each comprising 63.2% of the data (sampled without replacement).
Variable preselection
The third component of random forests, variable preselection, introduces an extra layer of (desirable) randomness to the modeling process. Variable preselection is the process by which a set of predictor variables is randomly selected at a tree node (i.e., a partition of the data) and then used to determine whether the node should be split and, if so, where. This produces even more diverse trees, thus improving the performance of the model, given that the lower the correlation between individual trees is, the better the predictive power and overall generalizability of the ensemble become (Breiman, 2001). Furthermore, variable preselection allows predictor variables that would be otherwise suppressed by stronger competitors to enter the ensemble (i.e., if a stronger competitor variable was not selected, then a variable with a significant, yet weaker, effect would have a chance to be included in the model).
The result is that potentially informative interactions that would otherwise be missed can be detected. These can include interactions between age and a number of subject-level variables, such as sex or handedness. For the present study, three variables were randomly preselected at each node.
Visualizing CForest results
The CForest algorithm produces a distribution of values. The mean of this distribution is computed and run through the CTree algorithm. As shown in Figure 2, this creates a smoother representation of the results (black line) by plotting the mean across intermittent variability, only where a consistent value falls within the 95% confidence interval (CI) of the CForest distribution.
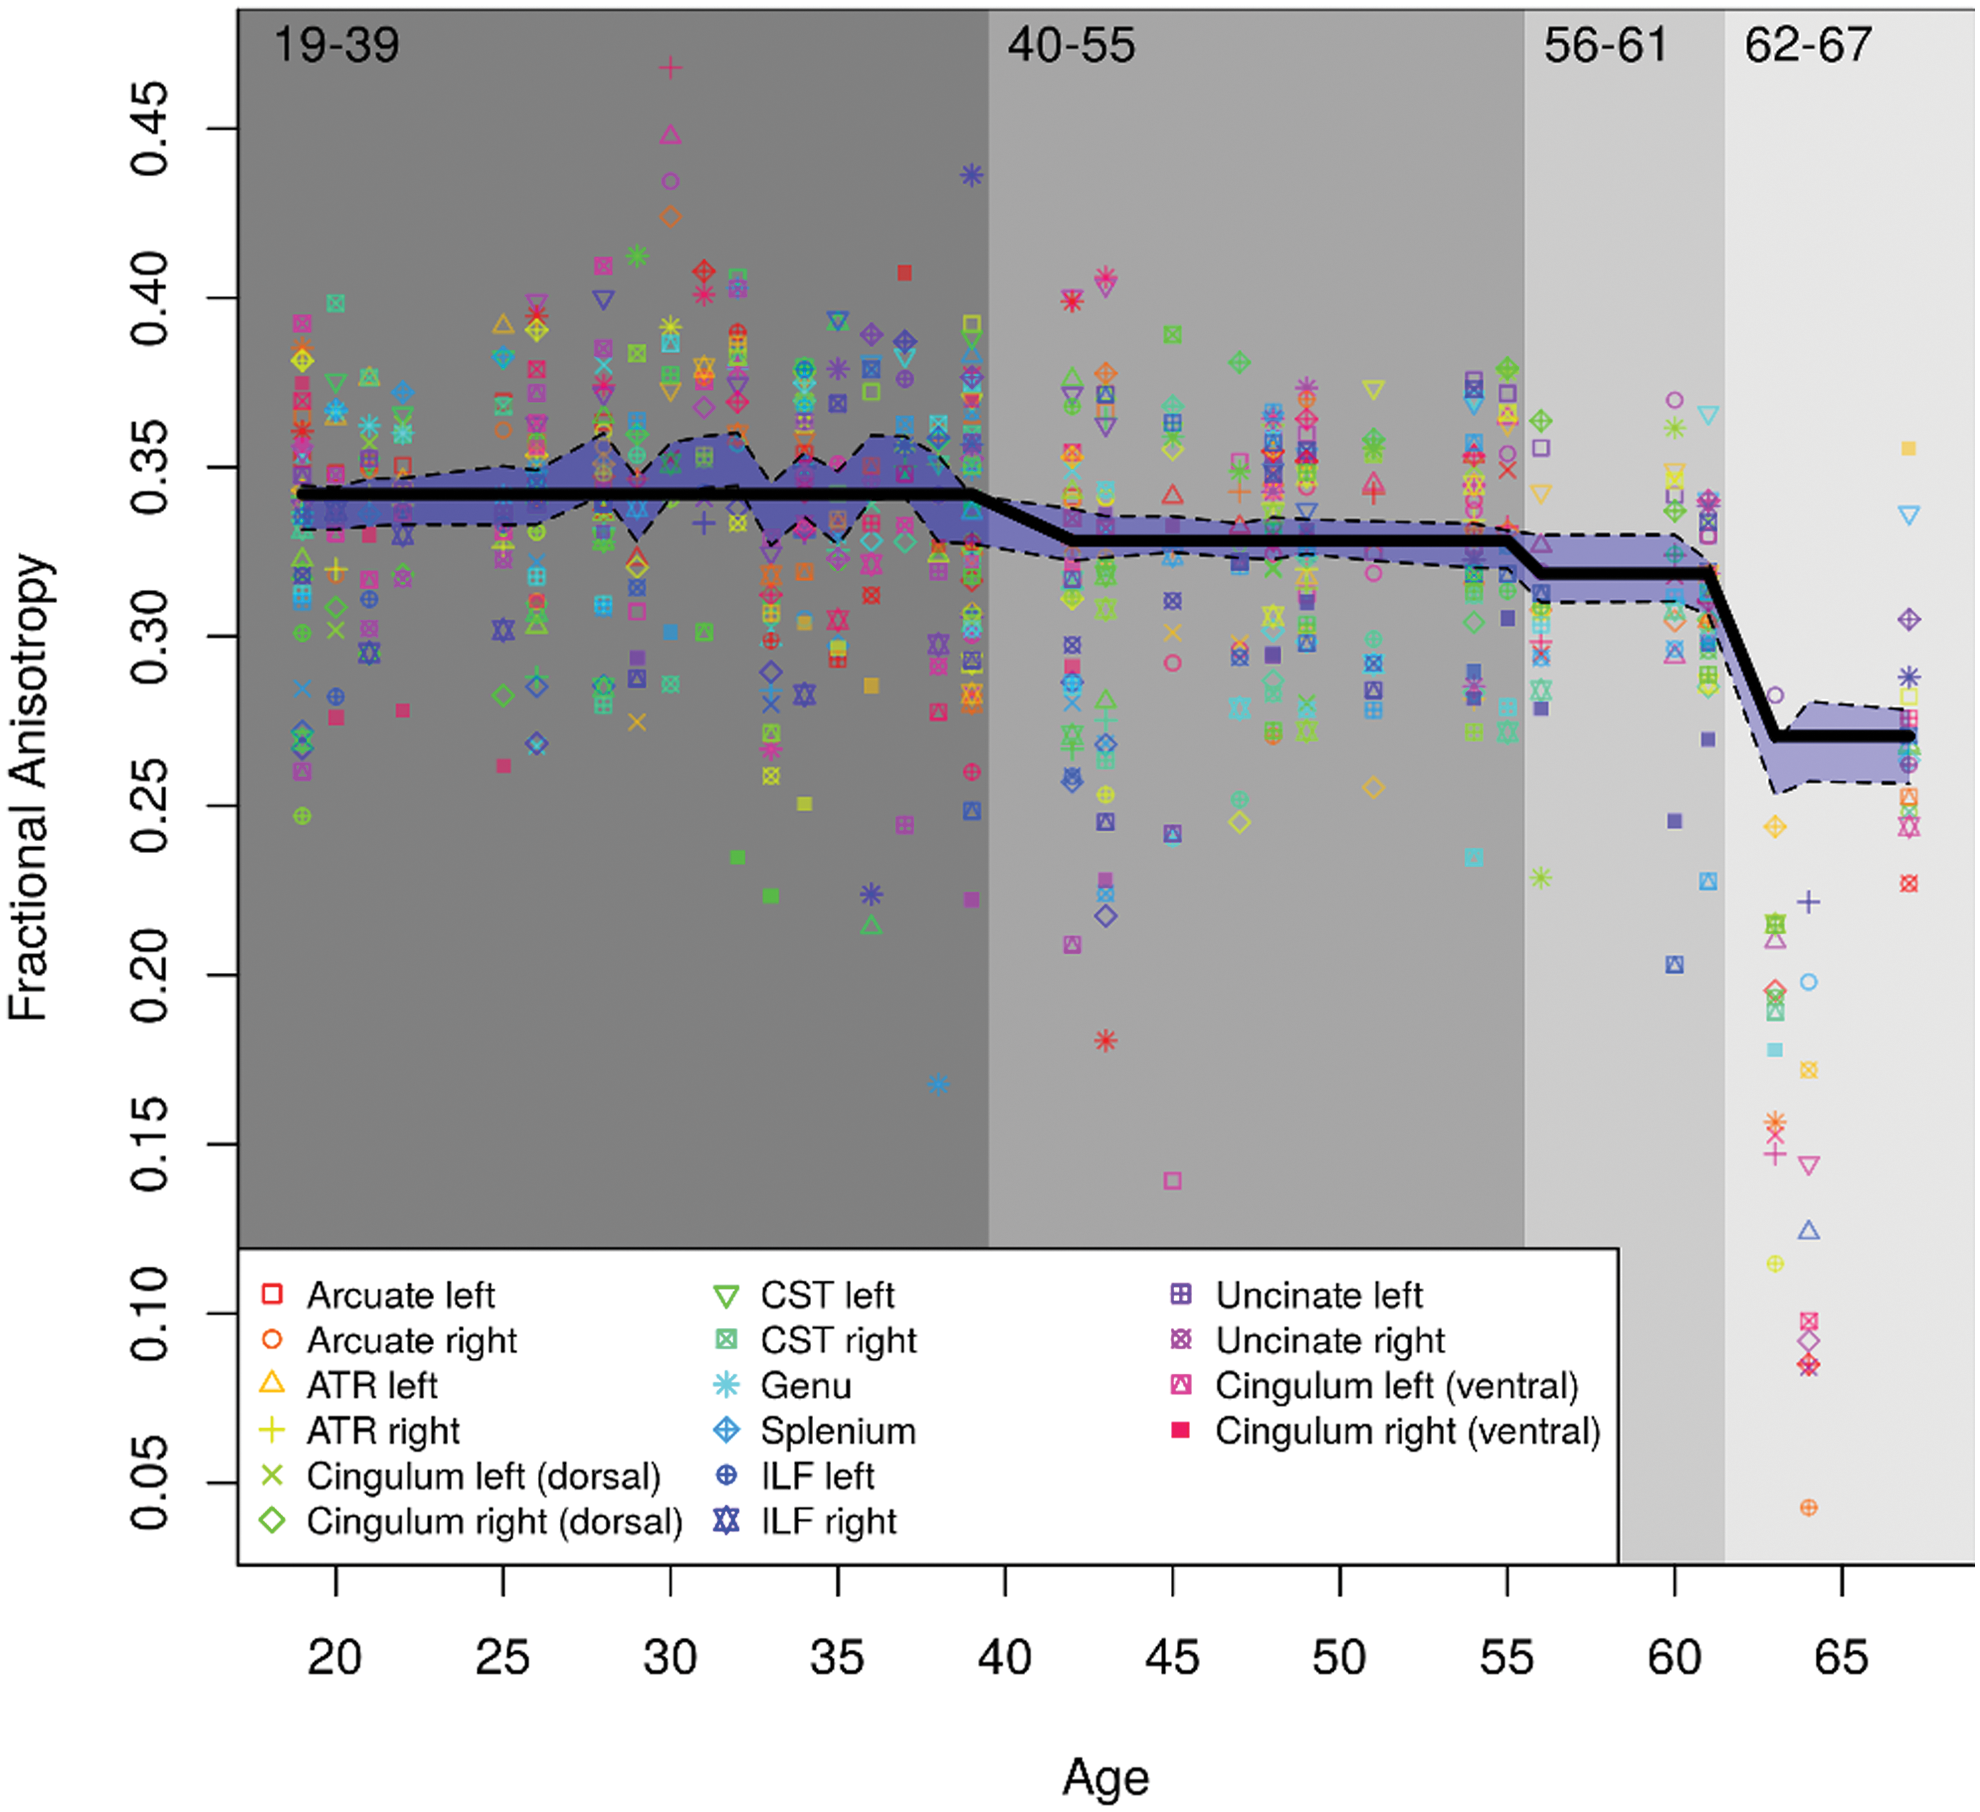
A representation of the model-predicted global FA values as a function of age. The figure depicts global FA values of each tract (y-axis) for each tract and subject (x-axis) with circles. The transparent blue region delimited by broken black lines is the 95% CI of the CForest distribution. The model divided the age continuum into four bins: 19–39, 40–55, 56–61, and 62–67 years of age. Note that these bins are from youngest to oldest, rather than in order of significance. CI, confidence interval. Color images available online at
Results
Global age-related decline
First, only the relationship between age and FA was considered, collapsing across clusters of tracts, to demonstrate global age-related decline. The mean rate of decline across age in all tracts is depicted in Figures 1 and 2. Figure 1 demonstrates the significant partitions of the data by age. In accordance with previous findings, there was a significant decline as age increased for each tract investigated, with the first notable decrease occurring at age 39. While there was some variability in FA before this age, this variability was not statistically significant and all FA values before age 39 were deemed to be a single bin. A second significant division occurred at age 55, followed by the most significant and drastic decrease at age 61. Importantly, age was found to exhibit a nonlinear relationship with FA, where significant decreases occurred more frequently and with greater magnitude later in life.
Regional differences
Age-related changes are depicted in more detail in Figure 3, which shows the FA decline for each grouping of tracts (with the grouping determined by the CForest analysis). Consistent with the global FA decline noted above, numerous tracts showed variations of this function with a unique age of onset and magnitude of decline in an age × tract interaction. These patterns of decline were grouped together according to their progression (i.e., tracts that had the same progression, statistically speaking). All tracts showed a first significant decline in FA in the late 30 sec or early 40 sec. The patterns of decline between ages 40 and 60 were the largest differentiator between groups of tracts; all tracts showed their steepest decreases at ages 61–62.
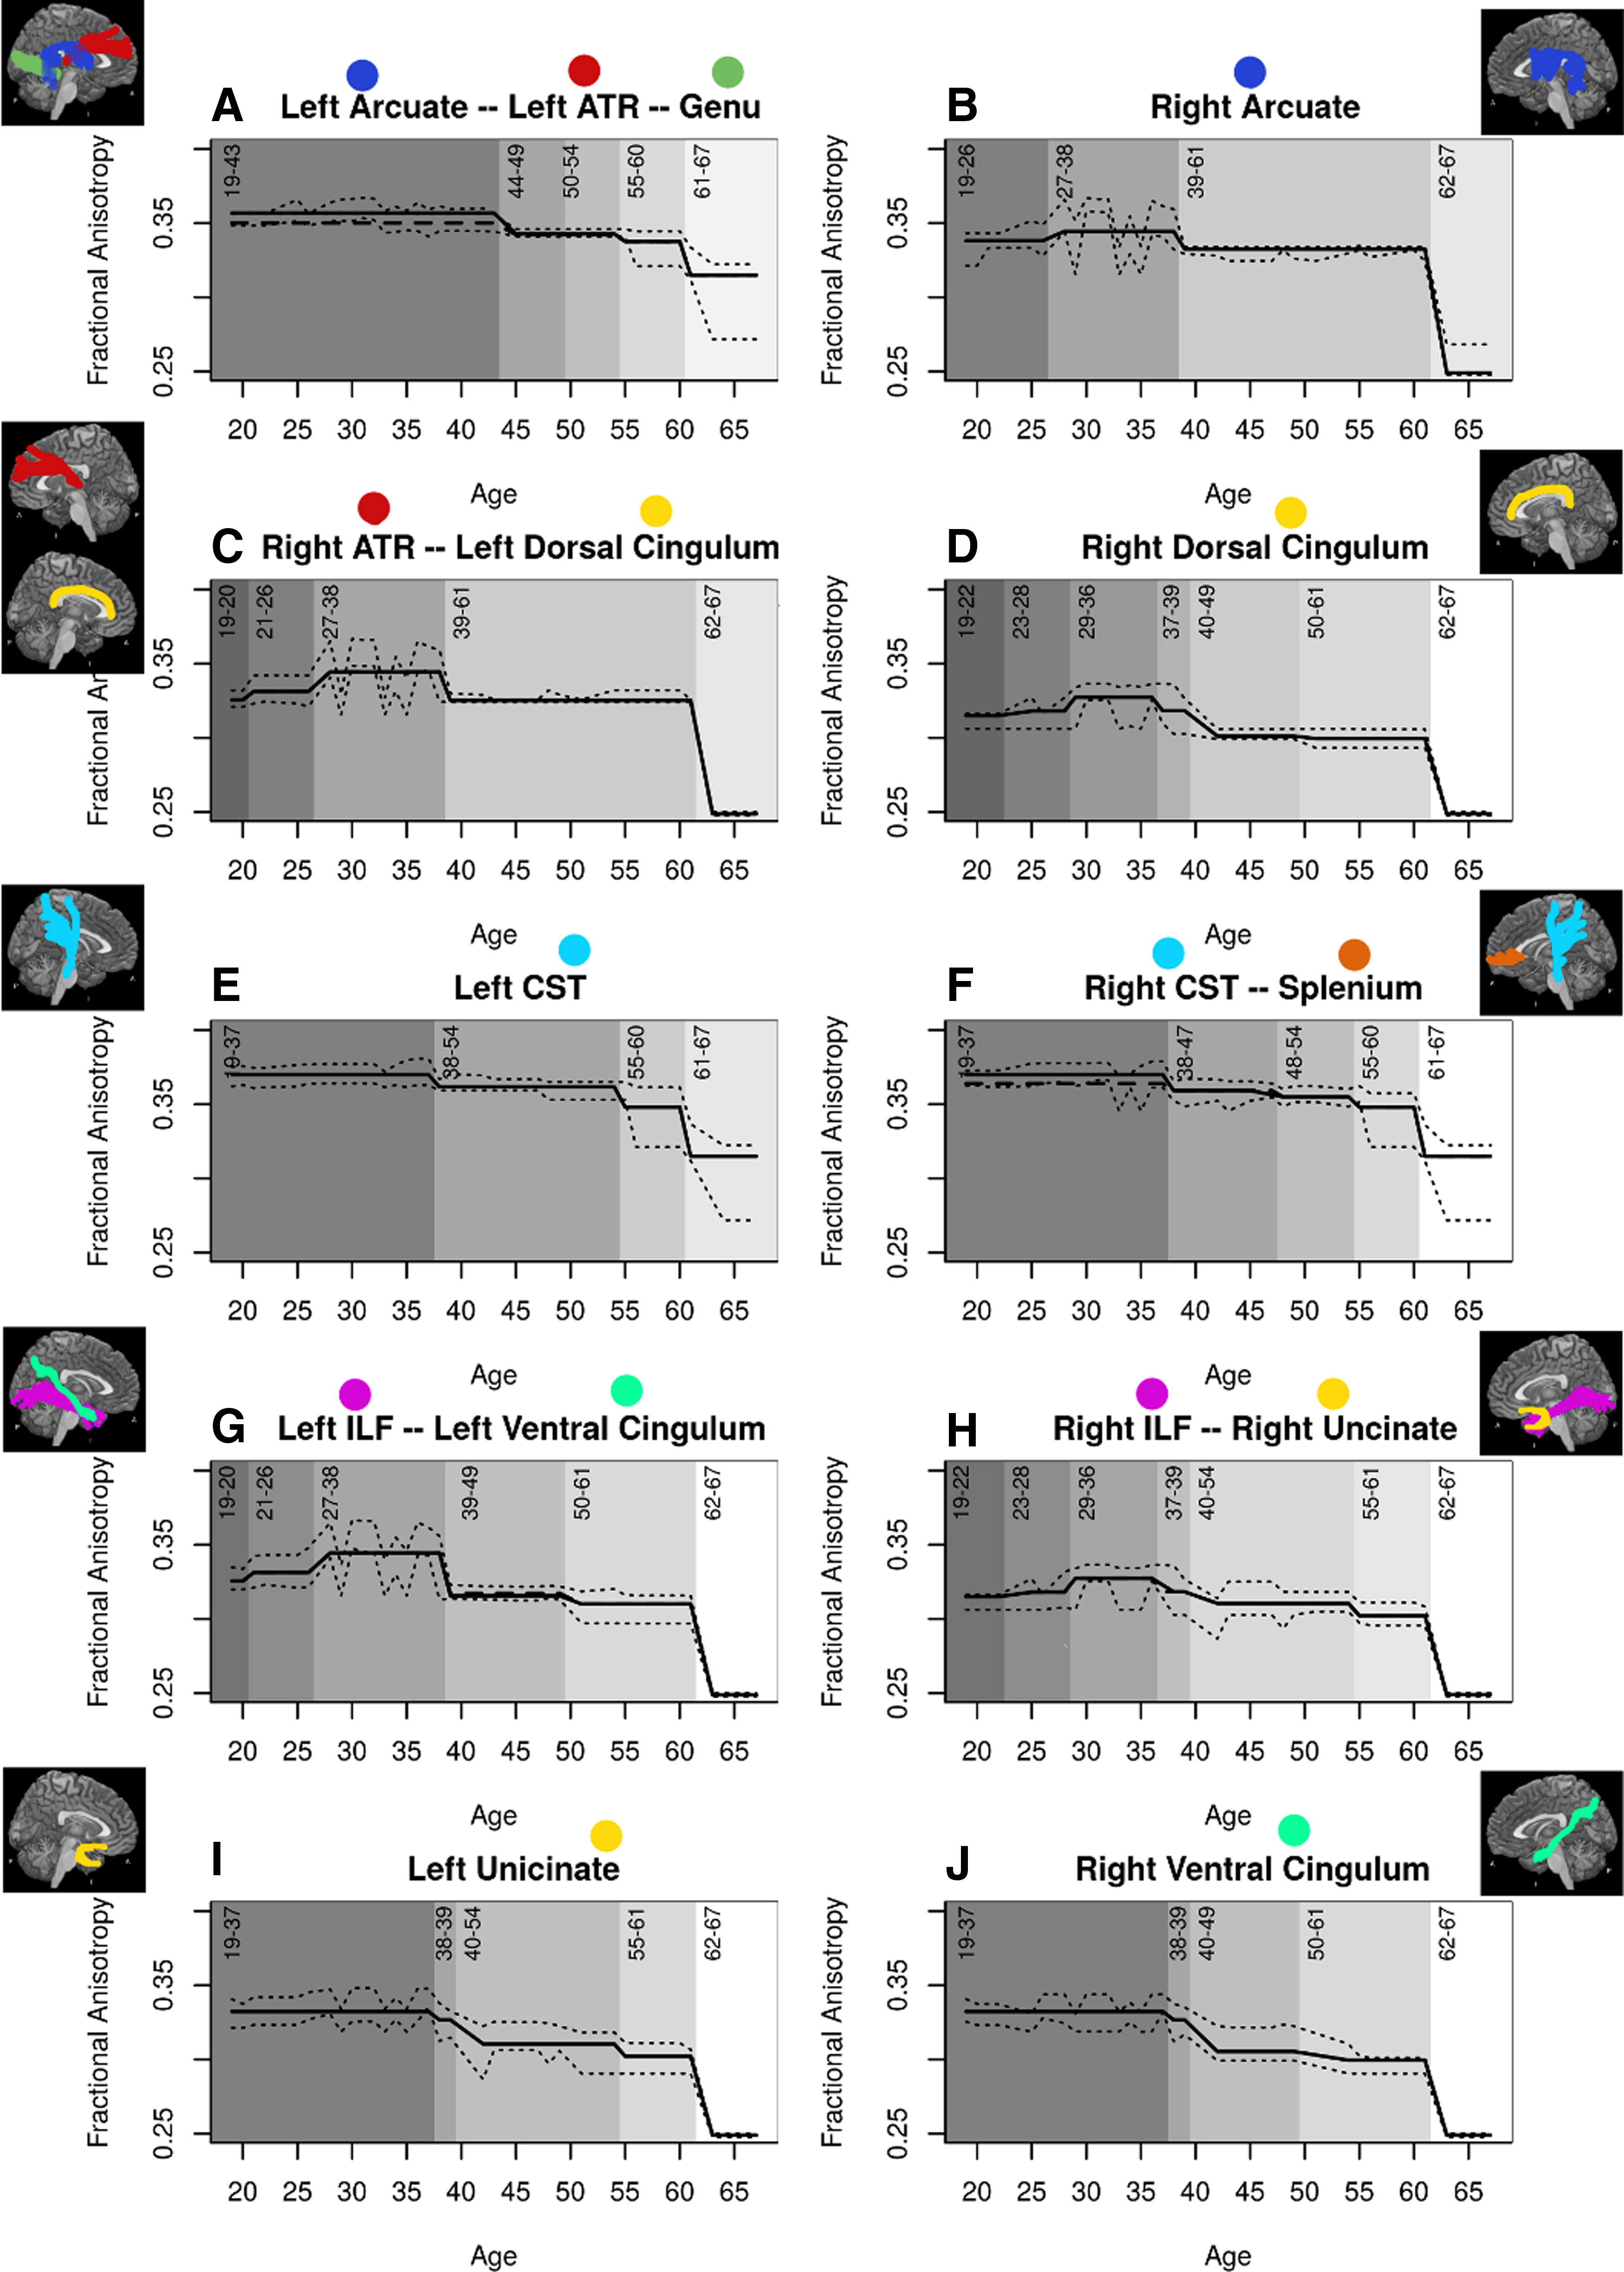
FA as a function of age for each cluster of tracts, including
In the CST and uncinate fasciculus of the left hemisphere, as well as the right CST, ventral cingulum, and splenium, no decline was found until age 37. Similarly, the arcuate fasciculus and ATR of the left hemisphere and the genu showed no decline until age 43. Several other tracts showed increases in FA up until the late 30 sec/early 40 sec age range, before subsequent declines. The dorsal cingulum, ILF, and uncinate fasciculus in the right hemisphere showed increases in FA until age 36; likewise, the dorsal and ventral cingulum and ILF of the left hemisphere, and the arcuate fasciculus and ATR in the right hemisphere, showed increases until age 38.
Finally, while many clusters of tracts showed several gradations of decline beginning as early as 36 years of age, several showed only marginal decreases and remained relatively preserved until age 61. The tracts that showed this preservation included the arcuate fasciculus and ATR of the right hemisphere, and the left dorsal cingulum. Contrary to expectation, results did not reveal a significant tract × age × sex interaction.
Handedness-related changes
A significant age × tract × handedness interaction was found in the majority of tracts investigated. In general, FA was found to decrease with age along all degrees of handedness in these clusters, as seen in Figure 4. However, participants who were strongly right handed, to a degree that varied by tract, demonstrated relatively preserved FA for longer periods, with notable decline beginning roughly after 40 years of age. All remaining individuals (those who were less strongly right handed, or who were left handed) showed some degree of decline starting as early as 25–30 years. Similarly to the main age effect, as well as the age × tract interaction, the strongest declines were seen at 61–62 years of age across all degrees of handedness.
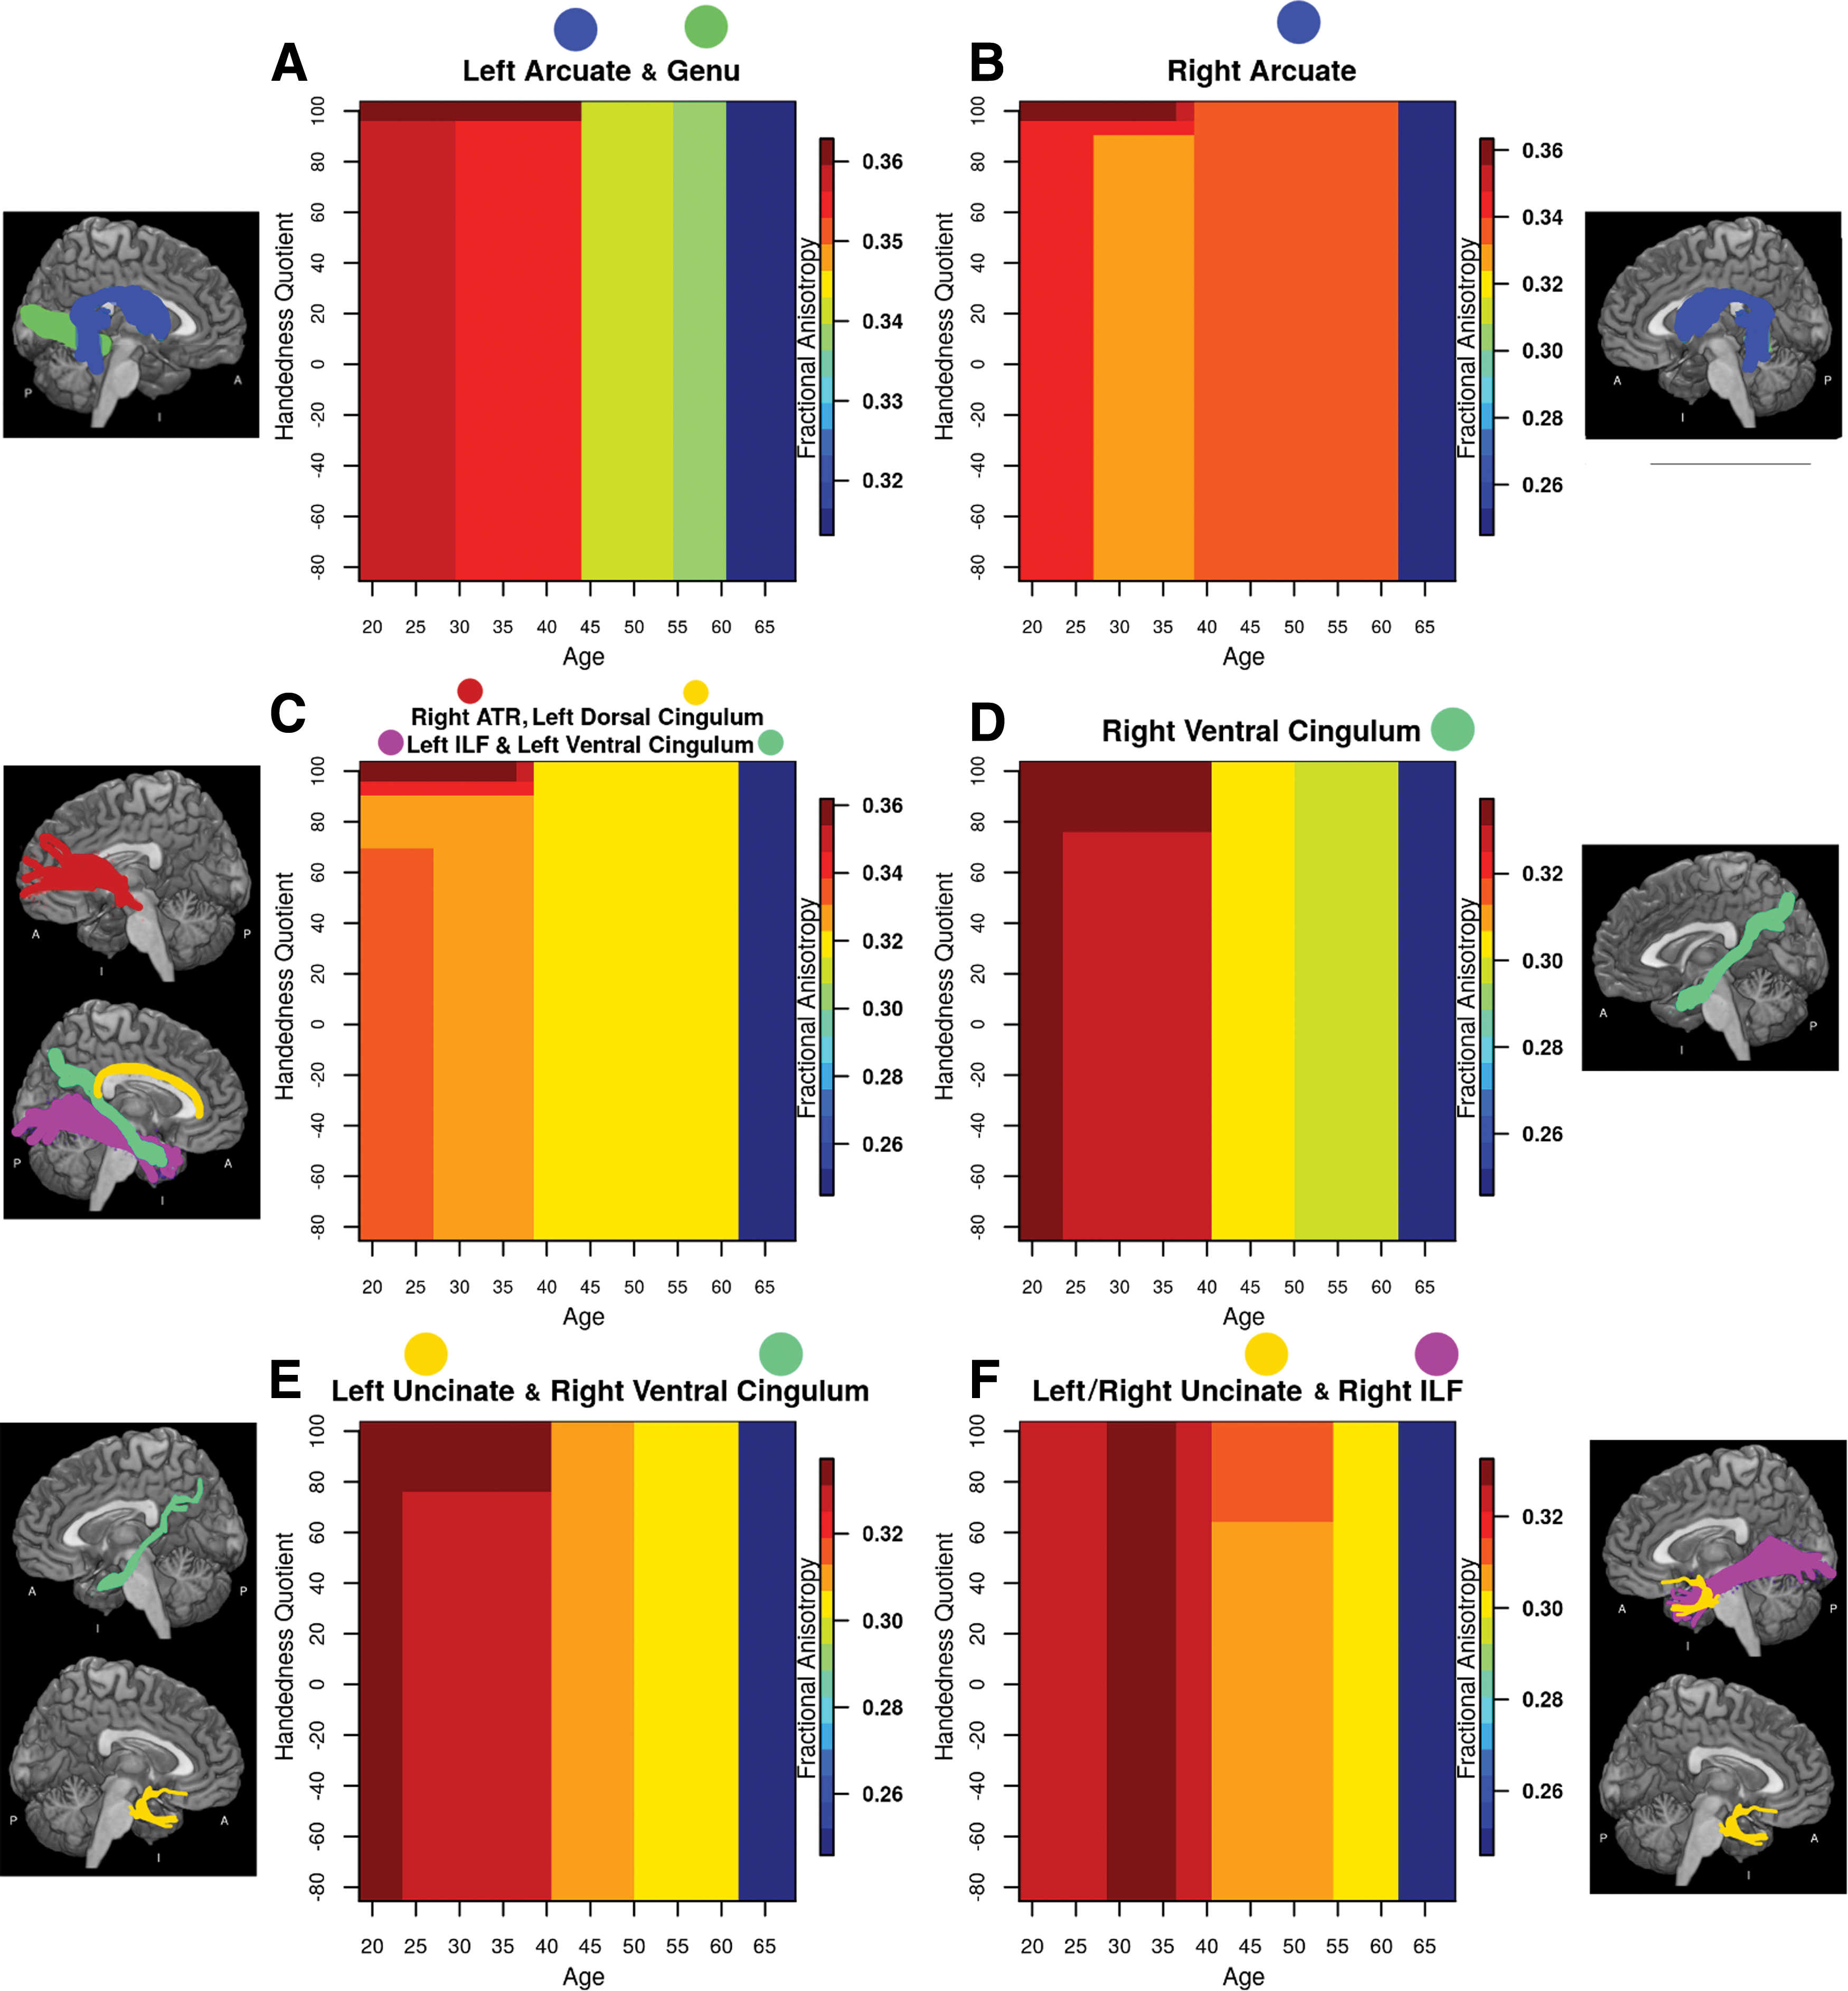
FA as a function of age and handedness for each cluster of tracts, including
The tracts clustered into six groups according to the manner in which handedness modulated the effect of age. A first set of clusters showed similar relationships with handedness regardless of age. These included the left arcuate fasciculus and genu (Fig. 4A), the right arcuate fasciculus (Fig. 4B), the right ATR, the left dorsal cingulum, the left inferior longitudinal fasciculus, and the left ventral cingulum (Fig. 4C), and the right ventral cingulum (Fig. 4D). The two final groups differed from the preceding four in that the interaction between age and handedness only held for specific age ranges: the left uncinate fasciculus clustered with the right ventral cingulum for ages 39 and below (Fig. 4E), while the left uncinate fasciculus clustered with the right uncinate fasciculus and the right ILF between ages 41 and 54 (Fig. 4F). Outside of these ranges, handedness did not modulate FA.
Anterior–posterior gradient of progression in the corpus callosum
FA was found to decline with age both in the genu (anterior portion) and the splenium (posterior portion) of the corpus callosum, as shown in Figures 5 and 6. As predicted, the difference before and after the onset of decline was greater for the genu (age 43) than for the splenium (age 37), demonstrating steeper anterior decline. Note that pre-onset FA was significantly higher for the genu than the splenium, and that no significant differences between these tracts were present after age 61. Therefore, this difference in the age-related decline arose from higher FA in anterior (genu) fibers earlier in life. Interestingly, however, a previously unreported age discrepancy was shown regarding the onset of decline. Specifically, while posterior decline in the splenium was of lesser magnitude, it preceded that in the genu by 6 years in our data. While splenium decline became apparent at 37 years of age, onset was not found in the genu until age 43.
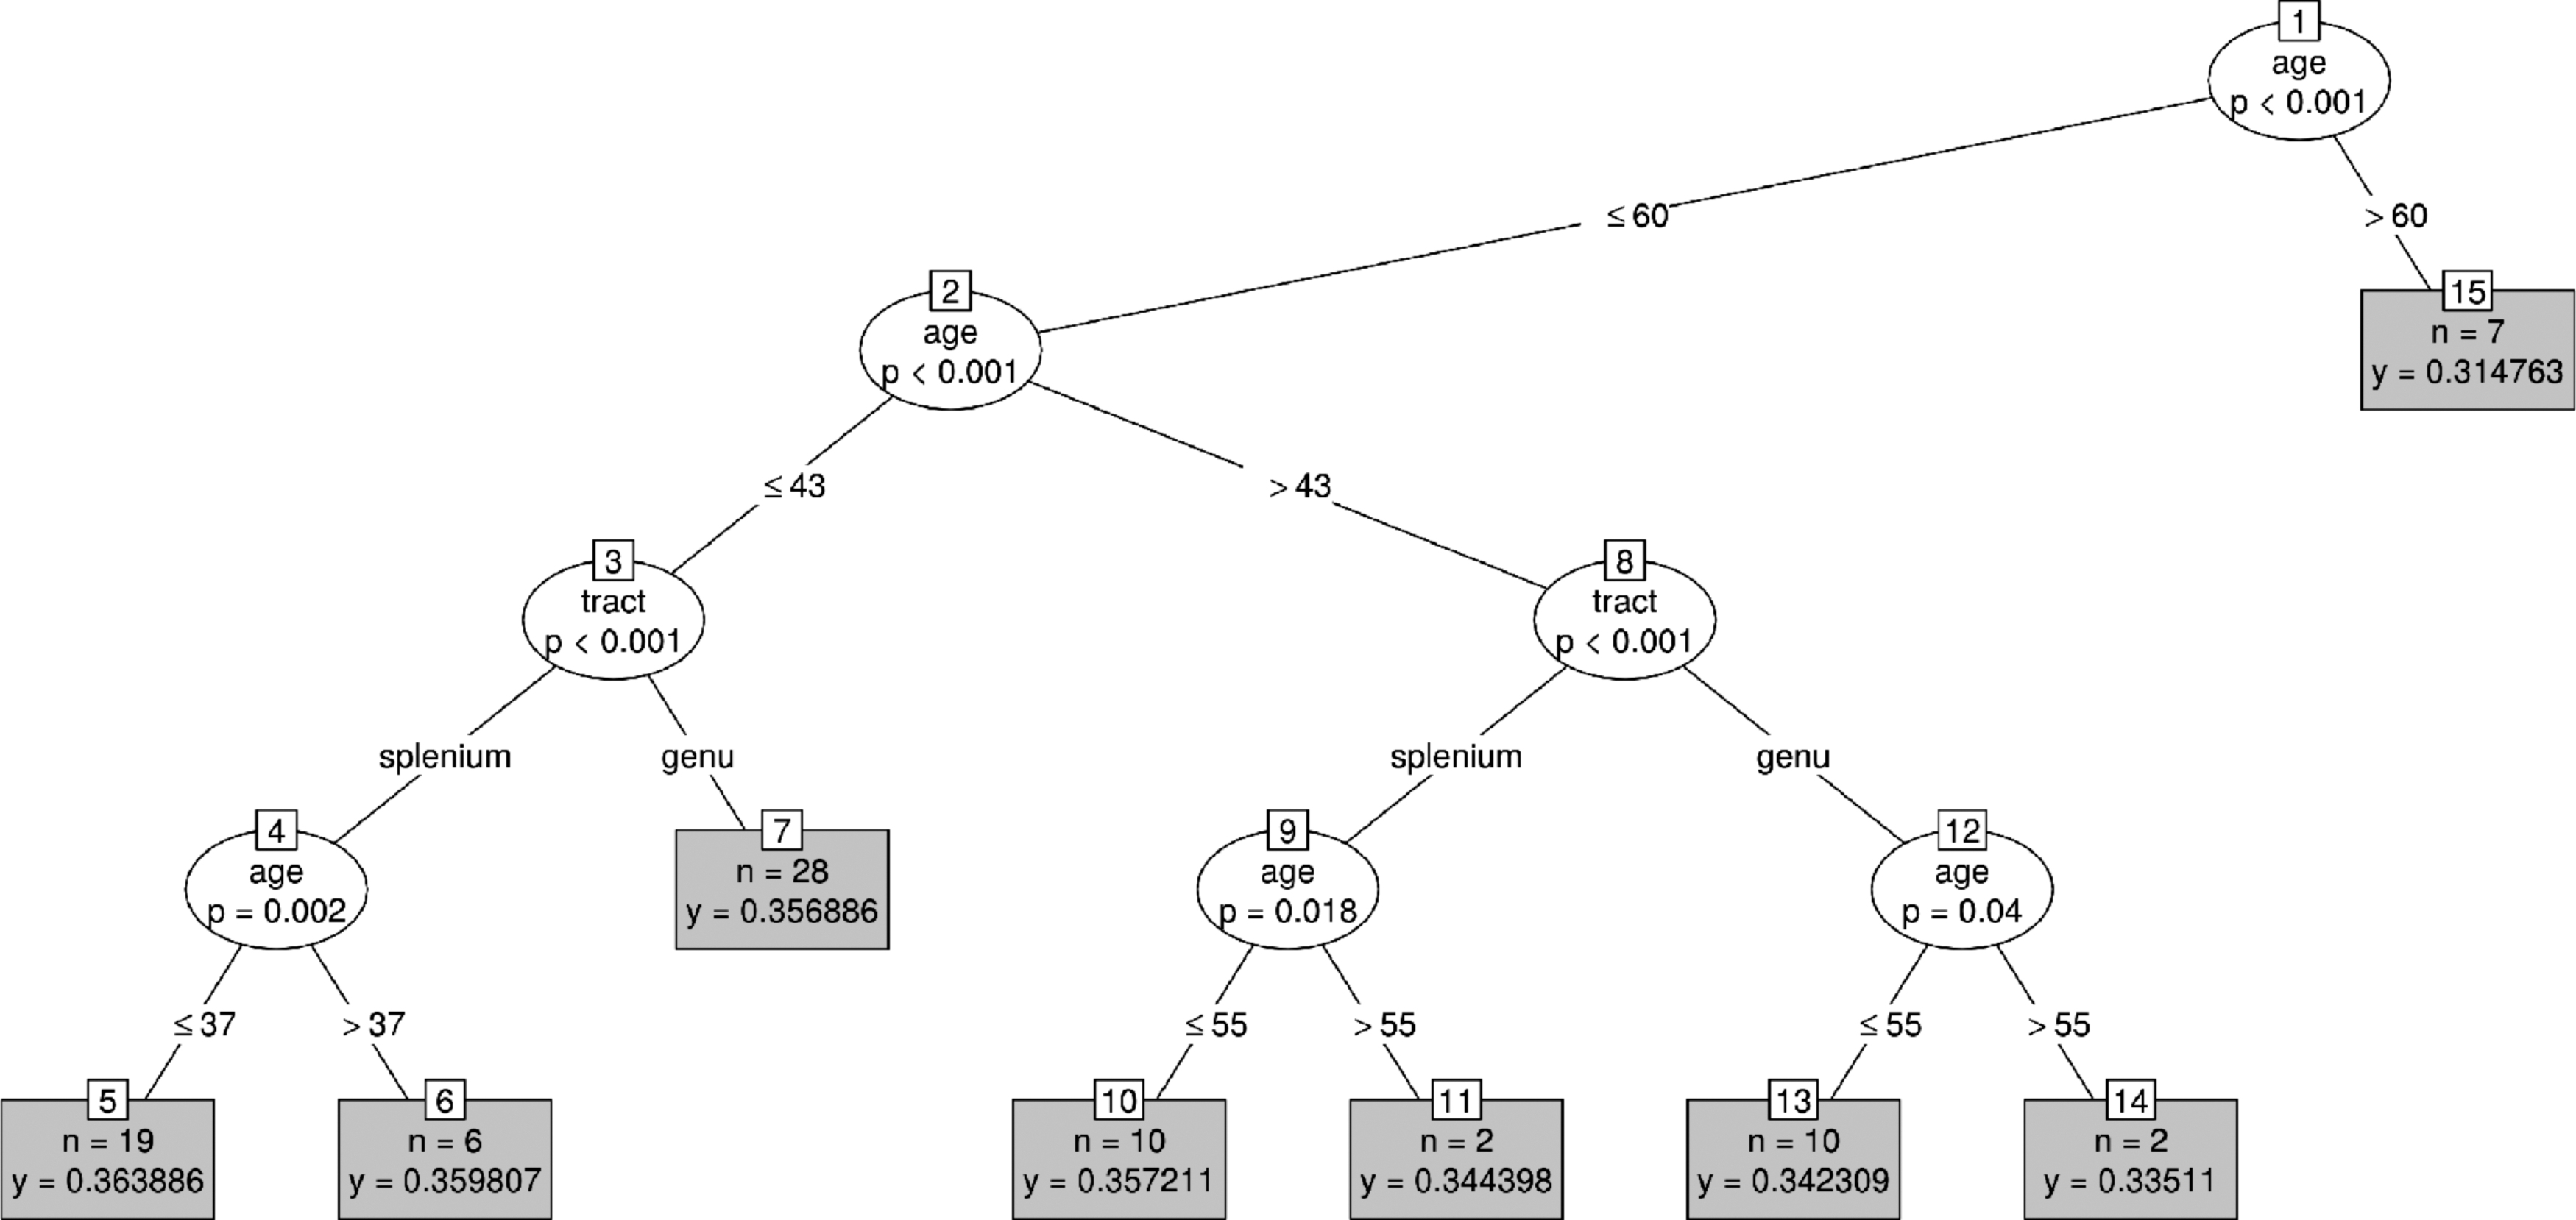
A tree representation of the model-derived FA values as a function of age for the genu and splenium of the corpus callosum. The variable that had the most significant association with its partition, as well as the probability (p value) for this association, appears inside the tree nodes. Nodes that could not be further split are shown in gray, alongside the number of observations (n) and the average FA value (y).
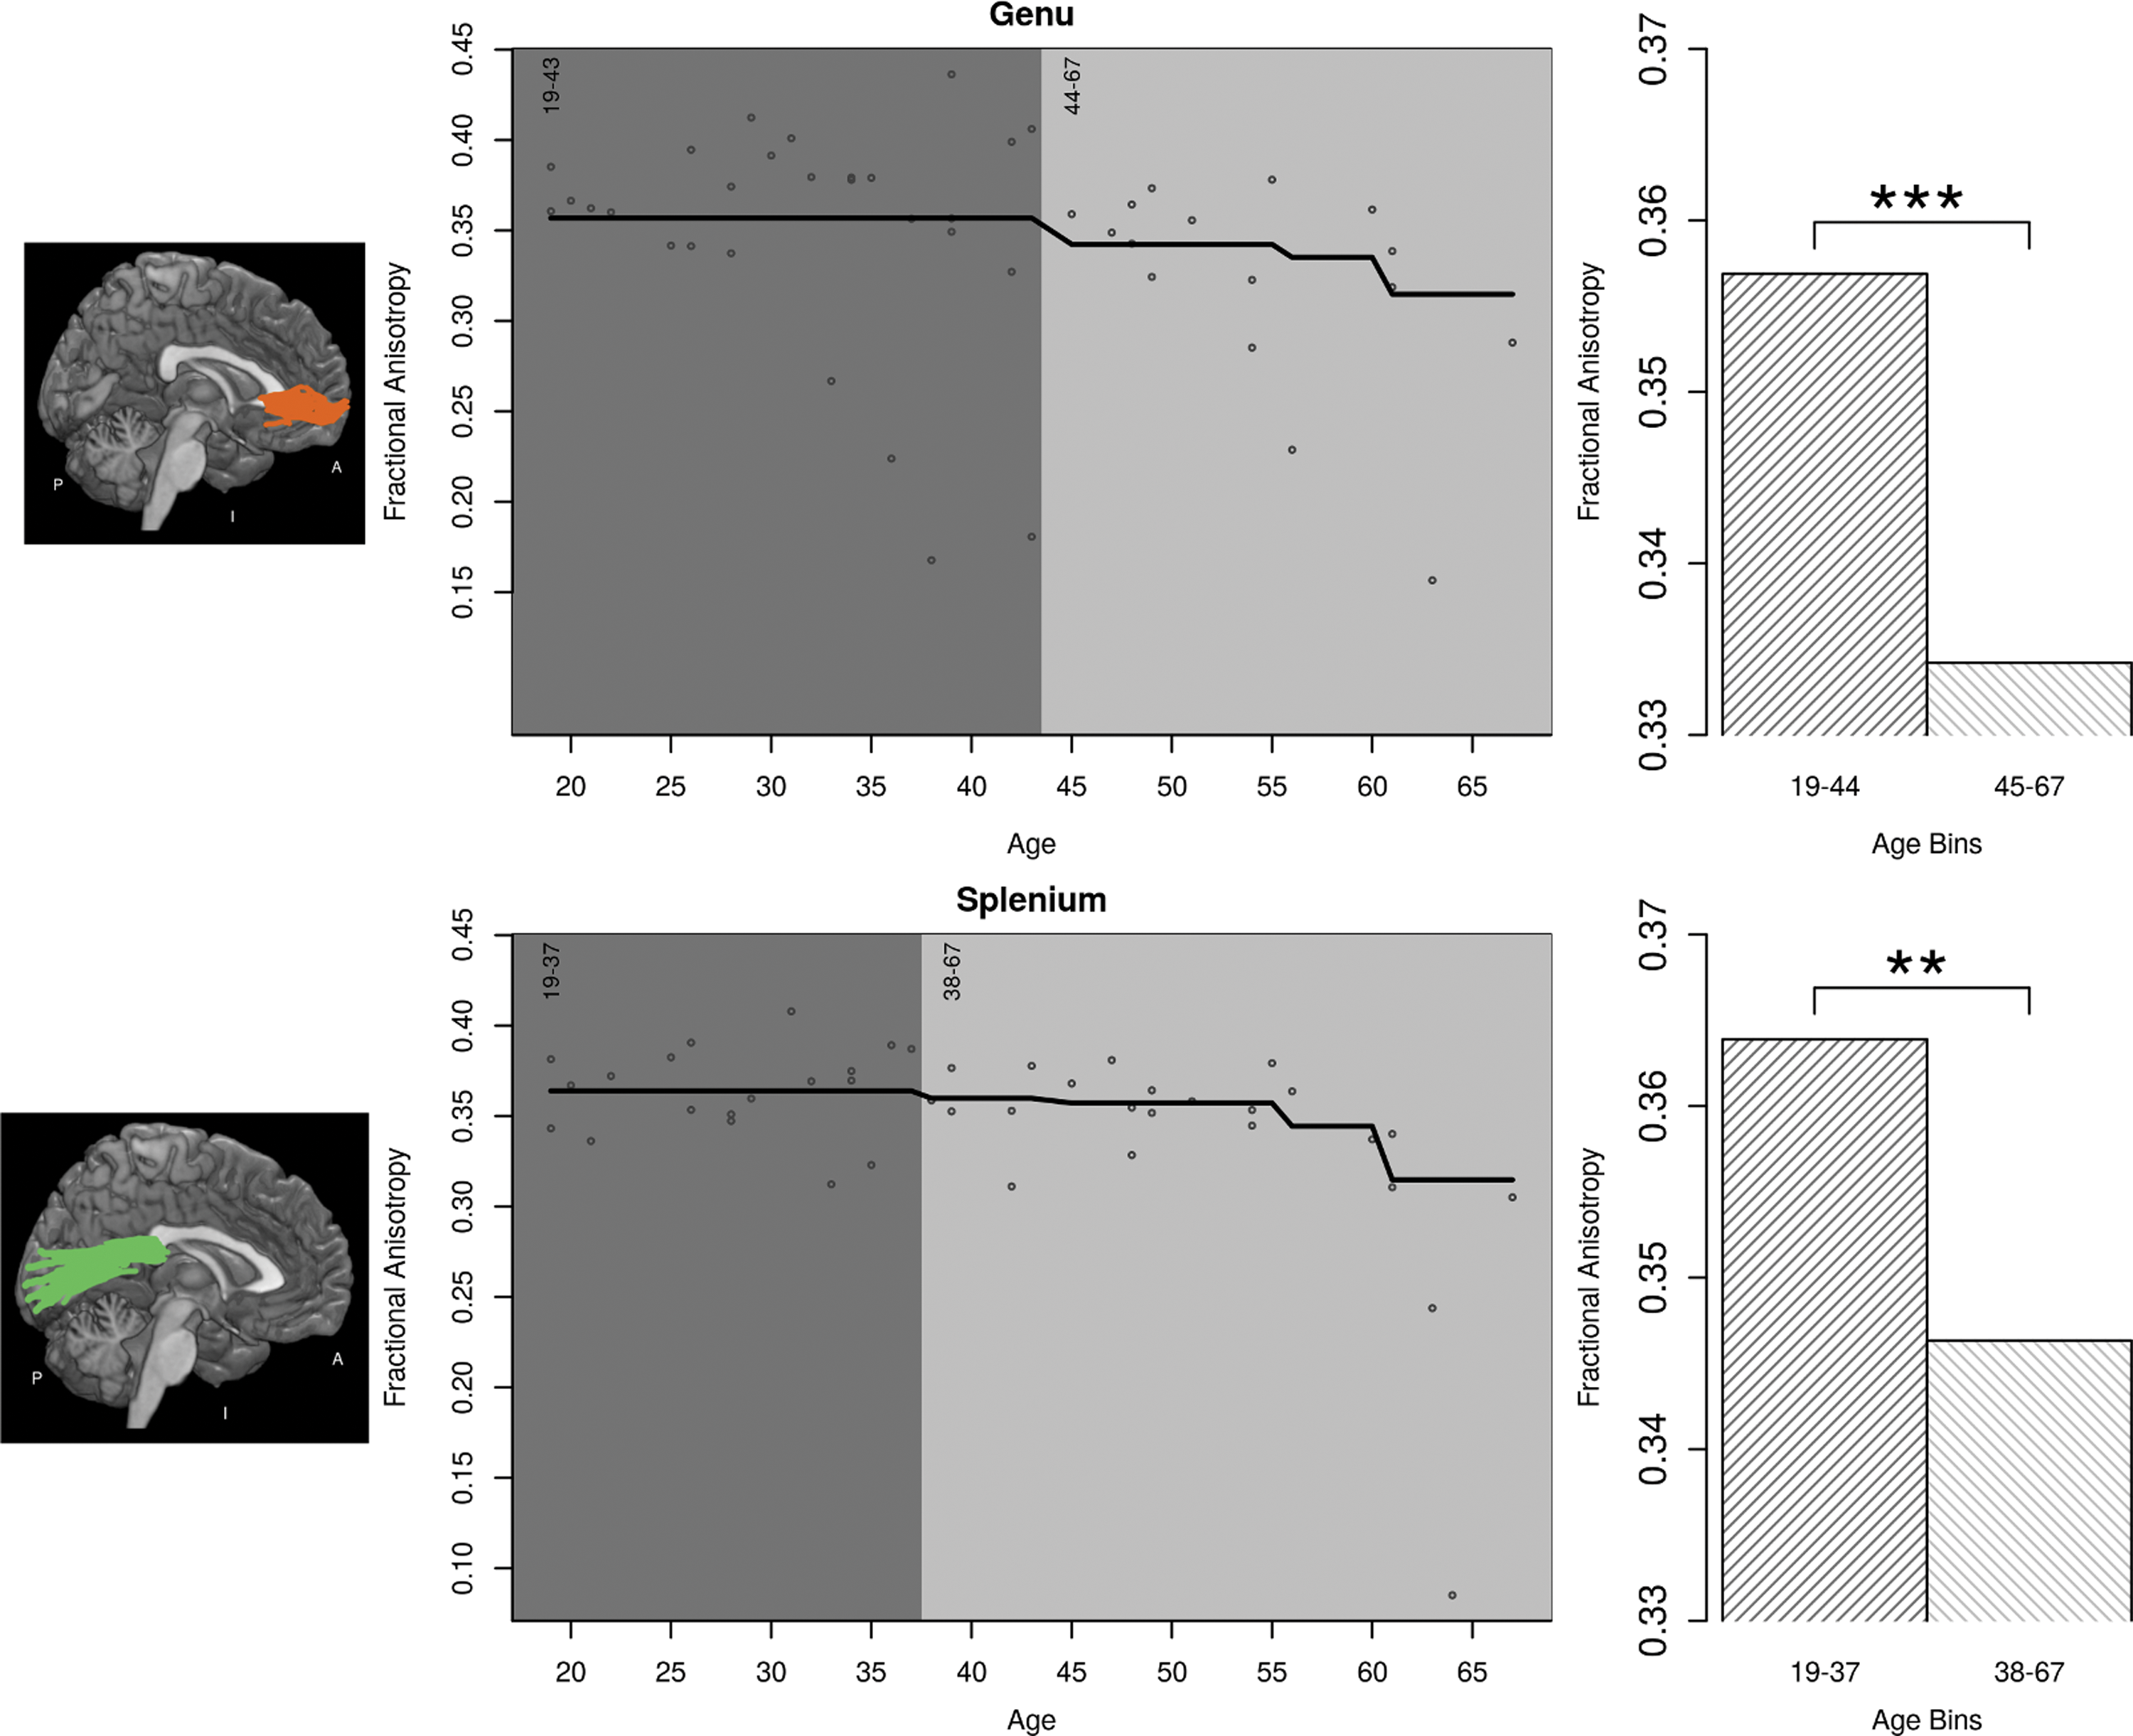
FA decline as a function of age in the genu and splenium of the corpus callosum, separated by the onset of decline for each tract. The transparent blue region delimited by broken black lines is the 95% CI of the CForest distribution. ** denote significance at p < .01, while *** denote significance at p < .001. Color images available online at
Discussion
The present study aimed to demonstrate the application of a novel data analysis approach (CForest) to characterize the decline in white matter tract integrity associated with healthy aging along a continuum of the adult life span, and how this interacts with sex and handedness. This investigation was done to address some notable limitations of the extant literature on white matter decline in aging: the practice of comparing young and old groups rather than characterizing the shape of decline over a continuum, and the use of parametric statistical models whose assumptions have been shown to be violated by DTI data. These limitations were addressed using CForest, a nonparametric modeling approach that treats age as a continuous variable to characterize potentially nonlinear changes in FA. In addition, CForest is suitable for detection of subtle interactions between age, sex, handedness, and tract, without problems associated with overfitting.
Nonlinear changes in FA with age
It was hypothesized that age would be associated in a nonlinear manner with FA in all tracts, showing a general trend of decline that would vary by tract. As predicted, Figures 1 and 2 depict a general decline across all participants and white matter tracts that increased in severity with age, with the largest and most significant division occurring in the early 60 sec. This strong global decline in FA at roughly 60 years of age coincides with a large increase in response time and reduction in executive functioning seen in healthy adults (Bialystok and Craik, 2010; Bialystok et al., 2004). When presented with a cue, participants aged 60–69 were considerably slower than younger ones in providing the appropriate response; slowing continued into the 70 sec.
These results, in combination with our own, are in line with reports made by Salami and associates (2012), Borghesani and associates (2013), and Kennedy and Raz (2009), through which reductions in white matter integrity mediated age-related reductions in processing speed. While previous studies have shown a general decline with age (Bennett et al., 2010; Davis et al., 2009, 2012; Salat et al., 2005), or accelerated decline at later ages (Sexton et al., 2014), the present study is the first to show a dramatic FA decline that coincides with significant processing changes above 60 years of age. Furthermore, while the rate of decline of the age range studied varied greatly across tracts, the reduction in integrity during the early 60 sec was the largest, and was seen in all regions.
This suggests that numerous domains of cognition may dramatically change during this period. In general, notable decline began at ∼40 years of age for most tracts. However, even those tracts that showed relatively preserved FA across the life span (i.e., arcuate fasciculus and ATR of the right hemisphere, and the left dorsal cingulum) exhibited decline in the early 60 sec. The oldest participant included in this later life decline showed visually (but not significantly) higher FA than the others. Whether this is rooted in individual variability or suggests a true increase is uncertain, but a larger sample size in this age range will be necessary for further investigation.
One of the most notable aspects of the relationship between age and FA was that rather than continuously decreasing with age, in fully half of the tracts investigated, FA increased from roughly 25–40 years before beginning to decline. Given that previous studies have often investigated age-related white matter by way of young vs. old comparisons, looking specifically for decline (Bennett et al., 2010; Borghesani et al., 2013; Davis et al., 2009, 2012; Salat et al., 2005), these studies may have been insensitive to intermittent increase in this range. White matter maturation up to 30 years of age is thought to follow a hierarchical pattern (Lebel et al., 2008), coinciding with changes in white matter volume, which peak during the 30 sec (Liu et al., 2003). After this time, there is a loss in both gray and white matter volume (Lemaître et al., 2005; Raz et al., 2005), similar in progression to the present FA decline.
Given this evidence and the association between FA and white matter myelination (Beaulieu and Allen, 1994), the noted increases earlier in life may represent final stages of development. Interestingly, while these increases seen bilaterally in some tracts (dorsal cingulum and ILF), asymmetries were restricted to tracts with frontal lobe connections (ATR, arcuate, and uncinate fasciculus) where increases were only seen in the right hemisphere. This may reflect a shift toward control of spatial attention and planning to the right hemisphere during puberty, and subsequent refinement of these abilities (Hausmann et al., 2003).
Clustered trajectories of decline
Beyond the general pattern of decline observed in most tracts, several groups of tracts showed similar age-of-onset and white matter decline trajectories. For example, the ILF and ventral cingulum of the left hemisphere shared a trajectory of decline, which featured a strong reduction in the early 60 sec. Considering the role of the ILF in visual processing and object recognition (Ortibus et al., 2012), and that the cingulum has been associated with attention and error monitoring (Brodal, 2010), the pairing of these trajectories may coincide with the previously discussed reduction in processing and response speed for visual tasks in individuals aged 60 years and older (Bialystok et al., 2004).
Other tracts show apparent regional specificity in their clustering. For example, the arcuate fasciculus and ATR of the left hemisphere, as well as the genu, all share diffuse connections across the prefrontal cortex, and their clustering may indicate regional integrity decline not specific to any cognitive domain. Similarly, pairing the right ATR with the left dorsal cingulum may be more regionally than functionally driven. Finally, the right CST and splenium, which share superior and posterior connections throughout the parietal lobe, are paired, as are the right ILF and uncinate fasciculus, sharing temporal and inferior frontal connections. These data suggest the potential for patterns of decline that are simultaneously region and domain specific (Kennedy and Raz, 2009).
It should be noted that while the present investigation was aimed to detect differences between tract clusters, voxelwise differences within tracts may arise from nonuniformities, particularly along the anterior–posterior axis. Future corroboration of the present findings with voxelwise or region of interest (ROI)-based analyses will determine whether tract-wise modeling leads to dilution of tract differences. For example, replacing “tract” as a predictor in the CForest model with voxel coordinates (one predictor for each dimension) may lead to segregation of longer tracts into segments that vary in FA.
Notably, addition of predictor variables (e.g., coordinates) does not contribute to overfitting problems associated with regression approaches, or the penalties associated with their corrective measures. This is largely due to variable preselection. That is, the use of specific predictors is random across trees, and those that do not improve the model are not incorporated, provided more descriptive predictors are provided. The addition of predictors also provides a means of detecting high-level interactions through data-driven sample segregation without the need for stringent multiple comparison correction. The emergence of tract-wise differences that vary with age indicates an interaction without the need for secondary post hoc testing. While it should be noted that CForest is computationally intensive, developments in parallel processing and cluster computing enable this type of large-scale investigation.
The ability to detect apparent onset in FA decline at ∼40 years of age, and the steep decline in the early 60 sec, is a direct consequence of CForest's approach to detecting discontinuities in data. At the same time, it is important to consider that because CForest works by finding “split points” that maximally differentiate subsets of data, it may in some cases represent a gradual change as a more abrupt one. On the other contrary, if decline were truly linear, a greater number of smaller steps might be expected, rather than a small number of large steps. In indicating, for example, that there is no split point for a given tract in the range of 19–40 years, CForest is suggesting that FA values do not differ significantly within that age range. The present results, as some of the first to characterize nonlinearities in the pattern of age-related decline, can be taken as the basis of intriguing hypotheses for future work.
The impact of handedness
The general age-related decline in FA was present across all degrees of handedness. However, there was evidence suggestive of a “protective” effect of strong right handedness, such that people with weaker right hand dominance, or left hand dominance, showed gradual global decline beginning in the 20 sec, whereas those with stronger right handedness only showed significant decline beginning in the late 30 sec to early 40 sec. While handedness has been related to asymmetry in white matter beneath the precentral gyrus contralateral to the dominant hand (Büchel et al., 2004), as well as the CST (Seizeur et al., 2014), the present study is the first to our knowledge to investigate the effect of handedness on white matter as a function of age.
Sensitivity to subtle or high-level interactions represents the strength of this approach. For example, the onset of handedness-related changes varied, often subtly, across tracts (e.g., strong right-handed decline beginning at age 41 and 44 in the left uncinate and arcuate fasciculus, respectively). Moreover, the degree to which handedness affected FA for age bins was not uniform. Sensitivity to these nonlinear and multidimensional interactions can, in part, be attributed to the data-driven detection of age and handedness bins, where the use of arbitrary thresholds to determine handedness (left vs. right) likely does not reflect the true variance of the population.
A possible criticism here is that—although handedness was not an inclusion/exclusion criterion for this study, and the present sample included a number of strongly left-handed individuals—the distribution of handedness scores in the participants was skewed toward right handedness, reflecting the typical distribution in the population (Knecht et al., 2000). However, the nonparametric nature of CForest suits it to situations where a sample distribution is reflective of real-world skew, and is therefore an appropriate choice for investigation of handedness (Hothorn et al., 2006). Nonetheless, future work should investigate a larger sample, including more ambidextrous individuals.
Similarly, although no major gaps existed in our age distribution, the potential remains for the decline found in the early 60 sec to be the result of bias from several individuals at the edge of this range. Replication of these findings with a larger sample and/or wider age range will confirm our results.
In addition to handedness, sex was investigated as a potential moderator of FA in our model. While the model rejected the null hypothesis that there was no difference in FA values between male and female participants (based on p values alone), considerable overlap in the 95% CI for these estimates suggested that findings may not replicate to another population. Considering that these effects are known to be small (Pal et al., 2011), a larger sample size may lead to a more robust estimate of effect sizes, confirming initial hypotheses.
Anterior–posterior susceptibility
Evidence for an anterior–posterior gradient of FA decline reported in Bennett and colleagues (2010) and Salat and colleagues (2005) motivated an investigation into the onset and rate of decline for tracts clearly segregated on this axis. Of the tracts investigated here, the most clearly segregated were the genu and the splenium of the corpus callosum, which provide diffuse connections to the frontal and occipital lobes, respectively.
As predicted, significant decline was shown in both tracts, with the magnitude of decline in the genu exceeding that in the splenium. However, as discussed, the discrete binning of participants into young vs. old (Bennett et al., 2010), or young, middle-aged, and old (Salat et al., 2005), is insensitive to fine discrepancies in onset. Conversely, the data-driven detection of age bins performed by CForest revealed a 6-year difference in this onset for our data. That is, decline was shown later in the genu (43) than the splenium (37), despite the greater decline in the genu.
Studies confirming steeper decline in frontal white matter regions have generally considered this supporting evidence of the “first-in last-out” theory of white matter maturation (Raz, 2000). This theory posits that white matter decline during aging follows the reverse order of its development, through which frontal regions are the last to develop and the first to degrade (Lebel et al., 2008). Indeed, numerous frontal tracts showed increases until nearly 30 years of age, perhaps reflecting the final stages of development. However, while decline was found to be steeper in frontal tracts—at least for the corpus callosum—onset was not seen until significantly later.
Although the time frame of development and subsequent degradation may be tract dependent, a strict first-in last-out policy may not always apply. While a longitudinal study would be necessary to confirm this pattern of development, a larger selection of tracts in tandem with a voxelwise FA analysis may be a more feasible entry into a deeper investigation.
Conclusion
The present study used diffusion tensor MRI tractography to evaluate white matter integrity changes across the life span in a set of major long-range tracts, and how sex and handedness mediate these changes. The current study demonstrated that the CForest approach to data analysis yielded new insights into the age of onset and progression of FA decline in healthy aging. The results supported previous findings that FA decline varies by region, adhering to an anterior–posterior gradient of susceptibility. Furthermore, our functionally and anatomically clustered sets of tracts exhibited later life reductions coinciding with changes in cognition.
While sex did not emerge as a significant predictor of FA decline, handedness was found to moderate the onset of decline in a number of tracts, with strong right-handed individuals showing relatively preserved integrity up until ∼40 years of age. Finally, several tracts showed increases in integrity up to the late 30 sec that conventional methods may not have been sensitive to, suggesting continued white matter development during this time frame. Future work validating the Cforest technique should include assessing replicability of findings with different (and possibly larger) data sets, and the inclusion of other predictor variables.
Footnotes
Acknowledgments
We are grateful to the following people for their assistance in this study: Alexandria Muise-Hennessey, Kristen Higgins, Diane Waligura, Nicole White, Hazlin Zaini, Greg MacLean, Matt Rodgers, and Sara Sullivan.
Author Disclosure Statement
No competing financial interests exist.