
Abstract
Decreased cognition performance and impaired brain function are similar results of sleep deprivation (SD) and aging, according to mounted supporting evidence. Some investigators even proposed SD as a model of aging. However, few direct comparisons were ever explored between the effects of SD and aging by network module analysis with the resting-state functional magnetic resonance imaging. In this study, both within-module and between-module (BT) connectivities were calculated in the whole brain to describe a complete picture of brain networks' functional connectivity among three groups (young normal sleep, young SD, and old group). The results showed that the BT connectivities in subcortical and cerebellar networks were significantly declined in both the young SD group and old group. There were six other networks, that is, ventral attention, dorsal attention, default mode, auditory, cingulo-opercular, and memory retrieval networks, significantly influenced by aging. Therefore, we speculated that the effects of SD on the young group can be regarded as a simplified model of aging. Moreover, this provided a possible explanation, that is, the old were more tolerable for SD than the young. However, SD may not be a considerable model for aging when discussing the brain regions related to those SD-uninfluenced networks.
Introduction
A
Both SD and aging resulted in poor performance (Almklov et al., 2015; Blatter et al., 2006; Fostick et al., 2014; Harrison et al., 2000; Tucker et al., 2011). In the behavioral level, researchers suggested that SD in young adults may temporarily induce the same cognitive changes as in healthy old adults without sleep loss (Durmer and Dinges, 2005; Harrison et al., 2000), including psychomotor vigilance, working memory, and response inhibition. Psychomotor vigilance task, an alertness task, is influenced by sleep loss and free of aptitude and learning effects. Both SD and aging brought a significant increase in the reaction time (Blatter et al., 2006; Tucker et al., 2011). In the auditory temporal order judgment task, the thresholds of the young SD group and old group significantly increased in comparison to the young normal sleep group. Moreover, there was no significant difference between the young SD group and old group (Fostick et al., 2014). In addition, the performance of the young SD group was not significant by comparing with the middle-aged group (55–64 years), even with the old group (66–85 years) in working memory, meta-memory, verb generation to nouns, and response inhibition task (Harrison et al., 2000).
In addition to the changes of cognition and behavioral performance, aging and SD can induce similar changes in terms of neurotransmitter levels (Pace-Schott and Spencer, 2011). The loss of acetylcholine, dopamine, norepinephrine, and melatonin accompanied with aging and the production of these neurotransmitters also declined after sleep deprivation (Boonstra et al., 2007). Previous study suggests that these changed neurotransmitters contributed to accelerate the aging process, although there was rare direct evidence shown that decreased production of neurotransmitters was only related to sleep loss (Pace-Schott and Spencer, 2011). Furthermore, the areas of gray and white matter were also found to be decreased in both aging and SD groups. In gray matter volume, the prefrontal cortex and thalamic areas would be reduced with the process of aging (Pace-Schott and Spencer, 2011; Sullivan et al., 2004). The structural studies found that daytime sleepiness correlated negatively with gray matter volume in ventromedial prefrontal cortex, whereas chronic sleep deprivation reduced the thalamic area (Killgore et al., 2012; Liu et al., 2014a). Moreover, another study found that habitual sleeping was correlated positively with gray matter volume in the left medial prefrontal cortex (Weber et al., 2013). This evidence implied that sleep pressure and habitual sleeping interfered by sleep deprivation would reduce the volume of prefrontal cortex and thalamus. In white matter, both aging and SD could cause lesions in the corpus callosum, and other widespread regions also found to have lesions (Elvsashagen et al., 2015; Hedden and Gabrieli, 2004). The same change affected by aging and sleep loss in the physiological level could be a basic cause of the same performance in behavior.
In the functional neuroimaging level, recent task-related studies found that some regions, including medial frontal cortex, middle temporal gyrus, and subcortical regions (Chee et al., 2008; Li et al., 2015), were jointly affected by both SD and aging. These changed regions could be reflected in different large-scale brain networks, such as somatomotor network, dorsal attention network (DA), ventral attention, and default network (Li et al., 2015). In an age-related GO-NOGO task (Almklov et al., 2015), evidence revealed the consistency of blood oxygen level-dependent signal in left middle frontal gyrus, left postcentral gyrus, left anterior cingulate gyrus, right genual cingulate gyrus, left posterior cingulate, and precuneus between the young SD group and old normal sleep group. In addition, according to previous research on resting-state functional magnetic resonance imaging (fMRI), both SD and aging influenced the default network and DA (Gomez-Ramirez et al., 2015; Tsvetanov et al., 2016). All the evidence above showed that SD can be regarded as a model of aging and cause a temporary state of aging in young adults.
Interestingly, previous research found that healthy old adults were SD uninfluenced by comparing with young SD adults on cognitive tasks (Duffy et al., 2009). Specifically speaking, the results showed that healthy old adults performed better than young adults on maintaining alertness and sustaining wakefulness during sleep loss (Duffy et al., 2009). Some other studies also supported this statement (Adam et al., 2006; Blatter et al., 2006; Philip et al., 2004; Stenuit and Kerkhofs, 2005). However, the mechanism about how old adults deal with SD effects was not clear. One possible reason was that old people may have adapted to the effects that resemble the SD effects in some way.
Abundant task-related behavioral and fMRI studies focused on effects of SD and aging separately. However, few research directly compared the SD and aging effect by the resting-state fMRI. Resting state reflects a kind of baseline level of nervous activity and revealed whole-brain change among different people such as patients and the healthy (Zang et al., 2007), young and old adults (Geerligs et al., 2015). The advantages of resting-state fMRI study include the following: first, resting-state fMRI is a noninvasive and no task imaging method, and could find more pure and fundamental changes of spontaneous activity. Second, resting-state fMRI data could predict individual differences during task-related fMRI scan (Tavor et al., 2016). Since there was a great similarity between the effects of SD and aging on task-related behavioral and fMRI results, we inferred that it was possible to compare the two effects via the resting-state fMRI. Third, the sample size of previous studies was small (Almklov et al., 2015; Fostick et al., 2014; Harrison et al., 2000; Tucker et al., 2011), whereas the paradigms were various; thus, it was not easy to make a straightforward conclusion. On the contrary, our sample size of the SD group and old group collected from an open data set was big enough to derive a reliable result. Fourth, within-module (WI) and between-module (BT) connectivity was influenced by aging (Gu et al., 2015). And this novel analyzing method was rarely used in previous SD studies. Moreover, individual variation in network configuration implied differential vulnerability to cognitive abilities or deficits (Gu et al., 2015). The greatest similarity of SD effect and aging effect is ability-decline. It is reasonable to infer that WI and BT connectivity analysis is an effective method to distinguish groups of different states.
SD might be a potential acute aging model to evaluate the influence of long-term aging. We speculate that quite a number of similarities existed between SD and aging, but aging as a long-term irreversible nature with changes of body function in many aspects might affect a wider range of brain regions. So, more aging-related changes of brain networks may be observed. Meanwhile, for the common regions impacted by both effects, aging may show a more powerful influence on WI and BT connectivity. To our knowledge, we are the first to test the distinction between the effects of SD and aging on brain networks by resting-state fMRI. Armed with this idea, we investigated whether the networks influenced by SD were also influenced by aging.
Materials and Methods
Participants
Sixty healthy young volunteers (mean = 21.30 years, SD = 1.82, males = 35, age range: 18–26 years old, all right handed) participated in the experiment after providing informed consent. They did not have any history of psychiatric or neurological illness as confirmed by a clinical psychiatric assessment. All participants had normal or corrected to normal vision. According to the results of Pittsburgh Sleep Quality Index (PSQI), all volunteers had a good sleep habit and a normal sleep–wake rhythm with sleep duration of 7 ± 0.9 h for each night in the past 1 month. Also, the sleep habit of subjects had no fluctuations within 1 week before the beginning of the experiment. They abstained from caffeine and alcohol for 72 h before and during the entire course of the study. The criteria used for young adults matched that used in our previous SD studies (Liu et al., 2014b; Wang et al., 2015). The study was endorsed by the Ethics Committee of Southwest University, and all procedures involved were in accordance with the sixth revision of the Declaration of Helsinki. Old group was collected from the CoRR (Consortium for Reliability and Reproducibility) data set (Zuo et al., 2014) (the website is
Procedure
For the young group, volunteers visited the laboratory at the Southwest University three times. During their first visit, they were informed of the whole study procedure, and completed questionnaires about their mental health and sleep habits. Then, they were asked to adhere to their normal sleep habit until the end of the experiment, which was verified by a sleep diary. All the participants required to keep a sleep diary beginning 1 week before the formal experiment. This enabled volunteers to form a psychological contract relationship with our experiment. Volunteers returned to the laboratory weekly for two fMRI scan sessions, one after normal sleep and the other after SD. The order of the two sessions was counterbalanced across participants. All subjects in the young group had been sleep deprived (mean = 32.4 h, SD = 3.56).
Participants got up in the morning as usual on the experimental day. For the young normal sleep group, scans took place since 9 o'clock in the morning. For the young SD group, once arriving at the laboratory, participants were asked to wear an actigraph to monitor their sleep state from 08:00 on day 1 until 17:00 on day 2 to ensure enough hours of SD. In the morning, all participants were told not to nap during the entire process of the experiment. They were allowed only to engage in nonstrenuous activities, such as reading books or watching low-intensity videos. Furthermore, we had arranged some other experimenters to take turns to monitor their daily activities. These strategies were useful to keep the participants awake before their resting-state scan. All the volunteers had the right to give up the experiment at any time if they felt uncomfortable. Two participants quit the studies because of sleepiness. To ensure that participants stayed awake in the scanner, they were instructed to avoid sleeping and keep eyes open. The eye-monitoring device in the scanner room could monitor their eye movement. Participants with eyes closed longer than 10 sec were judged to microsleep and the current scan was stopped until the subject was awake again. In addition, participants were immediately addressed after every fMRI run via the intercom to ensure they stayed awake and did not move their head. If a subject fell asleep in the scanner, he or she could not hear our voice through the intercom. There were three participants excluded for failing to answer us immediately. Two subjects were excluded due to excessive (>2 mm) head motion during scanning. Finally, 53 healthy volunteers in total (mean = 21.23 years, SD = 1.82, males = 31, age range: 18–26 years old, all right handed) were included in the subsequent analyses.
Image acquisition
High-resolution T1-weighted structural images of the young group were acquired by using a 3-T Siemens Trio scanner. The 3D spoiled gradient recalled sequence used the following parameters: TR/TE = 8.5/3.4 ms, FOV = 240 × 240 mm2, flip angle = 12°, acquisition matrix = 512 × 512, and thickness = 1 mm with no gap. The high-resolution T1-weighted structural images provided an anatomical reference for the functional scans. Subsequently, 200 functional volumes of each resting-state fMRI were acquired by adopting an echo planar imaging (EPI) sequence with the following parameters: TR of 1500 ms, TE of 29 ms, flip angle of 90°, acquisition matrix of 64 × 64, in-plane resolution of 3.0 × 3.0 mm2, FOV of 192 × 192 mm2, axial slices of 25, and thickness of 1 mm with 0.5 mm gap. Head movements were minimized by using a cushioned head fixation device. No specific instructions were given except to relax and hold still. The detail parameters of CoRR data refer to its website (Zuo et al., 2014).
Preprocessing and module analysis
All data were mainly preprocessed with the SPM8 (
Statistical analysis
Taking SD as the within-subject factor and age as the between-subject factor, we conducted three contrasts: a paired sample t-test between the young SD group and young normal sleep group; two independent sample t-test between the old group and young normal sleep group, old group and SD group. We used permutation tests to deal with the multiple comparisons problem (Nichols and Holmes, 2002). Rather than compute the permutation distribution of the statistic for a particular network, we compute the permutation distribution of the maximal network statistic over all the 13 networks. In all the three contrasts, the Monte Carlo p-values were calculated on 5000 random partitions.
Results
Direct comparisons of functional connectivity
For the 3 conditions, 264 ROIs were organized into 13 modules, corresponding to 13 large-scale brain networks (Fig. 1). It was not obvious that the functional connectivity within a module was stronger than between modules (Fig. 2). The activity of nodes in WI could better represent the consistency and performance of activity than in BT (Tsvetanov et al., 2016); thus, the index of WI is much bigger than BT. The functional connectivity of BT would cancel each other out. In comparison to WI connectivity, BT connectivity was more susceptible to SD and aging (Tables 1 and 2). There were two significant networks, that is, SC and CB, influenced by SD in BT connectivity, but nonsignificantly influenced in WI connectivity. Moreover, there were six significant networks, that is, SC, CB, AD, MR, VA, and DA influenced by aging in BT connectivity, but only three significant networks, that is, CO, DM, and CB in WI connectivity.
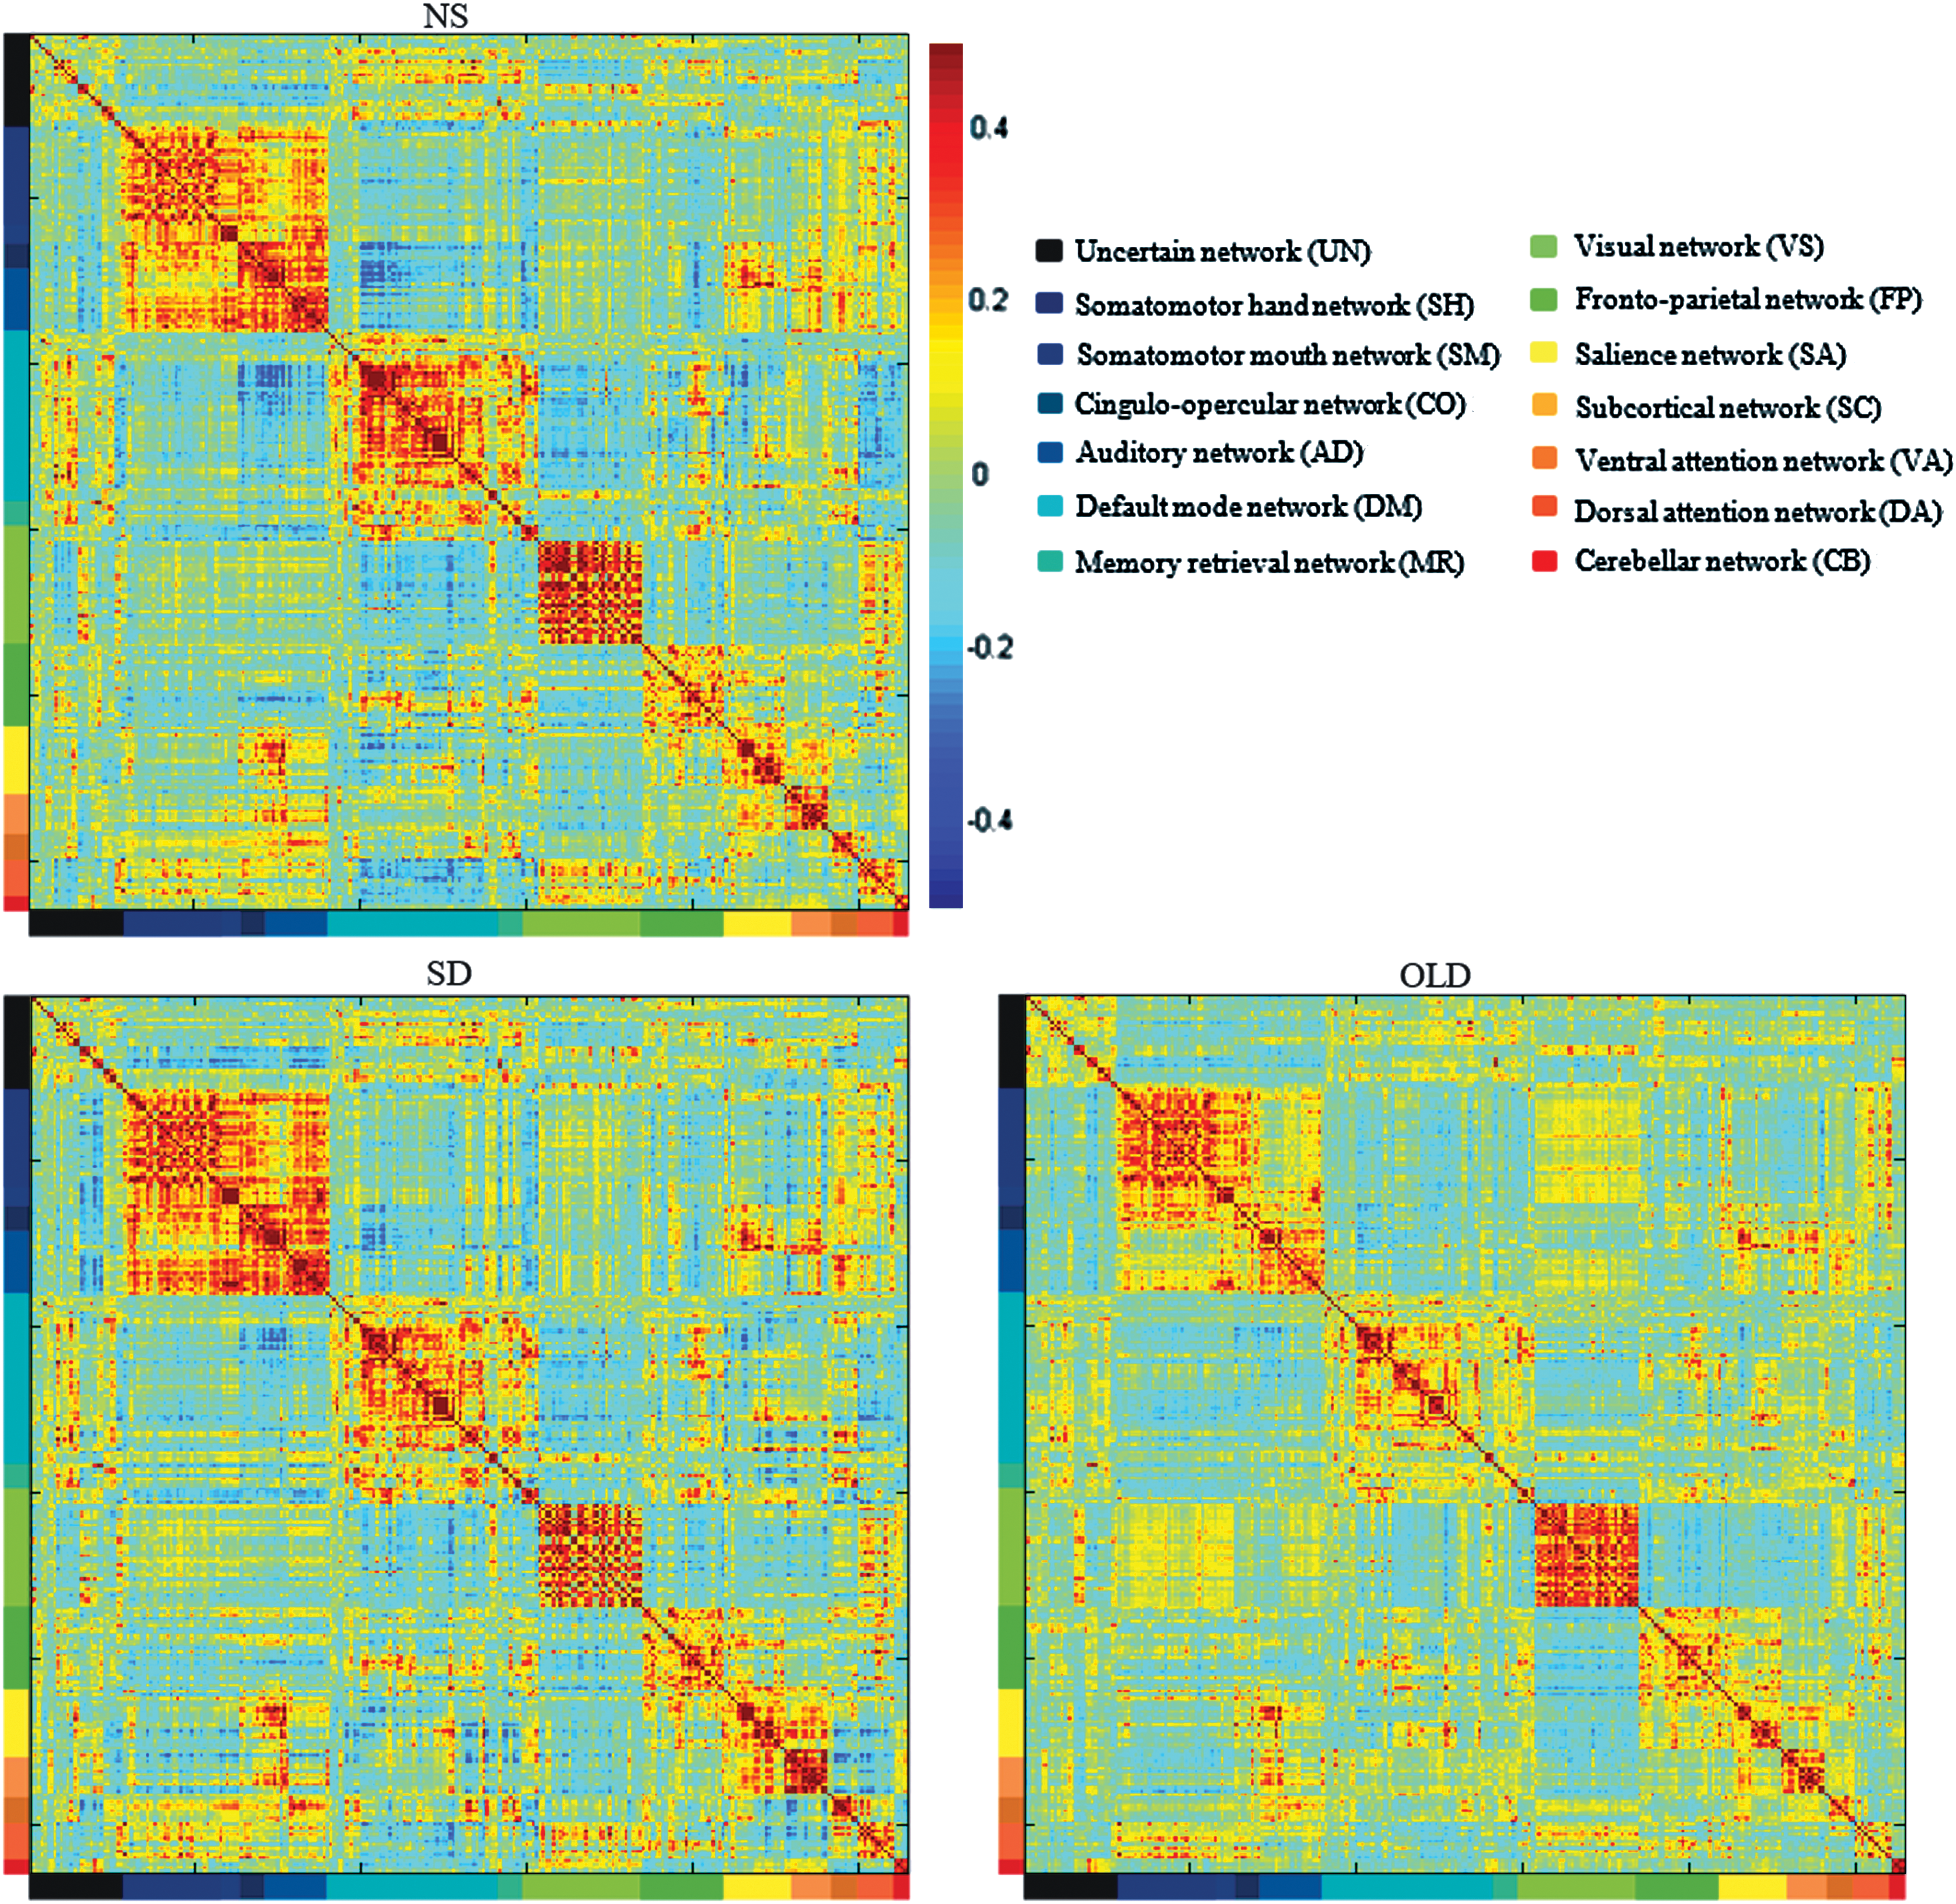
The mean correlation matrices without Fisher Z transformation for young normal sleep group (NS), young sleep deprived group (SD), and old group (OLD). The different colors in x-axis and y-axis corresponded to the 13 networks included UN, uncertain network; SH, somatomotor hand network; SM, somatomotor mouth network; CO, cingulo-opercular network; AD, auditory network; DM, default mode network; MR, memory retrieval network; VS, visual network; FP, frontoparietal network; SA, salience network; SC, subcortical network; VA, ventral attention network; DA, dorsal attention network; and CB, cerebellar network. The 264 ROIs cited from Power's work, and each entry indicated the mean functional connectivity between each pair of brain regions. The strength of functional connectivity was indicated with a color bar next to NS. Color images available online at
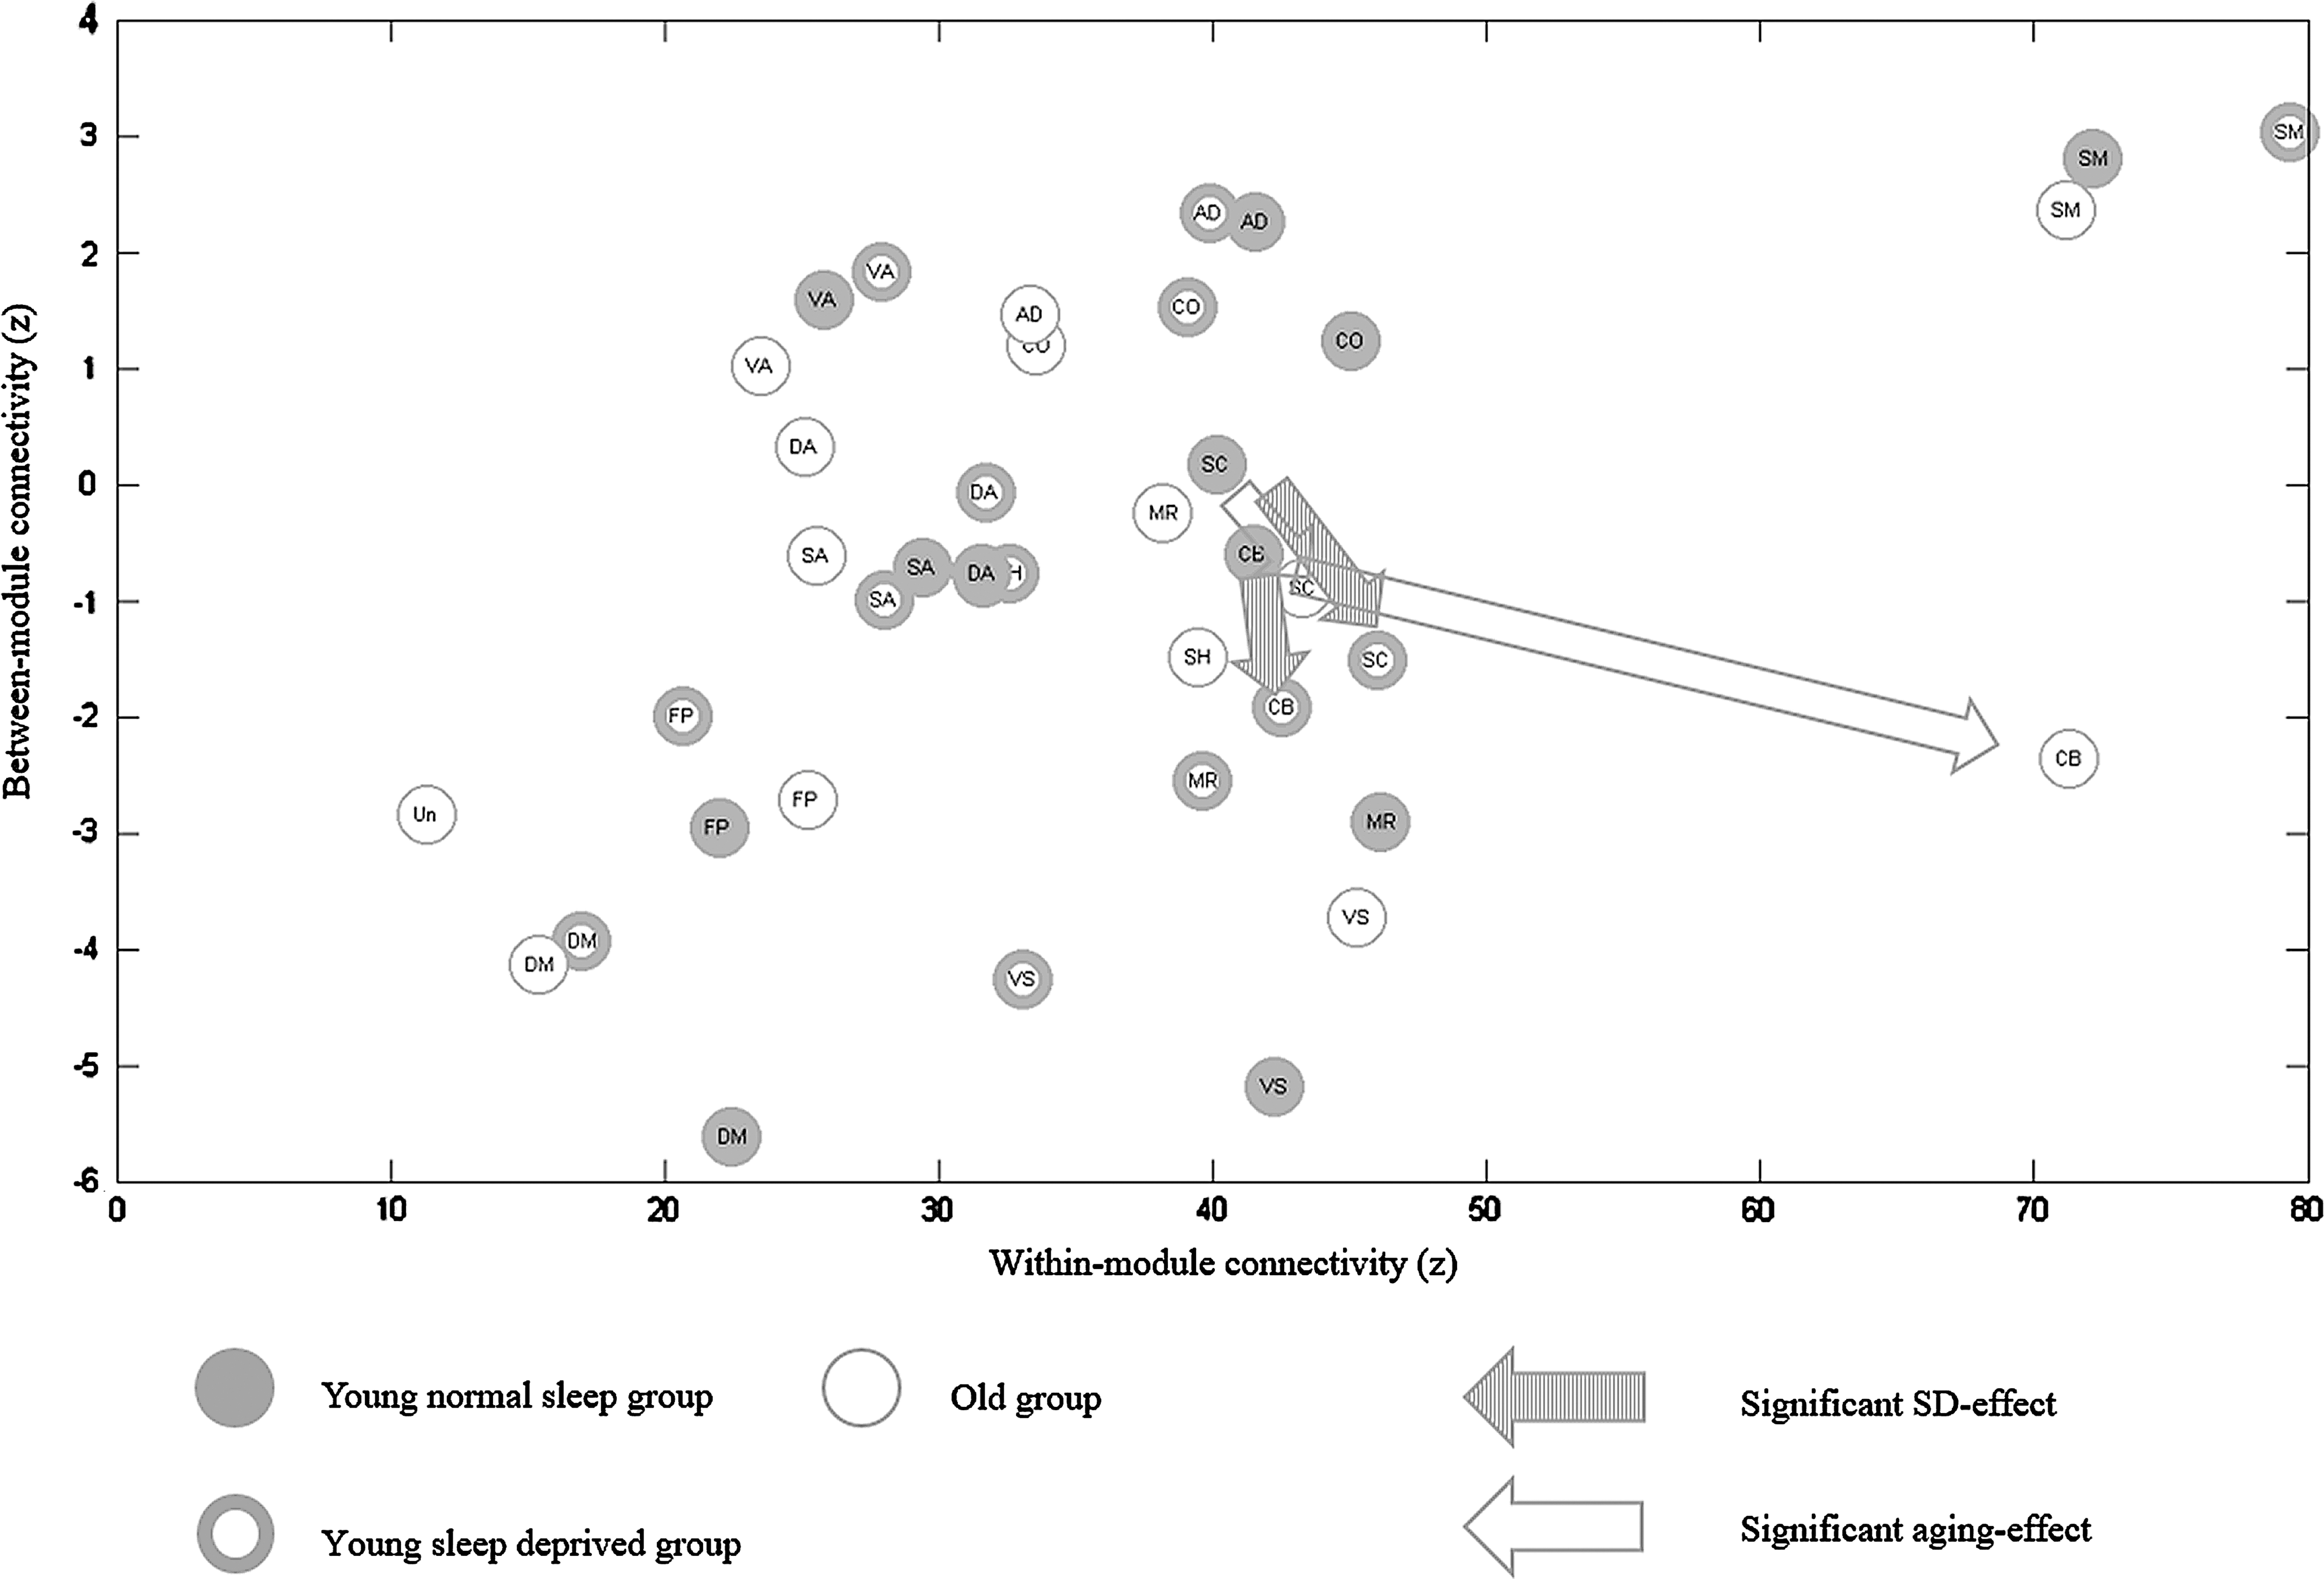
The normal sleep state of the young group is represented by filled circles, the SD state is represented by thick rings, and the old group is represented by thin rings. The x-axis and y-axis separately represent the within-network (r values are transformed by Fisher-Z). Different abbreviations represent separate networks as in Figure 1. Arrows indicate significant differences with p-values smaller than 0.05 in overlapped networks (striated arrows = effect of SD, blank arrows = effect of aging). The significant p-values for the plotted data are: For SC network, SD-NS: t = −4.52 p = 0.0001, OLD-NS: t = −3.04 p = 0.0394; For CB network, SD-NS: t = −4.26 p = 0.0005, OLD-NS: t = −4.21 p = 0.0006.
Statistical significance: 0.05*, 0.01**, with permutation test (5000 times) for multiple comparisons correction. Listed are the mean and standard deviation of 13 networks of each group given for all contrasts, significant or nonsignificant.
AD, auditory network; CB, cerebellar network; CO, cingulo-opercular network; DA, dorsal attention network; DM, default mode network; FP, frontoparietal network; MR, memory retrieval network; NS, normal sleep group; OLD, old group; SA, salience network; SC, subcortical network; SH, somatomotor hand network; SM, somatomotor mouth network; VA, ventral attention network; VS, visual network.
Statistical significance: 0.05*, 0.01**, 0.001***, with permutation test (5000 times) for multiple comparisons correction. Listed are the mean and standard deviation of 13 networks of each group given for all contrasts, significant or nonsignificant.
Brain module analysis
Complete results of three contrasts (contrast1 = SD-NS; contrast2 = OLD-NS; contrast3 = OLD-SD) are shown in Tables 1 and 2. The threshold was calculated based on the permutation procedure to correct the multiple testing. First, effects of SD were estimated. And the contrasts between normal sleep group and SD group were performed by a paired sample test. Compared to young normal sleep group, young SD group showed a significant decrease of BT connectivity in SC (t = −4.5169, p < 0.001) and CB (t = −4.2620, p < 0.01). Then, effects of aging were estimated. For old adults and young adults in normal sleep group, an independent sample test was performed. Compared to normal sleep group of young adults, old adults showed a significant decrease of WI connectivity in CO (t = −3.0462, p < 0.05) and DM (t = −3.3818, p < 0.01), and a significant increase in CB (t = 3.1318, p < 0.05). Moreover, old adults also showed a significantly decreased BT connectivity in AD (t = −3.9406, p < 0.001), CB (t = −4.2065, p < 0.001), SC (t = −3.0414, p < 0.05), and VA (t = −2.9739, p < 0.05), while a significant increase in BT connectivity in DA (t = 4.0764, p < 0.001) and MR (t = 7.9738, p < 0.001). Finally, an independent sample test was used to directly compare the young SD group and old adults group. Compared to the young SD group in BT connectivity, old adults showed a significant decrease in AD (t = −4.2350, p < 0.001) and VA (t = −4.0466, p < 0.001), and a significant increase in MR (t = 6.8285, p < 0.001). For WI connectivity, old adults showed a significant increase in CB (t = 3.0121, p < 0.05). The degree of changes in BT connectivity of network was greater than in WI connectivity of networks. It demonstrated that BT connectivity of networks was a more effective index to both the effects of SD and aging.
As illustrated in Figure 2, there were some overlapped networks, such as SC and CB, influenced by SD and aging. Furthermore, both SD and aging caused similar trends in the changes of BT connectivity. There, however, were some networks more easily affected by aging such as VA, DA, DM, AD, CO, and MR. The extent of differences between young normal sleep participants and old adults was greater than the extent between normal sleep group and SD group of young participants. The BT connectivity here represented a cooperation or competition relationship between one network and any other network. WI connectivity of low-order networks was stronger than high-order networks, evidenced from the SM to the DM and FP. The cause of high cooperation in low-order networks may result from their relatively single function.
Discussion
This study compared the brain module structure from young subjects (normal sleep and SD group) and old subjects to explore whether SD had similar effects as aging. First, the results showed that there were two networks, that is, SC and CB, influenced by both SD and aging. Because all of the SD-influenced networks were aging influenced, we speculated that sleep deprivation was a simplified version of aging. Second, there were six brain networks, DM, CO, VA, DA, AD, and MR, which were more easily influenced by aging than SD. Our results from large-scale brain networks suggested that there were some extended effects of aging when compared with sleep loss, although there was an overlap between them (Fig. 2). SD may not be an effective model for aging when discussing the brain regions related to these SD-uninfluenced networks.
Similarity between the effects of sleep deprivation and aging
Two networks, SC and CB, were influenced by SD and aging (the intersection region of thin and thick rings in Fig. 3). BT connectivity, reflecting an aggregate performance (cooperation or competition) of functional connectivity between a network and others, was a more effective index to both SD effect and aging effect, which appeared as a network-based global connective efficiency. Meanwhile, the change of SC and CB was consistent in that they both mainly occurred in BT connectivity with significant decrease in SD and aging group. In a large-sample (780 youth, aged 8–22 years) study from Gu and colleagues (2015), they found that BT connectivity was significantly modulated by the age factor during the development of cognition, and then, they hypothesized that BT connectivity could explain more individual differences than WI connectivity. In line with that, we found that the aging effect produced more differences in BT connectivity of networks. So did the effect of SD. Also, their connections with other brain regions were decreased. More importantly, the connection sign was negative, which implied that SD and aging made cerebellar and subcortical regions more competitive with other networks.
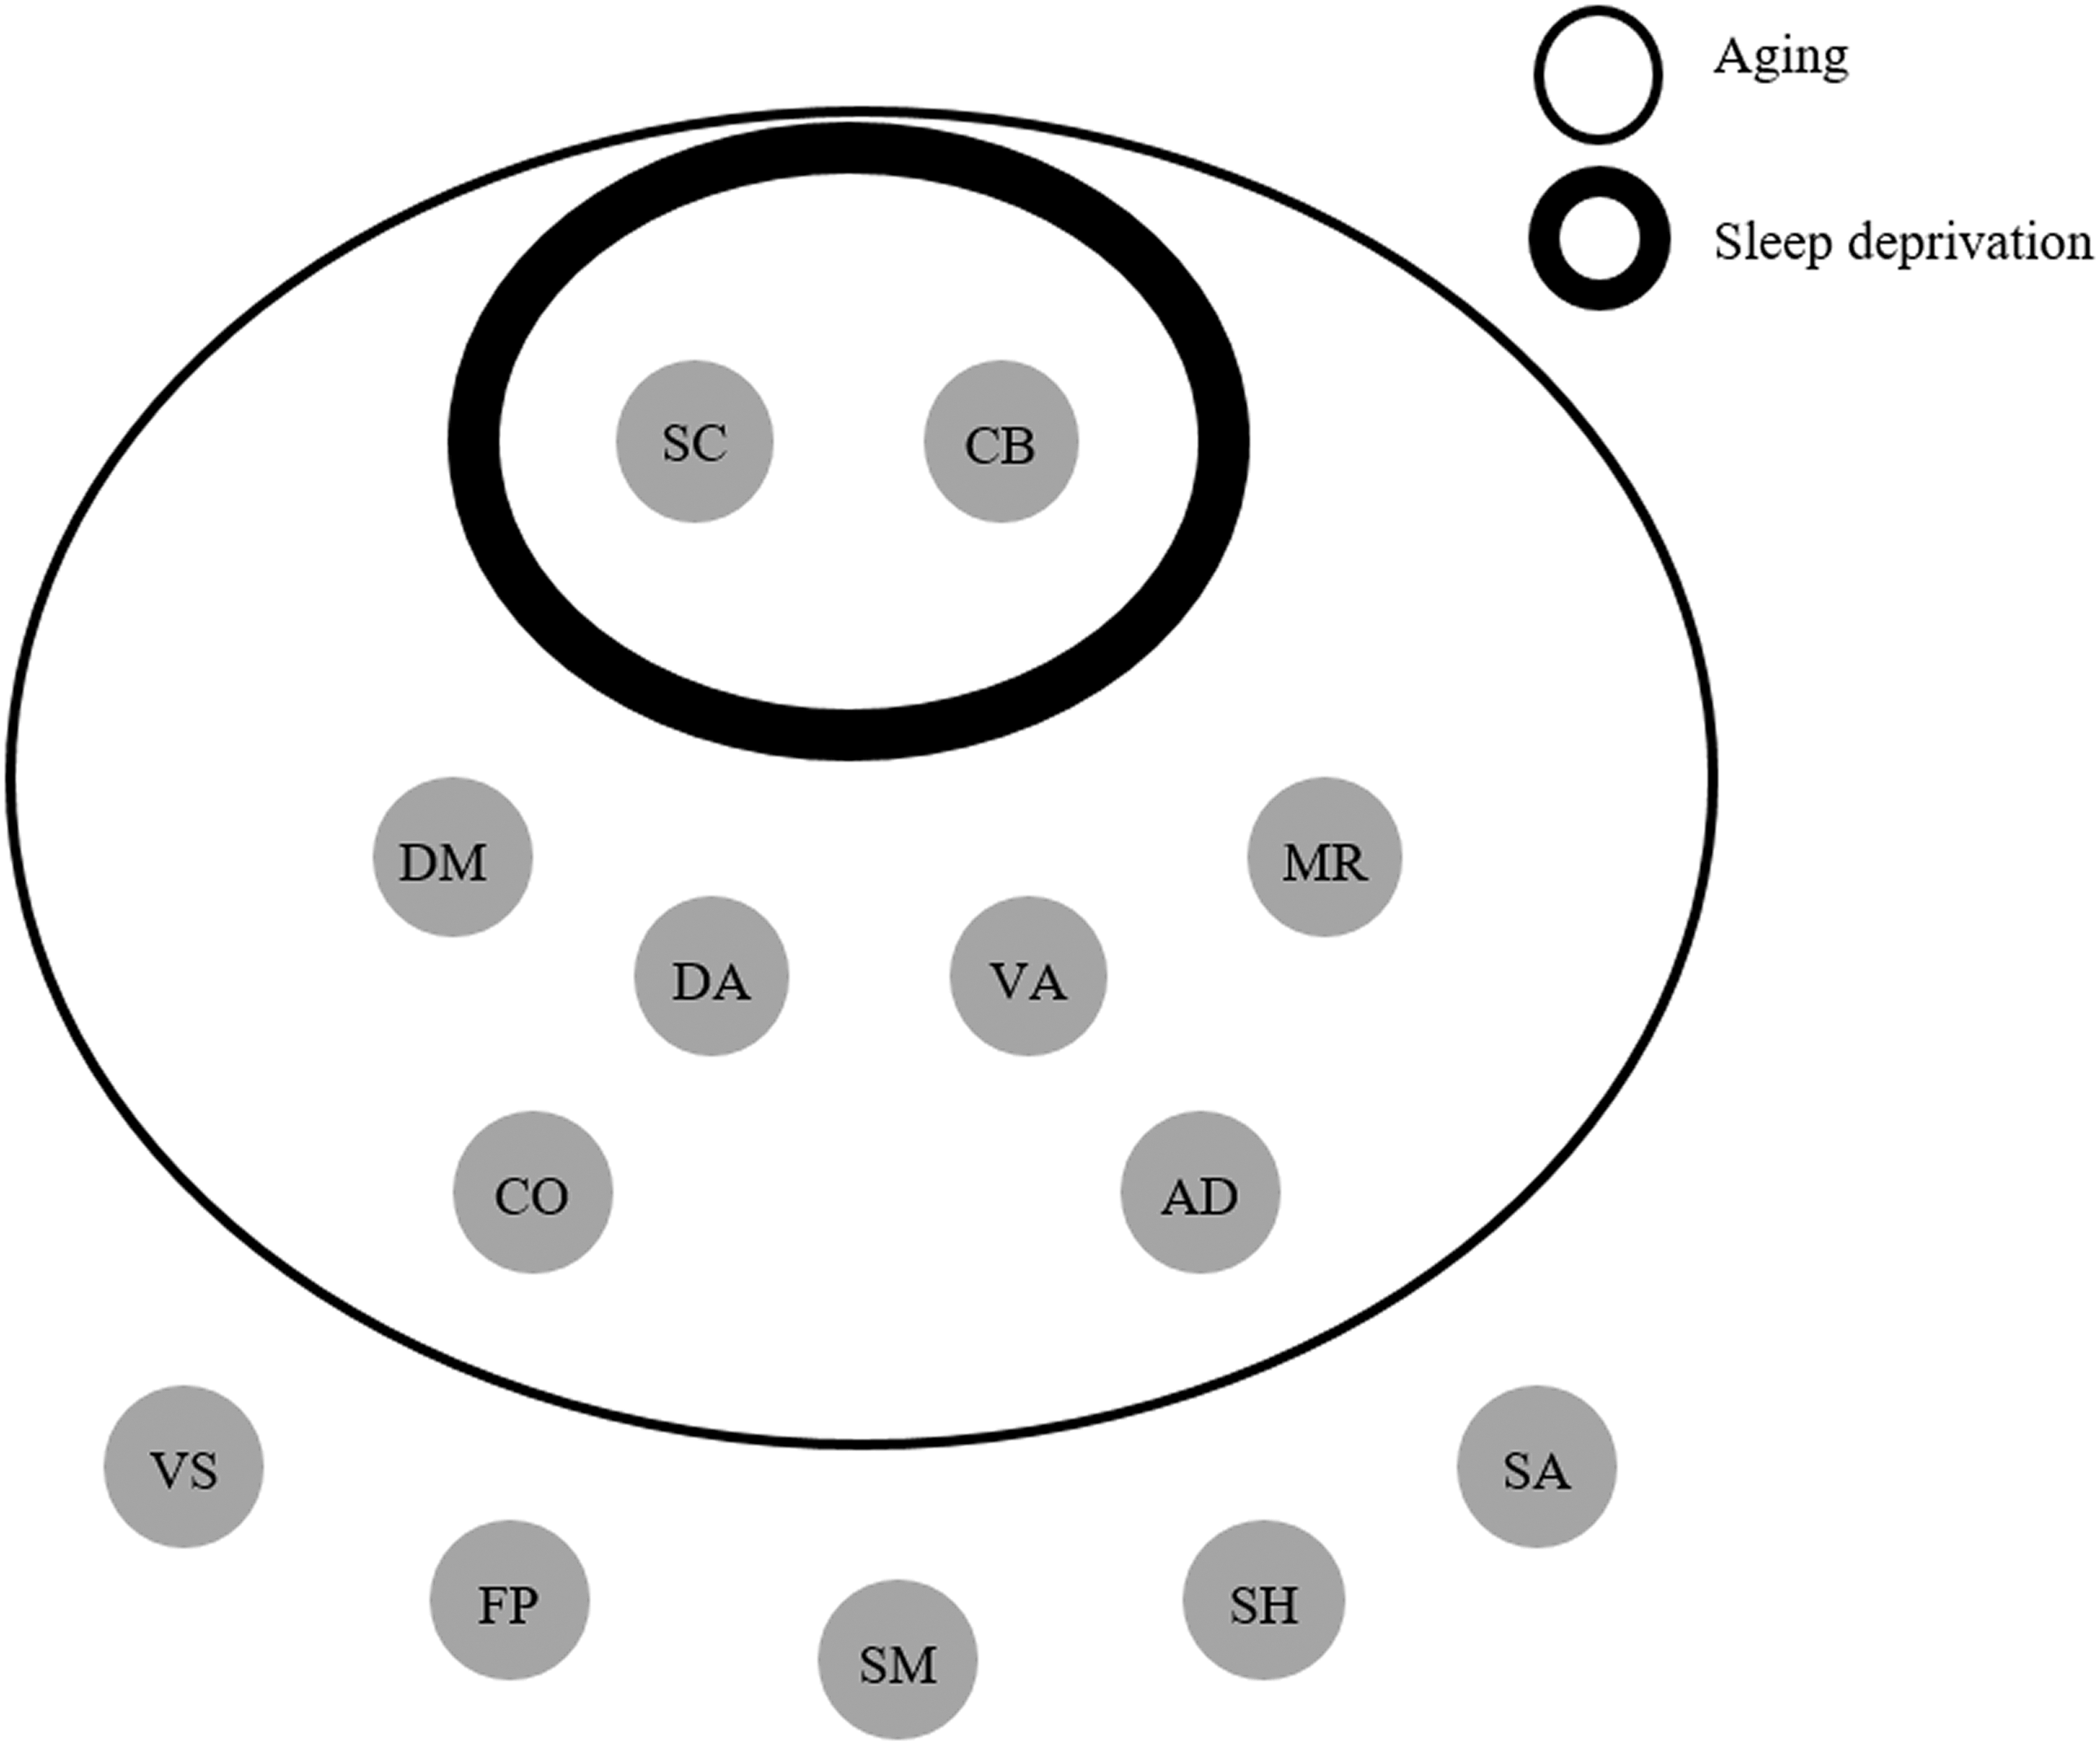
Networks separately affected by sleep deprivation and aging. The thin ring represents the networks affected by aging and the thick ring represents the networks affected by sleep deprivation. DA, SC, and CB are overlapped. VS is more sensitive to sleep deprivation than to aging. DM, CO, VA, AD, and MR are impacted by aging only.
In addition, previous studies also found that BT connectivities of CB were affected by SD (Kaufmann et al., 2016; Liu et al., 2015) and aging (Muller et al., 2016). These results suggested that CB needed to be paid more attention, especially on the connection with the neocortex (Muller et al., 2016; O'Callaghan et al., 2016). Negative changes or losses in functional connectivity between the cerebellar region and neocortex may be associated with Parkinson's disease, and this result was affected by cerebellar atrophy (O'Callaghan et al., 2016). Parkinson's disease is one of the well-known geriatric conditions, and this also prompted the possible relationship between aging and connectivity of cerebellar region with other regions. In addition, previous research found that lots of sleep problems existed in Parkinson's disease patients (Yong et al., 2011), such as short sleep time and frequent awakening. Thus, we speculated that sleep loss resulted in neural changes with the decreased changes of functional connectivity between the cerebellar region and whole brain, and those changes might be observed in acute SD and chronic sleep restriction. Those kind of similar changes in BT for aging and SD had made it possible to study aging by acute sleep loss. Meanwhile, old adults were confronted with chronically restricted sleep with problems of short sleep duration and frequent awakening (Altena et al., 2010). The changes in sleep structure of old people may be another explanation for this similarity between SD and aging, and thus, old people with short sleep time might have adapted to SD.
Our result was a little different from many studies that proved both SD and aging may influence the activation of SA and FP (Li et al., 2015). However, we should notice that the activation and connectivity were independent for their neural contribution (Xu et al., 2016). On the contrary, it was implied that the increased and decreased functional connectivity in networks canceled each other out, and thus it failed to show connectivity specialization in large-scale networks. Of course, all these results and conclusions were from a summary explanation. In these fields, SD effects were consistent with effects of aging. From this perspective, we can speculate that SD can make people old in a certain aspect of the brain networks. Nevertheless, the aging effect impacted the module of brain networks more deeply.
Brain networks specifically affected by aging
The age-related networks were widely distributed from low-order networks to high-order networks (Fig. 3), including VA, DA, DM, CO, AD, and MR. The VA composed of temporal–parietal junction and ventral frontal cortex, thought to be involved in exogenous, stimuli-driven, attention reorienting processing (Fox et al., 2006; Li et al., 2015). Age-related decreased and increased brain activation was found in different regions of VA (Li et al., 2015), and for the old adults, the VA was hypoactivated. This hypoactivation was consistent with our result of the decreased BT connectivity in VA, suggesting there were more deficits in bottom-up processing for old adults. Researchers also found that poor performance was associated with the relationship of DA and other networks among old subjects (Tsvetanov et al., 2016).
Other results were also compatible with the previous studies in normal healthy old adults, which showed a decrease in the functional connectivity in the DM (Gomez-Ramirez et al., 2015; Song et al., 2014). For the healthy old adults, DM was a highly susceptible system (Gomez-Ramirez et al., 2015). Lower DM activity was associated with better performance on attention-demanding tasks, and DM hyperactivity was related to rumination and depression (Whitfield-Gabrieli and Ford, 2012). Functional connectivity in the DM was also found to be weaker for healthy old adults than for young adults (Andrews-Hanna et al., 2007; Damoiseaux et al., 2008; Sambataro et al., 2010). Many age-related diseases, such as mild cognitive impairment and Alzheimer's disease, destroyed the function of DM with continuum decreases in DM functional connectivity (Dennis and Thompson, 2014; Gomez-Ramirez et al., 2015; Whitfield-Gabrieli and Ford, 2012).
CO is thought to be associated with cognitive control and maintaining alertness (Coste and Kleinschmidt, 2016; Sheffield et al., 2015). Furthermore, functional connectivity was significantly positively associated with cognitive performance (Sheffield et al., 2015). The decreased connectivity in CO was in line with previous studies by a brain-wide analysis approach in subjects aged from 18 to 85 (Geerligs et al., 2015; Meier et al., 2012).
The poor behavioral performance of memory and auditory perceptual processes, which were widely reported in previous studies (Fostick et al., 2014; Sala-Llonch et al., 2014), may be related to our findings of the changes in functional connectivity of MR and AD. Effect of aging, overall, is a brain-wide power to shape a new module of brain networks (Geerligs et al., 2015; Meier et al., 2012; Tsvetanov et al., 2016). In addition to focus on a specific network, it was important to explore the changes of the whole brain.
Sleep deprivation was a simplified version of aging
Generally speaking, the results of networks were in line with previous assumptions, suggesting the similar effects between aging and SD (Harrison et al., 2000). However, this similarity had its limitation. For example, Tucker and colleagues (2011) found that performance of the delayed letter recognition task and the psychomotor vigilance task was impaired by aging and SD as a whole. Nevertheless, when specific cognitive components were examined, the phenomenon of double dissociations was observed. Evidence suggested that SD and aging were similar on the model of SC and CB, but the effect of aging also impacted VA, DA, CO, DM, AD, and MR. SD might be regarded as a simplified version of aging. However, to take SD as a way to establish an aging model, researchers should concern these six networks.
Many old people are accompanied by sleep disturbance such as short sleep time, sleep fragmentation, earlier awakening, and insomnia. More and more old adults complain about sleep problems than any other age group. Furthermore, sleep disturbances such as sleep apnea and insomnia are known to be increased among old people (Ancoli-Israel and Cooke, 2005). Prior research found that chronic partial and acute total SD had similar consequences. For example, Durmer and Dinges (2005) found that 2 weeks of restriction to 6 h of sleep time per night was equivalent to the effect of one night total SD. Old adults are living in this state of short sleep for a long time. The reason of similarity between aging and SD, and the resistance to SD may be due to the chronic sleep loss in old adults.
Old adults tolerate sleep deprivation
A large number of studies had shown that compared with the young, the old adults were less affected by SD (Blatter et al., 2006; Philip et al., 2004). As listed above, there were similar impaired brain networks between aging and SD. An interesting phenomenon is that the old adults will perform the same or even better than young people after the same SD conduct, that is, old people had a stronger SD resistance. All brain networks (SC and CB in our study) influenced by SD were also influenced by aging. For SD in old adults, it was suitable to apply an overlapped rather than independent effect principle. We inferred that they had adapted to similar changes with SD effects. Moreover, we speculated that sleep loss was a factor that linked acute SD to aging, which is the cause of overlapped networks. In total, SD will not have much impact on old adults. As illustrated by our data, the changed networks shaped by SD were not beyond this range of aging. Therefore, in contrast to young adults, the old along with the growth of age had gradually adapted to the new changes. Compared to the young, changes of networks affected by aging were wider, meanwhile the networks will show the differences on resource mobilization. Thus, cognitive performance of the old after SD was better than the young SD adults (Adam et al., 2006; Blatter et al., 2006; Philip et al., 2004; Stenuit and Kerkhofs, 2005). In a recent brain imaging study, the results showed no significant interaction effect between aging and SD for any behavioral variable. Old adults had a lower proportion of false alarms and a slower hit response time across the night as opposed to young adults (Almklov et al., 2015). For fMRI data, a few differences in brain activation emerged between the groups (28 old adults and 28 young adults) after a normal sleep night. After SD, however, old subjects showed a pattern of greater brain activation when compared to young subjects, and compared to themselves after resting night. The aging brain system can transfer more resources to help old people to perform better as the young did (Almklov et al., 2015).
For young people, SD is regarded as a simplified version of aging, while for the old people, adaptation caused by the aging effect made SD effects to become relatively less. This assumption can explain the results of previous studies as to why the effects of SD and aging had not only similarities but also differences (Fostick et al., 2014; Harrison et al., 2000; Tucker et al., 2011), and it can further explain the effect of SD on the old adults. In individual difference, we thought that the extent of tolerance for SD may predict the extent of tolerance for aging.
Limitation
A few limitations of this study should be acknowledged. First, this work only considered the data of resting-state fMRI without other evidence of behavior and task-related fMRI experiments. Second, although the results of this article provided meaningful information, however, the lack of strict experimental design was still a problem. For exploring the effect of sleep deprivation on the aging process or the similarity between sleep deprivation and aging, a better design should be a longitudinal study. In the experimental condition, sleep loss (acute or chronic SD) should be taken as a factor to interfere in the young adults group via twice scanning, before normal sleep and after sleep loss. Several years later, researchers need to bring them back and take an fMRI scan again. Thus, the extent of individual difference would reach a comparatively small level. Third, the data of old group were collected from the open data set and the acquisition environment was inconsistent. Despite the fact that the sample size was larger, there were a lot of additional variables that were not controlled. Although we regress out these covariates of sites and scanning parameters, the statistical result was not affected. Finally, future research may examine anatomical images to find out whether changes in gray matter influence cerebral responses and thus modify the resistance of old adults to sleep loss.
Conclusions
To our knowledge, this is the first study to directly compare data among young sleep deprived group, young normal sleep group, and old adults from the perspective of large-scale brain networks. All the brain networks influenced by SD were also influenced by aging. SD made a trend that young brain networks seem old. Therefore, the population that often stays up late (i.e., night shift) needs to pay attention to it. For the two overlapped networks, we may predict cognitive ability during the aging process by acute SD intervention in young. Effects of aging, however, were much stronger than effects of acute SD and affected more extended networks. It was essential to develop a new method to predict the aging state. Then, the application of the conclusion of SD on chronic insomnia should be with caution. Few studies considered the aging effect in insomnia. Thus, the issue on the effects of sleep disturbances in different age groups could be examined in a future study using both behavioral and neuroimaging methods. This will help us better understand the effects of SD and aging.
Footnotes
Acknowledgments
We thank the 1000 Functional Connectomes Project, the researchers and institutions who uploaded and shared data (Zuo et al., ![]() ). This research was supported by grants from the National Nature Science Foundation of China (31571111) and Specialized Research Fund for the Doctoral Program of Higher Education of China (20120182120001).
). This research was supported by grants from the National Nature Science Foundation of China (31571111) and Specialized Research Fund for the Doctoral Program of Higher Education of China (20120182120001).
Author Disclosure statement
No competing financial interests exist.
References
Supplementary Material
Please find the following supplemental material available below.
For Open Access articles published under a Creative Commons License, all supplemental material carries the same license as the article it is associated with.
For non-Open Access articles published, all supplemental material carries a non-exclusive license, and permission requests for re-use of supplemental material or any part of supplemental material shall be sent directly to the copyright owner as specified in the copyright notice associated with the article.